Article

CO2 Emissions Resulting from Large-Scale Integration of Electric Vehicles Using a Macro Perspective

by
Fátima Monteiro
1,* and
Armando Sousa
2,3
1
Polytechnic Institute of Coimbra, Coimbra Institute of Engineering, 3045-093 Coimbra, Portugal
2
Faculty of Engineering, University of Porto, 4200-465 Porto, Portugal
3
INESC TEC—INESC Technology and Science, 4200-465 Porto, Portugal
*
Author to whom correspondence should be addressed.
Appl. Sci. 2024, 14(14), 6177; https://doi.org/10.3390/app14146177
Submission received: 30 June 2024 / Revised: 9 July 2024 / Accepted: 10 July 2024 / Published: 16 July 2024

Abstract

:
Smart grids with EVs have been proposed as a great contribution to sustainability. Considering environmental sustainability is of great importance to humanity, it is essential to assess whether electrical vehicles (EVs) actually contribute to improving it. The objectives of the present study are, from a macro (broad-scope) perspective, to identify the sources of emissions and to create a framework for the calculation of CO2 emissions resulting from large-scale EV use. The results show that V2G mode increases emissions and therefore reduces the benefits of using EVs. The results also show that in the best scenario (NC mode), an EV will have 32.7% less emissions, and in the worst case (V2G mode), it will have 25.6% more emissions than an internal combustion vehicle (ICV), meaning that sustainability improvement is not always ensured. The present study shows that considering a macro perspective is essential to estimate a more comprehensive value of emissions. The main contributions of this work are the creation of a framework for identifying the main contributions to CO2 emissions resulting from large-scale EV integration, and the calculation of estimated CO2 emissions from a macro perspective. These are important contributions to future studies in the area of smart grids and large-scale EV integration, for decision-makers as well as common citizens.

1. Background

Smart grids have been proposed and seen as a solution or major contribution to sustainability, which is why there has been a large investment in infrastructure [1] and research [2]. According to [3], there are many projects around the world that try to demonstrate the feasibility of practical implementation of smart grids and their advantages.
The term smart grid encompasses the use of communication systems, sensors, data processing, and computational processing [4,5], as well as automatic control [6] using the internet of things (IOT) and artificial intelligence (AI) in managing the electricity network [7].
According to Palensky and Kupzog [3], there are three main motivations for switching from traditional electrical networks to smart grids: the aging of traditional infrastructures; the need to promote sustainability in the face of the predictable increase in consumption; and the growing demands to increase safety and quality of service. For these authors, “Smart grids are expected to make our power system more resilient, ‘green’, and efficient”.
Implementing smart grids involves a large investment in new communication and information technology infrastructures, which translates into a very high cost due to the large size of the networks [3]. To justify the high investment required, it must bring great benefits that justify the costs. A reference and driving document for smart grids was published in 2008 by the USA Department of Energy [8]. This document describes that smart grids contribute to increasing sustainability, therefore contributing to climate objectives. In this sense, the document highlights that a “smarter grid works as an enabling mechanism for our economy, our environment and our future”.
One of the aspects of smart grids that has been the subject of much research and publication is how to manage the large-scale integration of electric vehicles (EVs) into the electrical energy system (EES) [9]. For some authors, the role of EVs in smart grids is vital, since “The integration of EVs with electrical grids is giving rise to the concept of smart grids” [2]. For simplicity, in the present study, it was considered that EV designates exclusively electric vehicles and plug-in hybrid electric vehicles.
The importance of EVs is mainly due to the need to reduce CO2 emissions, which should be reduced by 80% by 2050 [10] to safeguard environmental sustainability. The transport sector is responsible for emitting around one-quarter of European Union (EU) emissions [11]. As road transport is responsible for around 76% of emissions from the transport sector, it can be estimated that it is responsible for 19% of total CO2 emissions in the EU. Of road transport, 60.6% comprises domestic cars (light passenger transport with 1.6 passengers on average) [12]. Thus, cars were responsible for emissions of 369.8 MtCO2e (Metric tons of carbon dioxide equivalent) in 2022 in the EU, a fact that motivates the search for more sustainable options. For [13], EVs “offer zero-emission benefits and reduced reliance on fossil fuels” and are therefore considered fundamental to making transport sustainable.
The main objective of the development of EVs was also to eliminate the resulting air pollution [10] from internal combustion vehicles (ICVs), reducing the environmental impacts of transport [14]. When using electricity, and if it is produced by renewable sources, dependence on fossil fuels is also reduced [2]. Sultan, Aryal, and Chang [2] state that the “EV industry has been prominently used as a tool by countries to meet their carbon-footprint-reduction goals”.
But integrating EVs on a large scale can have a major impact on the energy system [15], which is why several researchers have sought to define the best options for their integration. If their connection to the grid is without any form of control, that is, if the EVs are connected and disconnected from the grid only by decision of their owner (when he/she considers charging necessary), studies [2,16] indicate that more losses will occur in the grid and there will be more congestion in conductors and transformers, thus increasing instability in the grid (EVs connect and disconnect from the grid in an unpredictable way), overloads, and the difficulty of managing the grid, and reducing the tension on the grid. All of this leads to a degradation in infrastructure and quality of service [2].
This mode of operation has the important advantage of allowing for freedom of use for EV owners [17] and requiring less infrastructure than other options. In this study, we call this operating mode NC (no control). In this way, EVs only serve the purpose of transportation and reducing air pollution. A big advantage is that batteries are only charged when necessary, minimizing wear [17], and therefore increasing their useful life, which causes fewer emissions and is more sustainable.
To avoid the various problems mentioned in NC mode, several researchers propose that owners should be encouraged or conditioned to charge their EV when it is most convenient for the EES [18]. The incentive can be implemented using electricity prices. If the conditioning has the intended effect on owners, some of the problems will be alleviated and EVs will have a positive effect on the grid, increasing the system’s load during off-peak hours. In this study, we call this mode of operation WCNC (with conditioning, but without control).
To solve the complex problems that the large-scale implementation of EVs poses to the EES, several researchers propose the use of EVs far beyond their transport function and also be used as system load regulation during off-peak hours. As EVs integrate batteries, they propose to use them for the benefit of the EES, temporarily storing excess energy at a certain time, which will be returned to the grid when it is needed [2]. This concept implies direct and centralized control of EVs and is called vehicle-to-grid (V2G), wherein EVs serve several other purposes, in addition to transport and pollution reduction objectives [2]. However, to achieve this, they must be connected to the grid whenever they are not in circulation. In this mode, a centralized and intelligent control system is required to manage loading/unloading [19]. According to [20], in V2G mode, it is not only possible to eliminate the problems resulting from charging EVs in NC operating mode, but several other advantages are made possible. The main advantages are [16] using EVs as auxiliary service providers; as an energy storage system (desirably renewable) or as a system load regulator during off-peak (charge) and peak hours (discharge); in voltage and frequency regulation; in addition to possible economic benefits resulting from the balance of the EV’s energy exchange with the grid (charging when the price is lower, and selling when it is higher). According to [21], this mode also can bring great economic benefits to grid operators. In this operating mode, all EVs are considered and managed as a virtual electricity production plant [22].
One of the disadvantages of the V2G operating mode is the fact that the control does not directly involve the EV owner when it is connected to the system, so “EV owners are quite reticent, as if there is an emergency they may not have autonomy in the vehicle to move around” [17]. This raises complex ethical questions, as the owner has no control over their EV and is not called upon to decide on the system’s actions.
Another disadvantage of V2G mode is the possible damage to EV batteries due to the successive and additional charging and discharging that this mode of operation involves [17,23]. This additional degradation can cause environmental impacts, causing additional CO2 emissions due to the degradation and additional replacement of batteries that this method may involve [17].
The main challenge of the V2G mode of operation is the need for a large investment in complex infrastructures to promote communication (and control) between system components; for data processing and storage; and for the flow of energy, which is intended to be bidirectional. Some communication, automation, control, and information infrastructures, as well as those associated with the power flow, will have to have specific characteristics and are still in the development phase.
Another mode of operation proposed in the literature is with charging control, but decentralized, which is called grid-to-vehicle (G2V). This avoids the problem of the EV owner not having control over the vehicle itself, as control and authority over the use of the vehicle remains with its owner [24], but in a partial way. As a consequence, it becomes difficult to use EVs as auxiliary services, in frequency control, or to regulate the load during off-peak hours. An increase in load during peak hours, overloads, or transformer temperatures [24] is also expected. The problems with this mode of operation result from the unpredictability of EVs (as a load) being connected to the grid and the grid not having full control over them, which increases the risk of line limits being exceeded.
In addition to the advantage regarding ownership of the EV, the G2V mode has the advantage of requiring less communication and control infrastructure, as only the analysis of system security issues is at stake (e.g., if any cable exceeds limits). However, with this mode, much of the added value derived from V2G mode is lost [24].
As environmental sustainability is the main advantage attributed to EVs [2], it is essential to highlight that they do, in fact, contribute to this objective compared to the solution of using ICVs.
Several documents studied state that EVs are more sustainable than ICVs, but they only refer to this as a fact or theoretical assumption [8]. Other documents only highlight the benefits considering only a micro-analysis dimension, that is, a small aspect associated with EVs, such as the battery or the converter. An example of a micro-analysis is to consider that, because EVs do not release exhaust gases, they are less polluting and have fewer CO2 emissions, and therefore, they are more sustainable [13]. This is a micro-analysis because it only takes into account a small aspect of the EV and does not take into account the whole (it focuses and draws conclusions about the whole from a micro-perspective). However, analyzing on a micro scale (limited to a specific and circumscribed aspect) does not allow for us to conclude on the global (macro scale).
Taking into account that the problem of environmental unsustainability is of great importance to humanity, it is essential to assess whether EVs actually contribute to improving environmental sustainability. Several studies focus on CO2 emissions in a micro way (centered on one aspect, such as emissions due to the life cycle of EVs [25] or emissions due to the communications infrastructure necessary for the implementation of a smart grid [26]). However, there is a gap in the literature on the CO2 emissions that globally can occur due to EV integration. The growth of EVs implies vast and complex impacts, so it is not easy to demonstrate that, from a global, macro-dimensional, broad-scope perspective, there is a substantial improvement in environmental sustainability, and more studies are needed to estimate the possible impact of EVs [2]. To achieve this, it is necessary to move from a micro view to a macro and comprehensive view of the impact of EVs. A micro view can be misleading, because it only allows for considering a part, instead of seeing the whole and its interactions.
Given the previous considerations, this research aims to be a contribution to the study of the global effects that large-scale EV integration can have on environmental sustainability, focusing on CO2 emissions.

2. Objectives and Methodology

The research question underlying this study is as follows: Is the large-scale use of EVs environmentally more sustainable than the use of ICVs?
To assess whether EVs will be more or less environmentally sustainable, it is necessary to take into account all the impacts (direct or indirect) that may occur on the overall system, including all of its life cycle. This implies a macro view (of the whole and its complex and comprehensive interactions), and not just the micro dimension (analyzing only a small, limited, simplified, and circumscribed aspect).
Environmental sustainability can be assessed/measured using various parameters such as ecological footprint or CO2 emissions. In this work, CO2 emissions were defined as the indicator of the level of environmental sustainability. This choice was based on the fact that CO2 emissions are a quantity that is easily converted from electrical energy and is frequently used in this area [27] and can translate the impact of new infrastructures that are needed [28].
To answer the research question, the following objectives were defined:
  • Identify sources of CO2 emissions and create a framework to facilitate the calculation of emissions associated with large-scale EV use, from a macro perspective;
  • Calculate CO2 emissions resulting from large-scale EV use, from a macro perspective using the developed framework;
  • Compare with the emissions of an ICV.
From a methodological point of view, and in order to achieve the intended objectives, the following steps were followed:
  • To create the framework:
    • A non-systematic bibliographical search was carried out, focusing on articles published in scientific journals on the ways of integrating EVs into the EES (the B-on and Google Scholar platforms were used).
    • From this research, the main characteristics and needs of each of the EV integration modes were identified.
    • In each mode, the main aspects that contribute to CO2 emissions were identified.
    • The identified information was systematized, and the framework was developed.
  • To calculate CO2 emissions:
    • Based on the developed framework, studies were identified that calculate partial emissions due to EVs (micro view).
    • Calculations were made to standardize the various studies and/or conversion calculations of identified impacts into CO2 emissions.
    • CO2 emissions were calculated from a macro (global) perspective, taking into account the structure of the framework developed and the various modes of EV integration.
  • The value of emissions obtained was compared with emissions from an ICV.
As described, the present study is based on other published studies that present partial and fragmented (micro-) analyses, using their results to build a macro and comprehensive view that allows for estimating the global impact of EVs on CO2 emissions.
The main contributions of this work are the following:
(i) The creation of a framework identifying the main contributions to CO2 emissions resulting from large-scale EV integration. This is a relevant contribution to future research that aims to analyze in a more complete and realistic way the impacts on the environmental sustainability of EVs.
(ii) The calculation of estimated CO2 emissions from a macro perspective, enabling a more adjusted assessment of the impact of large-scale EVs and a more realistic comparison with ICV emissions.

3. Results

The results are presented in three subsections: construction of the framework; emissions calculations from a macro perspective; comparison with emissions from an ICV.

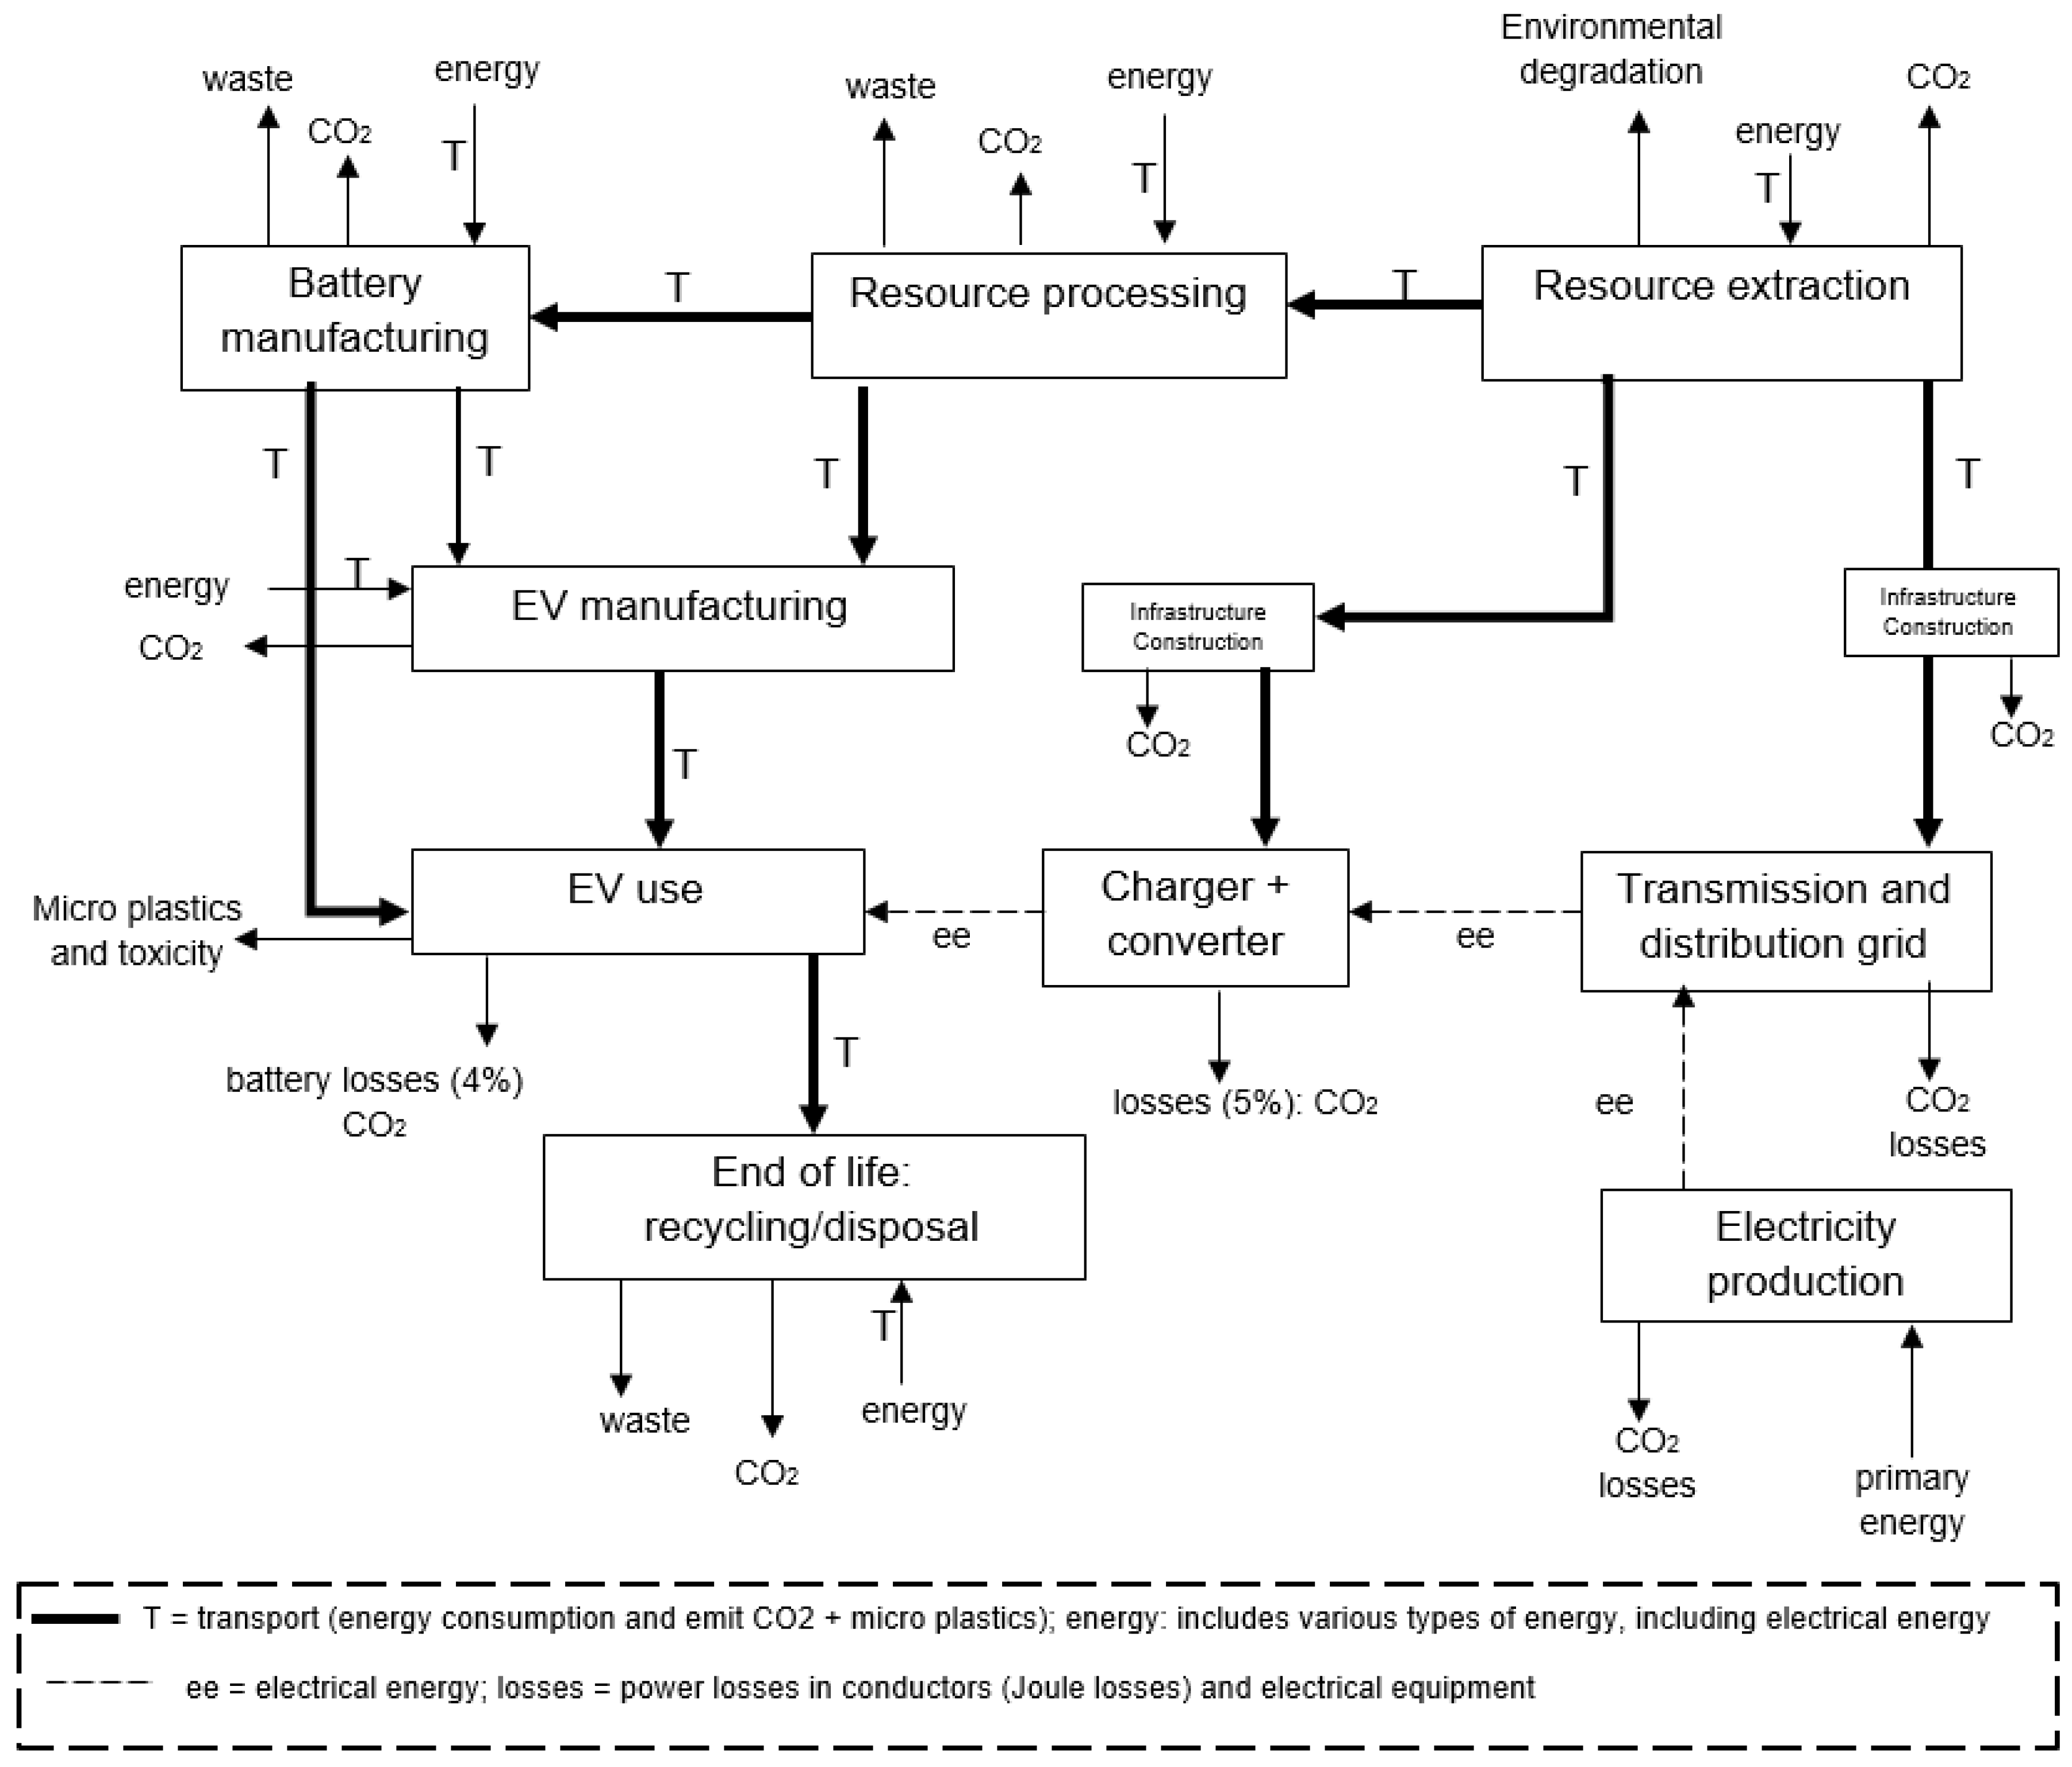
3.1. Framework Construction

The bibliographic research carried out (using the B-on and Google Scholar platforms) made it possible to study 46 publications; the ones listed in Table 1 have quantitative results on studies on CO2 emissions associated with EVs.
The bibliographic research carried out made it possible to identify the ways of integrating EVs into the EES that are proposed by scientific publications (only articles published in international scientific journals were considered). The synthesis of the main and different theoretical characteristics of each mode ([2,6,8,9,10,16,17,19,20,21,24,29]) is presented in Table 2. This synthesis focuses on the points that can contribute to CO2 emissions. The integration modes are briefly described in Section 1.
Many of the impacts of EV integration are indirect and difficult to quantify. However, the real impact of EVs on CO2 emissions can only be assessed if all contributions are taken into account, even indirect ones: this allows for us to move from a micro to a macro view. In this sense, based on the research carried out and Table 1, a framework was built, consisting of a graphical representation and a table, which highlight the emissions resulting from the use of EVs on a large scale, using NC or WCNC mode (Figure 1) and using G2V or V2G mode (Figure 2). This framework facilitates the calculation of global emissions, as it systematizes the main sources of emissions. The list is not exhaustive, as it does not detail, for example, the constituents of an EV, manufacturing time, etc., but it makes it easier to understand the complex and wide-ranging impacts that EVs can have and how they contribute to emissions.
The comparison between Figure 1 and Figure 2 shows that the NC and WCNC integration modes do not present emissions related to the communications, control, or data processing system. Although the items that make up the two images are similar for the various modes, the consumption or emission values are substantially different (the figures do not show the intensity, nor whether they are punctual or prolonged during the EV’s lifetime). For example, although the components in the figure are the same, in V2G mode, there is more need for telecommunication, control, and data processing/storage infrastructure, as well as more losses due to the bidirectional flow of energy than in G2V mode, in which there is about half of the loss, since there is only flow from the grid to the EV.
A macro view necessarily implies an analysis of the entire EV life cycle (from cradle to grave) but is not limited to this analysis. It also includes analyzing the impact of and on infrastructures that are necessary, but which are not directly linked to the EV (for example, telecommunications and data processing infrastructures, which are used to control charging), or that are not exclusively for EVs (for example, the electrical energy transport and distribution network). A macro analysis should also include these infrastructures to the extent that they are expanded or built due to the needs resulting from the existence of large-scale EV usage (for example, due to increased power due to EV charging), or if the existence of EVs causes additional impacts to them.
From the graphical representations (Figure 1 and Figure 2) a synthesis was constructed in the form of a table to define the main possible impacts that could lead to CO2 emissions due to EVs, from a macro perspective (Table 3).
Table 3 shows that there are several types of impacts, mainly in terms of energy consumption (including thermal and electrical energy), resource consumption, pollution production (for example, the release of microplastics due to tire wear), and/or environmental destruction (for example, due to the extraction of natural resources), and also the increased use of toxic components [29], which harms the health of humans. The present study focuses mainly on energy and resource consumption and does not account for the effects due to toxic components, nor the effects that a new technology (EV) has on human behaviors.
Table 3 presents the main impacts for the G2V or V2G mode, taking into account that in the V2G mode, there will be more diversity in impacts. In NC and WCNC mode, there are no impacts related to the large-scale telecommunications, control, automation, processing, and data storage system. Although the synthesis presented in Figure 1 and Figure 2 and Table 3 are very useful for evaluating the macro impact of large-scale EV use, some of the impacts are very difficult to calculate because they depend on existing infrastructure and distances, housing density, characteristics of energy production, transport network, existence of local natural resources, etc.; therefore, they depend from case to case.
The synthesis described in Figure 1 and Figure 2 and Table 3 is missing an important component of the impacts of large-scale EV use: it does not take into account the likely change in EV user behavior and only considers the standard behavior prior to the use of the new technology. As changing the behavior of EV owners or users can have a relevant effect on global emissions, it is necessary to study the possible effects of proposed technological changes on individual behavior [14] in order to assess the effects on global sustainability. However, this aspect was not considered in this framework or in this study, to simplify the analysis.

3.2. Calculation of CO2 Emissions

To calculate CO2 emissions considering a macro perspective and the use of EVs on a large scale, research was carried out to identify published studies (partial and fragmented studies) on the different possible impacts, and thus know the emissions estimated in them. Taking into account that the different studies identified presented results from different perspectives and focuses, it was necessary to convert and standardize the quantities and units in order to calculate a final value that could be compared with the emissions of an ICV (whose CO2 emissions already are extensively studied, as they have been on the market for a long time).
For the emissions calculation process, it was necessary to define base values for the calculation. To this end, values and data relating to the EU (EU average values) or values from EU countries were sought. Respecting the developed framework, to calculate the emissions (from a macro perspective) that result from the use of EVs on a large scale, the following partial sub-calculations were defined:
  • Calculation of emissions resulting from the life cycle of an EV (from cradle to grave):
    • Extraction of resources and their processing and transport;
    • EV manufacturing (including battery);
    • Electricity consumption for charging during use (including losses in the charging system);
    • Disposal and eventual recycling after end of life (EV and battery).
  • Calculation of emissions due to the installation and operation of large-scale telecommunications, control, automation, processing, and data storage infrastructures.
  • Calculation of emissions due to the installation of new infrastructure and operation of the electricity distribution network.
Since most of the available data relate to light vehicles, this study was limited to this group.
Smaller vehicles have fewer emissions considering life cycle analysis, regardless of whether they are electric or not. EVs have fewer emissions (over the entire life cycle) than an ICV if we use the EU electrical energy mix, but this does not happen for all vehicle ranges. Therefore, the value calculated in this study is an average value, which applies to mid-range vehicles.
I.
Calculation of emissions resulting from the life cycle of an EV.
To calculate the emissions associated with a given technology, it is necessary to use an appropriate methodology, such as life cycle analysis. This is the methodology that was used in the identified studies [25]. This methodology takes into account the emissions resulting from the processes of extraction, processing and transport of the necessary resources, the entire process and energy required for manufacturing, the energy required to use the vehicle in its circulation phase, and emissions from the production phase and recycling or disposal after end of life [29]. This methodology is quite complete and comprehensive, obtaining results that are good indicators of emissions associated with the life cycle [26].
However, in the case of EVs, disposal/recycling is a step that is not yet well known and studied because EVs are a recent technology, with no infrastructure or organized recycling/disposal system [23]. For this reason, it is not yet reliable to calculate the emissions associated with this stage of the EV life cycle, so any calculation of emissions will likely be an estimate below the real values because they believe it will be possible to recycle EVs.
Circulation/use is the longest phase of an EV’s life cycle and therefore it is very important to calculate the emissions associated with it. However, it is not always simple to calculate these emissions, because emissions during EV use depend greatly on the mix of electricity production used to charge the EV. If electricity from production using coal (for example) is used to fuel EVs, they will have more emissions than non-electric vehicles [30]. But if only wind production is used, an EV emits about 10% of the emissions of an ICV during circulation. In the present study, data on the EU’s electricity production mix were used.
To calculate the emissions resulting from the life cycle of an EV, it is necessary to define the duration of the useful life (circulation) of a vehicle, which is why the value of 150,000 km was used as defined in several other studies [25,29,32].
According to [30], EVs have more emissions during the production phase than ICVs, and will have similar emissions upon disposal, considering the eventual recycling of materials (although this is still under development for EVs). As there is large consumption of energy (including electricity) during the production of an EV, the corresponding emissions depend on the electricity production mix of the country in which the EV is produced. In the present study, it was considered that EVs are produced in the EU, and therefore their emission index associated with electricity production is used.
Manufacturing an EV can emit around 10 tCO2e/EV and manufacturing an ICV will emit around 5 tCO2e/ICV [25]. This results in 66.7 gCO2e/Km for an EV and 33.3 gCO2e/Km for an ICEV, due to manufacturing and considering 150,000 km as the vehicles’ useful life.
Using data from [29], relating to a study in the EU, the manufacture of an EV using 150,000 km as an indicator of the useful life of each vehicle, we will have emissions of 46 gCO2e/Km for EVs and 35 gCO2e/Km for ICVs (using an EU mix of 596 gCO2e/kWh) due to manufacturing.
Emissions due to the electricity consumption for charging (circulation phase) of an average EV is around 47 to 58% of the emissions related to the fossil fuel consumption of an ICV, which is 143 gCO2e/Km, according to [29]. Corresponding, therefore, from 60 to 76 gCO2e/Km, using the EU mix as a reference.
Adding the two components (manufacture and circulation), we will have the following:
  • For the worst case (sum of the highest emissions reported in the studies) we will have emissions of 142.7 gCO2e/Km for EVs and 178 gCO2e/Km for ICVs. In this case, EVs have 19.8% less emissions/km than ICVs.
  • For the best case (sum of the lowest emissions reported in the studies) we will have emissions of 106 gCO2e/Km for EVs and 176.3 gCO2e/Km for ICEVs. In this case, EVs have only 60% of ICV emissions, which corresponds to a reduction of around 40% in emissions.
However, the values in question consider the possibility of recycling at the end of the EV’s life, despite it does not yet exist, and the processes are not known in detail [23]. Therefore, it is possible that real emissions will increase compared to what is described in the studies, approaching, at best, 17 to 30% less emissions (life cycle) of an EV compared to an ICV [30]. The data used for the calculations and the results are summarized in Table 4.
The values obtained are compatible with the values obtained by [25] of 144.4 gCO2e/Km for a medium-sized EV, 166.6 gCO2e/Km for a large EV, and 194. 4 gCO2e/Km for luxury EV.
The life cycle analyses presented in [25,29,30] take into account the life cycle (from cradle to grave) but do not refer to emissions from infrastructures and in infrastructures during the use of EVs.
In the present study, infrastructures were divided into two groups: II—those associated with telecommunications, control, automation, and data processing and storage (using cradle-to-grave analysis); and another group (III) for distribution network installations (reinforcement/new infrastructure) associated with the increase in power consumed and network operation.
EVs require specific infrastructures to be charged [13], and their electricity consumption has an impact on emissions when using these infrastructures. In the present study, it was assumed that the impact of power infrastructures for EV charging has already been accounted for in the analysis of the EV life cycle and was therefore excluded from the following calculations.
II.
Emissions due to the installation and operation of large-scale telecommunications, control, automation, processing, and data storage infrastructures.
On the one hand, it is necessary to take into account the impact of infrastructure manufacturing (specific in time), and on the other hand, it is necessary to take into account the impact over time due to the flow of energy for charging EVs, and for their possible control. As stated [26], regarding the provision of EV charging: “In order to enable these functionalities, however, additional equipment has to be installed, which, on the other hand, will lead to increased electricity consumption and more e-waste”.
As the profile and quantity of infrastructure depends on the way EVs are interconnected in the network, it is necessary to analyze each of the modes proposed in the literature. As such, the information contained in Table 1 was used, which summarizes the theoretical characteristics of each of the integration modes referred to in point 1: NC, WCNC, V2G, and G2V. But, even excluding distribution network infrastructures (which will be dealt with separately in the next point), to make EV charging possible, new infrastructures will have to be installed in any case:
  • At least with cables, chargers, and meters for NC or WCNC mode. These components are almost all passive, meaning they have low active energy consumption. However, they cause additional Joule losses. It was considered that these were already included in the analysis of the life cycle of an EV.
  • In G2V mode, in addition to cables, chargers, and meters, it is also necessary to install cables and communications equipment and a certain level of processing with artificial intelligence (AI) to make decisions about the most appropriate option for the network, managing loads and priorities. Thus, in this mode, there is active consumption of some equipment (communications and processing), and losses in cables and equipment.
  • In V2G mode, there is a large increase in the necessary infrastructure [19] On the one hand, all EVs must be connected to the grid whenever they are parked, which implies having more grid connection infrastructures than the number of EVs, so that each EV can be connected at different locations. Vehicles are parked most of the time, but in different locations (e.g., at home at night, and at the workplace during the day or in a commercial area) [17]. This mode needs many more cables, chargers, and meters; it is also necessary to install many more cables and much more communication equipment and equipment dedicated to processing with AI and IOT to make decisions about the most suitable option for the network, for the loads and the priorities, as well as for large-scale data storage. Because there is more infrastructure and communication, in V2G mode, there will be more losses in cables and more active energy consumption in communication, processing, and storage equipment.
Only in the cases of NC and WCNC modes is no relevant communications infrastructure required. For G2V and V2G modes, it is necessary to create a smart grid with a communications component, which will be larger in V2G mode.
To study emissions due to communications, counting, and data processing infrastructures, it was considered that in G2V mode, the needs are equivalent to those required to implement a smart grid/smart metering.
According to [26], the environmental impact of communication and information technologies to implement smart metering infrastructures (considering the entire life cycle and excluding infrastructures in homes) will be a loss of 6.8 to 14.3 PJ of exergy for 20 years, considering the city of Vienna (Austria). Around 33% of these values correspond to electrical energy consumption over time of use.
If local communication and monitoring networks that include homes are added, there is an increase of 63%, which means that after 20 years, networks in homes correspond to values between 11.1 PJ and 23.3 PJ of exergy destroyed.
Exergy is defined as the maximum amount of useful work that can be obtained from a system [27], meaning it is the part of the energy used that is available to produce useful work. The analysis of the exergy efficiency of a system reflects its sustainability or environmental impact [33,34]. Thus, a direct relationship can be established between the exergy destroyed in a process and its CO2 emissions [34,35].
The study by [26] considered the period from 2020 to 2040 and the city of Vienna, with a number of inhabited dwellings of 977,875.5 on average. In the study, they considered two inhabitants on average per dwelling. This study can be a good reference for calculating the emissions associated with the communications and metering infrastructures required for the G2V mode, since this mode of operation requires this type of infrastructure and approximate level of processing. For V2G mode, the type of infrastructure required will be even higher than that recorded in the study by [26]. In NC and WCNC mode, no relevant communications infrastructure is required.
According to the EU, there are less than 300 vehicles per 1000 inhabitants in the city of Vienna [36], but on average, there are 530 vehicles per 1000 inhabitants in the EU [37]. Therefore, it was decided to use the EU average value to calculate emissions per vehicle, considering that, on average, the impacts in an EU city will be approximately proportional to those obtained for Vienna. For this study, the scenario was considered in which 50% of the vehicles in a city are EVs. Per week, in Portugal and on average, cars travel between 50 and 200 km, and 9000 km per year [32], resulting in around 25 to 30 km/day; therefore, these reference values were considered for the present study.
According to the study by [26], on average, exergy consumption is from 0.554 PJ (1.539 × 10⁸ kWh) to 1.165 PJ (3.236 × 10⁸ kWh) per year, for the entire city. Considering an average of 530 vehicles per 1000 inhabitants (we consider the average value of 1,955,751 inhabitants and that 50% of vehicles are EVs), we obtain 518,274 EVs, which corresponds to between 296.94 kWh/EV and 624.38 kWh/EV and per year. Using the EU mix of 596 gCO2e/kWh (in coherence with the calculations in the previous point), we obtain between 176,980.52 and 372,130.56 gCO2e per EV and per year. Considering an average circulation of each vehicle of 9000 km per year [32], emissions between 19.66 gCO2e/km and 41.35 gCO2e/km are obtained due to communications and metering infrastructures.
These values only consider the basic infrastructure of a smart grid/smart metering, considering one interconnection/control point per EV (considering that it will usually be connected with charging control at night and close to the home). It can be considered that these values are a reasonable approximation in the case of G2V mode, but in V2G mode, the network will have to be larger and more complex. This is due to the fact that in this mode, EVs must be connected to the grid whenever they are not in circulation, therefore both during the day and at night, and both near the home and in professional or public places.
Therefore, for V2G mode, it was considered that there will be two interconnection and control points for each EV, and therefore more communications infrastructure is needed. In this mode, much more processing is also required, as there is more complexity in data management and algorithms, and a greater quantity of data to store. For all these reasons, in this study, it was considered necessary to approximately double the amount of smart metering infrastructure and its consumption over time. It was considered that there is no relevant change in the infrastructure in the homes. Thus, the total exergy that is consumed becomes 17.9 PJ to 37.6 PJ for 20 years in V2G mode. This value results in 5.32 × 10⁻² kWh/km at 0.1119 kWh/km. Using the EU mix (596 gCO2e/kWh), emissions of 31.68 gCO2e/km to 66.69 gCO2e/km for V2G mode are obtained.
Table 5 presents the summary of the emissions calculations made up to this point and the calculation of the total (partial) without the contribution of impacts on the distribution network.
These results show that V2G mode increases CO2 emissions and therefore reduces the benefits of using EVs. V2G mode infrastructures can be used for various purposes, including controlling EV charging and discharging, using EV batteries as energy storage, and auxiliary services. This may lead to the assumption that emissions from communications, measurement, and processing infrastructures should not be affected by EVs; however, for the G2V or V2G mode to work, the infrastructures must exist, so they are affected by EVs in these integration modes. These two modes emerged in response to the problems that EVs in NC mode can cause in the functioning of the energy system, which is why they are attributable to EVs. Furthermore, there are studies that indicate that the use of EVs, for example, for energy storage, is not the cheapest option, nor the most efficient, and therefore will not be the most sustainable either [38].
Another question that can be raised regards V2G mode’s implication that the EV batteries would need to be oversized compared to the autonomy that the EV needs; otherwise, they would not be able to serve as temporary energy storage. As batteries are the main source of CO2 emissions during the manufacturing phase and at the end of life, the [30] recommends that they be as small and adjusted as possible for the desired autonomy. According to this recommendation, it is not expected that there will be much scope for storage, unless owners accept that their EV’s charging will be used to satisfy grid needs rather than guarantee the EV’s autonomy. However, owners are not very receptive to losing control of their EV [32].
If EV batteries are oversized, then manufacturing emissions will be greatly increased, as the battery is responsible for 31 to 46% of the manufacturing emissions of each EV and 14 to 23% of end-of-life emissions [25]. Batteries also have losses during their use that contribute 4% to EV emissions in the circulation phase. Globally, batteries are responsible for 13 to 22% of an EV’s life cycle emissions [25]. If the battery increases, the weight that the EV will have to support also increases, which implies an additional consumption [39] of 5.6 Wh/km per additional 100 kg [25]. Therefore, increasing batteries will have an impact on global EV emissions. Given this, the EU recommends that manufacturers be encouraged to reduce the size of batteries to what is strictly necessary [30]. This indication makes it difficult to use EVs in V2G mode, because it limits the capacity of the batteries to function in a relevant way to temporarily store energy with the aim of returning it to the grid.
III.
Calculation of emissions due to the operation of the electricity distribution network.
One of the problems with the most studies on different EV interconnection modes is that “these models often lack the ability to take the network infrastructure at lower voltage levels into account. The models assume that the infrastructure is strong enough to supply the EV demand.” [24] (p. 5). However, several studies indicate that large-scale EV integration will require the need for new infrastructure in the distribution network, as congestion leads to the need to expand or create new infrastructure [28].
An important consequence of the increase in EV usage for all interconnection modes is the increase in network losses. This problem will occur in the transport network when power comes from plants (whether renewable or not) that are located outside large centers. And it will always occur in the distribution network, since it will be this network that most EVs will be connected to.
For NC and WCNC modes, prioritizing the connection of EVs at night can help mitigate the problem of congestion in the distribution network, since during this period, there is less power flow, and thus it is more likely that additional power flow of EVs can minimize the need for new infrastructure. However, it also implies additional losses in the network that would not exist if EVs were not used.
Enabling charging from local renewable sources (solar, for example) and on an isolated island also reduces losses, since production and consumption is local [17]. But this option can only charge a small number of vehicles and may not always be available.
Charging an EV allows (on average) for traveling 380 km with a consumption of 50 kWh, and charging the battery takes at least 30 min to obtain 80% of its value [13]. In regular charging mode, it will take 8 to 12 h to fully charge the battery.
The infrastructure required for fast charging is very important for long journeys, and there must be charging stations at least every 20 km throughout the country [31], which implies a vast network and, as such, high cable losses due to high current and distance.
The study carried out by [15] based on an urban network—considering 51% of EVs compared to the total number of vehicles, 90% of EVs charging at night and 35% during the day, and 10% of EVs operating in V2G mode during peak hours—indicates the following:
  • The increase (necessary due to EVs) in investment in reinforcing the installation or new installations in the distribution network, mainly in cables and protection equipment (does not include installations for charging EVs), will be around 14% for the scenario of 51% EVs (with simultaneity factor of 1). But this value could rise to around 19% if the scenario is 62% EVs. These values are due to the increase in consumption during peak hours.
  • The option for 95% of EVs to be charged during off-peak hours (95% in normal charging and 5% in fast charging) was the limit found for the network without the need for additional investment due to congestion during off-peak hours. This indicates that shifting all charging to off-peak hours may not be the best option, as it will also result in congestion and, therefore, the need for investment in the network.
  • Distributing loads throughout the day (reducing the simultaneity factor) reduces the need for investment in the distribution network to 28.6% of the value with simultaneity factor 1 (51% EVs scenario). However, this option implies investments in infrastructure and telecommunications network and data processing and automation and control systems, which were not accounted for the study.
  • Joule losses in the distribution network will increase by around 13% in peak hours and by around 26% in off-peak hours for 51% EVs but will be 40% for 62% EVs. This increase in losses is due to the 16% increase in load during off-peak hours for a scenario of 62% EVs.
According to [5], the increase in load could be even greater: “Adding one or two EVs to every household with level 2 charging in a wealthy neighborhood could effectively increase the demand and load for electricity by 150%”.
To calculate CO2 emissions resulting from the increase in losses in the distribution network resulting from EV consumption, data on electricity consumption in the city of Vienna (on which the previous calculations were made) and average losses in the distribution network in the EU were considered. In this study, it was considered that EES infrastructures in the EU have similar characteristics. In this way, it is possible to use Vienna and EU data as guidance for the order of magnitude of losses and respective emissions, although it is recognized that it is not an exact calculation, since the exact value depends from country to country, and from network to network.
According to [40], the majority of Joule losses in EES cables occur in the distribution network and are responsible for 97% of global CO2 emissions from EES activities. There are also emissions due to the manufacture of cables and other infrastructures; however, they only correspond to around 3% of total emissions, which is why they will be ignored in this study.
Considering the study by [41], on average, a distribution network will have 5.54% technical losses. This value is compatible with that mentioned in the study by [42], which states that “most utilities (…), which ranges from 4 to 13%” of losses depending on total power. In the study by [43], the power losses in the studied network are around 11% for peak hours.
According to [44], in 2014, the EU average of electrical energy losses in transport and distribution networks was around 6.5% of total power. Portugal was one of the countries with the highest losses, which amounted to 10%.
The overall electrical energy consumption of the city of Vienna in 2016 [45] was 8.162 TWh. Using the EU average loss value (6.5%), the additional value of losses due to EVs for the city of Vienna was calculated, taking into account the 50% EVs scenario (10% of which in V2G mode). For this, the average increase in losses for off-peak and peak hours was used according to [15], which resulted in an annual value (using 2016 as a base case) of over 103.45 GWh of losses for 1 year. Using the expected number of EVs (scenario with 50% EVs) we obtained 199.611 kWh/EV. Using 9000 km as the average annual circulation results in 2.22 × 10⁻² kWh/km. Applying the EU mix, we obtain emissions of 13.22 gCO2e/km. It was considered that this value of additional losses would also apply to the G2V case, since in the study [15] that was used as a reference, only 10% of the EVs were in V2G mode.
Taking into account the results obtained, Table 5 presents the summary of all partial calculations and the total calculation of emissions depending on the EV integration mode. Taking into account the studies by [25,29], the emissions from an ICV are presented in Table 6.
The calculation of losses in the grid was considered similar for all interconnection modes, although it is expected that the V2G mode will have a greater impact due to the increase in power flow (bidirectional). However, as the data used only considered 10% of EV for this purpose, in this study it was considered that the value did not increase significantly compared to other modes. This will no longer be acceptable if the percentage of EVs operating in V2G mode is high.
For NC and WCNC modes, emissions due to manufacturing, charging and losses in the distribution grid are considered, resulting in a total of 119.22 gCO2e/km (best case) to 155.92 gCO2e/km (worst case).

4. Discussion

According to the characteristics described in the literature, the V2G mode is the one that presents the most benefits and least negative effects for the grid [24]. However, it is not clear that such apparent benefits actually result in it being a more environmentally sustainable option. The results show that it is the integration mode that presents the highest CO2 emissions and is therefore the worst option. In this mode, emissions will be from 88.2% (best case) to 125.6% (worst case) of the average emissions value of an ICV (177.15 gCO2e/km): in the best scenario, an EV will have less 11. 8% than an ICV and in the worst case, it will have 25.6% more emissions than an ICV. These results show that V2G mode increases CO2 emissions and therefore reduces the benefits of using EVs.
In G2V mode, emissions will range from 74.1% (best case) to 111.4% (worst case) of the average emissions value of an ICV: in the best scenario, an EV will have 25.9% less than an ICV, and in the worst case, it will have 11.4% more emissions than an ICV.
The results for V2G and G2V modes show that the need for communications, control, storage, and data processing infrastructures (that cause emissions due to resource use and energy consumption in manufacturing) and their operation over time (which implies energy consumption) can lead to the option of using an EV instead of an ICV being more unsustainable.
For NC and WCNC modes, emissions will range from 67.3% (best case) to 88.0% (worst case) of the average emissions value of an ICV: in the best scenario, an EV will have 32.7% less than an ICV, and in the worst, case it will have 12% fewer emissions than an ICV. These values are consistent with those recognized by the European Environment Agency (EEA), which state that in the best case scenario, an EV will have 17 to 30% fewer emissions compared to an ICV, but it may in some cases have more emissions than an ICV considering the 2018 mix of energy production electricity in the EU [30]. These results are also in line with the results of [25]: “When comparing equal sizes, the EVs had 20–27% lower life cycle impact than the ICEVs”. The NC and WCNC interconnection modes are those that bring the most benefits to environmental sustainability, as they have the lowest CO2 emissions. This is due to the fact that they do not need communications, control, storage, and data processing infrastructures.
The results obtained are consistent with reservations at EU level about the expectations of the environmental benefits of large-scale EVs: “For a sustainable mobility system, electric vehicles alone will not be enough. Furthermore, production of electric vehicles will still require substantial resources and generate pollution” [30].
Previous studies focused on analyzing the life cycle of an EV have already shown that the benefits of EVs for large-scale sustainability are small and may not even exist (depending on the size of the EV, the manufacturing country, or the mix of electricity production). But the results of the present study show that this also depends on the mode of large-scale EV integration in the grid. The results show that the integration mode that is considered in the literature as the most promising (particularly at the economic level) for the EES (V2G) is the worst from the point of view of CO2 emissions, that is, for environmental sustainability.
As the NC and WCNC modes are the ones with the least emissions, but the ones that present the most problems for the EES, it will be necessary to find an EV percentage threshold that allows for the safe operation of the EES without having to resort to a complex system of communications and data processing (which would increase emissions). In this way, CO2 emissions are minimized.
The present study focuses on environmental sustainability, but to have a broader (more macro) perspective, an analysis of economic sustainability should also be carried out. Vaz [17], studied the economic sustainability applied to Portugal, and the study indicates that for there to be economic benefits, it is necessary to adjust levels of EV penetration to the existing excess renewable production, and that for the year (2016) and country under study, it was of 25% of the total transport fleet. That is, a large percentage of EVs can be detrimental to economic sustainability, as if renewable production is exhausted in excess, more electricity will have to be produced from other non-renewable sources, which contradicts the objectives initially intended with EVs and creates additional economic costs. The study [17] is in line with the results, showing that there is a threshold for the percentage of EVs that is beneficial and that this depends on a large and comprehensive set of factors.

5. Conclusions

This study presents a framework identifying the main contributions to CO2 emissions resulting from large-scale EV integration. This is a relevant contribution to future research that aims to analyze, in a more complete and realistic way, the impacts on the environmental sustainability of EVs. It also presents the calculation of estimated CO2 emissions from a macro perspective, enabling a more adjusted assessment of the impact of EVs on a large scale and a more realistic comparison with ICV emissions.
The present study shows that considering a macro perspective when calculating CO2 emissions resulting from large-scale EV use is essential to estimate realistic values. It also shows that theoretical expectations can be very unrealistic.
It also shows that taking into account only a part of the potential sources of emissions (micro view) leads to underestimating CO2 emissions, which can mislead political authorities, companies, and public opinion regarding the investment in and use of EVs. Taking into account that environmental sustainability is a serious problem that humanity currently faces, it is important that engineering and science are ethically responsible in the information they transmit to society and the scientific community itself and even in the expectations they create regarding a new technology. To this end, prudence and ethical responsibility are essential in communicating expectations about the micro and macro assessment of the estimated impacts of a new technology.
The results of the present study are an estimate that is based on results from several different studies published in scientific documents and not an exact calculation, which is one of the limitations of this study. In this study, emissions due to new infrastructure in the distribution network were also not considered when calculating global emissions. Taking these limitations into account, more future studies are needed to verify the emissions resulting from large-scale EV use comparing the different integration modes.
The present study is based on data on current driver behavior, using ICVs. When using an EV, drivers’ behavior may change (as happened with other new technologies), which could, for example, lead to them driving longer. By changing behavior, it can change the emissions that will result from it. Another issue that deserves additional future investigation is the influence that a new technology (in this case EVs) could have on altering the behavior of its users and how this could affect CO2 emissions.
The two main contributions of this work (creation of a framework and calculation of the estimate of CO2 emissions from a macro perspective) are an important contribution to future studies in the area of smart grids and large-scale EV integration. Additionally, political decision-makers, agents in the economic sector, and common citizens now have grounds for more informed decision-making. This study is particularly important for decision-makers when deciding on how to integrate EVs into the grid or on mechanisms to achieve environmental sustainability.
This study can also be an important contribution to engineering education, by showing the importance (and ethical responsibility) of analyzing the impact of a new technology using a macro perspective.
The results obtained highlight the important challenge that the area of smart grids and EVs has: to show that their implementation is clearly always beneficial for environmental sustainability.

Author Contributions

Conceptualization: F.M. and A.S.; methodology: F.M. and A.S.; validation: F.M. and A.S.; formal analysis: A.S.; investigation: F.M.; writing—original draft preparation: F.M.; writing—review and editing: A.S. and Fátima Montero; supervision: A.S. All authors have read and agreed to the published version of the manuscript.

Funding

This research received no external funding.

Institutional Review Board Statement

Not applicable.

Informed Consent Statement

Not applicable.

Data Availability Statement

The original contributions presented in the study are included in the article, further inquiries can be directed to the corresponding author.

Conflicts of Interest

The authors declare no conflicts of interest.

References

  1. EDP. Évora Inovcity–Smart Energy Living; EDP Distribuição SA: Lisboa, Portugal, 2015. [Google Scholar]
  2. Sultan, V.; Aryal, A.; Chang, H.E.A. Integration of EVs into the smart grid: A systematic literature review. Energy Inf. 2022, 65, 5. [Google Scholar] [CrossRef]
  3. Palensky, P.; Kupzog, F. Smart Grids. Annu. Rev. Environ. Resour. 2013, 38, 201–226. [Google Scholar] [CrossRef]
  4. Alsuwian, T.; Butt, A.S.; Amin, A. Smart Grid Cyber Security Enhancement: Challenges and Solutions—A Review. Sustainability 2022, 14, 14226. [Google Scholar] [CrossRef]
  5. Reynolds, M.; Cutsor, J.; Erickson, L.E. Electrical Grid Modernization. In Solar Powered Charging Infrastructure for Electric Vehicles; CRC Press: Boca Raton, FL, USA, 2016; pp. 75–84. [Google Scholar]
  6. Bagdadee, A.H.; Zhang, L. A review of the smart grid concept for electrical power system. In Research Anthology on Smart Grid and Microgrid Development; IGI Global: Hershey, PA, USA, 2022; pp. 1361–1385. [Google Scholar]
  7. Ali, F.; Nazir, Z.; Inayat, U.; Ali, S.M. Infrastructure of South Korean Electric Power System and Potential Barriers for the Implementation of Smart Grid: A Review. In Proceedings of the 2019 International Conference on Innovative Computing (ICIC), Arlington, VA, USA, 1–2 November 2019. [Google Scholar]
  8. U.S. Department of Energy. The Smart Grid: An Introduction. How a Smarter Grid Works as An Enabling Engine for Our Economy, Our Environment and Our Future; U.S. Department of Energy: Washington, DC, USA, 2008.
  9. Das, H.S.; Rahman, M.M.L.S.; Tan, C.W. Electric vehicles standards, charging infrastructure, and impact on grid integration: A technological review. Renew. Sustain. Energy Rev. 2020, 120, 109618. [Google Scholar] [CrossRef]
  10. Erickson, L.E.; Robinson, J.; Brase, G.; Cutsor, J. Solar Powered Charging Infrastructure for Electric Vehicles; CRC Press: Boca Raton, FL, USA, 2017. [Google Scholar]
  11. EEA. Greenhouse Gas Emissions from Transport in Europe; EEA: Copenhagen K, Denmark, 2023. [Google Scholar]
  12. European Parliament. Emissões de dióxido de carbono nos carros: Factos e números (infografia). 2023. Available online: https://www.europarl.europa.eu/topics/pt/article/20190313STO31218/emissoes-de-co2-dos-carros-factos-e-numeros-infografias (accessed on 1 June 2024).
  13. Sirojiddinova, I.M.; Aminboyev, S. Advantages and Disadvantages of Electric Vehicles and Hybrid Electric Vehicles. Am. J. Eng. Mech. Archit. 2023, 1, 130–136. [Google Scholar]
  14. Husinec, M.; Strielkowski, W.; Vacek, T.; Vondracek, M. Optimizing electric vehicles charging for enhancing environmental sustainability and reducing carbon emissions of freight transport: Case of Czech Republic. Environ. Econ. 2024, 15, 16–31. [Google Scholar] [CrossRef]
  15. Fernandez, L.P.; Román, T.G.S.; Cossent, R.; Domingo, C.M.; Frias, P. Assessment of the impact of plug-in electric vehicles on distribution networks. IEEE Trans. Power Syst. 2010, 26, 206–213. [Google Scholar] [CrossRef]
  16. Mwasilu, F.; Justo, J.J.; Kim, E.K.; Do, T.D.; Jung, J.W. Electric vehicles and smart grid interaction: A review on vehicle to grid and renewable energy sources integration. Renew. Sustain. Energy Rev. 2014, 34, 501–516. [Google Scholar] [CrossRef]
  17. Vaz, P. Análise dos Sistemas G2V e V2G no Contexto da Integração de Geração Renovável. Master’s Thesis, Universidade de Coimbra, Coimbra, Portugal, 2019. [Google Scholar]
  18. San Diego Gas & Electric. Electric Vehicle Grid Integration. 2015. Available online: https://www.westernlampac.org/2015%20Spring%20Conference/Laura%20McDonald%20EVGI%20LAMPAC%20Presentation%20042715.pdf (accessed on 2 June 2024).
  19. Tasnim, M.N.; Riana, J.M.K.; Shams, T.; Shahjalal, M.; Subhani, N.; Ahmed, M.R.; Iqbal, A. A critical review on contemporary power electronics interface topologies to vehicle-to-grid technology: Prospects, challenges, and directions. IET Power Electron. 2024, 17, 157–181. [Google Scholar] [CrossRef]
  20. Ehsani, M.; Falahi, M.; Lotfifard, S. Vehicle to grid services: Potential and applications. Energies 2012, 5, 4076–4090. [Google Scholar] [CrossRef]
  21. Sovacool, B.K.; Kester, J.; Noel, L.; de Rubens, G.Z. Actors, business models, and innovation activity systems for vehicle-to-grid (V2G) technology: A comprehensive review. Renew. Sustain. Energy Rev. 2020, 131, 109963. [Google Scholar] [CrossRef]
  22. Kahlen, M.T.; Ketter, W.; van Dalen, J. Electric vehicle virtual power plant dilemma: Grid balancing versus customer mobility. Prod. Oper. Manag. 2018, 27, 2054–2070. [Google Scholar] [CrossRef]
  23. Silva, A.V.D. Problema de Roteamento de Veículos Elétricos: Otimização da vida útil das Baterias. Ph.D. Dissertation, Universidade de São Paulo, Sao Paulo, Brazil, 2020. [Google Scholar]
  24. Galus, M.D.; Vayá, M.G.; Krause, T.; Andersson, G. The role of electric vehicles in smart grids. In Advances in Energy Systems: The Large-scale Renewable Energy Integration Challenge; Wiley: New York, NY, USA, 2012; pp. 245–264. [Google Scholar]
  25. Ellingsen, L.A.W.S.B.; Strømman, A.H. The size and range effect: Lifecycle greenhouse gas emissions of electric vehicles. Environ. Res. Lett. 2016, 11, 054010. [Google Scholar] [CrossRef]
  26. Aleksic, S.; Mujan, V. Exergy cost of information and communication equipment for smart metering and smart grids. Sustain. Energy Grids Netw. 2018, 14, 1–11. [Google Scholar] [CrossRef]
  27. Kotas, T.J. The Exergy Method of Thermal Plant Analysis; Paragon Publishing: Wiltshire, UK, 2012. [Google Scholar]
  28. Funke, S.Á.; Sprei, F.; Gnann, T.; Plötz, P. How much charging infrastructure do electric vehicles need? A review of the evidence and international comparison. Transp. Res. Part D Transp. Environ. 2019, 77, 224–242. [Google Scholar] [CrossRef]
  29. Nordelöf, A.; Messagie, M.; Tillman, A.M.; Söderman, M.L.; Van Mierlo, J. Environmental impacts of hybrid, plug-in hybrid, and battery electric vehicles—What can we learn from life cycle assessment? Int. J. Life Cycle Assess. 2014, 19, 1866–1890. [Google Scholar] [CrossRef]
  30. EEA. EEA Report No 13/2018, Electric Vehicles from Life Cycle and Circular Economy Perspectives TERM 2018: Transport and Environment Reporting Mechanism (TERM) Report; European Environment Agency: Copenhagen K, Denmark, 2018. [Google Scholar]
  31. Nour, M.; Ramadan, H.; Ali, A.; Farkas, C. Impacts of plug-in electric vehicles charging on low voltage distribution network. In Proceedings of the 2018 International Conference on Innovative Trends in Computer Engineering (ITCE), Aswan, Egypt, 19–21 February 2018. [Google Scholar]
  32. Costa, R. Quem é o Condutor Português? Conduz 9000 Quilómetros Por Ano, Tem Carro Com Uma Década e Usa-o Diariamente. 2018. Available online: https://www.publico.pt/2018/01/23/sociedade/noticia/quem-e-o-condutor-portugues-conduz-nove-mil-quilometros-por-ano-tem-carro-com-uma-decada-e-usao-diariamente-1800028 (accessed on 1 June 2024).
  33. Wiesberg, I.L.; Brigagão, G.V.; de Queiroz, F.A.O.; de Medeiros, J.L. Carbon dioxide management via exergy-based sustainability assessment: Carbon Capture and Storage versus conversion to methanol. Renew. Sustain. Energy Rev. 2019, 112, 720–732. [Google Scholar] [CrossRef]
  34. Rosen, M.A.; Dincer, I.; Kanoglu, M. Role of exergy in increasing efficiency and sustainability and reducing environmental impact. Energy Policy 2008, 36, 128–137. [Google Scholar] [CrossRef]
  35. Wu, J.; Wang, N. Exploring avoidable carbon emissions by reducing exergy destruction based on advanced exergy analysis: A case study. Energy 2020, 206, 118246. [Google Scholar] [CrossRef]
  36. Eurostat. Motorisation Rate, by NUTS 2 Regions, 2022. 2024. Available online: https://ec.europa.eu/eurostat/statistics-explained/index.php?title=Stock_of_vehicles_at_regional_level&oldid=637106#Stock_of_passenger_cars_at_regional_level (accessed on 4 June 2024).
  37. D. Nunes Na União Europeia Havia um Carro Por Cada Dois Habitantes em 2020. 2022. Available online: https://eco.sapo.pt/2022/07/27/na-uniao-europeia-havia-um-carro-por-cada-dois-habitantes-em-2020/ (accessed on 1 June 2024).
  38. Hernández-Moro, J.; Martínez-Duart, J.M. CSP electricity cost evolution and grid parities based on the IEA roadmaps. Energy Policy 2012, 41, 184–192. [Google Scholar] [CrossRef]
  39. Sprague, R. An analysis of current battery technology and electric vehicles. J. Undergrad. Res. 2015, 5, 70–75. [Google Scholar] [CrossRef]
  40. Mancarella, P.; Gan, C.K.; Strbac, G. Optimal design of low-voltage distribution networks for CO2 emission minimisation. Part I: Model formulation and circuit continuous optimization. IET Gener. Transm. Distrib. 2011, 5, 38–46. [Google Scholar] [CrossRef]
  41. Sa’ed, J.A.; Amer, M.; Bodair, A.; Baransi, A.; Favuzza, S.; Zizzo, G. A simplified analytical approach for optimal planning of distributed generation in electrical distribution networks. Appl. Sci. 2019, 9, 5446. [Google Scholar] [CrossRef]
  42. Díaz, S. Electric power losses in distribution networks. Turk. J. Comput. Math. Educ. 2021, 12, 581–591. [Google Scholar]
  43. Dashtaki, A.K.; Haghifam, M.R. A new loss estimation method in limited data electric distribution networks. IEEE Trans. Power Deliv. 2013, 28, 2194–2200. [Google Scholar] [CrossRef]
  44. Eusébio, A. Estudo de Perdas na Rede de Baixa Tensão e Possibilidade da Sua Redução. Master’s Dissertation, Instituto Politécnico do Porto, Porto, Portugal, 2017. [Google Scholar]
  45. Horak, D.; Hainoun, A.; Neumann, H.M. Techno-economic optimisation of long-term energy supply strategy of Vienna city. Energy Policy 2021, 158, 112554. [Google Scholar] [CrossRef]
Figure 1. Graphical summary highlighting the main CO2 emissions associated with large-scale EV integration using NC or WCNC mode, from a macro perspective.
Applsci 14 06177 g001
Figure 2. Graphical summary highlighting the main CO2 emissions associated with large-scale EV integration using G2V or V2G mode, from a macro perspective.
Applsci 14 06177 g002
Table 1. Summary of main studies that were identified in the literature search and whose data were used in the present study.
AuthorsDateTitleFocus of the Study
Aleksic, S.; Mujan, V. [26]2018Exergy cost of information and communication equipment for smart metering and smart gridsPresents the loss of exergy due to communications and data processing infrastructures of smart grids
Nordelöf, A. et al. [29]2014Environmental impacts of hybrid, plug-in hybrid, and battery electric vehicles—what can we learn from life cycle assessment?Presents emissions due to the life cycle analysis of an EV
EEA, European Environmental Agency [11]2023Greenhouse gas emissions from transport in EuropePresents emissions due to the life cycle analysis of an EV
EEA, European Environmental Agency [30]2018EEA Report No 13/2018, Electric vehicles from life cycle and circular economy perspectives TERM 2018: Transport and Environment Reporting Mechanism (TERM) reportPresents emissions due to the life cycle analysis of an EV
Fernandez, L. P. et al. [15]2010Assessment of the impact of plug-in electric vehicles on distribution networksPresents the impact of EVs on the grid and grid losses
Nour, M.; Ramadan, H.; Ali, A.; Farkas, C. [31]2018Impacts of plug-in electric vehicles charging on low voltage distribution networkPresents the impact of EVs on the grid and grid losses
Table 2. Summary of theoretical characteristics of each of the integration modes referred to in the literature: NC, WCNC, V2G, and G2V.
NCWCNCV2GG2V
EV Ownership
  • The EV owner makes the decisions
  • The owner makes decisions, but is conditioned in those decisions
  • Does not make loading/unloading decisions
  • Does not make decisions about how charging is carried out
Influence on SEE
  • Network losses
  • Congestion
  • Instability
  • Overloads
  • Low voltage level
  • Difficulty managing the network
  • Infrastructure degradation
  • Lower quality of service
  • Load regulation during off-peak hours
  • Network losses
  • Congestion
  • Instability
  • Overloads
  • Low voltage level
  • Difficulty managing the network
  • Infrastructure degradation
  • Lower quality of service
  • Network losses
  • Frequency control
  • Control of voltage levels
  • Provision of ancillary services
  • Reduction in peaks
  • Load regulation during off-peak hours
  • Greater use of excess renewable production
  • Load regulation during off-peak hours
  • Network losses
Infrastructure
  • For EV charging
  • For metering
  • For EV charging
  • For metering
  • For bidirectional power flow
  • For metering
  • For two-way global communications
  • For data storage
  • For data processing (AI + IOT)
  • For EV charging
  • For metering
  • For local communications
  • For local management and control
Batteries
  • Minimizes charge/discharge cycles
  • Minimizes charge/discharge cycles
  • Increases charge/discharge cycles: greater degradation
  • Shorter lifespan
  • Bigger battery than needed for travel
  • Minimizes charge/discharge cycles
Table 3. Summary of the main direct and indirect impacts due to the high use of EVs for V2G or G2V mode. For NC and WCNC modes, items relating to telecommunication and data processing infrastructures are excluded.
AreasSub-AreasImpacts
Resource
Extraction
  • For battery construction
  • Environmental degradation
  • Energy consumption
  • Resource consumption
  • Generates toxicity
  • For construction of the EV
  • For construction of telecommunication, control, automation, processing, and data storage infrastructures
  • For construction of charging and metering infrastructures
  • For construction of distribution network infrastructures
  • Fossil fuel extraction
Resource
Processing
  • For battery and EV construction
  • Energy consumption
  • Waste production
  • Consumption of other resources
  • Generates toxicity
  • For construction of communications infrastructure, charging, metering and of distribution network infrastructures
  • Fossil fuel processing
Transport
  • Energy (excluding electrical energy) for resource extraction, resource processing, and battery and EV manufacturing
  • Energy consumption
  • Resource usage
  • Generates toxicity
  • Generates microplastics
  • Energy (excluding electrical energy) for resource extraction, resource processing, and infrastructure manufacturing
  • Resource extraction → resource processing
  • Resource processing → battery manufacturing → EV manufacturing
  • Resource processing → manufacturing telecommunications infrastructure, control, processing, and data storage → installation
  • Resource processing → manufacturing infrastructures charging and counting → installation
  • Resource processing → manufacturing distribution network infrastructure → installation
  • EV manufacturing → delivery to customer
  • EV/battery end of life → processing and recycling
Manufacturing
  • EV
  • Energy consumption
  • Resource usage
  • Generates toxicity
  • Battery
  • Telecommunications infrastructures, control, processing, and data storage
  • Charging and metering infrastructures
  • Distribution network infrastructures
End of
Life
  • EV
  • Energy consumption
  • Resource usage
  • Generates toxicity
  • Waste production
  • Battery
  • Telecommunications network equipment, control, processing, and data storage
  • Distribution network and charging and metering equipment
Power
Losses
  • Battery *
  • Electric power consumption
  • Charger and converter *
  • Telecommunications network power cables, control, and data processing and storage + equipment *
  • Distribution network cables + transmission + charging installation cables *
Electrical
Energy
Production
  • EV charging *
  • Energy consumption
  • Consumption of fossil fuels (if any)
  • Telecommunications system power supply, control, processing, and data storage *
  • Powering resource extraction systems, resource processing, battery and EV manufacturing, infrastructure, and equipment manufacturing *
EV Use
  • Battery replacement
  • Resource usage (battery)
  • Energy consumption
  • Release of microplastics
  • Generates toxicity
  • Tire wear *
Note: * occurs throughout the useful life of the EV. The shaded cells are part of the “cradle to grave” (life cycle) analysis of an EV. The remainder concern peripheral but necessary systems.
Table 4. Summary of data used for the calculations and the results for the manufacture and circulation phases. Values in gCO2e/km.
EVICV
Manufacturing phaseMinimum 4633.3
Maximum 66.735
Useful life phaseMinimum 60143
Maximum 76143
TotalMinimum 106176.3
Maximum 142.7178
Table 5. Summary of the calculation of emissions with the contribution of manufacturing, charging, and the installation and operation of telecommunications, control, automation, processing, and large-scale data storage infrastructures.
EV Life CycleCommunications
Infrastructure
EV
Total Partial
ManufacturingChargingG2VV2GG2VV2G
gCO2e/kmgCO2e/kmgCO2e/kmgCO2e/kmgCO2e/kmgCO2e/km
Worst case66.77641.3566.69184.048209.24
Best case466019.6631.68125.66137.68
Table 6. Summary of the calculation of total emissions (in gCO2e/km) for EVs (G2V and V2G mode) and for ICV.
Life CycleInfrastructuresTotal EVTotal ICV
CommunicationsGrid Losses
ManufacturingChargeG2VV2G-G2VV2G
EVWorst case66.77641.3566.6913.22197.27222.61
Best case466019.6631.68138.88150.9
ICVWorst case35143-----178.0
Best case33.3143-----176.3
Disclaimer/Publisher’s Note: The statements, opinions and data contained in all publications are solely those of the individual author(s) and contributor(s) and not of MDPI and/or the editor(s). MDPI and/or the editor(s) disclaim responsibility for any injury to people or property resulting from any ideas, methods, instructions or products referred to in the content.

