Article

Predicting Blast-Induced Damage and Dynamic Response of Drill-and-Blast Tunnel Using Three-Dimensional Finite Element Analysis

1
Department of Civil and Environmental Engineering, Hanyang University, Seoul 04763, Republic of Korea
2
Earthquake and Volcano Technology Team, Korea Meteorological Administration (KMA), Seoul 07062, Republic of Korea
*
Author to whom correspondence should be addressed.
Appl. Sci. 2024, 14(14), 6152; https://doi.org/10.3390/app14146152
Submission received: 11 May 2024 / Revised: 3 July 2024 / Accepted: 10 July 2024 / Published: 15 July 2024
(This article belongs to the Special Issue Geotechnical Engineering: Principles and Applications)

Abstract

:
The significance of predicting the dynamic response and damage of an existing concrete tunnel during underground blasting has increased owing to the close proximity between the newly built and existing tunnels. Peak particle velocity (PPV) is a commonly used criterion in the assessment of blast-induced structural damage. However, such structural damage is also associated with the frequency content of the blast wave. Nevertheless, the recommended threshold PPVs, which are based on empirical criteria, predict conservative estimations. Using stringent and regulated blasting methods often results in project delays and escalates the total project expenditure. In this paper, a three-dimensional finite element model of an underground tunnel has been developed in LS-DYNA to analyze damage to the concrete tunnels under blast loading. A suite of analyses was performed to examine the potential damage induced in the underground tunnel. A lower frequency load was found to have a greater potential for producing damage compared with a high frequency blast load. The results showed that the location of the cracking within the tunnel, such as the arch foot or tunnel wall, was also influenced by the frequency of the blast wave. The maximum allowable PPV for the concrete tunnel was determined for a range of frequencies based on predicted free field PPV and additional factors of safety of 1.2 and 1.5 were established, depending on the safety needs and importance of the tunnel construction. Thus, our findings provide useful information for improving the evaluation of tunnel damage and guaranteeing the safety of underground tunnels.

1. Introduction

Ensuring the safety and stability of underground tunnels is essential for the successful construction and operation of underground engineering projects. Underground tunnels are extensively utilized in civil, hydropower, and mining engineering. In practical engineering, underground tunnels are usually excavated and constructed adjacent to pre-existing tunnels due to the limited underground space. The drill-and-blast (D&B) method is a prevalent and cost-efficient technique for extracting rock masses in tunneling [1]. Blasting vibration is known to alter circumferential stresses, create shear and compression waves [2], and affect restricted structures. It has the potential to adversely impact adjacent tunnel linings [3]. Therefore, managing these negative effects, suggesting appropriate vibration control limits, and checking the safety of existing reinforced concrete tunnels are important technical tasks while constructing next to existing tunnels.
Previous research and engineering practices have employed peak particle velocity (PPV) to quantify blast-induced stress wave damage to nearby tunnels [4]. This has resulted in the development of many empirical damage scales that correlate with observed PPVs. The threshold vibration limit for structural safety is determined by the structure’s significance, construction quality, and structure type. It varies between countries based on the safety standards. For instance, the South Korean Seoul metro region has an allowable PPV threshold for tunnels of between 1–2 cm/s [5]. In China, AQSIQ [6] has described the empirical threshold PPV along with the frequency of blast waves for various tunnels, where the allowable PPVs for traffic tunnels were 10–12, 12–15, and 15–20 cm/s for frequency ranges of ≤10 Hz, 10–50 Hz, and >50 Hz, respectively. Zhou et al. [7] and Meng et al. [8] proposed analytical methods to investigate the dynamic response of underground tunnels. Scaled experiments have been performed to investigate the response of concrete tunnels using surface explosion by Pan et al. [9] and Zhou et al. [10] and underground blasting by Qing et al. [11]. Tunnel constructions subjected to explosive stresses are being increasingly analyzed using numerical approaches as an alternative to experimental testing and theoretical methods [12]. They are both limited in their ability to capture all the relevant details.
Shin et al. [5] performed a numerical simulation and examined blast-induced vibrations in terms of particle velocity, displacement, and lining stress. Blast location, tunnel depth, and explosives were parametrically studied, and the blast protection zone recommendation was provided. Xia et al. [13] examined tunnel blast excavation that affected the surrounding rock mass and the adjacent tunnel lining system. PPV-based damage control was then suggested. Additionally, it was demonstrated that if the PPV was less than 0.30 m/s, there was no failure in the linings or at the rock–lining interfaces. Liang et al. [3] studied the behavior of existing railway tunnels during the blast excavation of adjacent tunnels. The response was measured in terms of blasting vibration velocity with stress and strain. Liu et al. [14] proposed a correlation between PPV and effective tensile stress in tunnel lining structures. Furthermore, the observed PPV was higher on the side facing the blast compared to the opposite side. Zhang et al. [15] researched the dynamic response of the civil air defense tunnel when it was subjected to blasting loads. They proposed a criterion based on maximum tensile strength theory and predicted that the threshold PPV at the top of the arch should be kept lower than 7.84 cm/s. Based on numerical simulation findings, Yang et al. [16] studied group tunnels under blasting excavation, and each tunnel’s dynamic response and most susceptible location were analyzed. After that, the functional correlations that existed between the PPVs and the maximum tensile stresses were determined based on the maximum tensile stress criteria. Through the utilization of relationship models, the PPV threshold of every sensitive location was determined.
Many criteria exist for the analysis and prediction of tunnel damage using numerical analysis, including deflection or the deflection–span ratio by Mussa et al. [17], crack grades by Koneshwaran et al. [18], moment–force interaction diagram by Rashiddel et al. [19], charge weight versus standoff distance diagram by Yang et al. [20], and peak particle velocity (PPV) by Jiang and Zhou; Zhang et al.; Xiong et al.; and Xia et al. [15,21,22,23].
Although extensive research has been conducted to investigate the behavior of underground tunnels and their response to blast-induced vibrations, previous research has primarily focused on predicting tunnel damage based on the PPV threshold and maximum tensile strength criteria. However, in addition to the PPV, the dynamic response and damage of underground tunnels depend on the blast wave’s frequency content. It is important to mention that even if the PPV falls within the acceptable limit, there may still be significant damage to nearby tunnels. This is because the damage criteria based on PPV do not take into account the impact of blast-induced stress wave frequency on the dynamic response of nearby tunnels [4]. This study has developed a three-dimensional numerical model to examine the dynamic response and damage assessment of an underground reinforced concrete tunnel subjected to blast loads of varying frequencies.

2. Numerical Model

A horseshoe-shaped drill-and-blast tunnel designed and built in South Korea was employed in this study. The tunnel cross-section was 13 m wide and 8 m high, with a 0.3 m lining thickness. Figure 1 depicts the geometry and reinforcement in detail. The newly constructed tunnel runs parallel to the existing tunnel in a deep rock mass. The rock around the tunnel is mainly composed of granite, which is almost intact, with no visible joints or fractures along the tunnel alignment, which can only be excavated by blasting. The existing tunnel is 12.6 m away from the blasting excavation location.
The explicit nonlinear program LS-DYNA, which has been utilized in several dynamic investigations of concrete components that have been subjected to blasting, was utilized to carry out the numerical simulation. A Lagrangian simulation algorithm was used in this work to simulate solids and beams. Within the scope of this part, the numerical model of the rock and reinforced concrete tunnel that was subjected to underground blast loading is shown in Figure 2. The dimensions of the three-dimensional model were set to 55 m × 30 m × 1 m (width × height × depth). The concrete tunnel shown in Figure 3a and the rock mass were created using the hexahedron node solid element. The Hughes–Liu beam element (type 1) was utilized to represent the steel rebars depicted in Figure 3b.
The Rayleigh damping formulation, defined in Equation (1), was used to model the damping of the rock media and structural components.
C = α M + β K
where [C] is the damping matrix, [M] is the mass matrix, [K] is the stiffness matrix, and α and β are the mass and stiffness proportional damping constants, respectively, where α = 4 π ξ f 1 f 2 / f 1 + f 2 , β = ξ / π f 1 + f 2 , and ξ is the target damping ratio. The damping ratio of the rock mass and structural members was set to 5%, as is most often used in numerical analyses [24,25]. Ahn and Park [26] deemed that the predominant frequency (fp) was not suitable for defining the impulse function since the blast load has a short rise time followed by a long decay curve. Instead, rise time was used to select f1. A new formulation was presented to select target frequencies, and f 1 = 1 / 4 t r and f 2 = 10 / 4 t r were selected. In this study, frequency range was used to consider the effect of damping. A frequency range of f 1 = 10 and f 2 = 1000 was used.

2.1. Material Model

2.1.1. Concrete

In this study, the Winfrith_Concrete model, considering the strain rate and crack width calculation, was utilized to simulate the concrete’s response. The Winfrith_Concrete model is derived from the Ottosen plasticity model, which consists of four parameters [27]. Crack mapping is a crucial feature of the model. The model was deemed appropriate for blast analyses [28]. The characteristics of the concrete model were taken from Nguyen et al. [29] and are presented in Table 1. The fracture energy, also known as the energy needed to open a certain section of a crack’s surface, governs the behavior of tensile strain softening. The fracture energy was specified as 65 Nm/m2, representing concrete grade C30 with a maximum aggregate size of 8 mm [29]. Figure 4a displays the stress–strain relationship of the Winfrith_Concrete model.

2.1.2. Steel Rebar

The Plastic_Kinematic material model was utilized to model the behavior of the steel rebar [30]. This model has been extensively utilized in blast analyses [28,31]. This research considered kinematic hardening by making the parameter β equal to zero. The strain rate’s influence was considered in both the concrete and rebar models. The values C = 40.4 s−1 and p = 5, which were suggested by Jones [32], were utilized for the steel rebar in the Plastic_Kinematic model. The characteristics of the reinforcement were taken from Nguyen et al. [29] and are presented in Table 2, while the stress–strain correlation is depicted in Figure 4b.

2.1.3. Rock

During the blasting, the rock near the blast holes fractures. However, at some distance, the stress waves generated by the blasting lack sufficient energy to fracture the rock beyond a few meters. In the elastic zone, the blast waves travel as elastic seismic waves [33]. Hence, the rock in this numerical model was regarded as a linear elastic material owing to the far-field vibration that is of concern. In all the analyses, the undamaged rock properties are shown in Table 3.

2.2. Contact and Boundary Condition

The rock, concrete, and steel rebar are individually modeled and subsequently constructed using appropriate contacts and constraints. The contact between the rebar and concrete was assumed to be completely bonded. By utilizing surface to surface contact, the contact between the rock and tunnel interface was simulated. During the loading process, this contact option permitted sliding and separation between the master (concrete) and slave (rock) segments. To eliminate the influence of the reflected stress waves, a non-reflecting boundary was used and applied on the outer edges of the finite element model. Since the size of the model in the z-direction was much smaller than the other dimensions, the displacements were constrained in the z-direction. The x and y directions were set free.

2.3. Equivalent Blast Loading

When an explosive detonates within a rock mass, a shock wave is generated in the surrounding rock causing the crushing and fracturing of the rock mass. Due to the dissipation of energy, the shock wave propagates and eventually decays into an elastic seismic wave at a long distance [33]. The rock mass can be divided into three zones around the perimeter of the blast hole. These zones are the crushed zone, the fractured zone, and the elastic zone based on the physical condition of the rock mass [34].
A unified constitutive relation based on continuum mechanics was employed to simulate blasting vibration. This approach considered the crushed and fractured zone as a part of the blasting vibration source. The blasting load was then applied to the corresponding elastic boundary, which was referred to as the equivalent elastic boundary. To simulate blasting waveforms, it is essential to have a time history load in the form of pressure or velocity. According to Fan et al. [35], the results were found to be the same whether a pressure function or an equivalent velocity time series was used. Xia et al. [13] and Ahn and Park [26] previously conducted numerical simulations, utilizing velocity time histories as input loads. In this study, the velocity time history recorded on the site’s surface, consisting of biotite gneiss, with a frequency of 43 Hz, was used as the input blasting load to the equivalent elastic boundary in the normal direction, as shown in Figure 5. The blast source was modeled as a cylindrical charge with a length of 1 m and a radius of 0.5 m.
It is important to note that the vibration’s frequency characteristics undergo significant changes during the rock fracturing process. The primary frequency of the waves propagated through the elastic medium after fracturing has been shown to fall between 1 and 300 Hz [36]. A selection of vibration velocities, varying in terms of PPVs and frequencies, were modified from the test blast to account for different loading conditions. As the rock fracture was not simulated in this study, the alteration in the frequency during this process could not be modeled. Instead of modeling such a process, we used modified time histories. Elongated velocity time histories were created using the velocity functions derived from recorded time history. We adjusted each motion’s time interval (Δt) according to the desired frequencies, increasing (Δt) by a factor of 2 and 4.3 for 21.5 and 10 Hz and decreasing by 2 and 2.34 for 86 and 100 Hz, respectively. Additionally, the velocities were amplified by an amplification factor ranging from 1 to 8 to investigate the tunnel damage caused by various PPVs. It is important to mention that separate free field analyses were also performed to predict the PPVs at which damage would occur.

2.4. Mesh Sensitivity Analysis

The finite element mesh size significantly affects the outcomes of the finite element analysis. It may affect the wave propagation and the tunnel’s failure mode. As a result, a mesh convergence analysis was carried out to accurately identify the mesh size in the numerical model.
Blair [37] found that employing 6–12 elements per wavelength may reduce wave distortion. In this analysis, the longitudinal wave velocity was 4000 m/s, and the major vibration frequency ranged from 10 Hz to 100 Hz. The model predicted a wavelength of 40 m to 400 m. Thus, the study area’s grid must have been smaller than 3.3 m to ensure reliable wave propagation. Mesh sizes from 7.5 to 50 cm were used for the convergence test. Analyses were performed with an 8 m/s load with a 100 Hz frequency. Figure 6 shows velocity time history at the distance of 19.4 m for different meshes. Convergence of the solution occurred at a mesh size of 10 cm.
The failure mode of the concrete tunnel is also dependent on the mesh size. Yang et al. [20] recommended that the mesh size be between 1/12 and 1/8 of the thickness of the slab to achieve the optimal balance between computational efficiency and accuracy. In this study, the lining thickness was 0.3 m. The recommended size was 25–37.5 mm. In this study, we used a 25 to 100 mm mesh size. Figure 7 shows that a large mesh develops less damage while a small mesh size creates more damage. Qian et al. [38] recommended a 25 mm mesh size. Hence, 25 mm was used in this simulation. Further mesh refinement may result in more accurate results, albeit at the cost of increased processing time. The model had meshed into 2,299,420 solid elements, of which 1,552,060 were rock elements, 747,360 were tunnel elements, and 29,134 were beam elements, consisting of 2,328,554 elements in total.

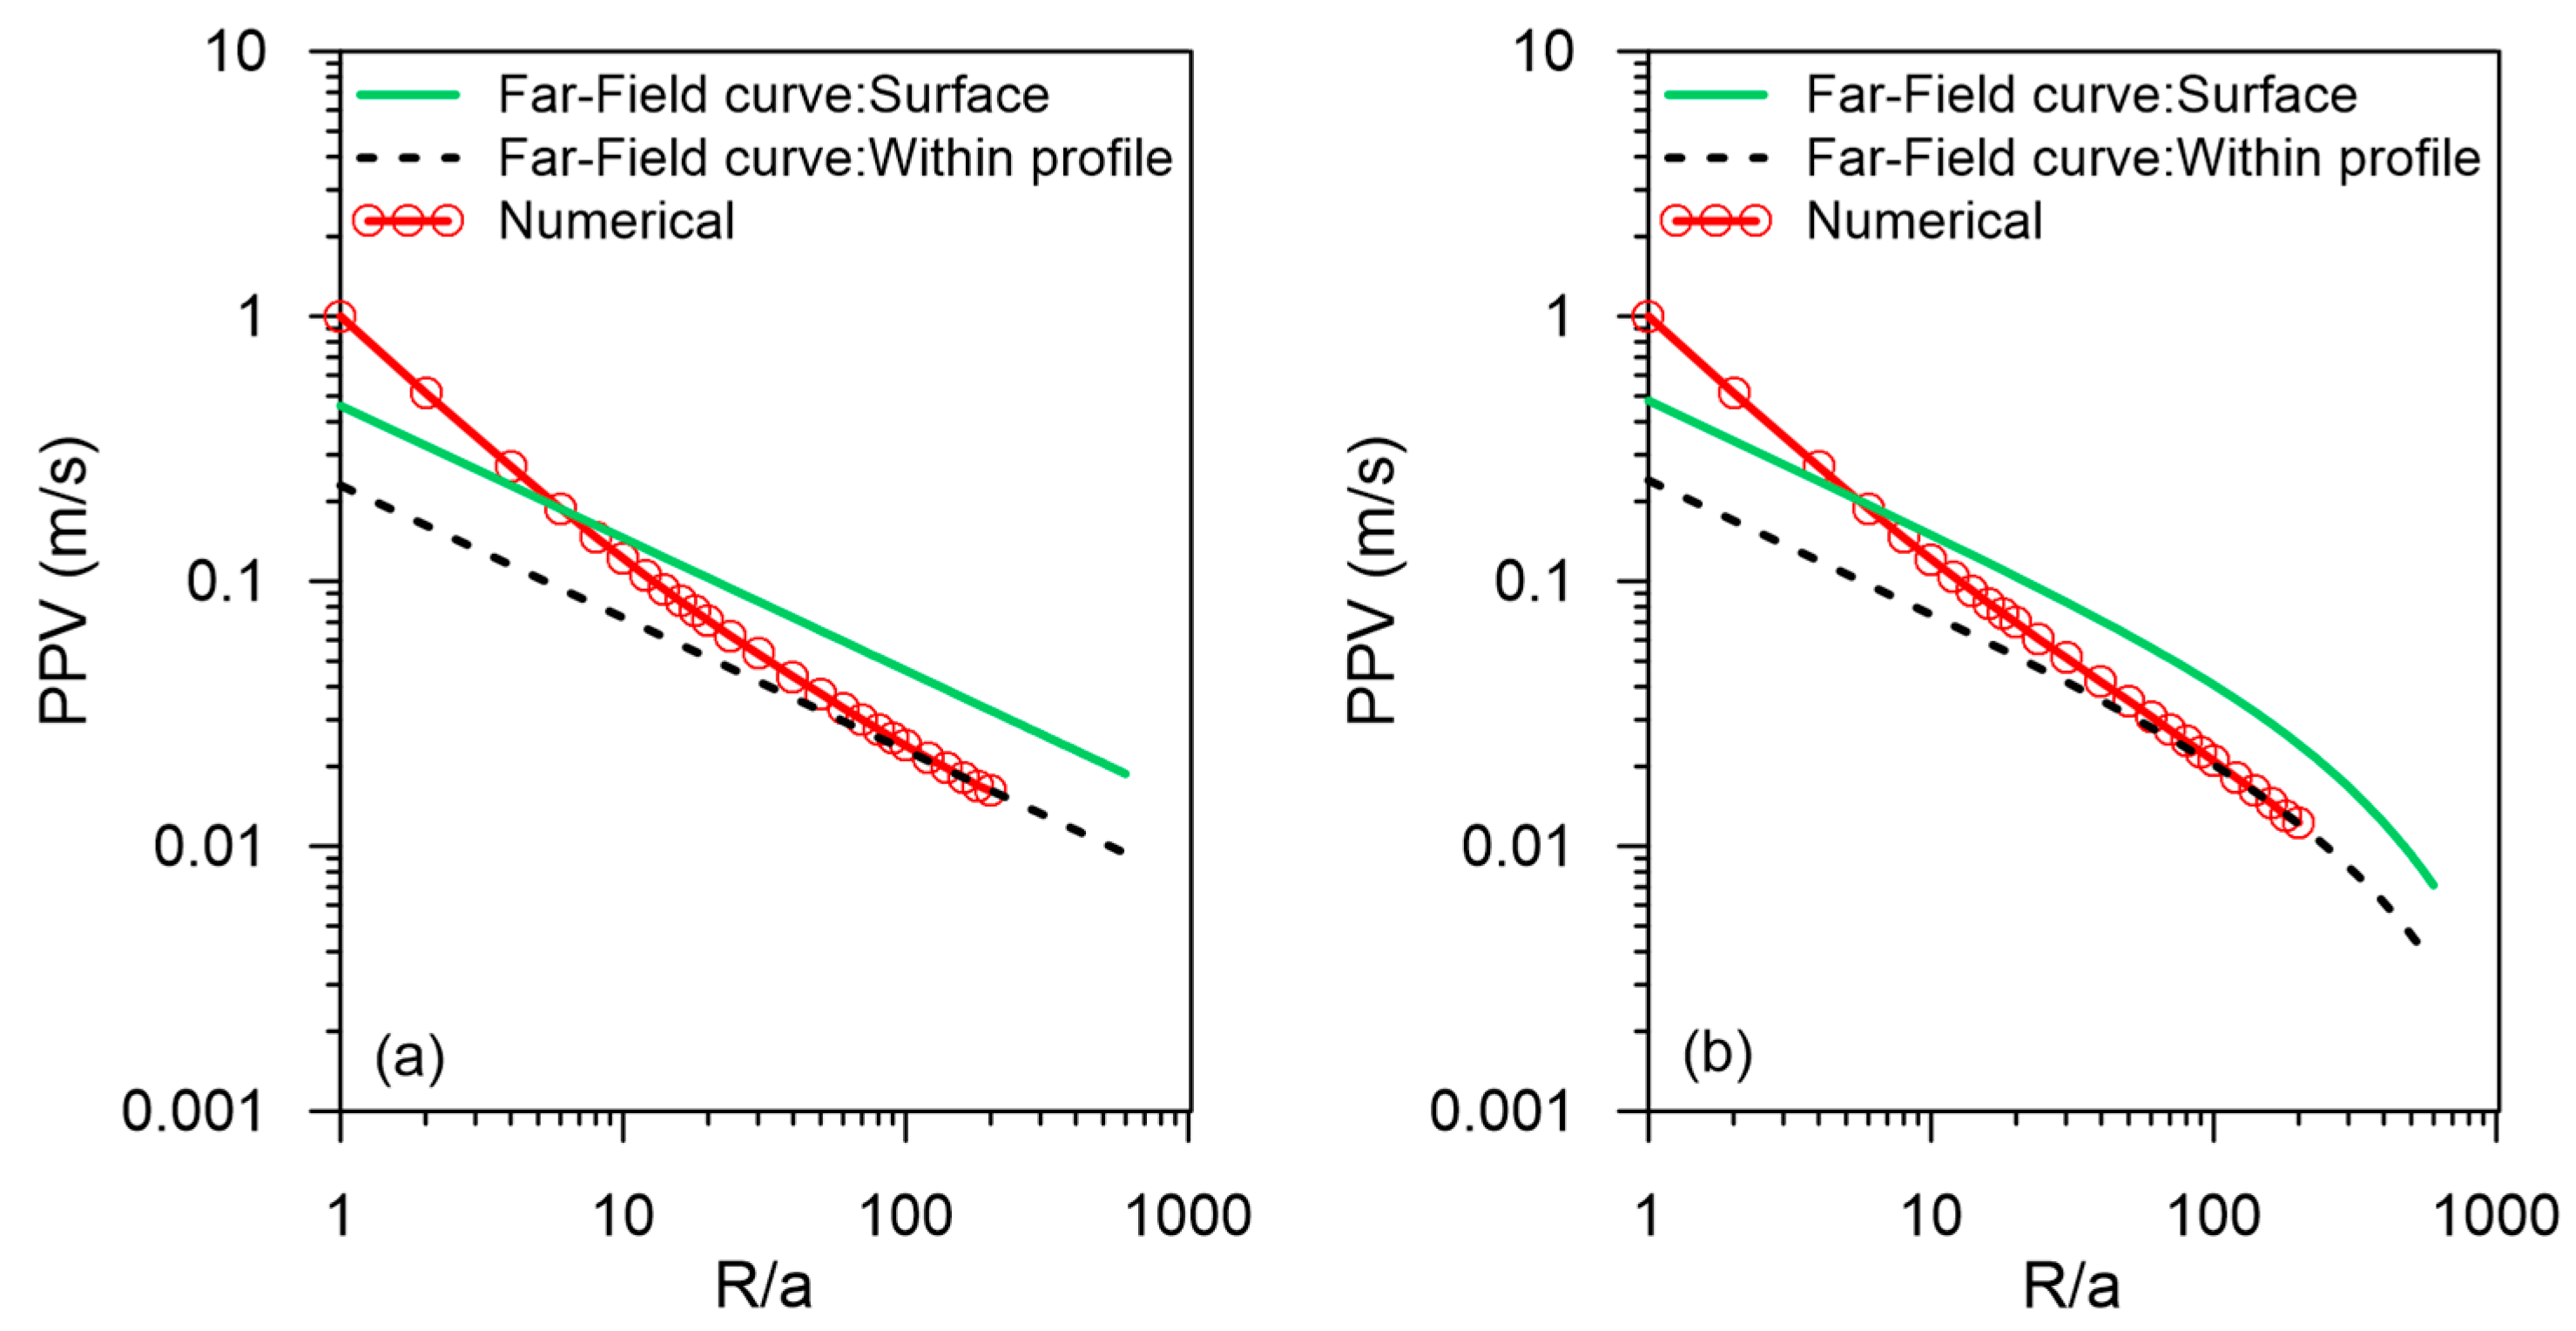
2.5. Numerical Model Verification with Far-Field Theoretical Solution

Blast-induced stress waves lose energy during wave propagation through the ground to a distant vibration sensitive receiver predominantly caused by body (shear and compressional) waves. The amplitude attenuation describes the decay of vibrations with distance from the source. This attenuation is due to the following two factors: geometric damping and material damping. Geometric damping is a phenomenon in which the energy density of a wave reduces as distance increases, owing to an increase in the propagation area. This effect is purely occurring in an elastic material, and as a result, this impact is independent of the ground’s material characteristics. The general equation for modelling geometric attenuation is as follows [39]:
V R = V r r R n
where VR is the peak amplitude at distance R from the source, Vr is the peak amplitude at distance r from the source, and n is the geometric attenuation coefficient depending on the source and wave type. The geometric spreading coefficient n for the underground cylindrical line source is set to 0.5, as suggested by Kim and Lee [40].
Energy is lost in actual earth materials due to material damping; typically, energy losses are due to hysteresis, which could be produced by internal soil particle sliding. Geologic media and wave frequencies influence this damping effect. The amplitude attenuation due to material damping was calculated using the following equation:
V R = V r e 2 π f p ξ V p R r
where Vp is the wave velocity of the media, ξ is the small strain damping ratio, e is the exponential number, and fp is the predominant frequency. As suggested by Nelson et al. [41], the product of geometrical and material damping may be used to generate the theoretical attenuation equation that accounts for both geometrical and material damping.
V R = V r r R n e 2 π f p ξ V p R r
A separate numerical model for far-field wave propagation was established. It was verified with the theoretical solution shown in Equation (4). The dimensions of the numerical model were 110 × 30 × 1 m, and mesh size was considered as 0.1 m. The blast hole radius was 0.5 m, and the charge length was 1 m. A blast load of 1 m/s with 43 Hz frequency was applied. The simulation was conducted in damped and undamped mediums, and 5% damping was selected for this simulation. The rock characteristics were defined as follows: density = 2500 kg/m3, Poisson’s ratio = 0.25, Young’s modulus = 33.3 GPa, for Vp = 4000 m/s. Figure 8a,b show the comparison of numerical and far-field theoretical solutions with damped and undamped media. The far-field solution predicts attenuation at the surface of the rock, and it is reduced by a factor of 2 to predict within the profile attenuation curve. The numerical model predicts PPV well and fits with far-field theoretical solution.

3. Results and Discussion

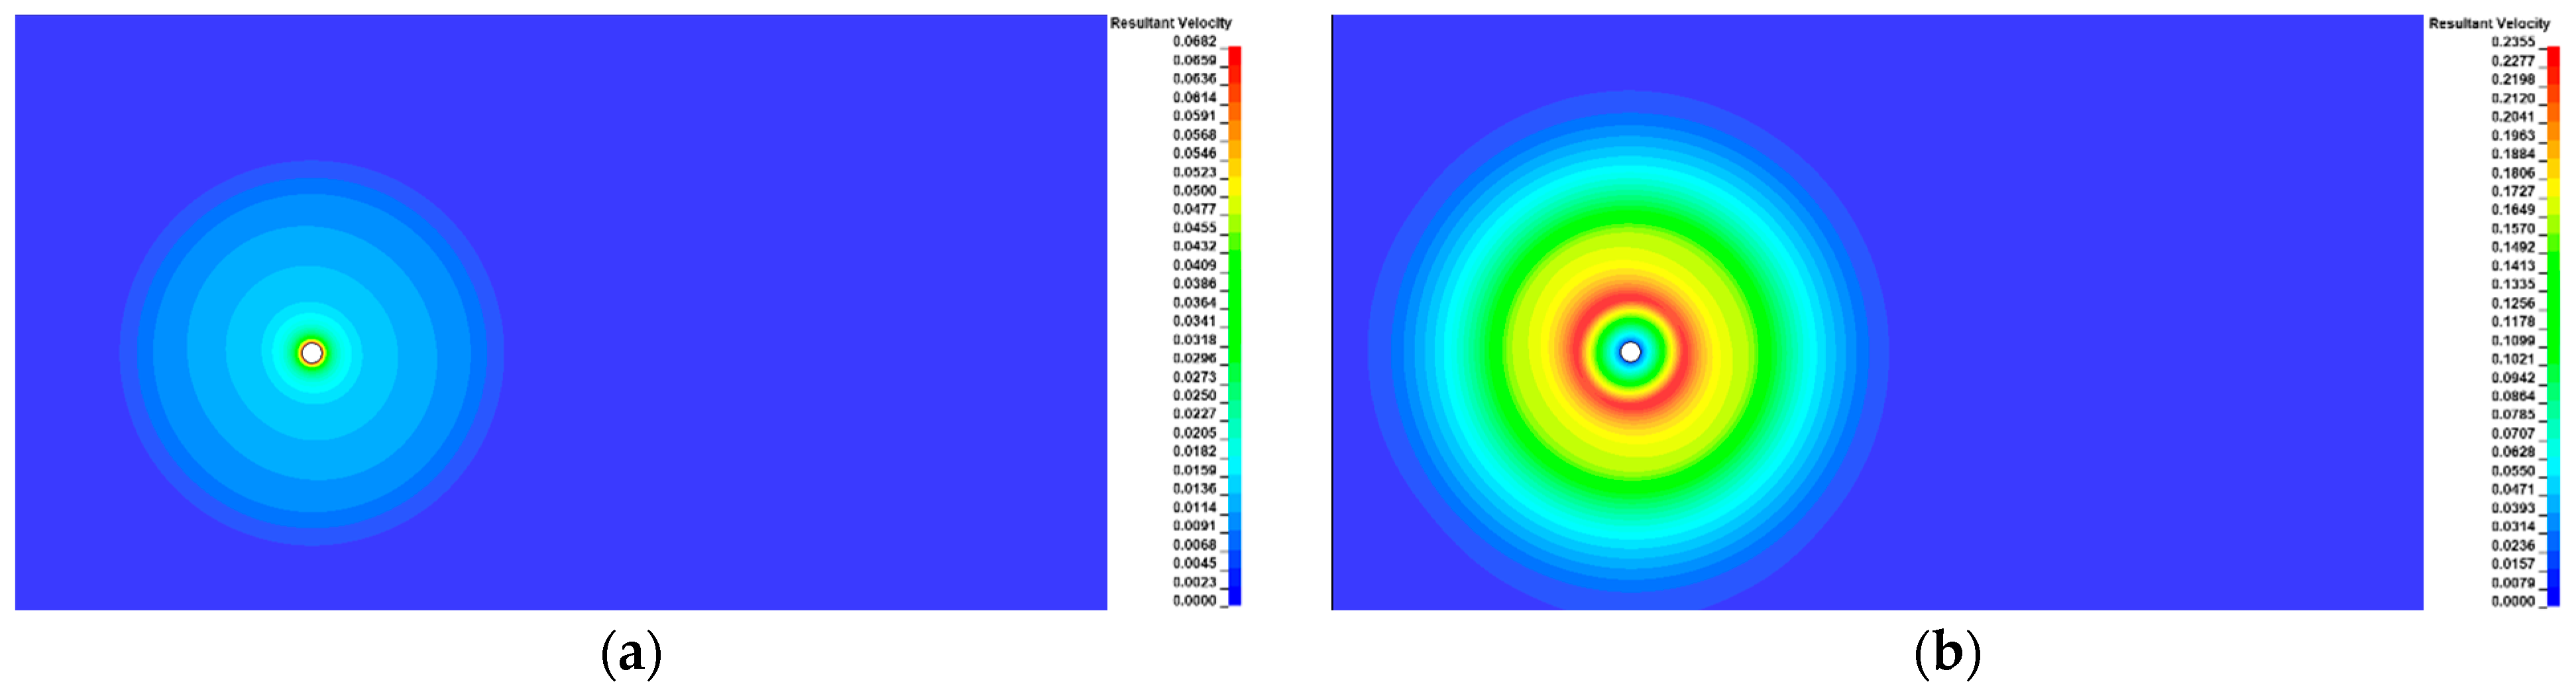
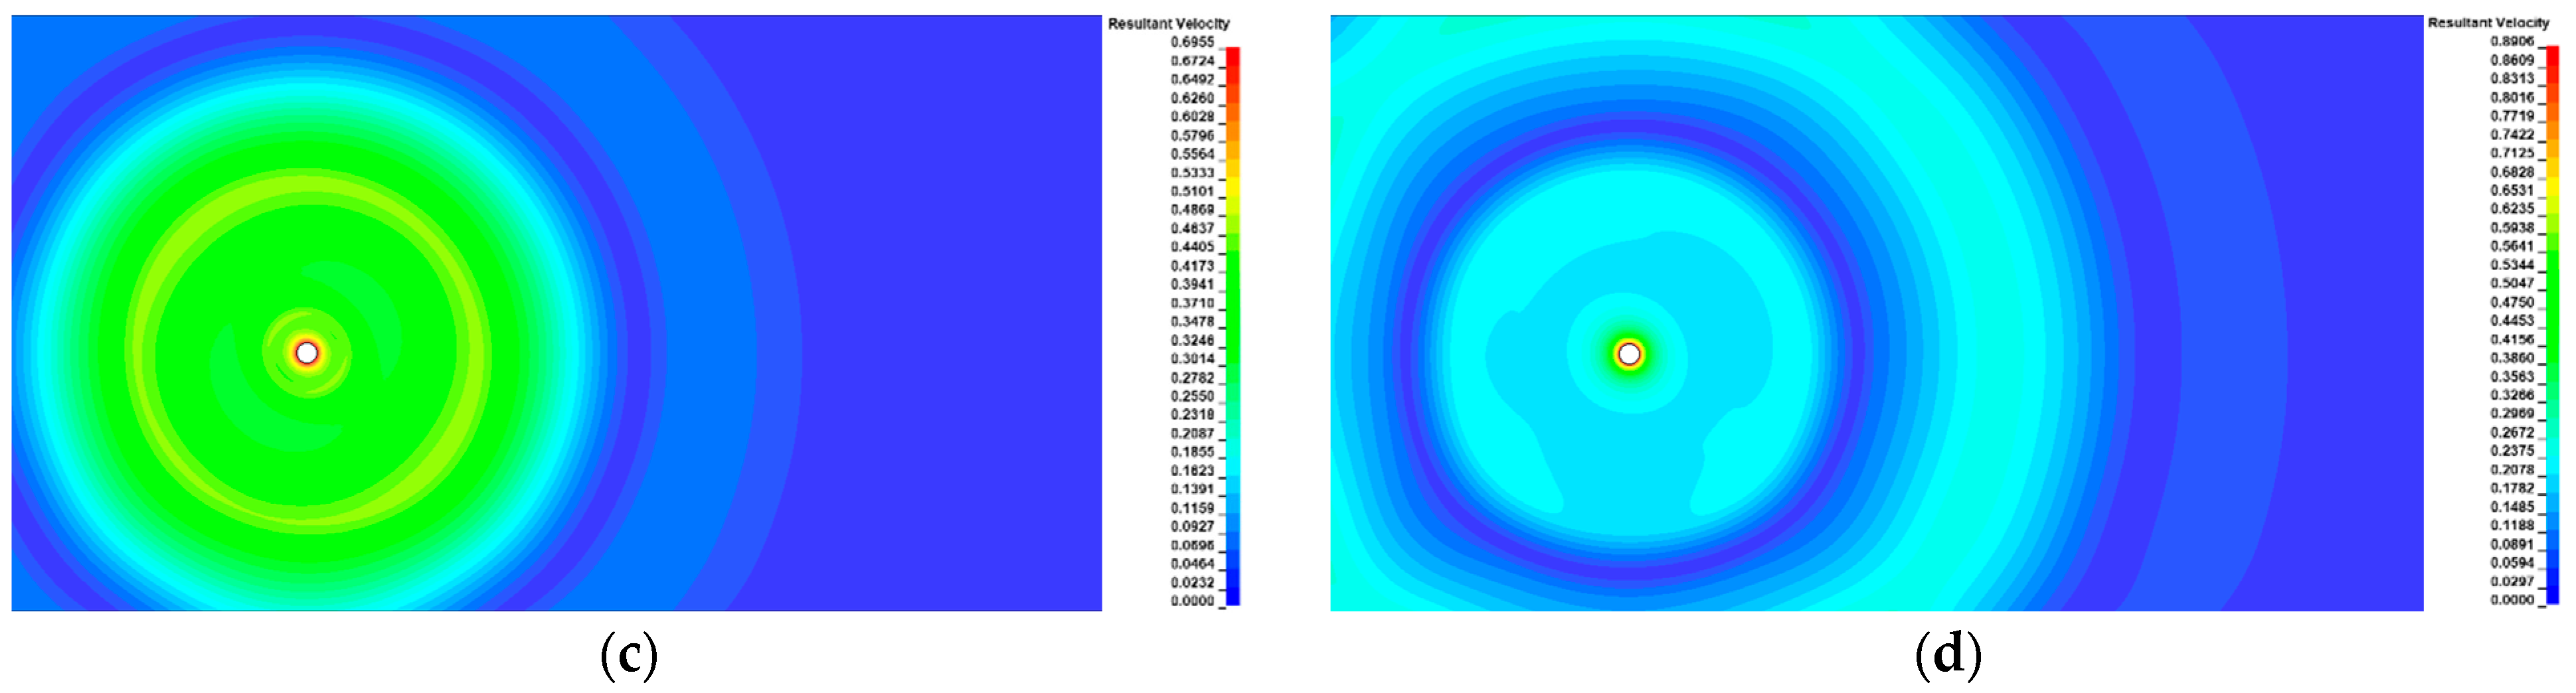
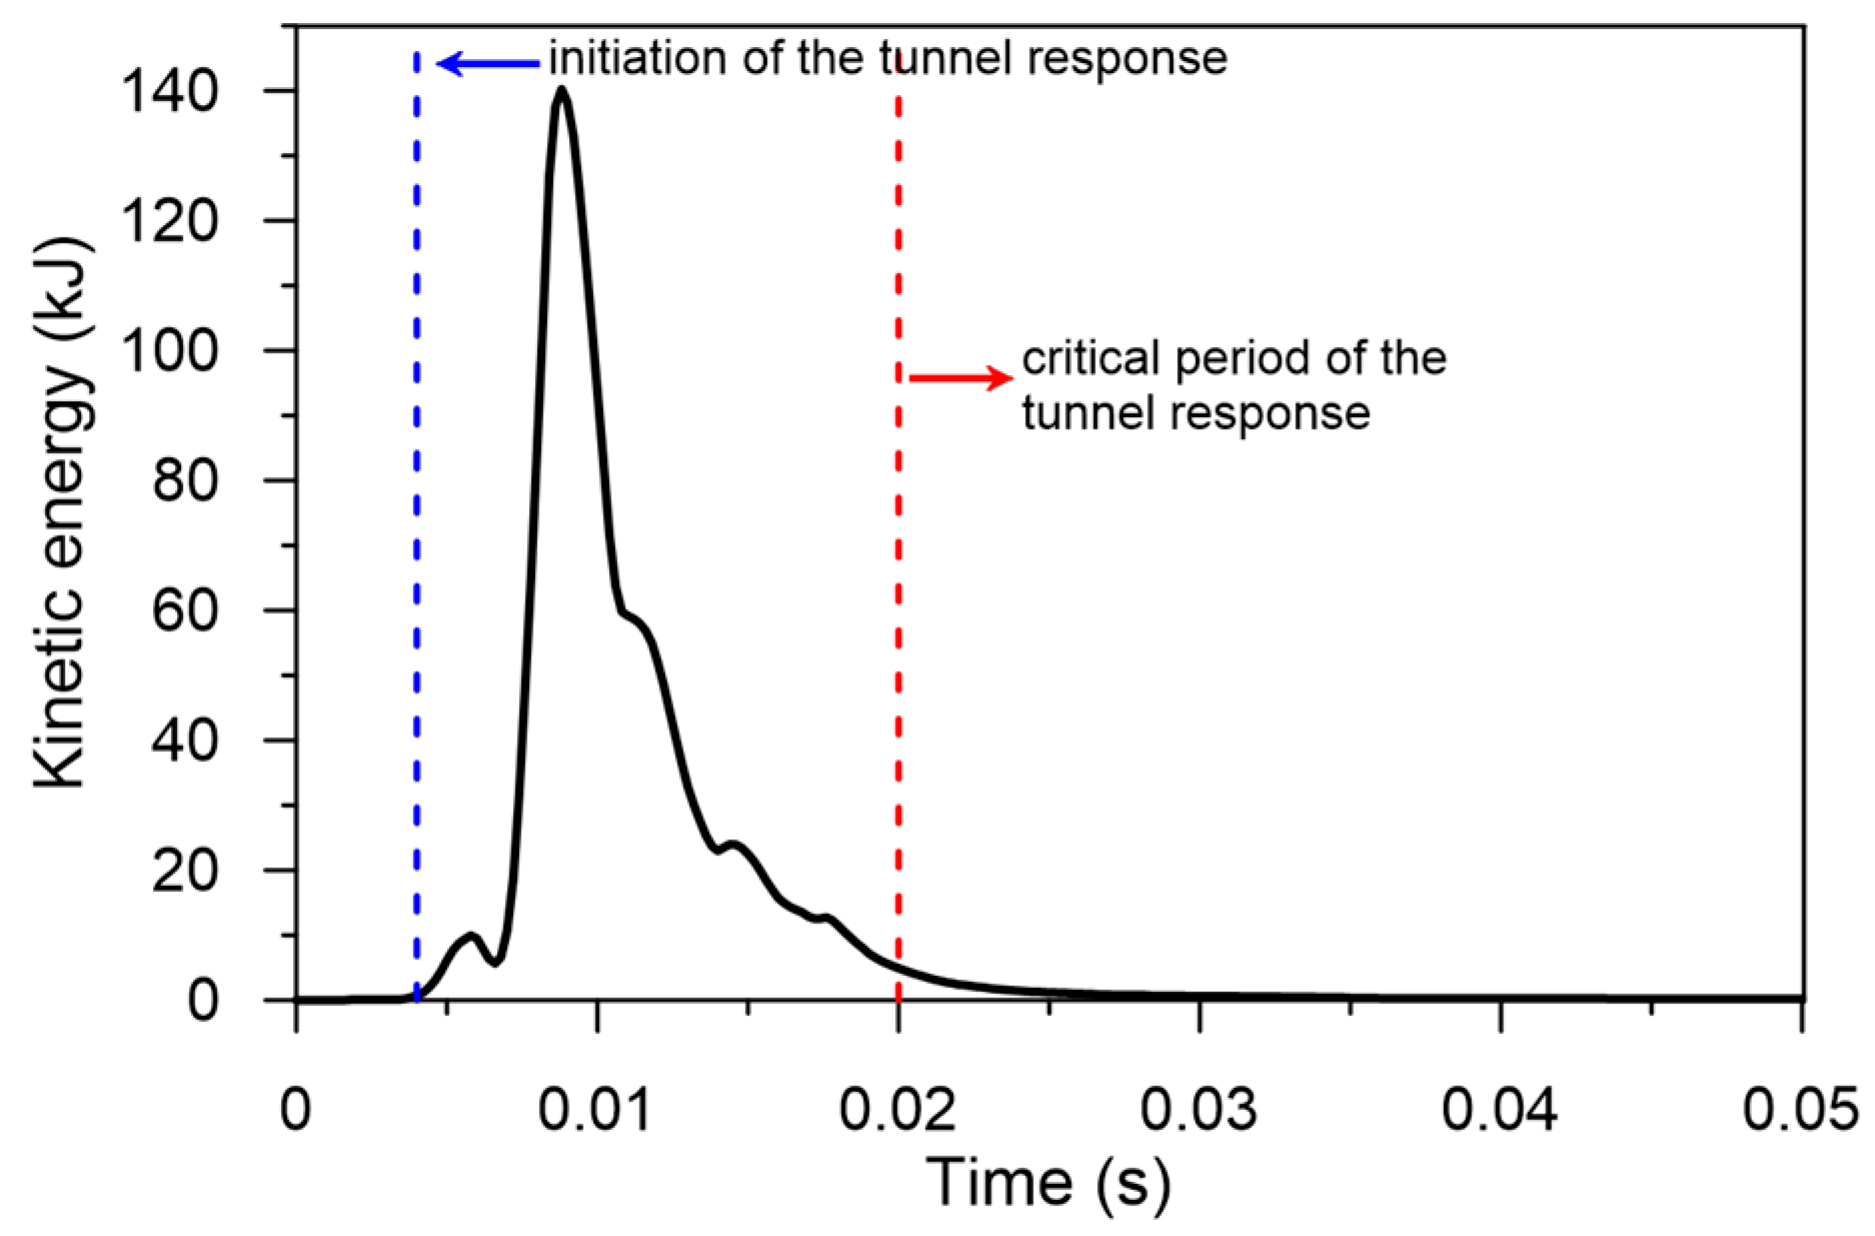
3.1. Wave Propagation and Structural Response

To investigate the wave propagation and response of the RC tunnel, a loading history of 100 Hz frequency with an amplitude of 5 m/s was applied. Figure 9 illustrates the free field resultant velocity contours as time progresses. The wave induced by blasting includes the shock wave, compressive stress wave, and the seismic elastic wave. The propagation of shock waves in a medium takes place at supersonic velocities. As the blast wave spreads from the explosive charge, it propagates in the rock medium as a cylindrical wave. The wave further attenuates due to geometric and material damping at the far field, and it turns into an elastic wave.
When a blast wave interacts with a tunnel, it begins to respond to the blast, transforming its energy into kinetic energy. The kinetic energy–time history of the RC tunnel is displayed in Figure 10. The tunnel response starts at t = 4 ms. The small first peak appears due to the first negative phase of the time history load. The graph shows a rise in the kinetic energy, which reaches the peak at t = 8.8 ms before gradually decreasing to zero. Kinetic energy peaks at 140 kJ. The tunnel’s kinetic energy disappears during plastic deformation.
The wave propagation process and tunnel response with different time intervals are shown in Figure 11. As the incident wave approaches the tunnel, the wave–structure interaction initiates. It induces an increase in pressure in the vicinity of the tunnel side, which is directed toward the detonation center.
Figure 12 displays the time histories of tunnel sections at four selected locations, as shown in Figure 3a. Free field velocity was also recorded at 19.4 m from the blast hole to the tunnel’s center. Velocity and displacement decreased as the distance from the explosion increased. The highest recorded value was at point A, located closest to the explosion, with a PPV of 75.3 cm and a peak displacement of 2.65 mm. Point C, located at the opposite end of the blasting zone, had the lowest value of PPV 19.1 cm and 0.7 mm displacement. Free field velocity was 29.1 cm less than the velocity with structure.
Figure 13 illustrates the evolution of cracking elements and tunnel damage over time. Cracking began at 10.2 ms, as shown in Figure 13a. A tensile wave was produced as a result of the compression wave reflected from the tunnel free surface. Since the resultant tensile stress was significantly higher than the dynamic tensile strength of concrete, the concrete near the free surface was damaged. Tensile cracks appeared at 15 ms, as shown in Figure 13b. The tensile cracks continued to form as time progressed. At 25 ms, cracks were fully developed along the longitudinal direction (Z direction) on the tunnel’s free surface, as shown in Figure 13c,d.

3.2. Damage Assessment

Initially, the impact of amplitude was investigated by subjecting four different loads, namely 5, 6, 7, and 8 m/s, to a loading frequency of 100 Hz. Figure 14 illustrates the structural damage of the tunnel at varying loading amplitudes. At 5 m/s load, the free field PPV is predicted to be 29.1 cm/s with 64 elements cracked, as shown in Figure 14a. The damage in the wall was observed to expand when the loading intensity was increased to 6 and 7 m/s, with estimated PPV values of 34.1 and 39.9 cm/s, respectively. As shown in Figure 14b,c, the number of cracked elements increased to 241 and 466, respectively. At a loading intensity of 8 m/s, the tunnel experienced damage on the left side of the arch foot, resulting in an increase in the number of cracked elements to 1264, as seen in Figure 14d. The PPV was then increased to 45.6 cm/s. This demonstrates that an increase in loading intensity has the potential to cause more damage to the tunnel.
Subsequently, an examination was conducted to assess the impact of blast wave frequency on the tunnel damage. A constant predicted free field PPV of 26 cm/s was being investigated for a total of five distant frequencies, namely 10, 21.5, 43, 86, and 100 Hz. It was observed that each frequency load had a distinct tunnel response for the same PPV. Figure 15 illustrates the damage pattern at various loading frequencies. The loading frequency of 100 Hz did not cause any damage. However, when the loading frequency was reduced to 86 Hz, damage was seen on the side wall of the tunnel. Damage increased at 43 and 21.5 Hz loading frequencies, as shown in Figure 15c,d. The 43 Hz load showed damage at the middle-left wall, whereas the 21.5 Hz load predicted damage at the toe of the floor. A load with a frequency of 10 Hz exhibited more damage compared to loads with higher frequencies, as shown in Figure 15e. At the same free field measured PPV, low frequency had a greater potential to damage the tunnel, while high frequency had a lower chance for damage. The location of the damage within the tunnel structure also varied based on the frequency of the blast wave.
The study results indicate that the loading intensity and frequency of blast waves significantly affected the extent of tunnel damage. An additional study is being performed to ascertain the threshold at which minor damage leads to the formation of cracks in the concrete tunnel.
A comprehensive set of analyses was conducted to examine the damage to the tunnel. The analysis focused on a blast load consisting of 10 distinct amplitudes with five varying frequencies. Figure 16 shows the predicted free field PPVs of all the analyses.
First, PPVs were predicted at which no damage had yet occurred. No damage occurred at PPVs of 25.57, 24.34, 20.5, 18.1, and 16.3 cm/s for frequencies of 100, 86, 43, 21.5, and 10 Hz, respectively, as shown in Figure 17. To determine the PPV at which cracks would begin, varying loading amplitudes were applied to various frequencies to define minor damage. At a frequency of 100 Hz, cracks formed at the PPV of 26.57 cm/s, resulting in the cracking of seven elements, as seen in Figure 18a. Cracks formed at the PPVs of 25.3 cm/s and 21.66 cm/s at 86 and 43 Hz frequencies, respectively, and 11 and 13 elements cracked in both frequencies, respectively. These frequency ranges caused damage specifically on the side wall of the tunnel that was directly exposed to the blast wave, as seen in Figure 18a–c. At a loading frequency of 21.5 Hz, it was anticipated that the damage would occur at a velocity of 19.1 cm/s, as shown in Figure 18d, resulting in the formation of nine cracked elements. This damage was specifically seen at the left arch foot of the tunnel. At a frequency of 10 Hz, damage was triggered at a velocity of 17.24 cm/s, resulting in the cracking of 12 elements. Figure 18e illustrates the damage pattern formation at the tunnel’s right arch foot. The predicted PPVs at which minor damage occurred are shown in Figure 17.
Additionally, the predicted PPVs in Figure 17 were also compared with the empirical models developed in China and South Korea. Both empirical models underestimated the allowable PPVs. The design code in South Korea permits a maximum PPV of 2 cm/s, regardless of the frequency effect. The design code in China takes the impact of frequency content into account, where for a frequency of ≤10 Hz, the allowable PPV is 12 cm/s, for 10–50 Hz, the allowable PPV is 12–15 cm/s, and for 50–100 Hz, the allowable PPV is 15–20 cm/s. However, the allowable PPVs in empirical models were found to be more conservative in contrast to the PPVs for No Damage, which were numerically predicted.
Equations (5) and (6) provide the best fitted curves in Figure 17 for Minor and No Damage states across a frequency range of 10 to 100 Hz.
P P V = 4.06 ln f + 7.16       ( 10   H z f 100   H z )
where PPV is peak particle velocity, cm/s; and f is the frequency of the blast wave, Hz.
The Equation (6) proposed for the No Damage state represents the ultimate Peak Particle Velocity (PPV) based on the site characteristics and structural configurations that have been taken into account.
P P V = 4.11 ln f + 5.96       ( 10   H z f 100   H z )
On the other hand, this Equation is enhanced for practical usage by adding a safety factor of 1.2 and 1.5, according to the safety requirement and the significance of the tunnel construction. Figure 19 depicts the best fitted curves for factors of safety of 1.2 and 1.5, which may be represented by Equations (7) and (8), respectively.
P P V = 3.42 ln f + 4.96       ( 10   H z f 100   H z )
P P V = 2.74 ln f + 3.96       ( 10   H z f 100   H z )
This study conducted numerical modeling to investigate the effect of blast load frequency and predict the minimum PPV at which the cracking of concrete tunnels starts. Previous studies have ignored the effect of frequency content and predicted underground tunnel damage based on intensity level, with varying distances between the tunnel and blast source and the tunnel shape effect. This study encompasses the use of different loading amplitudes with varying frequency content to examine the structural damage. The results show that higher loading intensities are associated with more tunnel damage, as shown by a rise in the number of cracked elements and peak particle velocity (PPV). Likewise, it has been shown that lower blast wave frequencies result in more damage than higher frequencies, with different areas of damage occurring inside the tunnel structure depending on the blast wave frequency.
The research categorized the structural damage of the tunnels into two distinct categories, namely No Damage and Minor Damage. The study included the prediction of No Damage (PPVs) and the identification of certain loading frequencies at which the cracks initiated. The findings indicate that the degree and placement of cracks inside the tunnel varied depending on the frequency of the blast wave, with distinct frequencies resulting in damage to certain sections of the tunnel’s framework. This study compared the predicted PPVs with empirical models derived from China and South Korea, therefore emphasizing disparities in the threshold PPVs for the No Damage state. The Korean code exhibited a more cautious approach in its forecasts when compared to the numerical outcomes. Two equations were proposed for a safety factor of 1.2 and 1.5 based on the No Damage state. These equations will provide a revised threshold for acceptable PPV that takes the selected safety level into account.
The scope of this study is limited to a large horseshoe-shaped tunnel cross-section that is surrounded by hard rock formations and features a tunnel lining of 0.3 m and with specific lining material properties. Determining damage based on PPVs and the frequency characteristics of blast waves is contingent upon several factors, such as site conditions, tunnel geometry, and the material properties of structure and rock. Further research is warranted to analyze the standards used to evaluate damage, which rely on the combination of PPV and blast wave frequency under different site conditions and tunnel configurations.

4. Conclusions

This study investigated the dynamic response of underground tunnels subjected to blasting loads using numerical simulation. A parallel twin tunnel scenario was used to investigate the damaging effect of concrete tunnels under blast waves with different loading frequencies. Parametric analyses were performed to assess the state of damage to the underground tunnel.
The following conclusions were drawn:
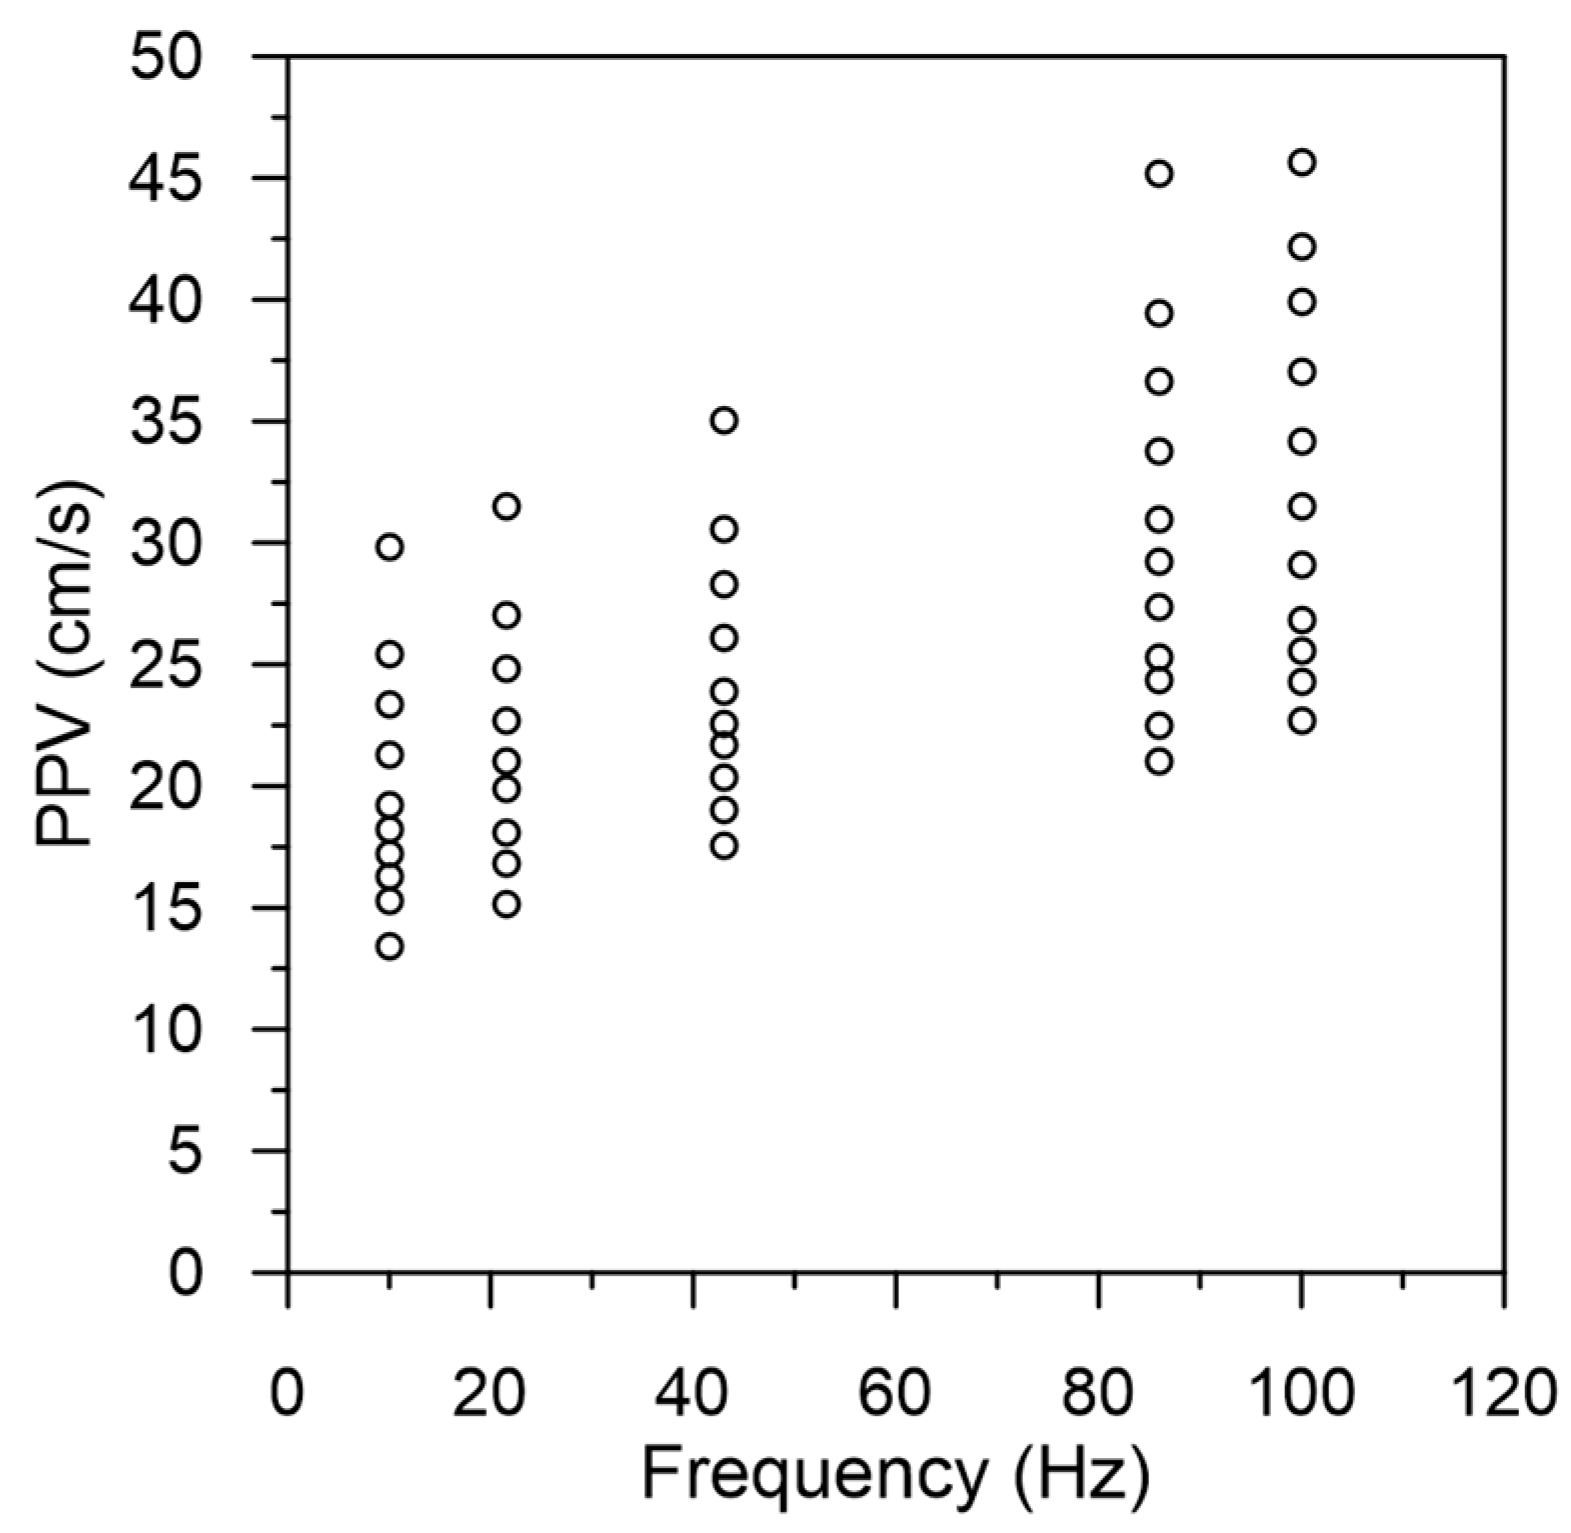
  • With the constant distance from the blast hole, PPV increased with the increasing amplitude. With the constant predicted PPV, decreasing frequency content of the blasting load increased damage to the tunnel.
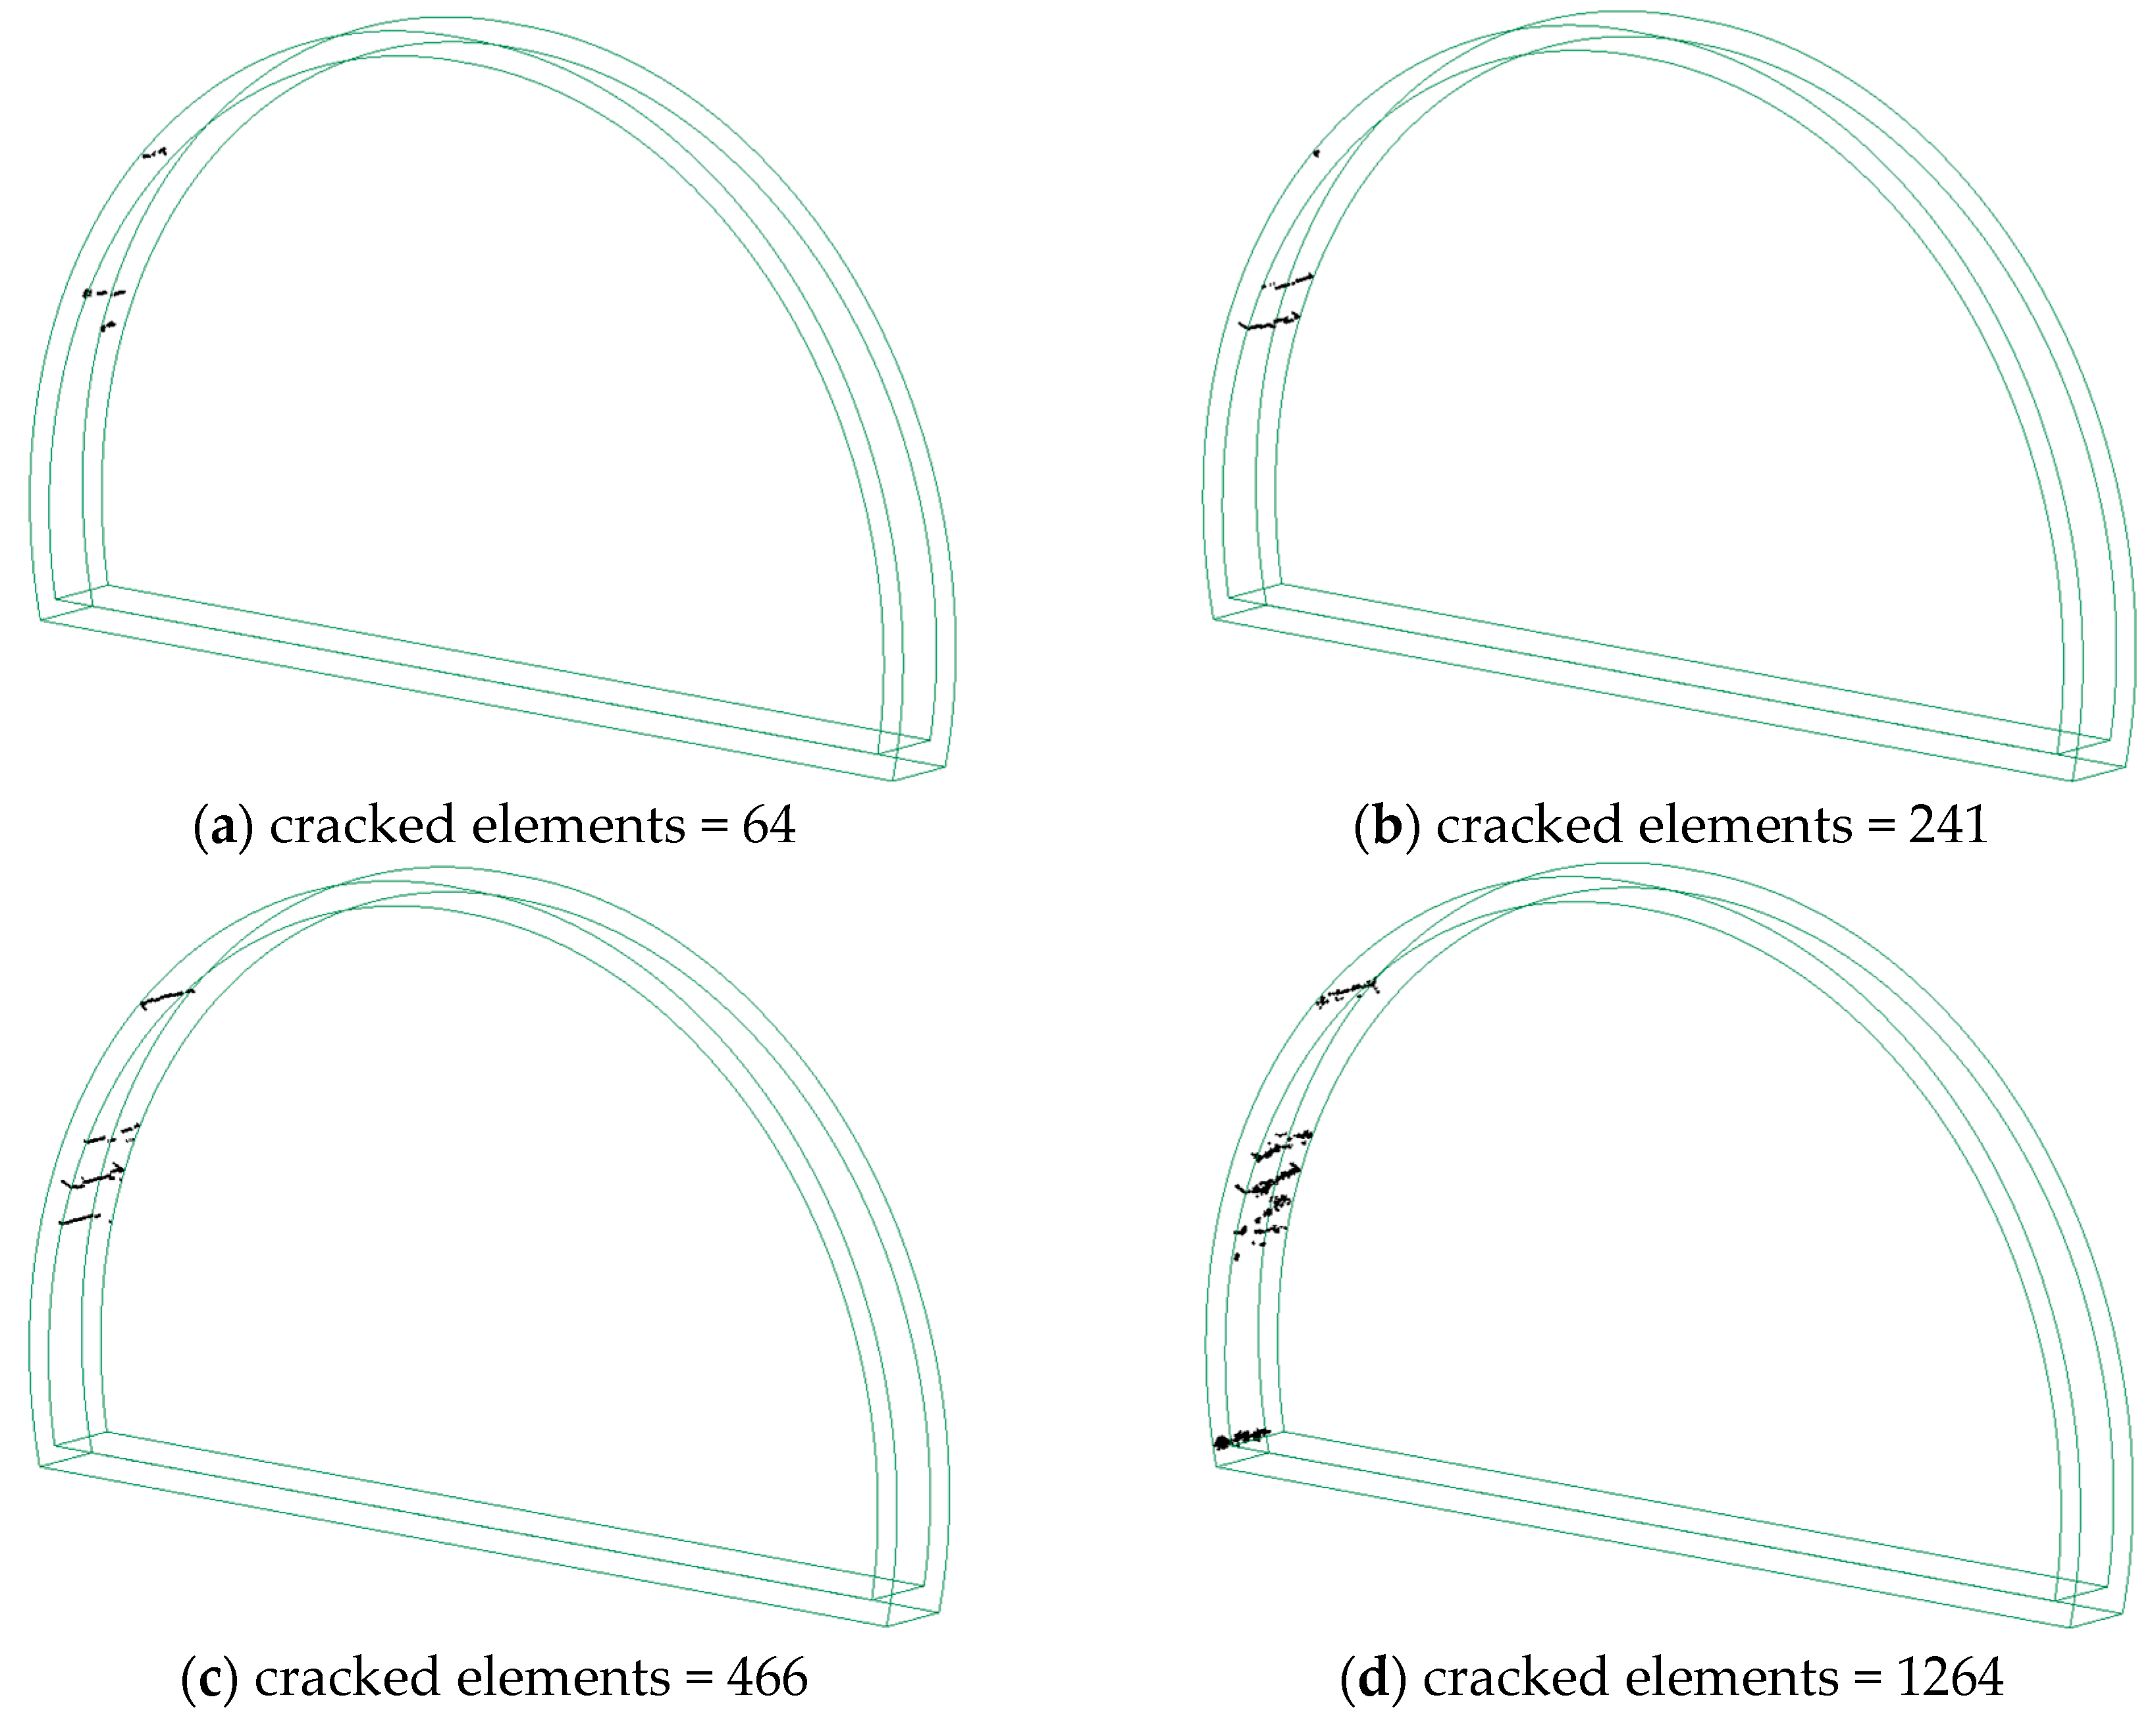
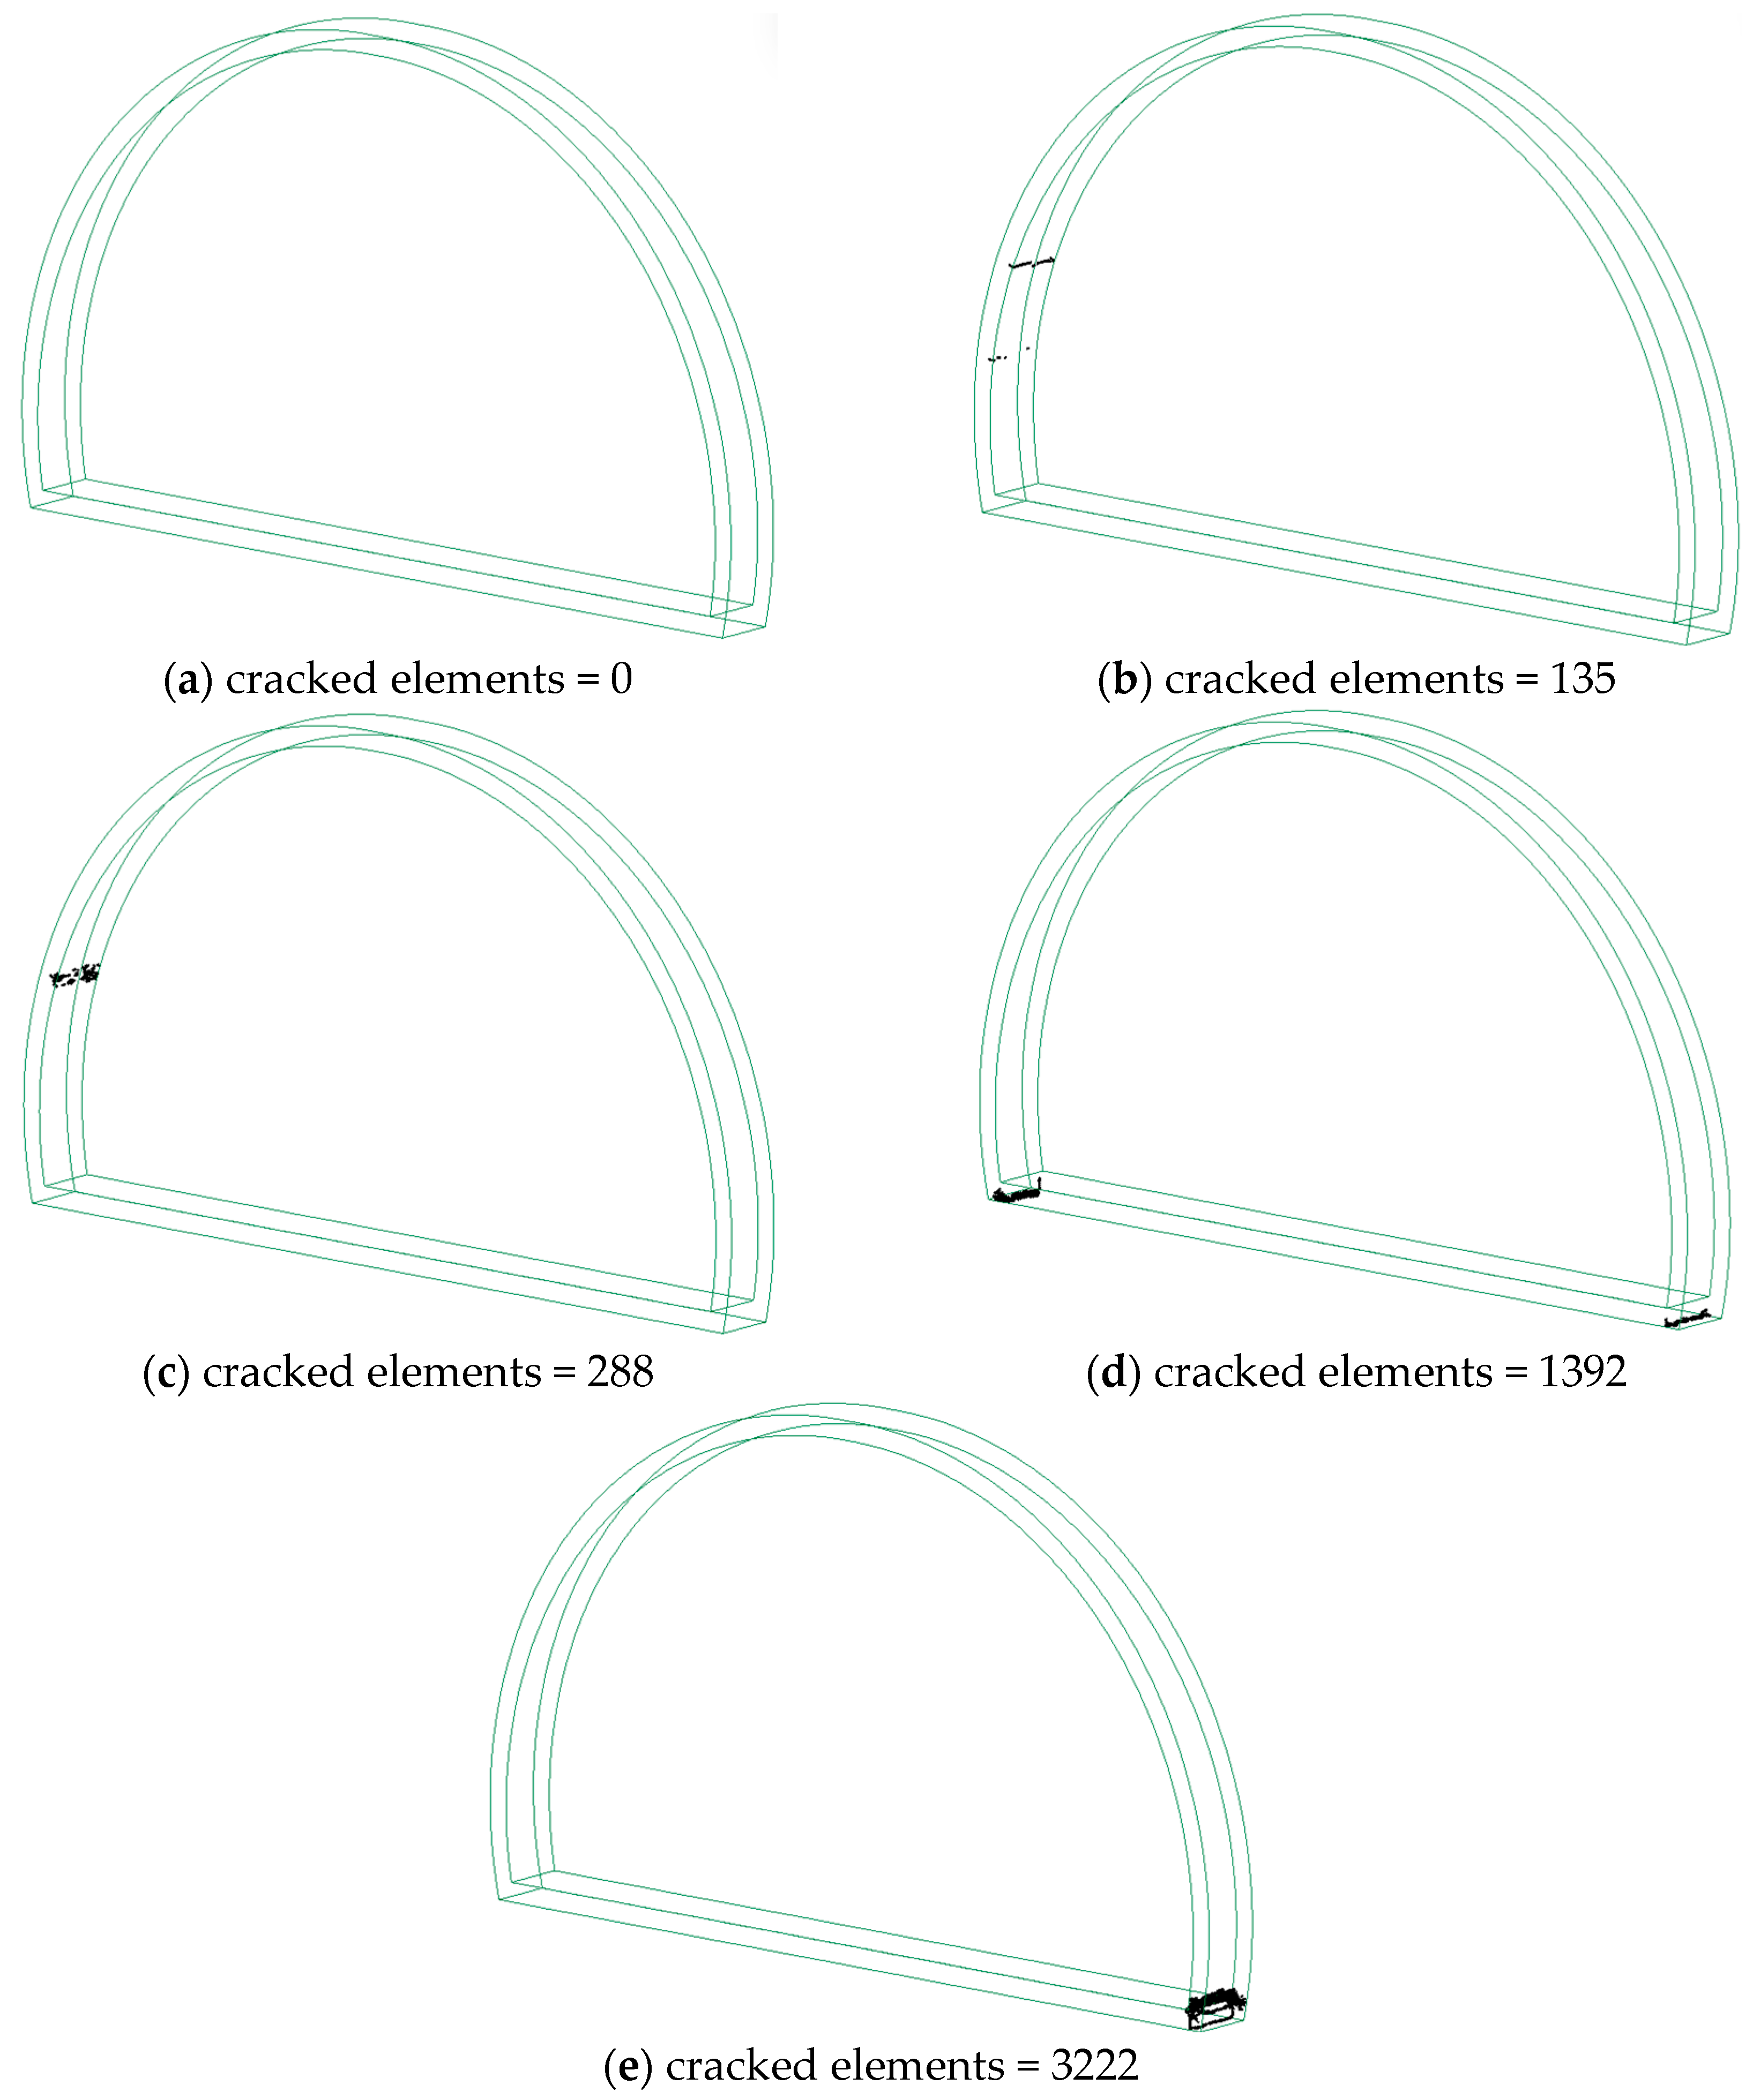
  • The concrete lining cracking was mainly seen on the left side of the wall for high-frequency loading, while low-frequency loading created damage to the floor and the toe of the tunnel. The tunnel exhibited a much greater extent of tensile damage than compression damage.
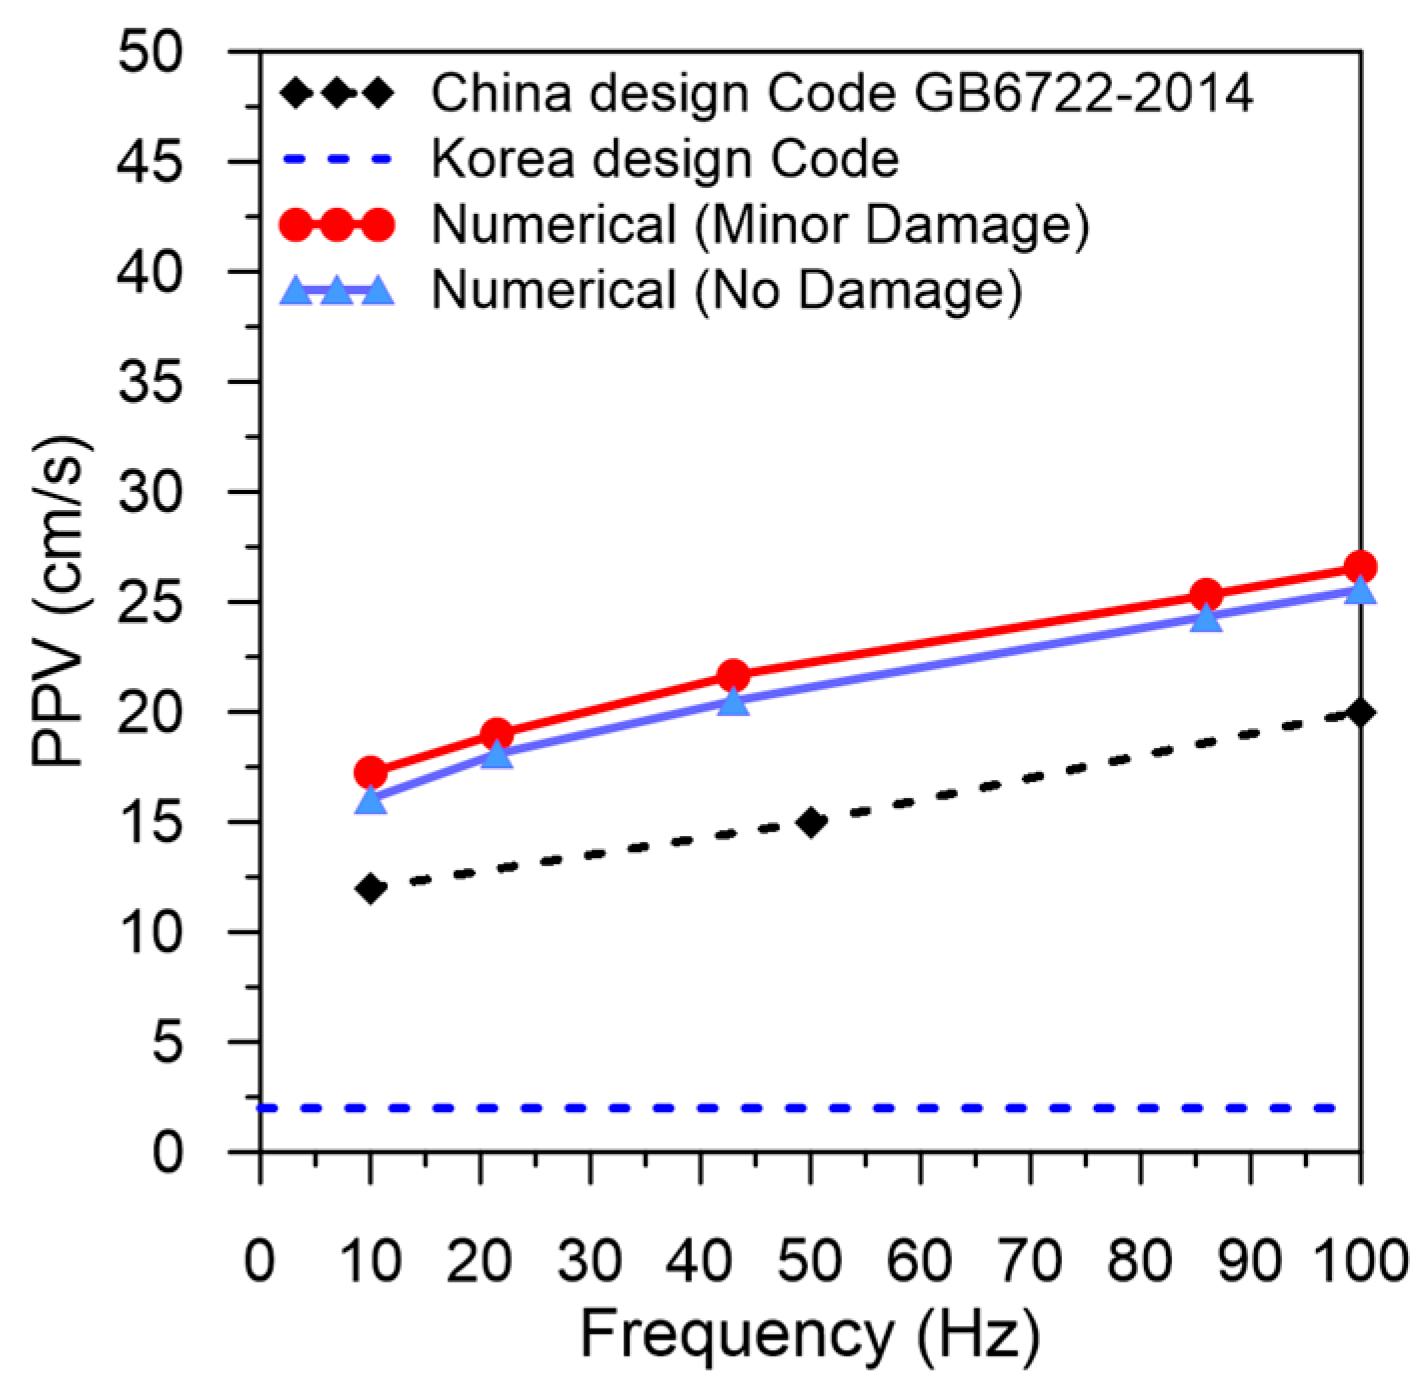
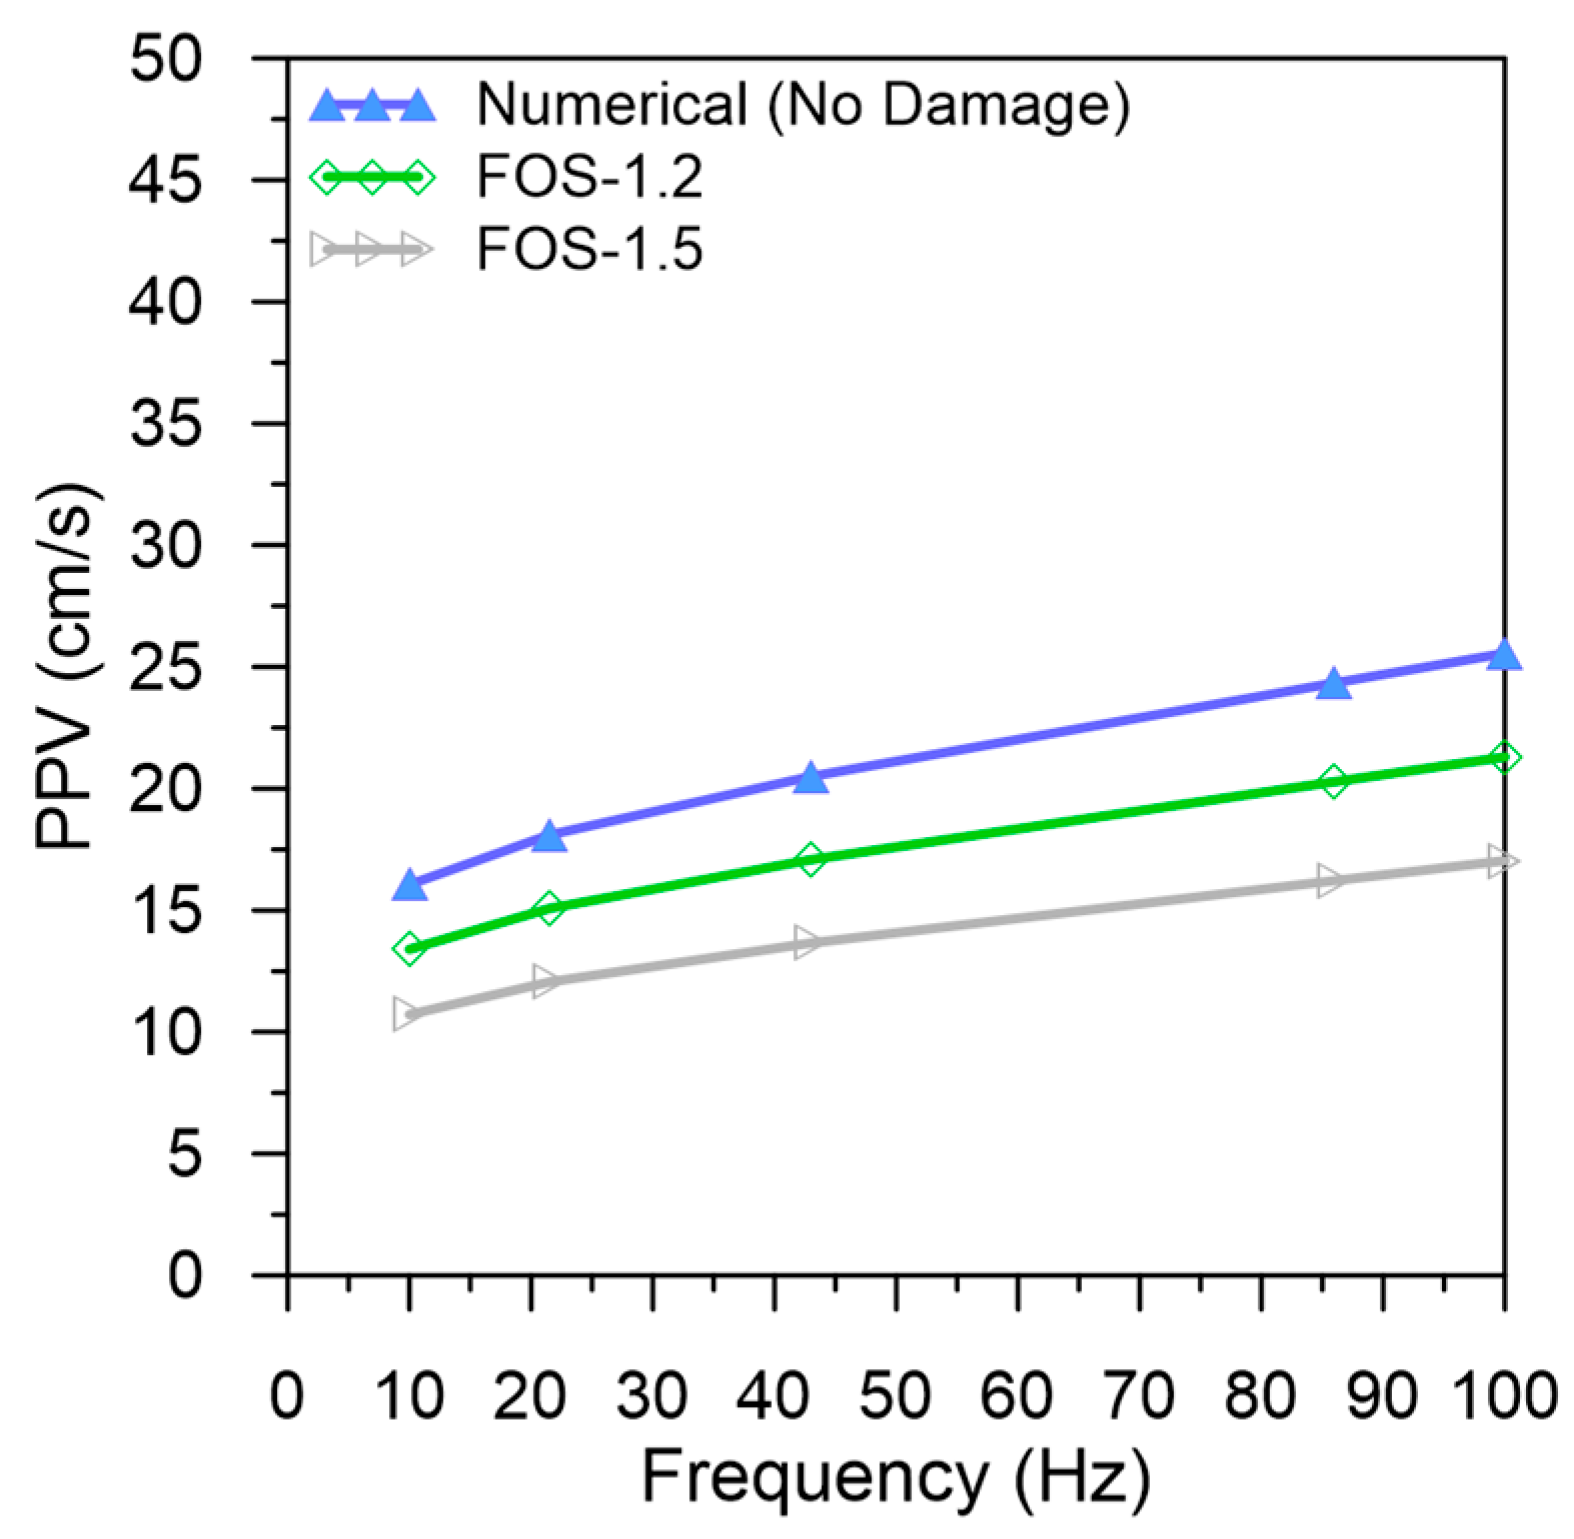
  • The PPVs for No Damage and Minor Damage states were predicted.
  • The damage prediction based on PPV combined with frequency was proposed, and their relationship with tunnel damage status from numerical simulation was established.
  • The assessment of tunnel damage based on proposed damage criteria with additional equations for a factor of safety might be broadly adopted by engineers to ensure an accurate design of the underground horseshoe-shaped drill-and-blast tunnel subjected to blast loads.
  • This study can be extended further by considering different types of site conditions with different tunnel types, lining thickness, and material properties.

Author Contributions

Conceptualization, D.P.; methodology, J.U.R.; software, J.U.R.; formal analysis, J.U.R.; data curation, J.U.R.; writing—original draft preparation, J.U.R.; writing—review and editing, D.P. and J.-K.A.; supervision, D.P. and J.-K.A.; funding acquisition, D.P. All authors have read and agreed to the published version of the manuscript.

Funding

The research is funded by National Research Foundation of Korea (NRF) grant funded by the Korea government (MSIT) (No. 2022R1A2C3003245).

Institutional Review Board Statement

Not applicable.

Informed Consent Statement

Not applicable.

Data Availability Statement

The raw data supporting the conclusions of this article will be made available by the authors on request.

Conflicts of Interest

The authors declare no conflicts of interest.

References

  1. Sharafat, A.; Tanoli, W.A.; Raptis, G.; Seo, J.W. Controlled Blasting in Underground Construction: A Case Study of a Tunnel Plug Demolition in the Neelum Jhelum Hydroelectric Project. Tunn. Undergr. Space Technol. 2019, 93, 103098. [Google Scholar] [CrossRef]
  2. Ainalis, D.; Kaufmann, O.; Tshibangu, J.-P.; Verlinden, O.; Kouroussis, G. Modelling the Source of Blasting for the Numerical Simulation of Blast-Induced Ground Vibrations: A Review. Rock Mech. Rock Eng. 2017, 50, 171–193. [Google Scholar] [CrossRef]
  3. Liang, Q.; Li, J.; Li, D.; Ou, E. Effect of Blast-Induced Vibration from New Railway Tunnel on Existing Adjacent Railway Tunnel in Xinjiang, China. Rock Mech. Rock Eng. 2013, 46, 19–39. [Google Scholar] [CrossRef]
  4. Cheng, R.; Chen, W.; Hao, H.; Li, J. Effect of Internal Explosion on Tunnel Secondary and Adjacent Structures: A Review. Tunn. Undergr. Space Technol. 2022, 126, 104536. [Google Scholar] [CrossRef]
  5. Shin, J.-H.; Moon, H.-G.; Chae, S.-E. Effect of Blast-Induced Vibration on Existing Tunnels in Soft Rocks. Tunn. Undergr. Space Technol. 2011, 26, 51–61. [Google Scholar] [CrossRef]
  6. Gb6722-2014; Safety Regulations for Blasting. China Water Power Press: Beijing, China, 2014.
  7. Zhou, Q.; He, H.; Liu, S.; Wang, P.; Zhou, Y.; Zhou, J.; Fan, H.; Jin, F. Evaluation of Blast-Resistant Ability of Shallow-Buried Reinforced Concrete Urban Utility Tunnel. Eng. Fail. Anal. 2021, 119, 105003. [Google Scholar] [CrossRef]
  8. Meng, F.; Jin, F.; Kong, X.; Zhou, J.; Guan, L.; Xu, Y.; Wang, W.; Zhou, Y.; Chen, H.; Geng, H. Field Test and Theoretical Analysis of a Large Underground Arch Structure Subjected to Buried Explosion. Structures 2023, 57, 105141. [Google Scholar] [CrossRef]
  9. Pan, Y.; Zong, Z.; Li, J.; Qian, H.; Wu, C. Investigating the Dynamic Response of a Double-Box Utility Tunnel Buried in Calcareous Sand against Ground Surface Explosion. Tunn. Undergr. Space Technol. 2024, 146, 105636. [Google Scholar] [CrossRef]
  10. Zhou, L.; Li, X.; Yan, Q.; Li, S.; Chang, S.; Ren, P. Test and Damage Assessment of Shallow Buried Rc Tunnel under Explosion. Undergr. Space 2024, 14, 118–137. [Google Scholar] [CrossRef]
  11. Qing, H.; Guangkun, L.; Wei, W.; Congkun, Z.; Xiaodong, S. Failure Mode and Damage Assessment of Underground Reinforced Concrete Arched Structure under Side Top Explosion. Structures 2024, 59, 105801. [Google Scholar] [CrossRef]
  12. Zhao, D.; Huang, Y.; Chen, X.; Han, K.; Chen, C.; Zhao, X.; Chen, W. Numerical Investigations on Dynamic Responses of Subway Segmental Tunnel Lining Structures under Internal Blasts. Tunn. Undergr. Space Technol. 2023, 135, 105058. [Google Scholar] [CrossRef]
  13. Xia, X.; Li, H.; Li, J.; Liu, B.; Yu, C. A Case Study on Rock Damage Prediction and Control Method for Underground Tunnels Subjected to Adjacent Excavation Blasting. Tunn. Undergr. Space Technol. 2013, 35, 1–7. [Google Scholar] [CrossRef]
  14. Liu, Z.; Jiang, N.; Sun, J.; Xia, Y.; Lyu, G. Influence of Tunnel Blasting Construction on Adjacent Highway Tunnel: A Case Study in Wuhan, China. Int. J. Prot. Struct. 2020, 11, 283–303. [Google Scholar] [CrossRef]
  15. Zhang, Z.; Zhou, C.; Remennikov, A.; Wu, T.; Lu, S.; Xia, Y. Dynamic Response and Safety Control of Civil Air Defense Tunnel under Excavation Blasting of Subway Tunnel. Tunn. Undergr. Space Technol. 2021, 112, 103879. [Google Scholar] [CrossRef]
  16. Yang, F.; Jiang, N.; Zhou, C.; Lyu, G.; Yao, Y. Dynamic Response and Safety Control of Civil Air Defense Tunnel Group during the Whole Process of Underpass Tunnel Blasting Excavation. Int. J. Prot. Struct. 2023, 14, 483–508. [Google Scholar] [CrossRef]
  17. Mussa, M.H.; Mutalib, A.A.; Hamid, R.; Naidu, S.R.; Radzi, N.A.M.; Abedini, M. Assessment of Damage to an Underground Box Tunnel by a Surface Explosion. Tunn. Undergr. Space Technol. 2017, 66, 64–76. [Google Scholar] [CrossRef]
  18. Koneshwaran, S.; Thambiratnam, D.P.; Gallage, C. Blast Response and Failure Analysis of a Segmented Buried Tunnel. Struct. Eng. Int. 2015, 25, 419–431. [Google Scholar] [CrossRef]
  19. Rashiddel, A.; Kharghani, M.; Dias, D.; Hajihassani, M. Numerical Study of the Segmental Tunnel Lining Behavior under a Surface Explosion–Impact of the Longitudinal Joints Shape. Comput. Geotech. 2020, 128, 103822. [Google Scholar] [CrossRef]
  20. Yang, G.; Wang, G.; Lu, W.; Yan, P.; Chen, M. Damage Assessment and Mitigation Measures of Underwater Tunnel Subjected to Blast Loads. Tunn. Undergr. Space Technol. 2019, 94, 103131. [Google Scholar] [CrossRef]
  21. Jiang, N.; Zhou, C. Blasting Vibration Safety Criterion for a Tunnel Liner Structure. Tunn. Undergr. Space Technol. 2012, 32, 52–57. [Google Scholar] [CrossRef]
  22. Xiong, L.; Jiang, N.; Zhou, C.; Li, H. Dynamic Response Characteristics of Adjacent Tunnel Lining under Blasting Impact in Subway Connecting Passage. Int. J. Prot. Struct. 2023, 14, 87–106. [Google Scholar] [CrossRef]
  23. Xia, J.; Wang, B.; Guo, X.; Xie, Z. Vibration Response and Safety Control for Blasting Vibration of the Existing Tunnel with Defects. Undergr. Space 2024, 15, 76–89. [Google Scholar] [CrossRef]
  24. Chopra, A. Structural Dynamics: Theory and Applications to Earthquake Engineering, 2nd ed.; Prentice Hall: Bergen County, NJ, USA, 2001. [Google Scholar]
  25. Nguyen, V.-Q.; Nizamani, Z.A.; Park, D.; Kwon, O.-S. Numerical Simulation of Damage Evolution of Daikai Station during the 1995 Kobe Earthquake. Eng. Struct. 2020, 206, 110180. [Google Scholar] [CrossRef]
  26. Ahn, J.K.; Park, D. Prediction of near-Field Wave Attenuation Due to a Spherical Blast Source. Rock Mech. Rock Eng. 2017, 50, 3085–3099. [Google Scholar] [CrossRef]
  27. Schwer, L. An Introduction to the Winfrith Concrete Model; Schwer Engineering & Consulting Services: Windsor, CA, USA, 2010; pp. 1–28. [Google Scholar]
  28. Ye, X.; Zhao, C.; He, K.; Zhou, L.; Li, X.; Wang, J. Blast Behaviors of Precast Concrete Sandwich Eps Panels: Fem and Theoretical Analysis. Eng. Struct. 2021, 226, 111345. [Google Scholar] [CrossRef]
  29. Nguyen, V.-Q.; Lee, Y.-G.; Park, D. Seismic Damage Evaluation of Double-Box Metro Tunnel Accounting for Soil Stiffness Using Three-Dimensional Finite Element Analysis. Structures 2023, 50, 1584–1597. [Google Scholar] [CrossRef]
  30. LSTC. LS-DYNA Keyword User’s Manual Version 971; LSTC: Livermore, CA, USA, 2007. [Google Scholar]
  31. Thai, D.-K.; Nguyen, D.-L.; Pham, T.-H.; Doan, Q.H. Prediction of Residual Strength of Frc Columns under Blast Loading Using the Fem Method and Regression Approach. Constr. Build. Mater. 2021, 276, 122253. [Google Scholar] [CrossRef]
  32. Jones, N. Structural Impact; Cambridge University Press: Cambridge, UK, 2011. [Google Scholar]
  33. Torano, J.; Rodríguez, R.; Diego, I.; Rivas, J.M.; Casal, M.D. Fem Models Including Randomness and Its Application to the Blasting Vibrations Prediction. Comput. Geotech. 2006, 33, 15–28. [Google Scholar] [CrossRef]
  34. Lu, W.; Yang, J.; Chen, M.; Zhou, C. An Equivalent Method for Blasting Vibration Simulation. Simul. Model. Pract. Theory 2011, 19, 2050–2062. [Google Scholar] [CrossRef]
  35. Fan, S.C.; Jiao, Y.Y.; Zhao, J. On Modelling of Incident Boundary for Wave Propagation in Jointed Rock Masses Using Discrete Element Method. Comput. Geotech. 2004, 31, 57–66. [Google Scholar] [CrossRef]
  36. ISO 4866:2010; Mechanical Vibration and Shock, Vibration of Fixed Structures, Guidelines for the Measurement of Vibrations and Evaluation of Their Effects on Structures. International Organisation for Standardisation ISO: Geneva, Switzerland, 2010.
  37. Blair, D.P. Acoustic Pulse Transmission in Half-Spaces and Finite-Length Cylindrical Rods. Geophysics 1985, 50, 1676–1683. [Google Scholar] [CrossRef]
  38. Qian, H.; Zong, Z.; Wu, C.; Li, J.; Gan, L. Numerical Study on the Behavior of Utility Tunnel Subjected to Ground Surface Explosion. Thin-Walled Struct. 2021, 161, 107422. [Google Scholar] [CrossRef]
  39. Dowding, C.H. Construction Vibrations; Prentice Hall Inc.: Englewood Cliffs, NJ, USA, 1996. [Google Scholar]
  40. Kim, D.-S.; Lee, J.-S. Propagation and Attenuation Characteristics of Various Ground Vibrations. Soil Dyn. Earthq. Eng. 2000, 19, 115–126. [Google Scholar] [CrossRef]
  41. Nelson, J.T.; Saurenman, H.J.; Wilson, I. State-of-the-Art Review: Prediction and Control of Groundborne Noise and Vibration from Rail Transit Trains; U.S. Department of Transportation; Urban Mass Transportation Administration: Washington, DC, USA, 1983. [Google Scholar]
Figure 1. Cross-section and reinforcement of a horseshoe-shaped tunnel (unit mm): (a) Tunnel geometry and (b) reinforcement of tunnel.
Applsci 14 06152 g001
Figure 2. Numerical model.
Applsci 14 06152 g002
Figure 3. Finite element model of concrete and steel rebars: (a) concrete and (b) steel rebars.
Applsci 14 06152 g003
Figure 4. Material models of reinforcement concrete structure: (a) concrete and (b) steel rebars.
Applsci 14 06152 g004
Figure 5. Velocity time history as input blasting load.
Applsci 14 06152 g005
Figure 6. Effect of mesh size on response of wave propagation.
Applsci 14 06152 g006
Figure 7. Effect of mesh size on damage pattern: (a) 100 mm; (b) 75 mm; (c) 50 mm; and (d) 25 mm.
Applsci 14 06152 g007
Figure 8. Comparison of numerical versus far-field theoretical solution for Vp = 4000 (m/s): (a) 0% damping; (b) 5% damping.
Applsci 14 06152 g008
Figure 9. Blast-induced wave propagation in rock medium at different time steps: (a) 2.5 ms; (b) 6.4 ms; (c) 10.4 ms; (d) 13 ms.
Applsci 14 06152 g009aApplsci 14 06152 g009b
Figure 10. Kinetic energy time history of RC tunnel.
Applsci 14 06152 g010
Figure 11. Blast-induced wave propagation with RC tunnel at different time steps: (a) 2.5 ms; (b) 6.4 ms; (c) 10.4 ms; (d) 13 ms.
Applsci 14 06152 g011aApplsci 14 06152 g011b
Figure 12. Resultant velocity and displacement time histories of the tunnel at selected points: (a) resultant velocity; (b) resultant displacement.
Applsci 14 06152 g012
Figure 13. Damage state of the underground RC tunnel at different time steps: (a) 10.2 ms; (b) 15 ms; (c,d) 25 ms.
Applsci 14 06152 g013aApplsci 14 06152 g013b
Figure 14. Damage prediction at different loading amplitudes: (a) 5 m/s; (b) 6 m/s; (c) 7 m/s; (d) 8 m/s.
Applsci 14 06152 g014
Figure 15. Damage prediction at different loading frequencies at a constant PPV of 26 cm/s: (a) 100 Hz; (b) 86 Hz; (c) 43 Hz; (d) 21.5 Hz; (e) 10 Hz.
Applsci 14 06152 g015
Figure 16. Parametric analysis results for different amplitudes.
Applsci 14 06152 g016
Figure 17. Predicted PPV for Minor and No damage at different loading frequencies.
Applsci 14 06152 g017
Figure 18. Minor damage at different loading frequencies: (a) 100 Hz; (b) 86 Hz; (c) 43 Hz; (d) 21.5 Hz; (e) 10 Hz.
Applsci 14 06152 g018
Figure 19. Comparison of No damage state with Proposed factor of safety.
Applsci 14 06152 g019
Table 1. Model and input parameters for concrete [29].
MaterialMaterial ModelParameterValue
ConcreteWinfrith_ConcreteMass density (kg/m3)2500
Elastic modulus, E (GPa)24.8
Poisson’s ratio0.17
Uniaxial compressive strength, fc (MPa)27.5
Uniaxial tensile strength, ft (MPa)3.2
Axial strain at compressive strength, εc1 (%)0.22
Axial strain at tensile strength, εck1 (%)0.03
Ultimate strain value, εo (%)0.14
Table 2. Model and input parameters for steel [29].
MaterialMaterial ModelParameterValue
Steel rebarPlastic_KinematicMass density (kg/m3)7800
Elastic modulus, E (GPa)200
Tangent modulus, Et (GPa)0.4
Poisson’s ratio0.3
Yield strength, fy (MPa)413
Yield strain, εy (%)0.20
Ultimate strength, fu (MPa)620
Ultimate strain, εu (%)20
Table 3. Models and input parameters for rock.
MaterialMaterial ModelParameterValue
RockElasticMass density (kg/m3)2500
Elastic modulus, E (GPa)33.3
Poisson’s ratio0.25
P-wave velocity, Vp4000
S-wave velocity, Vs2309
Disclaimer/Publisher’s Note: The statements, opinions and data contained in all publications are solely those of the individual author(s) and contributor(s) and not of MDPI and/or the editor(s). MDPI and/or the editor(s) disclaim responsibility for any injury to people or property resulting from any ideas, methods, instructions or products referred to in the content.

