Article

A Study on the Comfort Level of Standing Chairs Based on Pressure Sensors and sEMG

by
Wenyan Zhang
1,2,
Yao Liu
3,*,
Chunjie Chen
3 and
Chen Fan
1,2
1
Department of Mechanical Engineering, Xi’an Jiaotong University City College, Xi’an 710018, China
2
Engineering Research Center of Robot and Intelligent Manufacturing, Universities of Shaanxi Province, Xi’an 710018, China
3
Shenzhen Institute of Advanced Technology, Chinese Academy of Sciences, Shenzhen 518055, China
*
Author to whom correspondence should be addressed.
Appl. Sci. 2024, 14(14), 6009; https://doi.org/10.3390/app14146009
Submission received: 30 May 2024 / Revised: 4 July 2024 / Accepted: 5 July 2024 / Published: 10 July 2024

Abstract

:

Featured Application

Most existing research centers on examining the effects of sit–stand desks on sitting and standing positions, often overlooking the influence of the workplace environment and seat tilt angles on comfort. This study develops and constructs a model of a standing desk chair to address this gap and explores how seat tilt angles and various task conditions impact chair comfort. In this article, researchers adopt an innovative approach to evaluate the comfort of standing desk chairs, integrating the analysis of pressure distribution and electromyography signals. This holistic method not only delivers an objective assessment of chair comfort but also sheds light on how chairs affect muscle activity. Through the analysis of pressure distribution, researchers gain insight into how standing desk chairs support different body parts, enabling evaluation of their overall comfort and supportiveness. Furthermore, by incorporating electromyography signal analysis, researchers delve into the impact of chairs on muscle activity, thereby facilitating a more comprehensive evaluation of chair comfort. The distinctiveness of this integrated analytical approach lies in its consideration of both pressure distribution on the seated body and changes in muscle activity, resulting in a thorough and precise assessment of chair comfort. This research methodology provides valuable insights and guidance for the design and enhancement of standing desk chairs, ultimately improving user comfort and satisfaction.

Abstract

This study explores the health consequences of prolonged sitting by introducing a standing chair and examining the effects of seat tilt angles on comfort. Using synchronized pressure distribution testing and surface electromyographic (sEMG) signal analysis, we assessed pressure and sEMG responses at tilt angles of 0°, 20°, and 40° during tasks such as computer work, writing, and ironing. Initial measurements with body pressure distribution sensors targeted the buttocks and feet, while surface electromyographic equipment captured signals from the bilateral lumbar erector spinae, vastus lateralis, and gastrocnemius muscles. MATLAB processing facilitated the analysis of integrated electromyographic values and mean power frequencies, elucidating the effects of tilt angles on comfort. Our research findings indicate that a 20° tilt angle significantly enhances comfort during computer and writing tasks and noticeably increases the comfort of the erector spinae muscles during ironing. Conversely, a 0° tilt angle is more beneficial for the vastus lateralis and gastrocnemius muscles. These results underscore the importance of selecting appropriate tilt angles to improve comfort across various tasks. Furthermore, integrating pressure sensors and surface electromyographic signals enables a comprehensive evaluation of chair ergonomic quality, offering valuable insights for chair design optimization.

1. Introduction

In daily work environments, employees usually maintain a standing or sitting position [1]. However, sitting or standing for a long period may cause significant health risks. Prolonged sitting is linked to various musculoskeletal disorders [2], and “Life” magazine listed prolonged sedentary behavior as the third most unhealthy lifestyle in 2011. Similarly, prolonged standing can lead to lower back pain [3], while extended sitting can cause discomfort in the lower limbs [4] and chronic venous disease [5]. To mitigate these issues, individuals may take voluntary breaks [6] or use treadmill desks [7], although these breaks are typically brief. Various sit–stand desk converters are available to alleviate the discomfort of prolonged sitting and standing. Sit–stand chairs have been widely adopted [8], but most studies have focused on sit–stand converters without examining the influence of work environment and seat incline angle on comfort levels.
Bendix et al. [9] found that saddle chairs with backrests received higher subjective ratings and exhibited lower peak trapezius muscle activity compared with standing and sitting. Buchman-Pearle et al. [10] examined sex differences in neutral zone lumbar stiffness and lumbar and trunk–thigh angle boundaries to determine whether the standing lumbar angle falls within the neutral zone. They found that males exhibited significantly greater extensor stiffness. The neutral zone lumbar angle ranged from 22.2° to 0.2° for males and 17.8° to 1.3° for females, while the trunk–thigh angle ranged from 124.2° to 159.6° for males and 143.2° to 159.5° for females. Additionally, 44% of participants had standing lumbar angles outside the neutral zone. These findings are crucial for the design of hybrid posture chairs and provide essential kinematic parameters for comfort studies on standing chairs based on pressure sensors and sEMG.
Antle et al. [11] analyzed muscle parameters of the trunk, neck, shoulders, and buttocks in standing chair mode and investigated their overall comfort. Gao and colleagues [12] performed a comparative analysis to investigate the impact of seated versus sit–stand workstations on muscle activity patterns and spinal shrinkage among office workers. It was found that the sit-to-stand workstation promoted less inactivity and more light muscle activity time, without negatively affecting spinal contraction. Gao and colleagues [13] assert unequivocally that mitigating prolonged sitting during work hours can yield substantial increases in adjusted life years and life expectancy. This finding underscores the cost-effectiveness and profound significance of interventions aimed at reducing sedentary behavior in promoting public health. Zhu and colleagues [14] employed activPAL3c to assess sitting, standing, and other physical activity durations, alongside cardiac metabolic biomarkers and work efficiency. Their investigation revealed that embracing a standing posture effectively diminishes both workplace and overall daily sitting durations, while concurrently elevating standing periods in real-world settings. These findings underscore the role of standing interventions in alleviating the deleterious effects of prolonged sitting on human health. In light of the existing literature, it is evident that a variety of standing desk converters are readily accessible in the market, catering to the need for mitigating prolonged sitting and standing. Sit–stand desks have garnered widespread acceptance [8]. Consequently, there is a strong rationale for delving deeper into how the angle of standing chairs influences comfort.
The purpose of this study is to utilize standing chairs with varying seat angles to measure participants’ pressure distribution and muscle activity. By comparing these parameters across different seat angles and task environments, this study aims to conduct a comprehensive analysis of the advantages and disadvantages of different postures. This analysis will help determine which seat angle is the most suitable for specific work tasks, providing valuable insights for research on human seated posture comfort and optimization of standing chair designs.
Through an extensive review of the literature, we identified a plethora of objective evaluation methods for assessing seating comfort. For instance, the studies by Rao et al. [15], Makhsous et al. [16], and Ahmadian et al. [17] employ distinct methodologies, such as static balance models, pressure distribution analysis, and uniform pressure metrics, respectively. While each method offers unique insights, the lack of standardization across studies poses a challenge for comparative analysis. The diversity in experimental designs and measurement techniques complicates the synthesis of findings and the establishment of universally applicable conclusions. Matsushita and colleagues [18] conducted a study in which participants underwent a one-hour seating session, with seating comfort assessments conducted every five minutes. Their survey indicates that the ratio of sitting duration to contact area and high-pressure area is an effective method for assessing chair comfort.
Fasulo et al. [19] and Kingma et al. [20] focus on movement thresholds and muscle activation, respectively, emphasizing the interplay between posture and discomfort. These studies effectively illustrate how dynamic seating conditions can affect comfort. However, the reliance on pressure mats and electromyography (EMG) for movement and muscle activity analysis may not fully capture the complex interactions between different body parts and the seating surface. Weston and colleagues [21], in their examination of surface electromyography signals among seated individuals, observed a direct relationship between prolonged sitting duration and heightened activity levels in the back and shoulders. These elevated activity levels demonstrate a notable correlation with the experience of sitting discomfort.
Gold and colleagues [22] employed passive motion analysis to examine the average joint angles during task execution and assessed post-task comfort using body mapping techniques. Wang and colleagues [23] conducted motion capture experiments on seated human posture using the Vicon system, with each participant undergoing a 30 min measurement session. Their findings revealed a significant increase in trunk movement frequency with prolonged sitting. Sánchez and colleagues [24] introduced a method for assessing sitting comfort through video recording and analysis, focusing on numerical measurements of head and trunk positions during seated posture. Their approach involved the utilization of 3D motion capture technology and camera recordings to collect data from participants during both static and dynamic experiments.
Dong and colleagues [25] introduce biomechanical random response analysis with finite element models, offering a sophisticated method for simulating human–seat interactions under various conditions. This approach is innovative but may be limited by the assumptions and simplifications inherent in finite element modeling. The accuracy of such models heavily depends on the quality of the input data and the fidelity of the human body representation. Enhancing model precision through more detailed anatomical and material properties would improve the reliability of this method. Dong [26] integrated body pressure distribution testing with subjective evaluation to investigate the comfort of a concubine chair’s backrest. Furthermore, Lu et al. [27] assessed comfort by extracting muscle fatigue characteristics from electromyographic signals. The study evaluates muscle activity and postural changes during prolonged sitting on a novel sit–stand stool, utilizing surface electromyography (sEMG) technology. Barroso and colleagues [28] conducted an in-depth study on the ergonomic impact of different sitting posture designs on muscle activity patterns. Bagherzadeh [29] synthesized the results of electromyography studies, systematically reviewing and conducting a meta-analysis on trunk muscle activation while sitting on stable and unstable surfaces. This provided valuable insights for the ergonomic evaluation of sit-stand chairs. Guan et al. [30] utilized human pressure and surface electromyography signals to study comfort during the transfer process of a dual-arm nursing robot. Although our standing chair is unrelated to this robot, this method can be applied to the study of chair comfort, playing a crucial role in our research.

2. Materials and Methods

2.1. Research Methods

The pressure distribution between the human–chair interface is recognized as a crucial objective indicator of seat comfort [31,32,33]. By attaching sensors to the surface of a sit-stand chair, researchers can monitor real-time pressure distribution during the sitting-to-standing transition, thereby assessing the chair’s comfort. Analyzing these pressure distribution maps enables researchers to evaluate the design rationality of sit–stand chairs and refine their structure and materials for enhanced comfort. However, it is worth noting that pressure sensors only provide data related to pressure and do not capture information on muscle activity or attention allocation.
Surface electromyography (sEMG) signals are a noninvasive technique used to measure muscle activity by placing electrodes on the surface of muscles to capture electrical activity. In studies related to the comfort of sit–stand chairs, researchers can employ sEMG technology to evaluate the influence of different sitting postures and standing durations on muscle activity. By analyzing muscle activity patterns and intensity, researchers can determine whether sit–stand chair designs meet ergonomic standards and provide insights for improving these chairs. Notably, the process of collecting sEMG signals is noninvasive and safe for users, as it does not require skin penetration. Furthermore, sEMG signals can delineate the intensity, pattern, and fatigue level of muscle activity, providing comprehensive information.
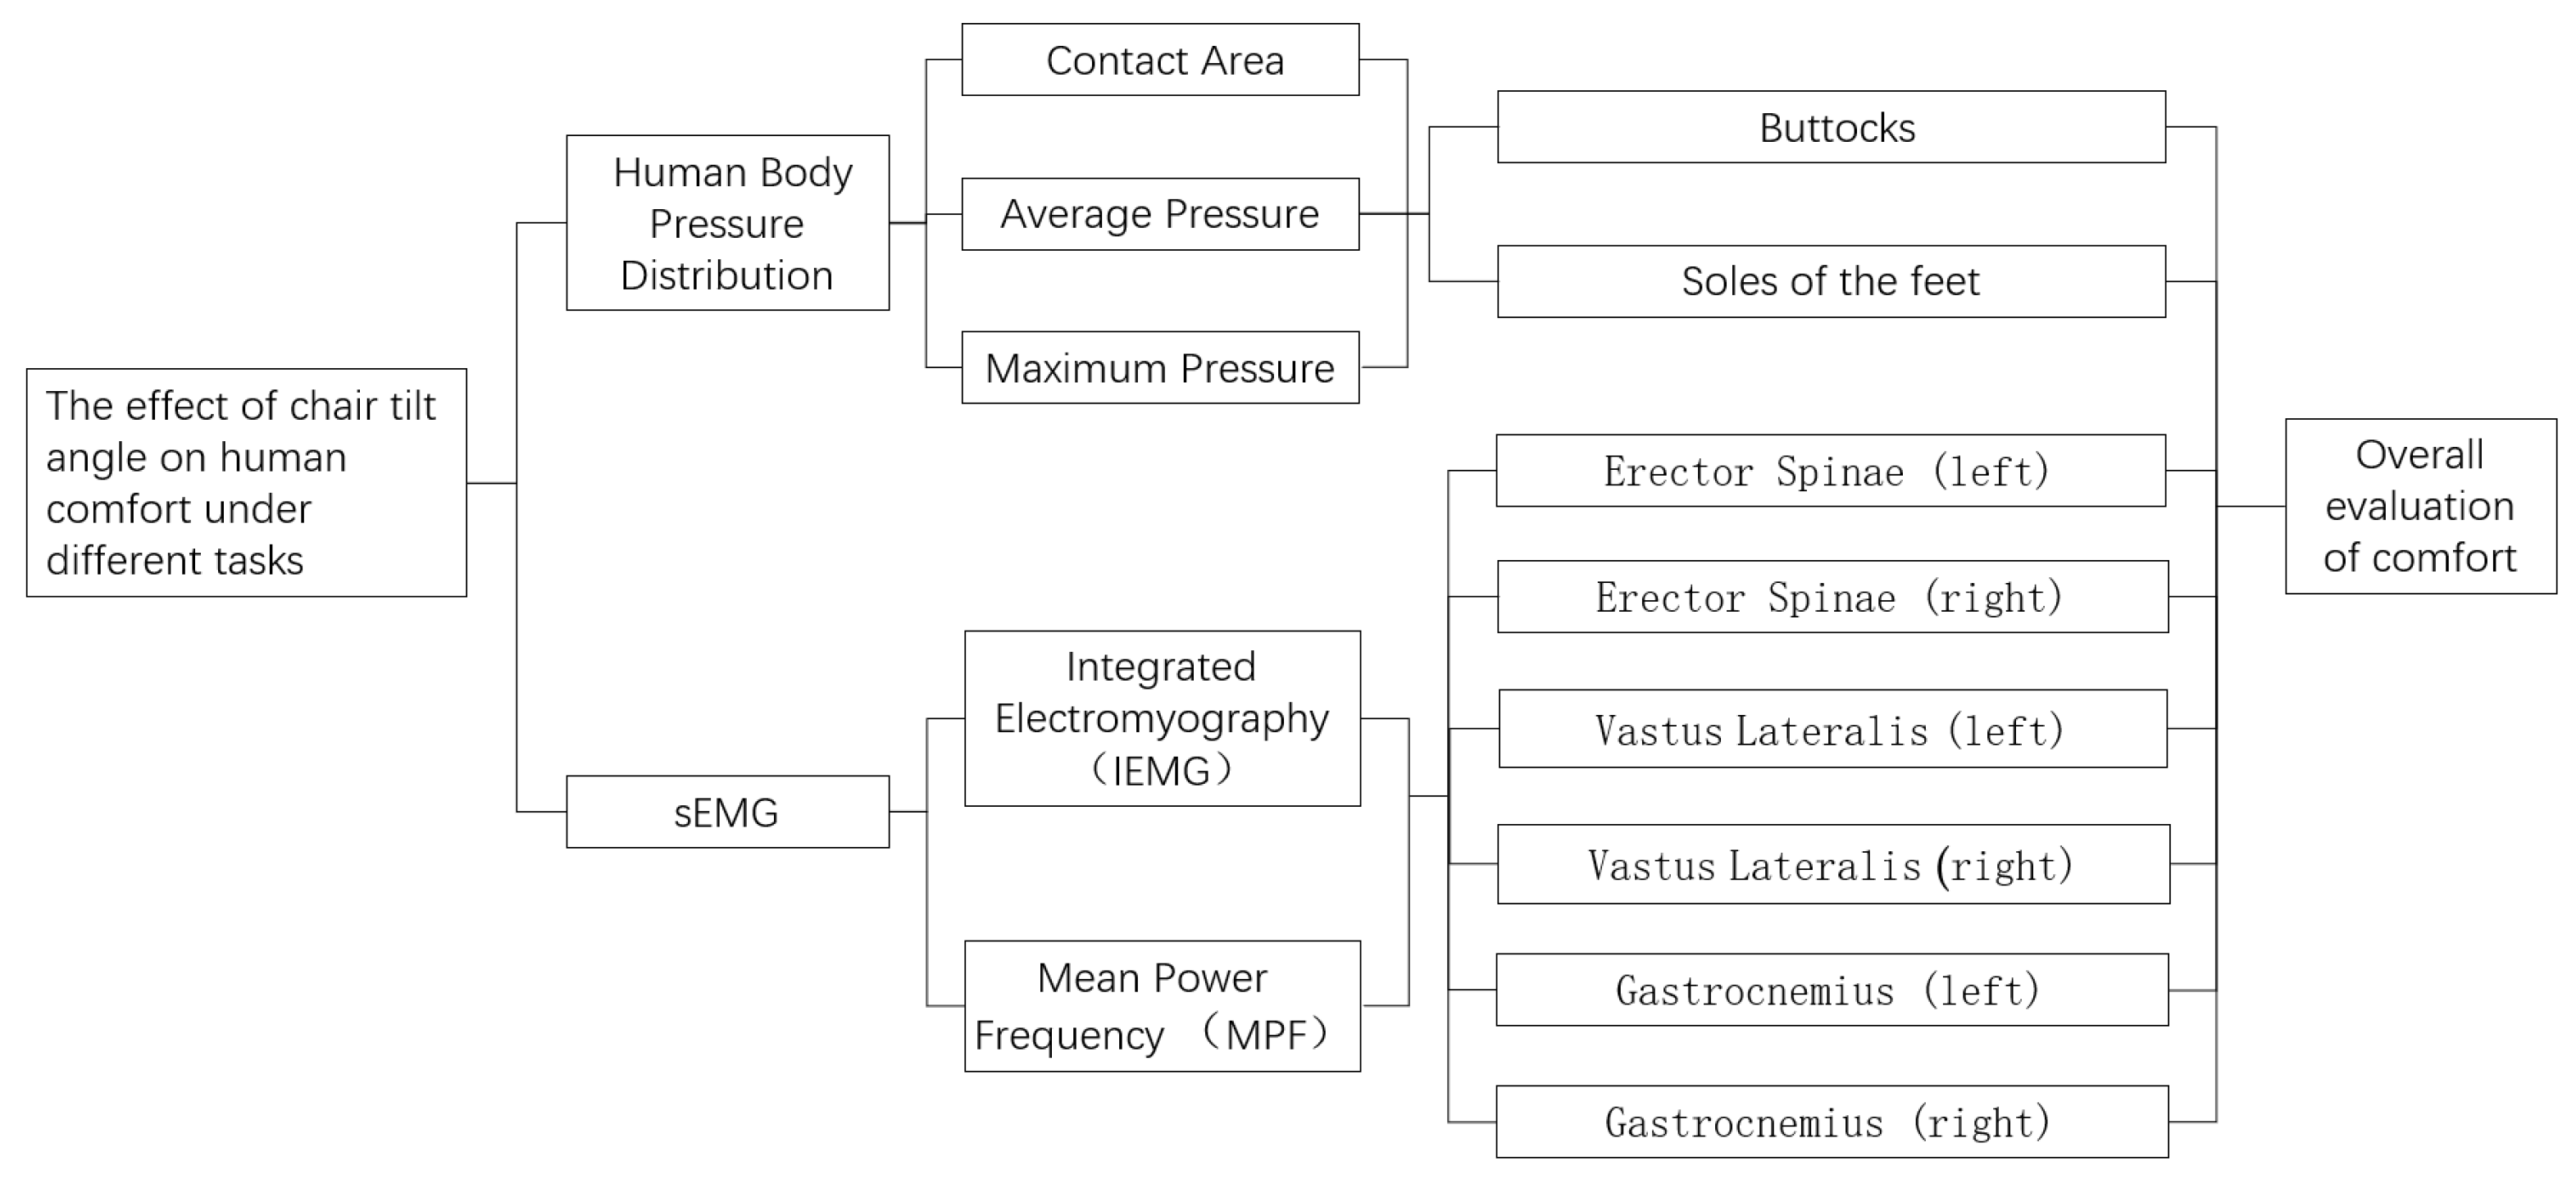
Based on a review of existing research on seating and human posture comfort, our chosen methodology involves synchronously testing body pressure distribution and sEMG. This approach enables us to extrapolate comfort levels across various tasks at seat tilt angles of 0°, 20°, and 40°. By incorporating sEMG alongside body pressure distribution, we address the limitations of pressure sensors, which only provide pressure-related data and do not capture muscle activity or attention allocation. The integration of sEMG signals enhances the reliability of our experimental data. The research methodology process is illustrated in Figure 1.
In the surface electromyography (sEMG) experiment, the selected muscle groups are the bilateral erector spinae, bilateral vastus lateralis, and bilateral gastrocnemius. These muscle groups play important roles in maintaining trunk stability, posture control, and dynamic balance. The erector spinae primarily stabilize the spine and control posture, the vastus lateralis supports the thigh and stabilizes the knee joint, and the gastrocnemius is crucial for foot and lower limb stability. These three muscle groups provide muscle activity data from different body regions, covering the lower back, thighs, and calves, thereby offering a comprehensive reflection of the impact of standing chairs on various body parts. This ensures the comprehensiveness and representativeness of the study results. Additionally, many related studies have selected these key muscles as subjects. For example, C Nicoletti et al. (2018) [8] compared the muscle activity of the erector spinae, vastus lateralis, and gastrocnemius in standard chairs and standing chairs with different tilt angles. Our study aligns with these previous studies to facilitate comparison and validation of the results.

2.2. Experimental Subjects

Twelve graduate students (6 males and 6 females) of similar age and in good physical and mental health were recruited as participants for this experiment, with an average age of 26 ± 2 years, average weight of 68.1 ± 12 kg, and average height of 171 ± 13 mm. Before the experiment, participants were asked to stop vigorous exercise for 48 h and confirm that they were free from any skin diseases, limb injuries, or muscle impairments. Participants volunteered for the experiment and retained the right to withdraw at any time without providing an explanation. Table 1 lists the gender, age, height, and weight of all participants.
Before the start of the experiments, all participants were asked to sign an informed consent form. The experimental procedures, specifications, and risks were comprehensively explained to each participant. The experiment was approved by Xi’an Jiaotong University City College.
According to Cohen’s (1992) guidelines, for a medium effect size (effect size = 0.5), achieving 80% statistical power (power = 0.80) at a common significance level (alpha = 0.05) requires a sample size of approximately 12 to 15 participants. Our preliminary power analysis indicated that, with an effect size of 0.8, a sample size of 12 is sufficient to detect significant differences. Additionally, graduate students typically have similar ages, consistent health conditions, and comparable lifestyle habits and activity patterns, including frequent sedentary behavior. This homogeneity helps reduce variability caused by individual differences, making the experimental results more comparable and controllable. However, we also recognize that a sample size of 12 may have limitations and may not fully represent the entire graduate student population. This is a limitation of our study.
To enhance the reliability of our conclusions, we applied additional statistical tests in our data analysis. First, we used one-way analysis of variance (ANOVA) to compare the significant differences in pressure distribution across different tilt angles. The results indicate that different tilt angles have a significant impact on pressure distribution (p < 0.05). Subsequently, we performed post hoc tests (such as the Tukey HSD test) to determine which specific angles showed significant differences.
Additionally, we employed multiple regression analysis to evaluate the combined effects of body weight and tilt angle on pressure distribution and comfort evaluation. The analysis revealed that both body weight and tilt angle significantly affect pressure distribution (p < 0.05) and that there is a significant interaction between the two. These results further validate the importance of individual body weight and tilt angle in influencing comfort assessments.
Individuals have different body weights and sizes, resulting in differences in the contact area and pressure distribution between the body and the seat, leading to different levels of individual comfort. For example, individuals with higher body weight may experience greater pressure at larger seat inclination angles, reducing their comfort perception. Conversely, individuals with lower body weight may experience less pressure under the same conditions, resulting in different comfort evaluations for the same inclination angles. Therefore, we selected participants with similar heights but varying body weights to capture a broader range of responses. This consideration helps mitigate the impact of individual differences on our results.

2.3. Experimental Equipment

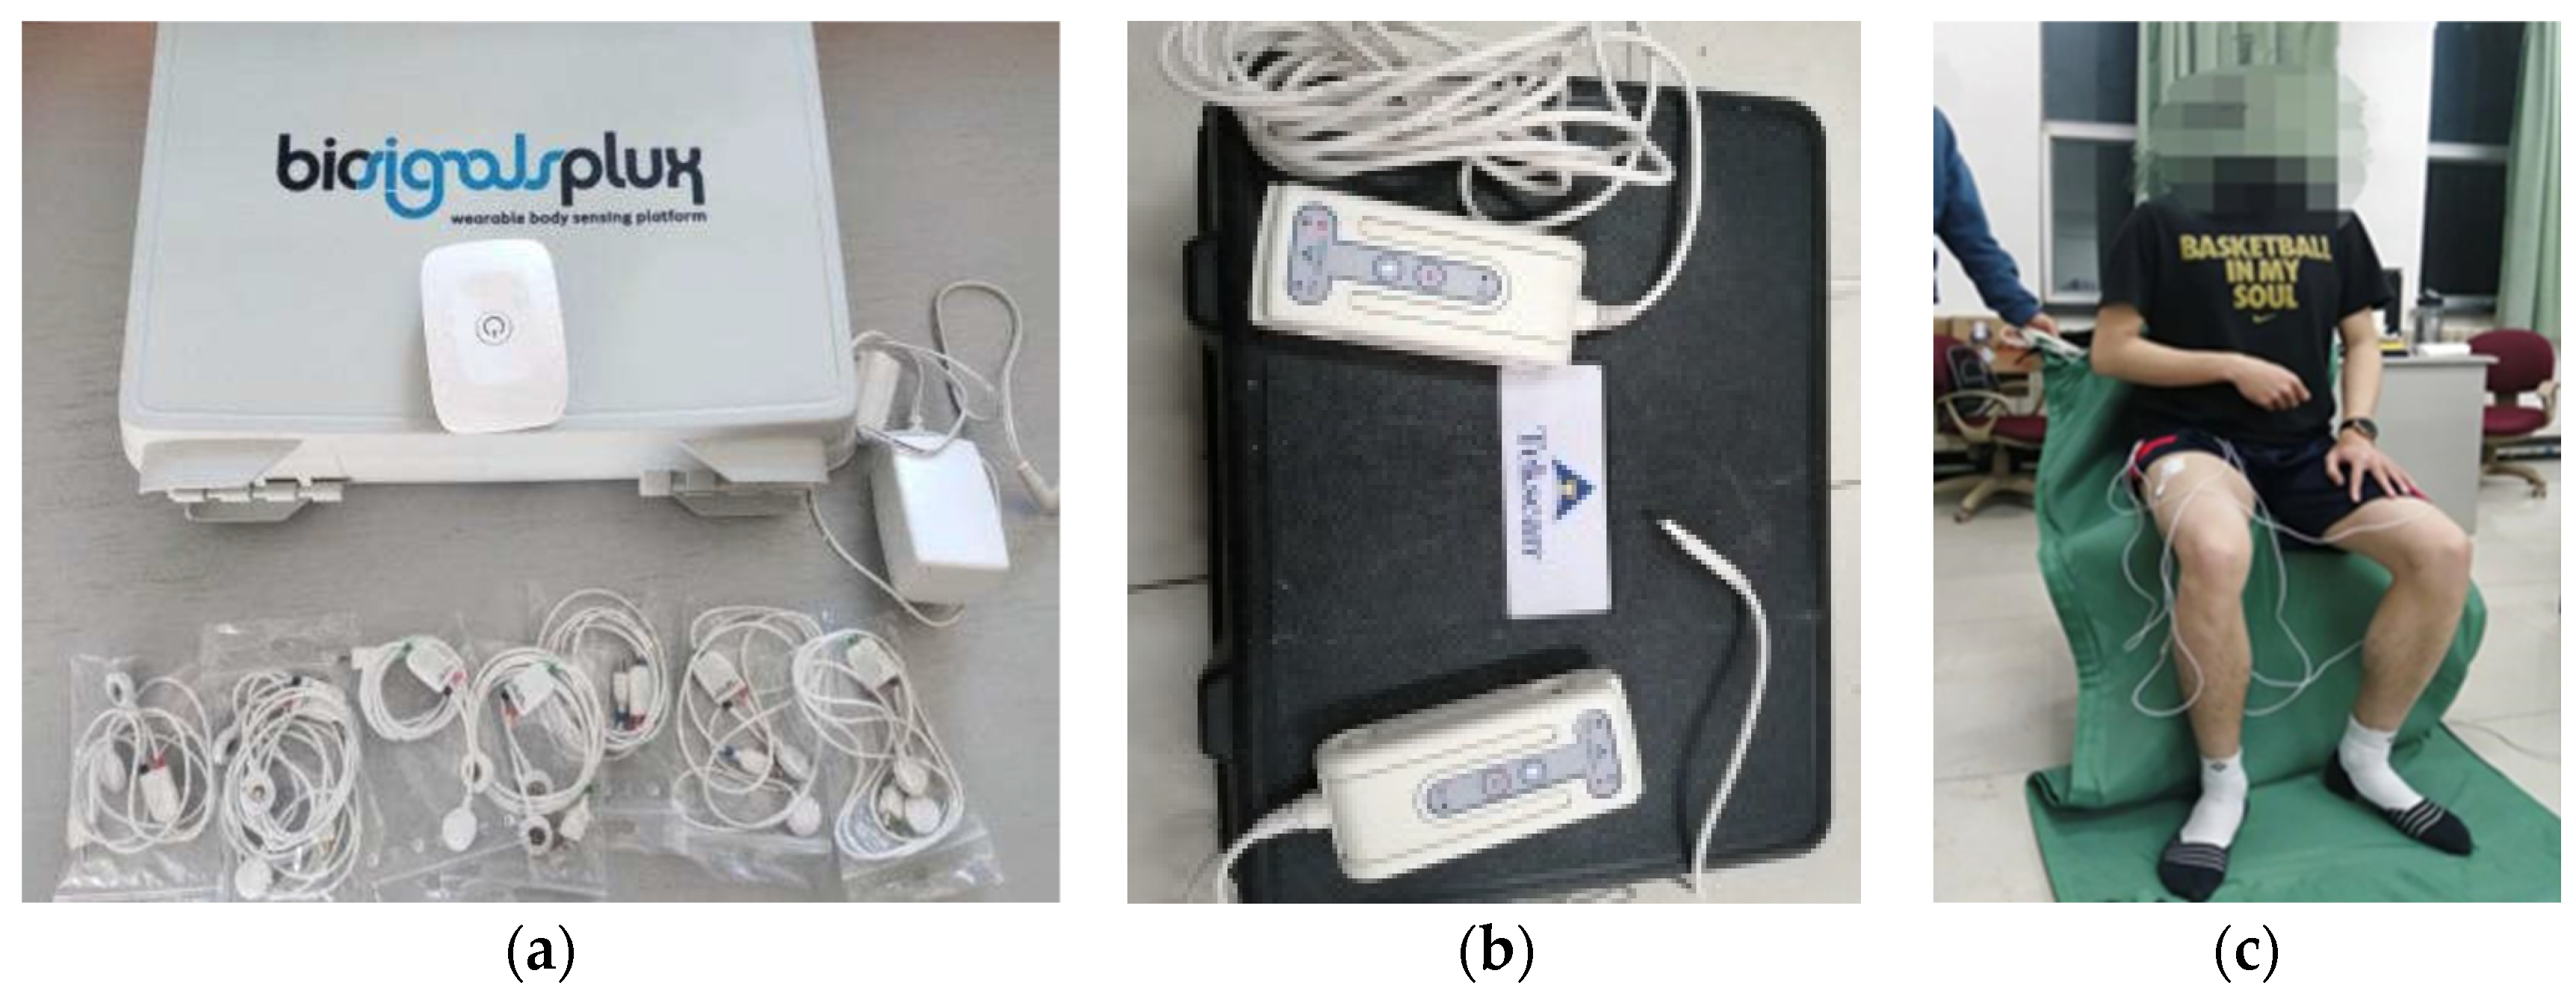
The experimental set-up used Tekscan pressure sensing equipment from a well-known American company (Norwood, MA, USA), synchronized with the ErgoPlux 8-channel wireless surface electromyography measurement system, manufactured by Plux company in Portugal (Lisboa, Portugal). The experimental equipment and setting are shown in Figure 2. Tekscan pressure sensing equipment features a flexible pressure sensor with a thickness of 0.1 mm. The system includes two sensors, each with over 2000 sensing points, with a density of one sensing point per square centimeter.

2.4. Experimental Procedure

Before commencing the experiment, researchers provided participants with detailed explanations of the experimental procedures, specific body positions, and required sitting postures. Participants were given the opportunity to adjust the height of the chair, standing support, and desk at each angle. They fine-tuned the height of the working table for each task according to their individual height and body proportions, following ergonomic principles. Additionally, participants practiced the required postures to ensure they were comfortable and correctly aligned for the experiment.
The experiment will concurrently utilize body pressure distribution measurement equipment and electromyographic (EMG) signal acquisition devices. Prior to the start of the experiment, for the pressure sensor data, several calibrations were performed to ensure the accuracy and consistency of the sensors. Body pressure distribution testing pads were positioned on the standing chair, while electrodes were placed on the bilateral erector spinae, bilateral vastus lateralis, and bilateral gastrocnemius muscles, following SENIAM international standards [
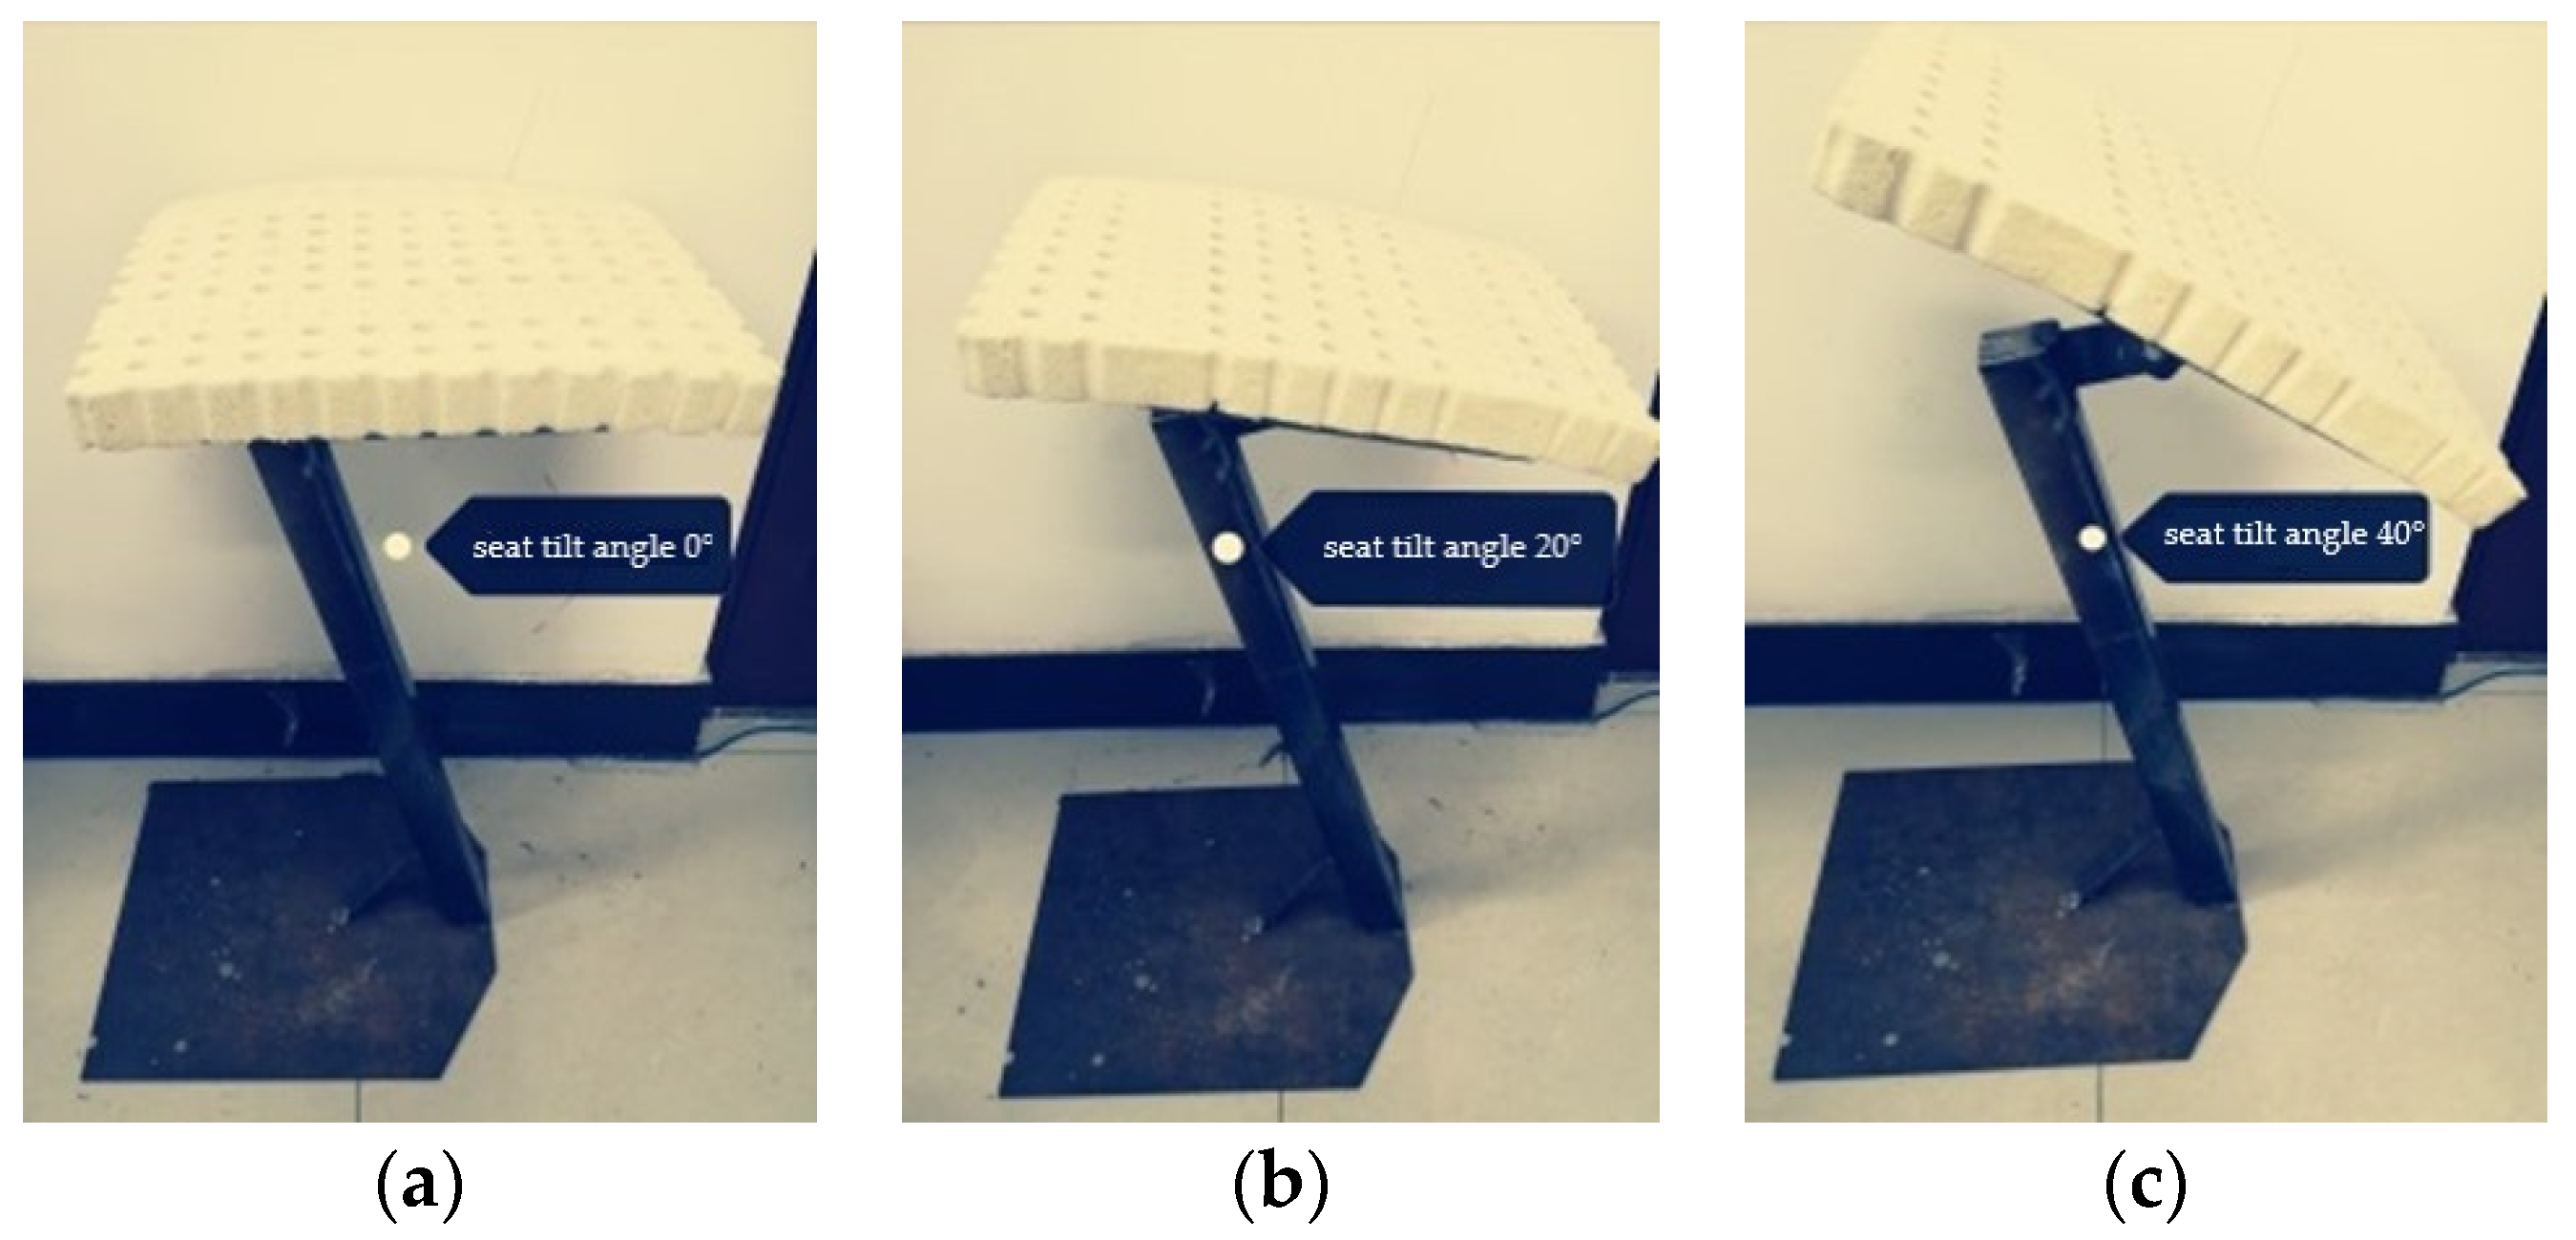
34]. Participants sat on the standing chair with seat incline angles of 0°, 20°, and 40°, respectively (as depicted in Figure 3), and engaged in the following three sets of experimental tasks.
(1)
The participant sits on the standing chair with both hands resting relaxed on their thighs. After receiving the start instruction, they begin typing continuously on the keyboard on the desk for 20 min. Recording starts after this period and lasts for 20 s (the typing content has been printed and placed on the task desk).
(2)
The participant sits on the standing chair with both hands resting relaxed on their thighs. After receiving the start instruction, they begin writing continuously on the desk surface for 20 min. Recording starts after this period and lasts for 20 s (the writing content has been printed and placed on the task desk).
(3)
The participant sits on the standing chair with both hands resting relaxed on their thighs. After receiving the start instruction, they begin ironing clothes continuously on the desk for 20 min. Recording starts after this period and lasts for 20 s (the ironing task requires the participant to use their right hand).
During the experiments, we used standardized postures and measurement positions, ensuring that all measurements were taken under the same environmental conditions to minimize the influence of external factors. Additionally, we used high-resolution pressure transducers to ensure the stability and consistency of the data.

3. Results

3.1. Body Pressure Distribution

As the standing chair embodies a mode that lies between standing and sitting, evaluating its comfort level necessitates simultaneous consideration of pressure parameters at both the buttocks and the soles of the feet.

3.1.1. Contact Area

The term “contact area” refers to the size of the area where the seat interfaces with both the buttocks and the soles of the feet. As shown in Figure 4, which depicts momentary pressure distribution during the experiment, it is apparent that with an increase in seat incline angle, the maximum pressure exerted on the buttocks progressively diminishes. This finding suggests that the seat incline angle significantly influences the contact area. It is important to note that in the body pressure distribution maps, darker blue indicates lower pressure, while more intense red indicates higher pressure.
Figure 5 illustrates that during computer tasks and writing tasks, a larger contact area between the buttocks and the soles of the feet is observed when the seat incline is set to 20°. However, during ironing tasks, the contact area of the soles of the feet is larger when the seat incline is 20°, while the contact area of the buttocks is larger when the seat incline angle is 40°.

3.1.2. Average Pressure

The average pressure is calculated as the arithmetic mean of all pressure measurement points. Through calculation, the average pressure on the buttocks, soles of the feet, and the total contact area under different task environments are determined, as shown in Figure 6 (The formula is shown in Appendix A).
As shown in Figure 6, under three task conditions, when the seat inclination angle is 0 °, the average pressure on the buttocks is highest, while at 40°, the average pressure is lowest. On the contrary, the average pressure on the soles of the feet is lowest at a 0 ° angle and highest at a 40° angle. The average pressure on the total contact area exhibits minimal variation. Notably, during ironing tasks, the average pressure on the soles of the feet is marginally lower at 0° compared with 20°, whereas the average pressure on the buttocks is slightly higher at 0° incline angle compared with 20°.

3.1.3. Maximum Pressure

Maximum Pressure represents the peak value among all pressure measurement points, signifying the greatest pressure exerted on the buttocks and soles of the feet. It is essential to recognize that in this experiment, the pressure testing range spans from 0 to 255 g/cm2. Thus, if the maximum pressure attains the peak value, it suggests that the actual pressure equals or surpasses 255 g/cm2.
As shown in Figure 7, it is evident that in all three tasks, the maximum pressure reaches its peaks when the seat incline angle is 40°, indicating that the localized pressure may be excessive. Specifically, in computer and writing tasks, the maximum pressure on the buttocks is lower at a 20° incline angle compared with 0°. Conversely, in ironing tasks, the maximum pressure on the buttocks is lower at a 0° incline angle compared with 20°.

3.2. sEMG

In this article, prior to data processing, sEMG signals were preprocessed to maximize noise removal and extract useful electromyographic data. Preprocessing is a critical step in analyzing and processing these signals. This study, referencing Zhang Kaituo’s research [35], utilized wavelet packet decomposition, 50 Hz notch filtering, full-wave rectification, and frequency cut-offs as sEMG preprocessing methods to eliminate noise such as baseline drift, power line interference, and static interference. The preprocessing workflow is shown in Figure 8. Subsequently, feature extraction was performed in both the time domain and frequency domain.

3.2.1. Integrated Electromyography (IEMG)

Integrated electromyography (IEMG) serves as a measure of muscle activity intensity over time. Studies indicate that higher IEMG values correlate with increased fatigue and, consequently, heightened discomfort. The comparative curves of the Integrated Electromyography data for different muscles in this experiment are illustrated in Figure 9 (The formula is shown in Appendix A).
From Figure 9a, it is evident that during computer tasks, the Integrated Electromyography (IEMG) of the left erector spinae muscle remains relatively small and stable at a seat incline angle of 20°, while it reaches its maximum value with larger fluctuations at 40°. Similarly, the IEMG of the right erector spinae muscle is smaller at a seat incline angle of 20° and peaks at 40°, displaying considerable fluctuations in both scenarios. At a seat incline angle of 40°, the IEMG of both bilateral vastus lateralis muscles remains relatively small and stable. The IEMG of the left gastrocnemius muscle shows relatively small and stable fluctuations at a seat incline angle of 20°, with a possible peak at the initial stage, possibly associated with changes in the participant’s body center of gravity. Conversely, the IEMG of the right gastrocnemius muscle remains relatively small and stable at a seat incline angle of 40°, confirming the possibility of a leftward shift in the participant’s center of gravity.
In Figure 9b, during writing tasks, the IEMG of the left erector spinae muscle exhibits relatively small and stable fluctuations at a seat incline angle of 20°. Similarly, the IEMG of the right erector spinae muscle remains relatively small and stable at a seat incline angle of 20° but peaks at 40° with larger fluctuations initially. At a seat incline angle of 40°, the IEMG of both bilateral vastus lateralis muscles remains relatively small and stable. The IEMG of the left gastrocnemius muscle is generally smaller at a seat incline angle of 20° compared with the other two conditions. However, it exhibits an initial peak, followed by stable fluctuations, possibly due to changes in the participant’s center of gravity at the beginning. Conversely, the IEMG of the right gastrocnemius muscle remains relatively small and stable at a seat incline angle of 40°.
Finally, in Figure 9c, during ironing tasks, the IEMG of the bilateral erector spinae muscles is minimal and exhibits the most stable fluctuations at a seat incline angle of 20°. The IEMG of both bilateral vastus lateralis muscles remains relatively small at a seat incline angle of 40°, with stable fluctuations on the left side but excessive fluctuations on the right side. The IEMG of the left gastrocnemius muscle remains relatively small and stable at a seat incline angle of 0°. Conversely, the IEMG of the right gastrocnemius muscle shows maximal activity with considerable fluctuations at a seat incline angle of 0°, while it remains minimal and highly stable at 40°.

3.2.2. Mean Power Frequency (MPF)

Utilizing fast Fourier transform, the raw electromyographic signals acquired by the electromyograph were transformed into frequency domain signals. Mean Power Frequency (MPF) was utilized as the primary analysis parameter, with smaller MPF values indicating higher levels of muscle fatigue. Throughout data processing, it was noted that alterations in Mean Power Frequency were relatively minor, posing challenges in accurately comparing parameter variations from the curves. Therefore, mean values were selected for comparative analysis. Detailed parameter comparisons for each muscle are provided in Table 2 (The formula is shown in Appendix A).
Table 2 illustrates that during computer tasks, the Mean Power Frequency (MPF) values of the left erector spinae muscle are highest at a seat incline angle of 20° and lowest at 0°. Conversely, the MPF values of the right erector spinae muscle peak at a seat incline angle of 40° and hit the lowest point at 0°. The MPF values of the left vastus lateralis muscle reach their peak at a seat incline angle of 20° and bottom out at 0°. Conversely, for the right vastus lateralis muscle, there is little disparity between seat incline angles of 0° and 20°, both of which are higher than the MPF value at 40°. The MPF values of the left gastrocnemius muscle peak at a seat incline angle of 20° but show no significant difference compared with those at 0°. Conversely, the MPF values of the right gastrocnemius muscle reach their peak at a seat incline angle of 20° and hit their lowest point at 40°.
During writing tasks, the MPF values of the left erector spinae muscle peak at a seat incline angle of 40° and reach their lowest point at 0°, while for the right erector spinae muscle, they peak at a seat incline angle of 20° and bottom out at 40°. The MPF values of the left vastus lateralis muscle peak at a seat incline angle of 20° and are lowest at 40°, whereas those of the right vastus lateralis muscle peak at a seat incline angle of 40° and are relatively lower at 0° and 20°. The MPF value of the left gastrocnemius muscle is highest at a seat incline angle of 20° and relatively lower at 0°. Regarding the right gastrocnemius muscle, the MPF value is highest at a seat incline angle of 40°, with a smaller difference compared with 20°. During the ironing task, the MPF values of the six selected muscles are all higher at a seat incline angle of 0° compared with incline angles of 20° and 40°.
In light of the diverse Integrated Electromyographic (IEMG) signal fluctuations and the comparison of Mean Power Frequency (MPF) mean values across various seat incline angles, we derived favorable seating postures for each muscle across different task scenarios. The more advantageous angle values after comparing the seat tilt angles are listed in Table 3.

4. Discussion

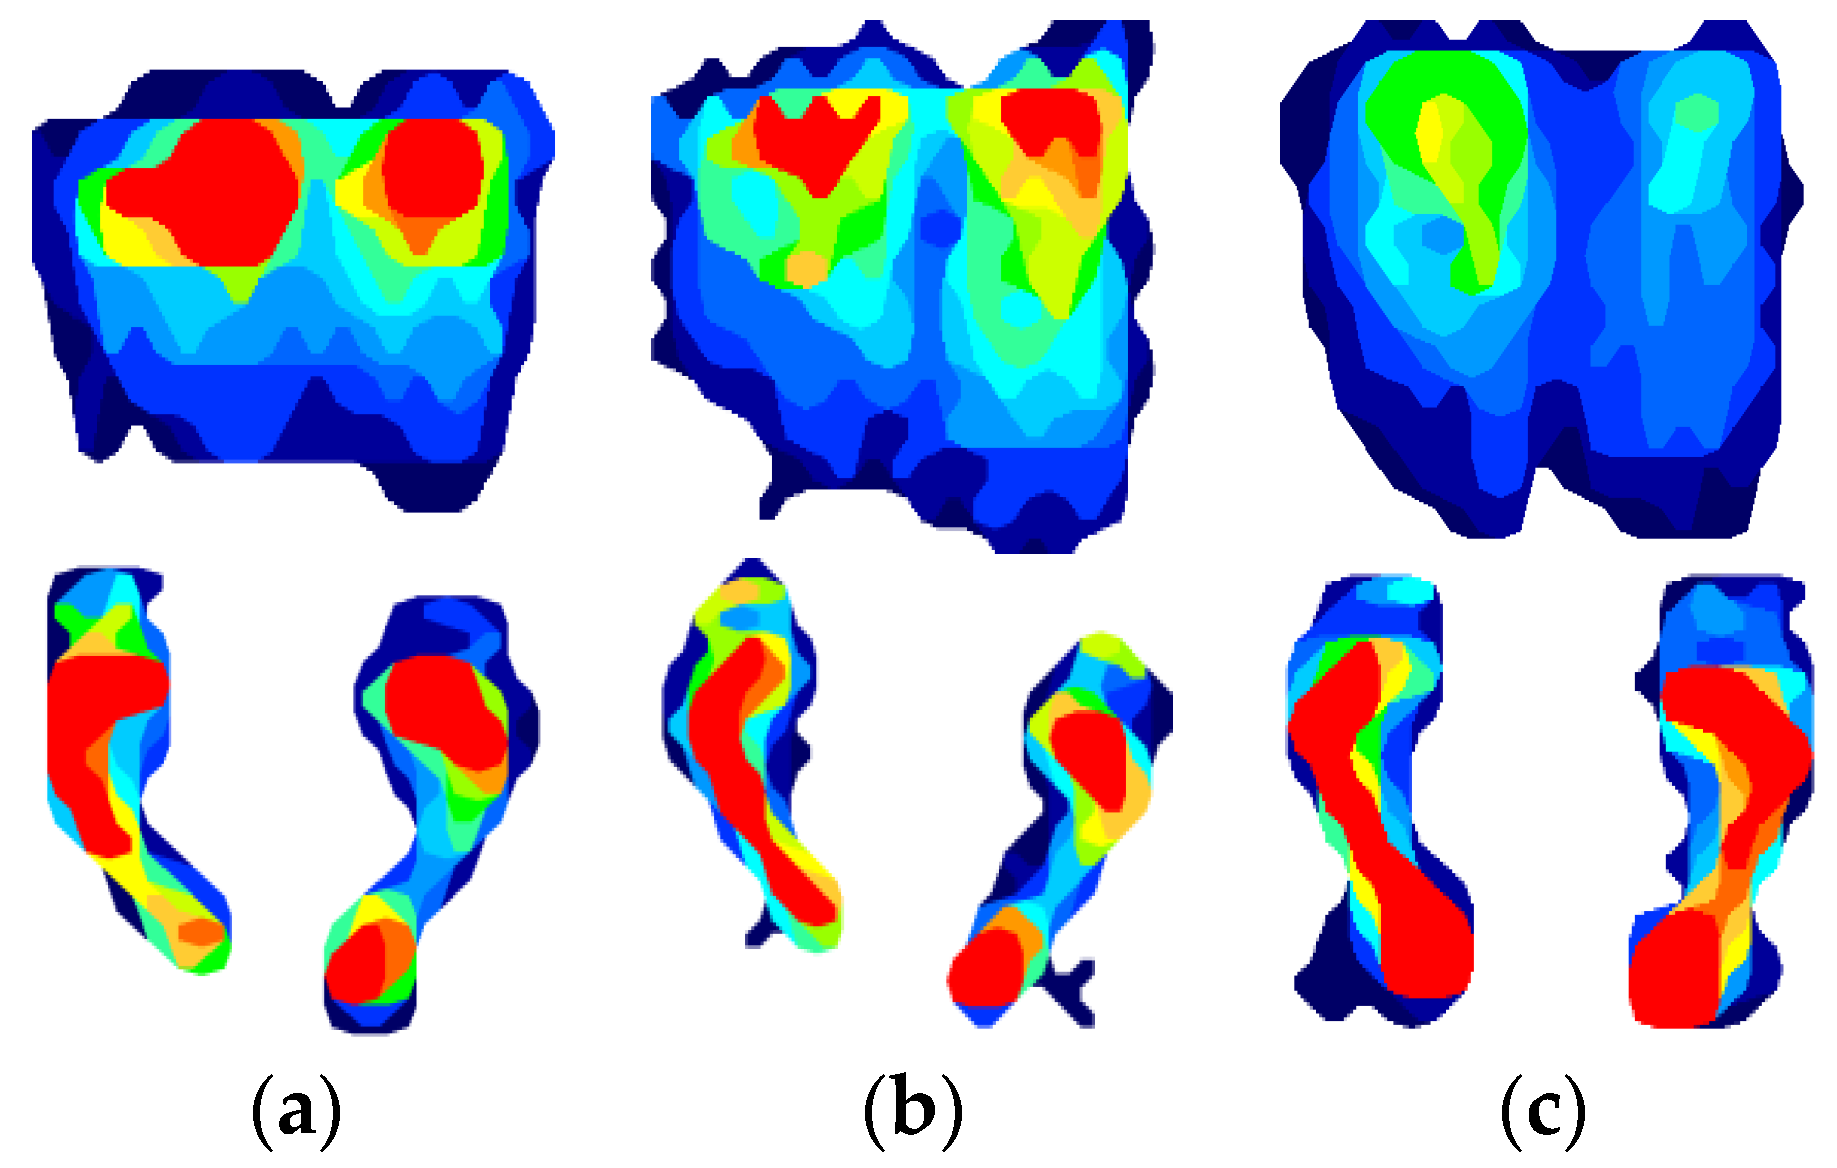
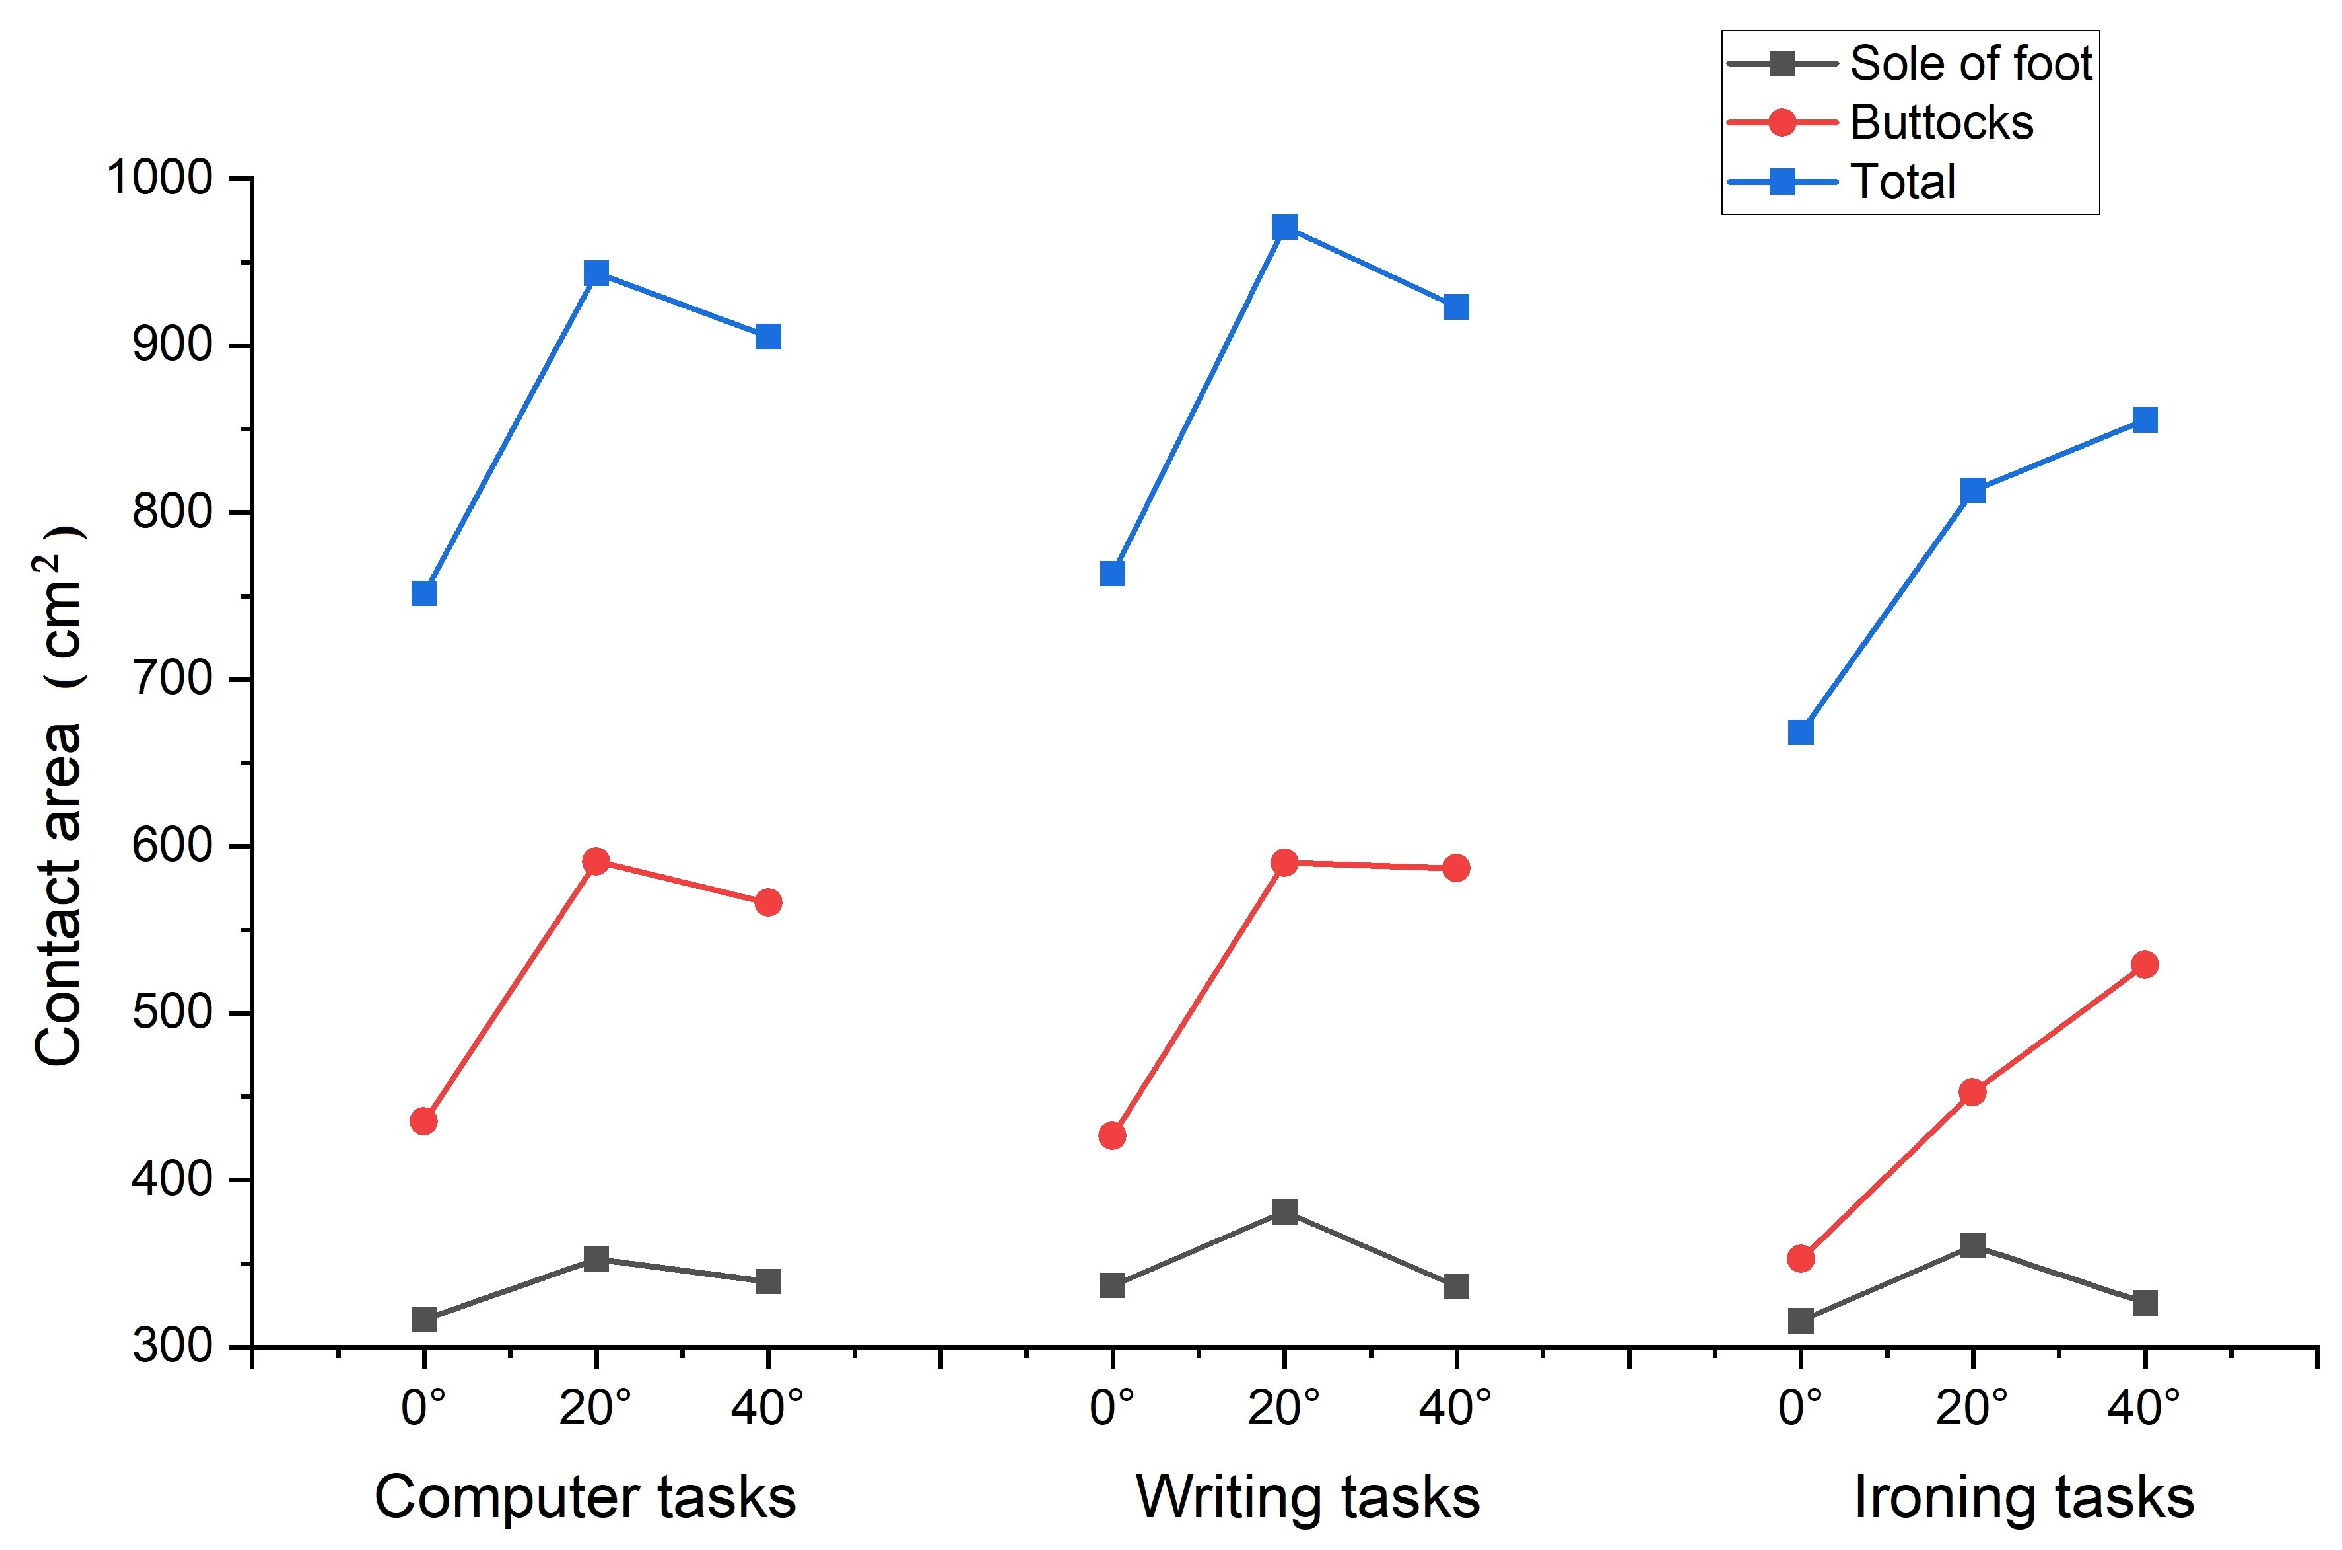
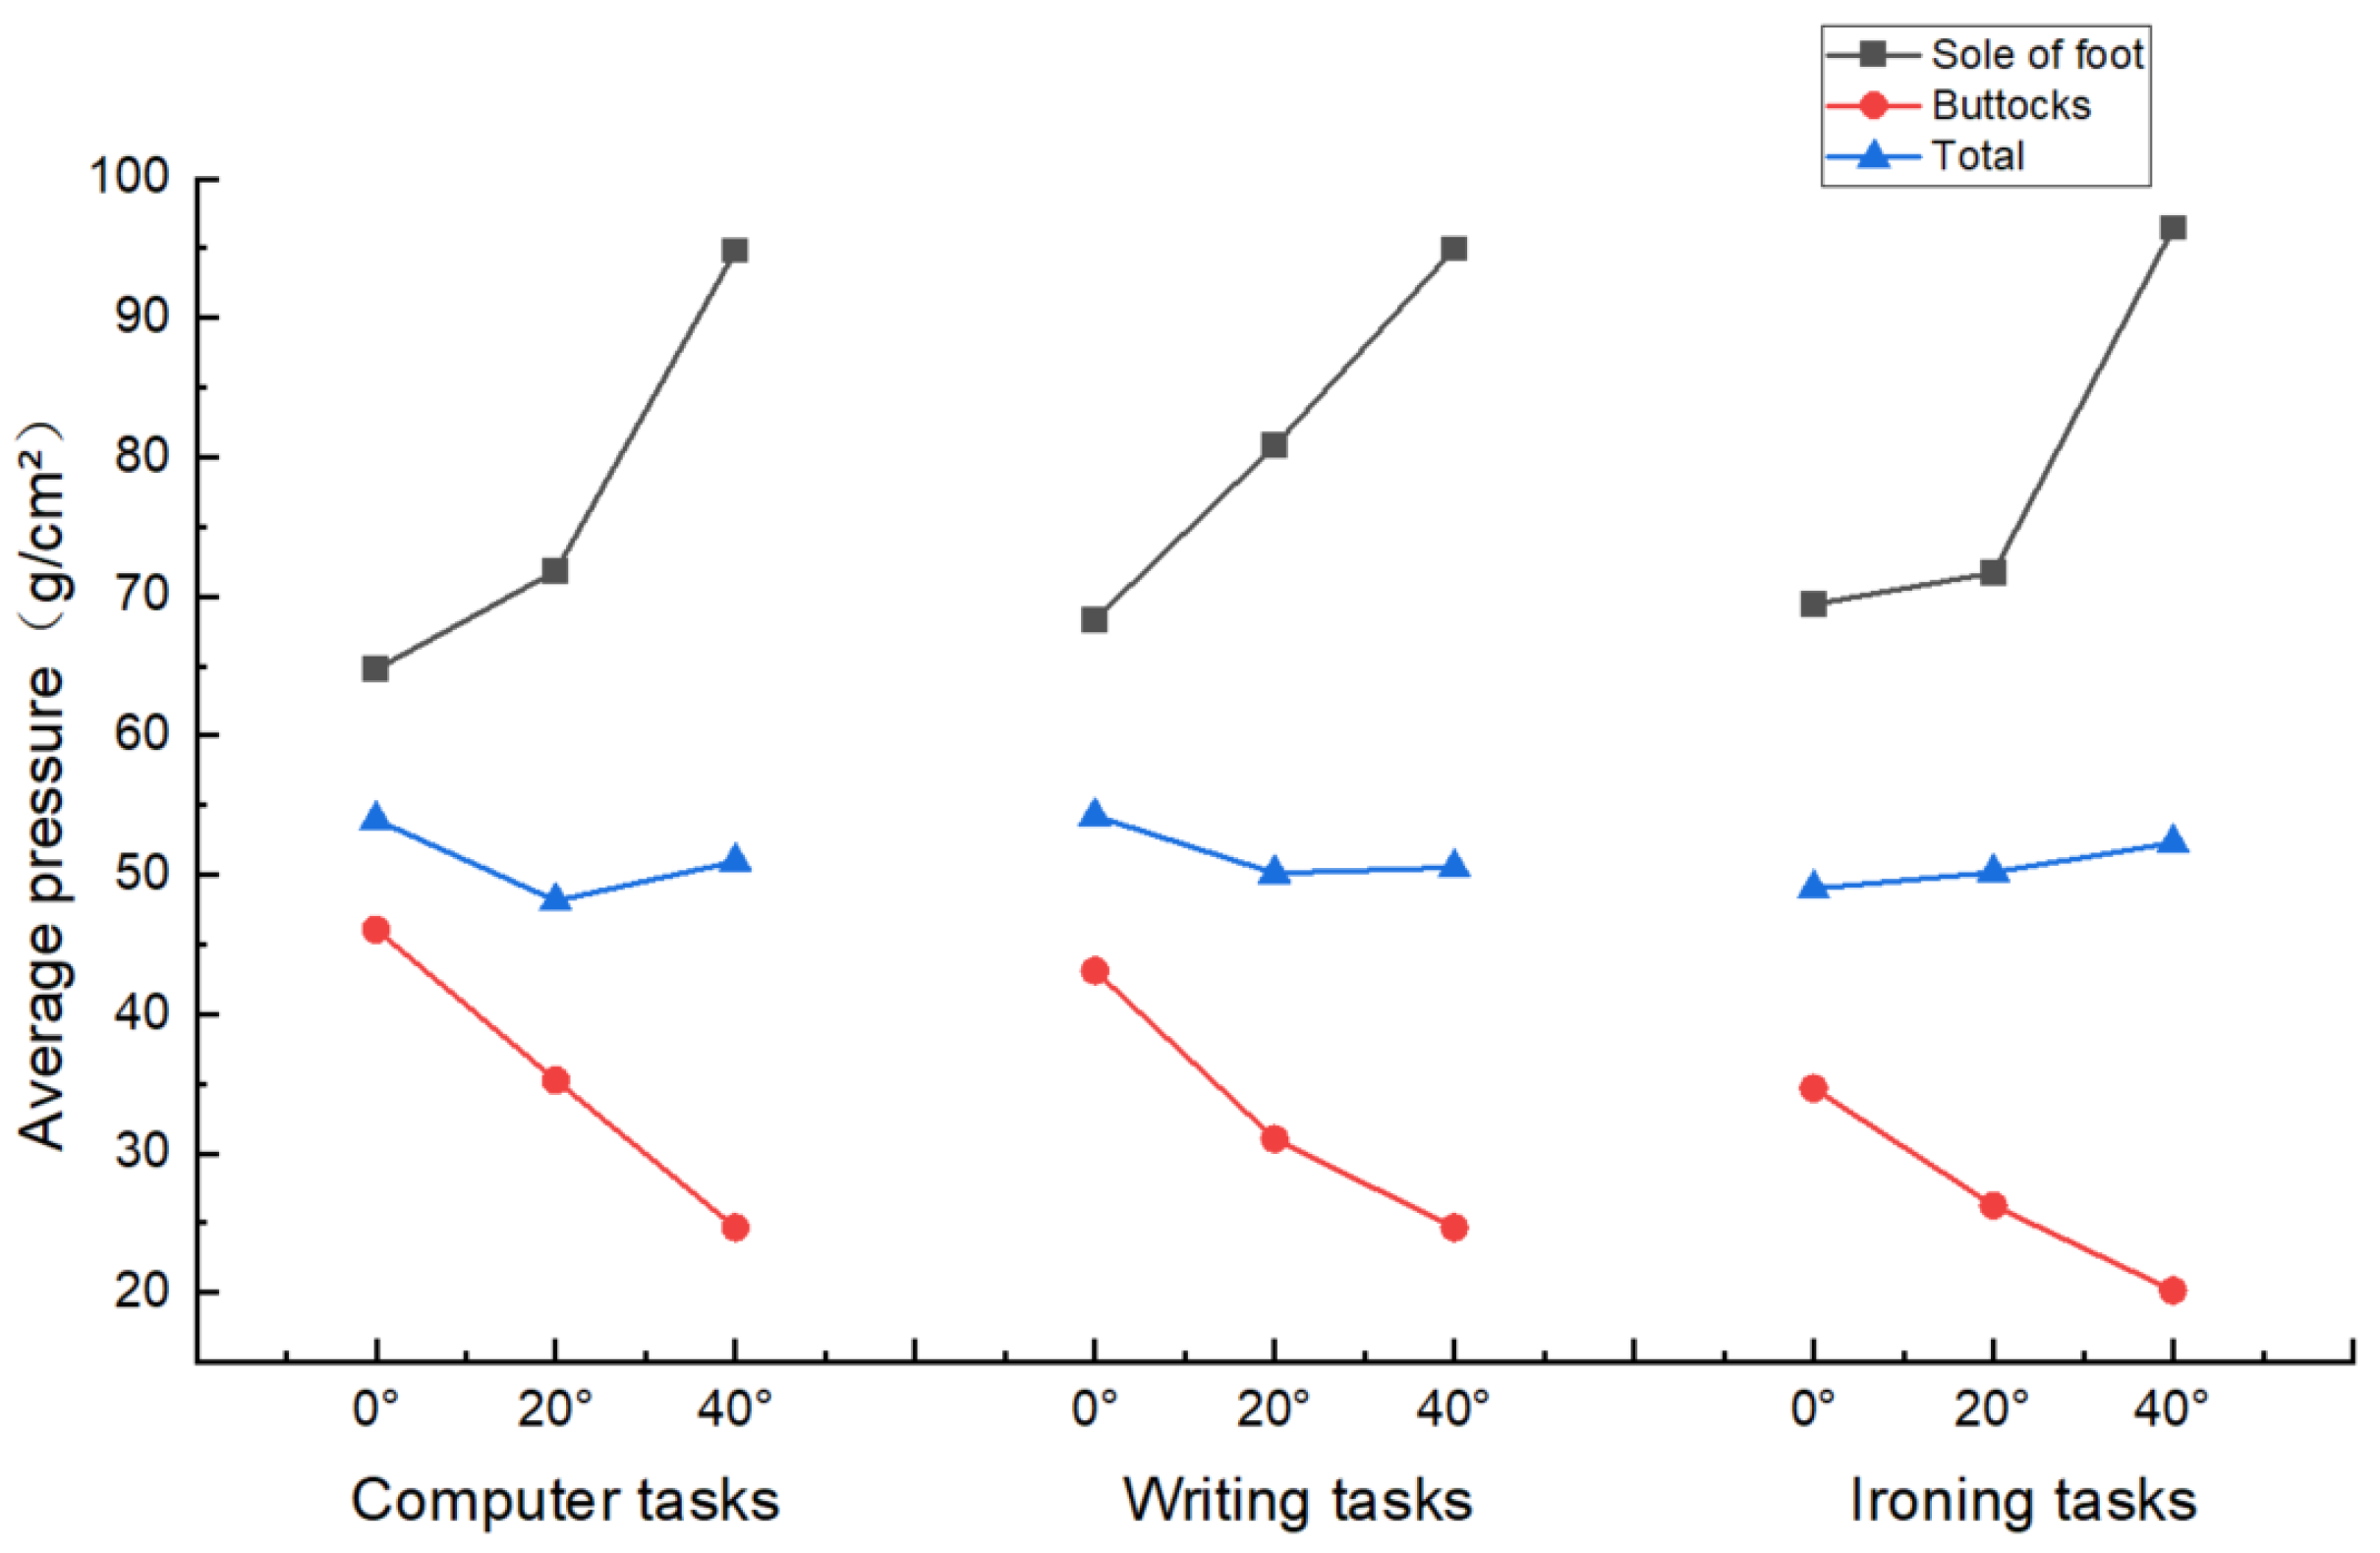
Analysis of the average pressure data reveals that during computer and writing tasks, greater pressure on the buttocks at a 0° seat incline angle and greater pressure on the soles of the feet at a 40° incline angle contribute to increased local discomfort. However, at a 20° incline angle, the average pressure on both the buttocks and the soles of the feet is closer to the total contact area average, facilitating better balance.
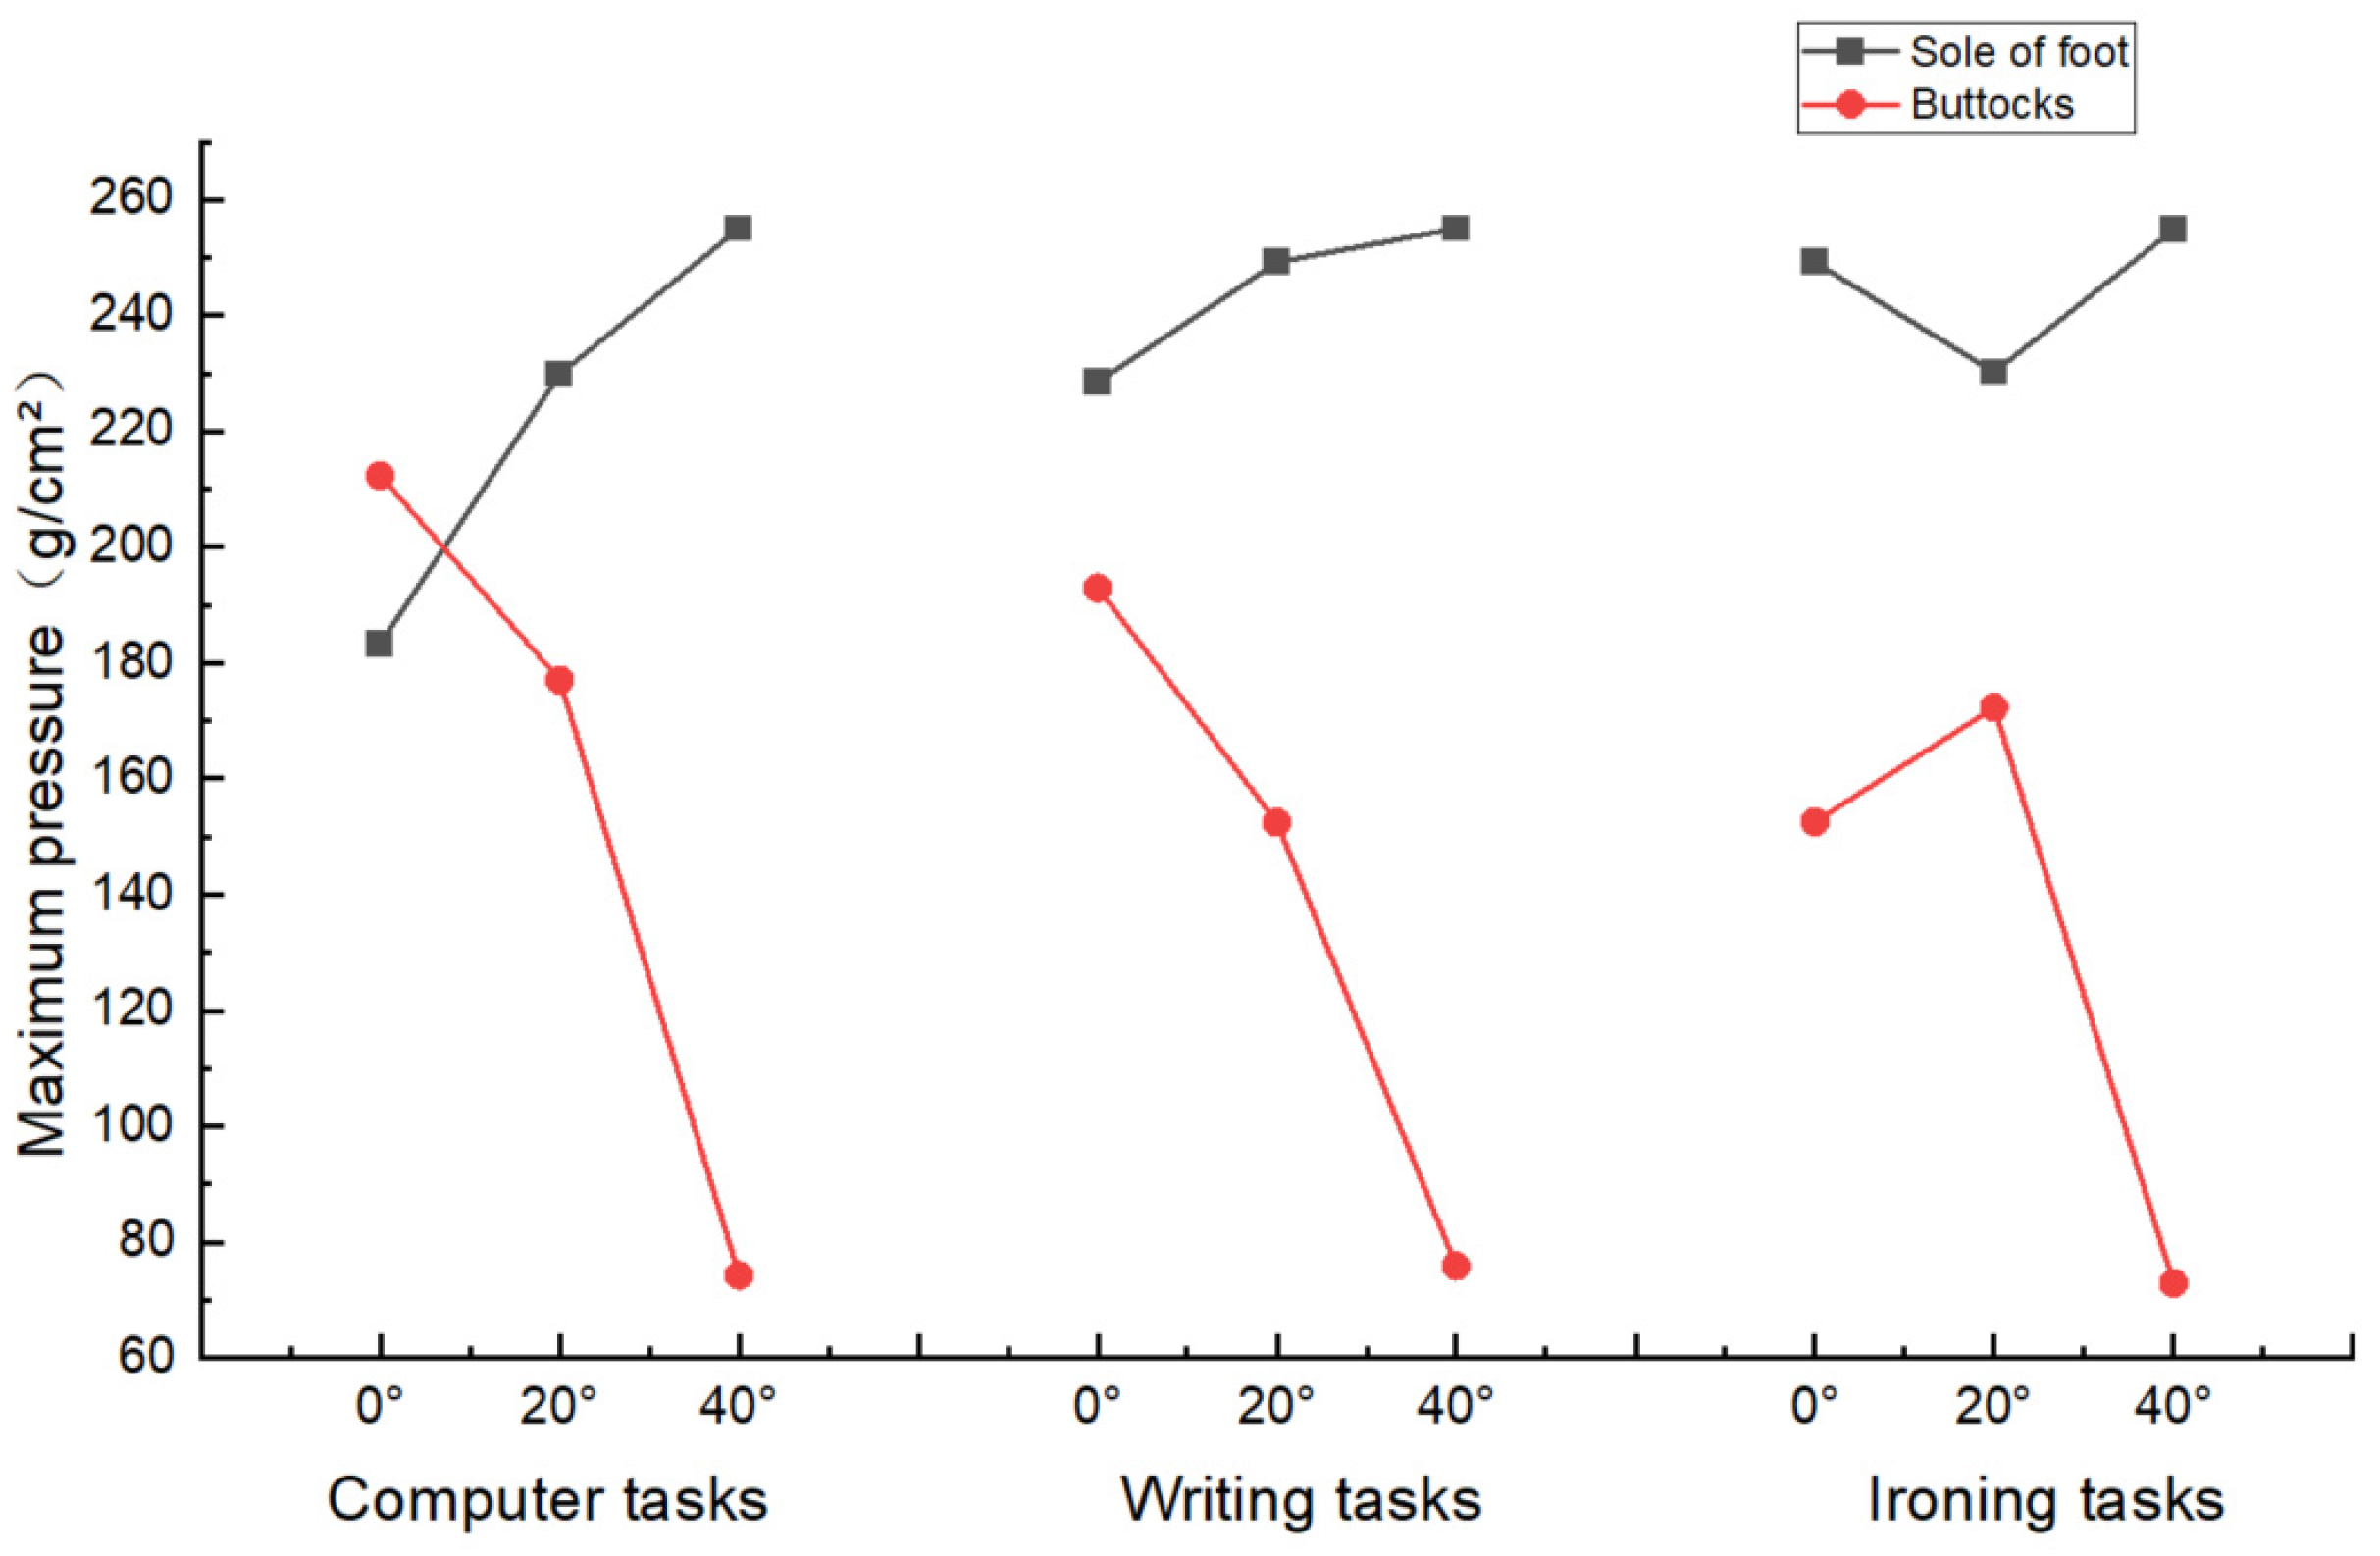
Regarding maximum pressure, it is noteworthy that peak pressure occurs at a 40° seat incline angle in all tasks, leading to the greatest localized discomfort. This situation arises because a 40° tilt angle causes the user’s center of gravity to shift forward, reducing the contact area between the body and the seat. This posture results in insufficient support for the spine and pelvis, compressing the lower back and lumbar region, and thereby increasing pressure on the lower body, particularly the hips and thighs. However, during computer and writing tasks, a 20° seat incline angle offers greater comfort for the buttocks, while during ironing tasks, a 0° seat incline angle provides greater comfort. At a 20° tilt angle, the contact area between the hips and the seat increases, leading to a more even distribution of pressure across the entire hip region and reducing localized pressure points. In contrast, at a 0° tilt angle, the frequent movements required during ironing tasks result in more dynamic contact and pressure distribution on the hips and seat. This variability helps prevent prolonged pressure buildup, thereby enhancing comfort.
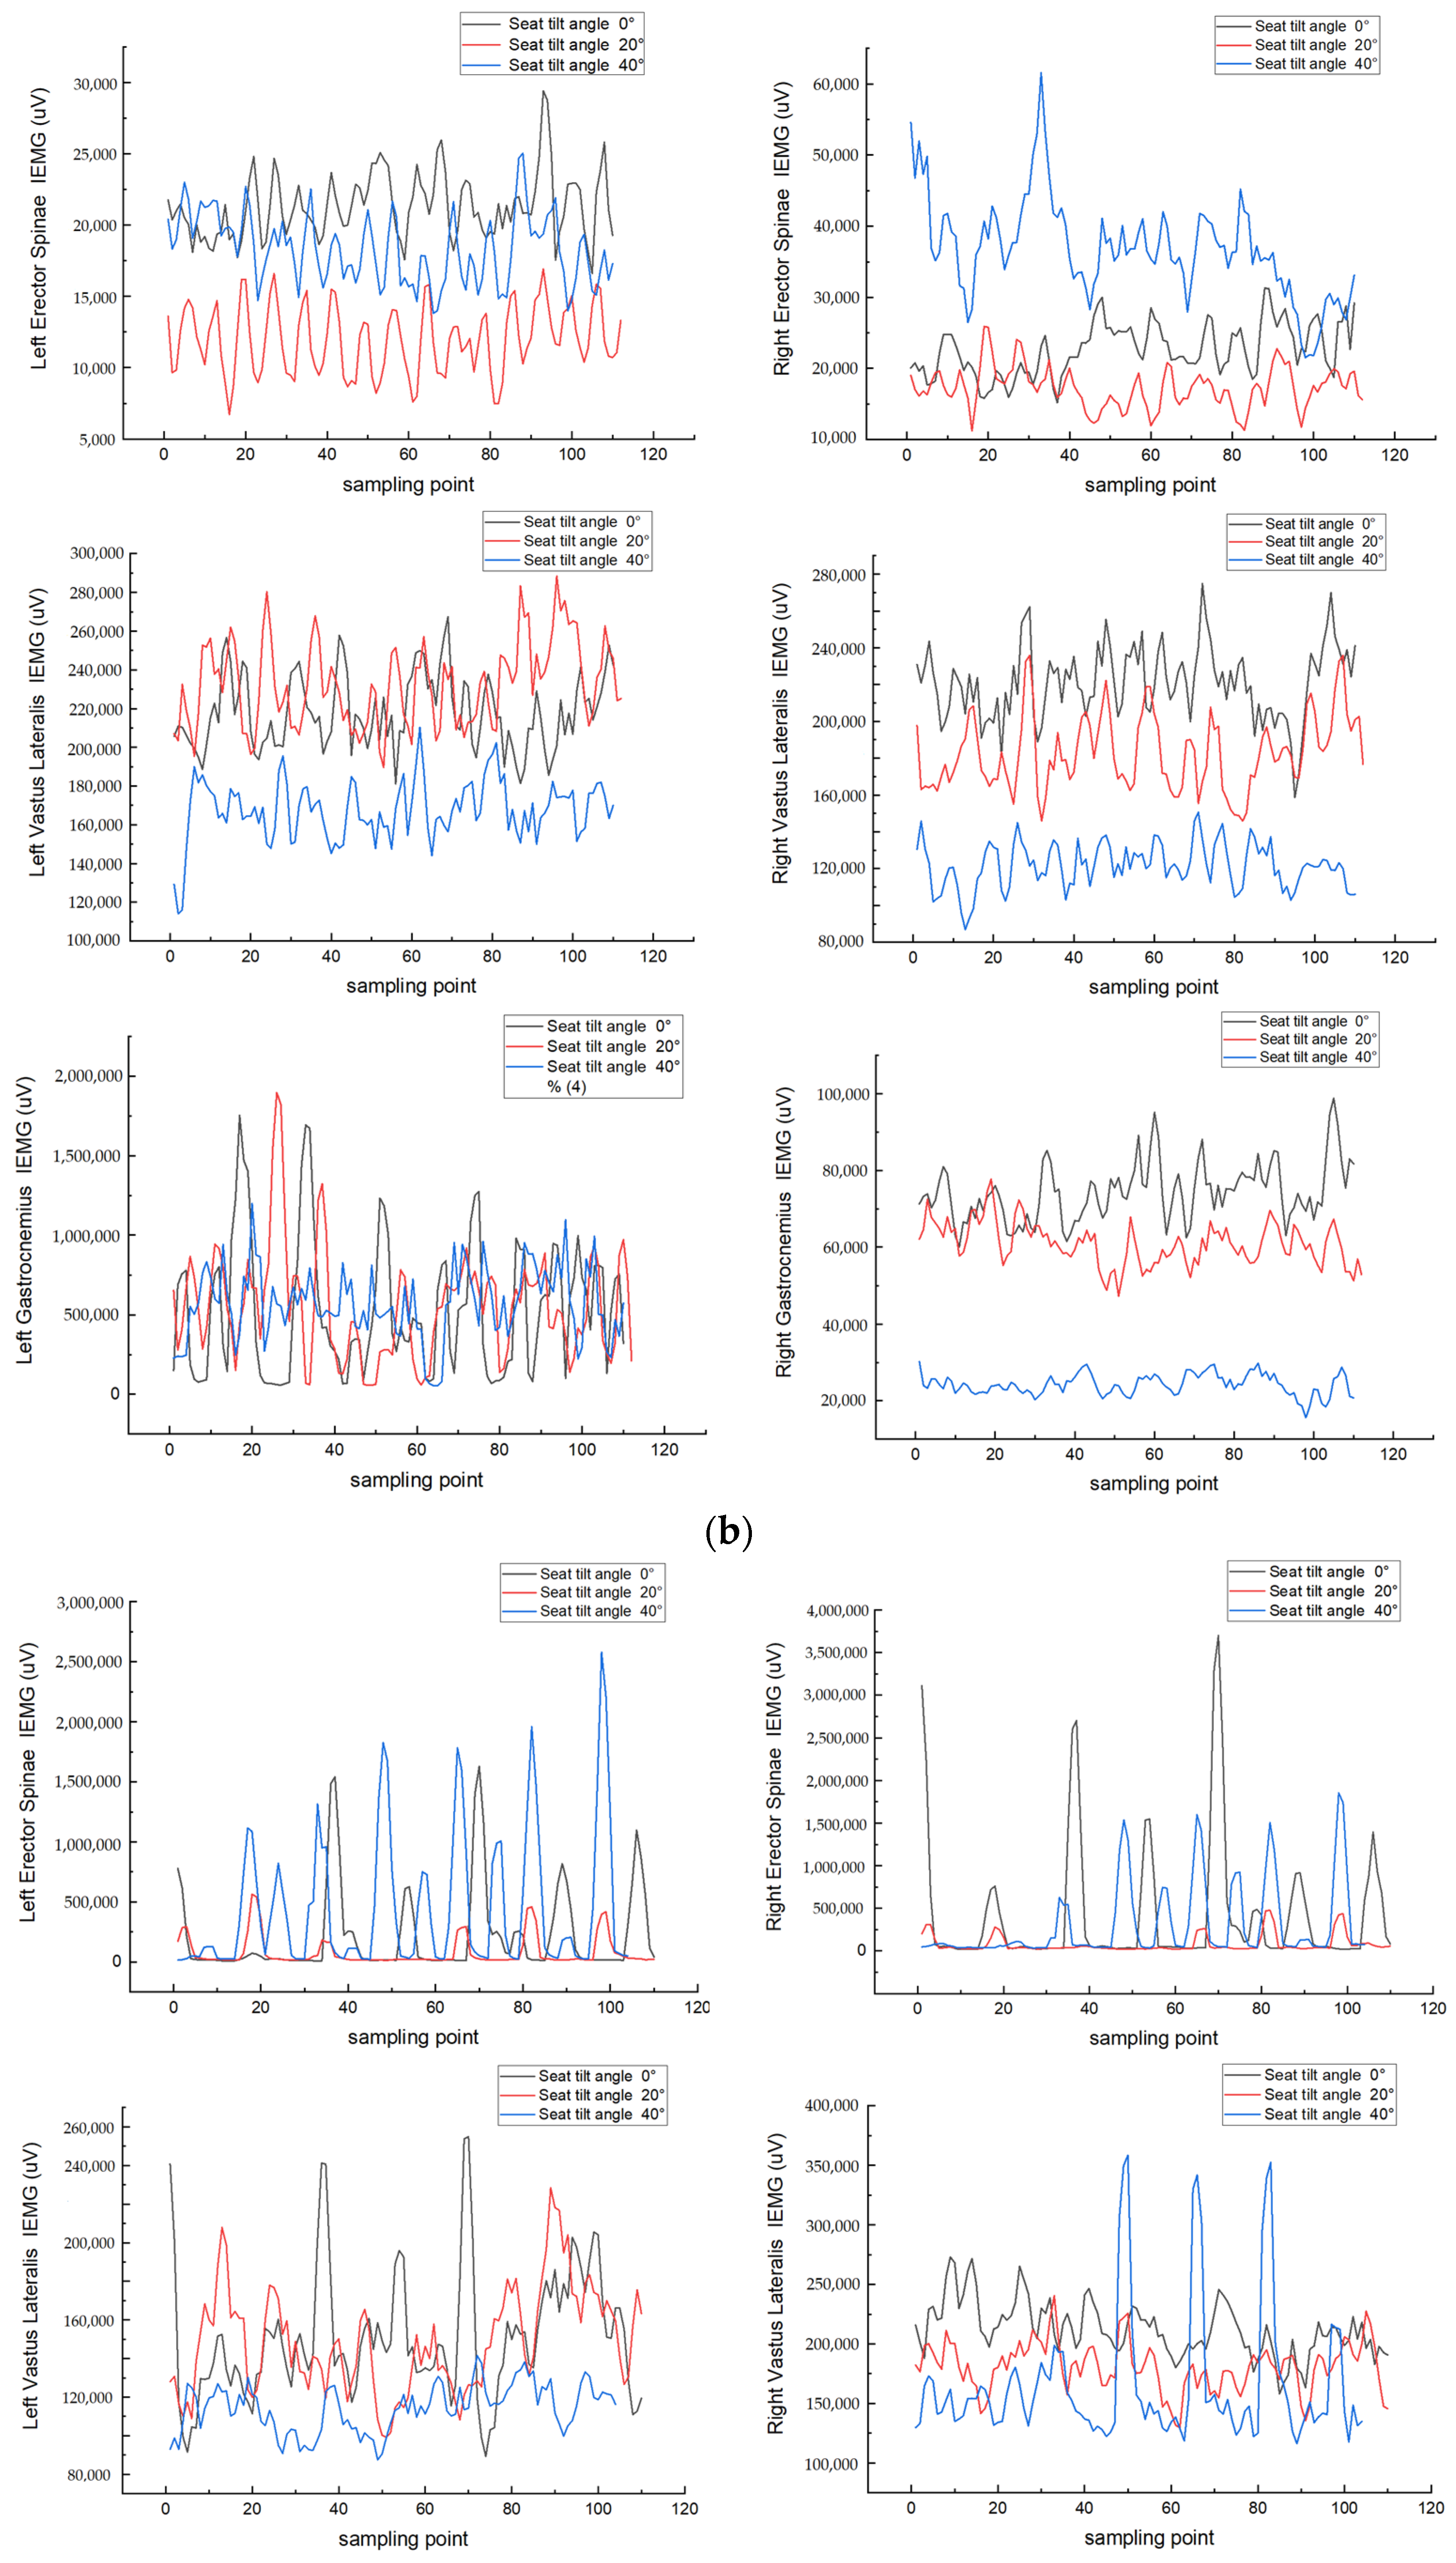
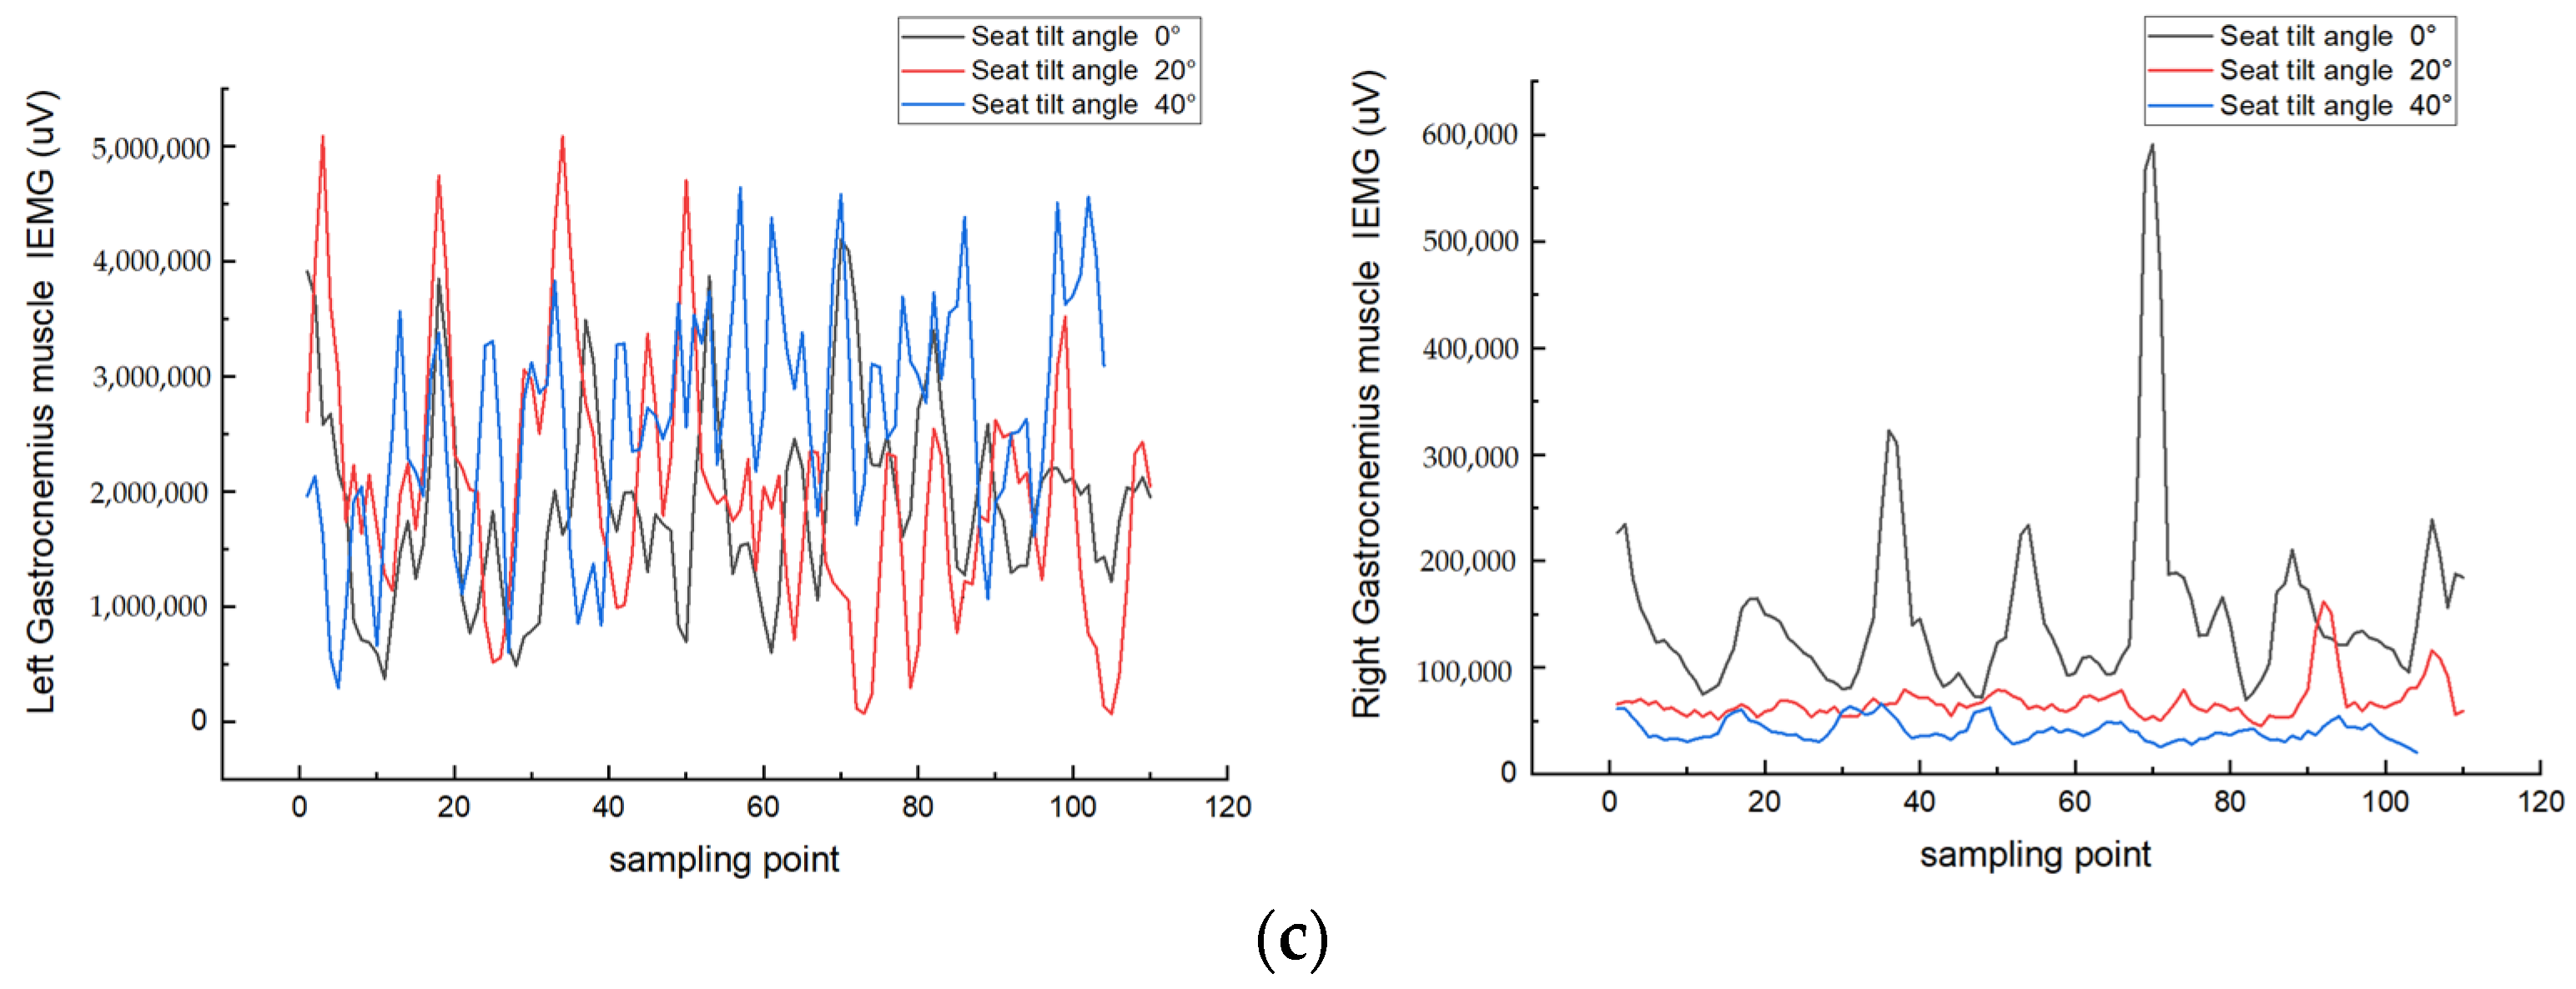
While analyzing the results of surface electromyographic (sEMG) signal processing, 12 parameters were available for evaluating muscle comfort in each task scenario. Best seat incline angles for each muscle across different tasks were assessed. For computer tasks, both the right vastus lateralis and left gastrocnemius muscles displayed minimal discrepancies between the 20° and 40° incline angles, with values surpassing those at 0°. Thus, both 20° and 40° incline angles were deemed advantageous, with eight parameters indicating greater comfort at 20° and 6 at 40°. During writing tasks, seven parameters indicated greater comfort at a 20° incline angle, while five parameters suggested greater comfort at 40°. For ironing tasks, the Mean Power Frequency (MPF) for all muscles indicated greater comfort at 0°, with seven parameters suggesting greater comfort at 0°, three at 20°, and two at 40°.
However, during ironing tasks, the Integrated Electromyography (IEMG) of the bilateral erector spinae is significantly smaller at a 20° incline angle compared with the other conditions. Yet, at 0°, the Mean Power Frequency (MPF) of the bilateral erector spinae is slightly higher than at 20°. Therefore, a 20° incline angle provides greater comfort for the erector spinae muscles during ironing tasks, while 0° is more conducive to the comfort of the vastus lateralis and gastrocnemius muscles. The reason for this difference in various task environments is that computer and writing tasks usually require prolonged sitting with relatively fixed postures. This demands a slightly reclined angle to reduce lumbar pressure and promote blood circulation. On the other hand, ironing tasks involve frequent forward and backward movements and standing. Therefore, during computer and writing tasks, a 20° tilt angle helps maintain the natural spinal curve, reduces pressure on the hips and lower back, and provides better support and distribution of hip pressure, thereby enhancing comfort. In contrast, during ironing tasks, a 0° tilt angle allows users to stand up and sit down more easily, reducing the accumulation of static pressure, which helps relax the hip muscles and improve comfort. This result aligns with the findings on body pressure distribution.
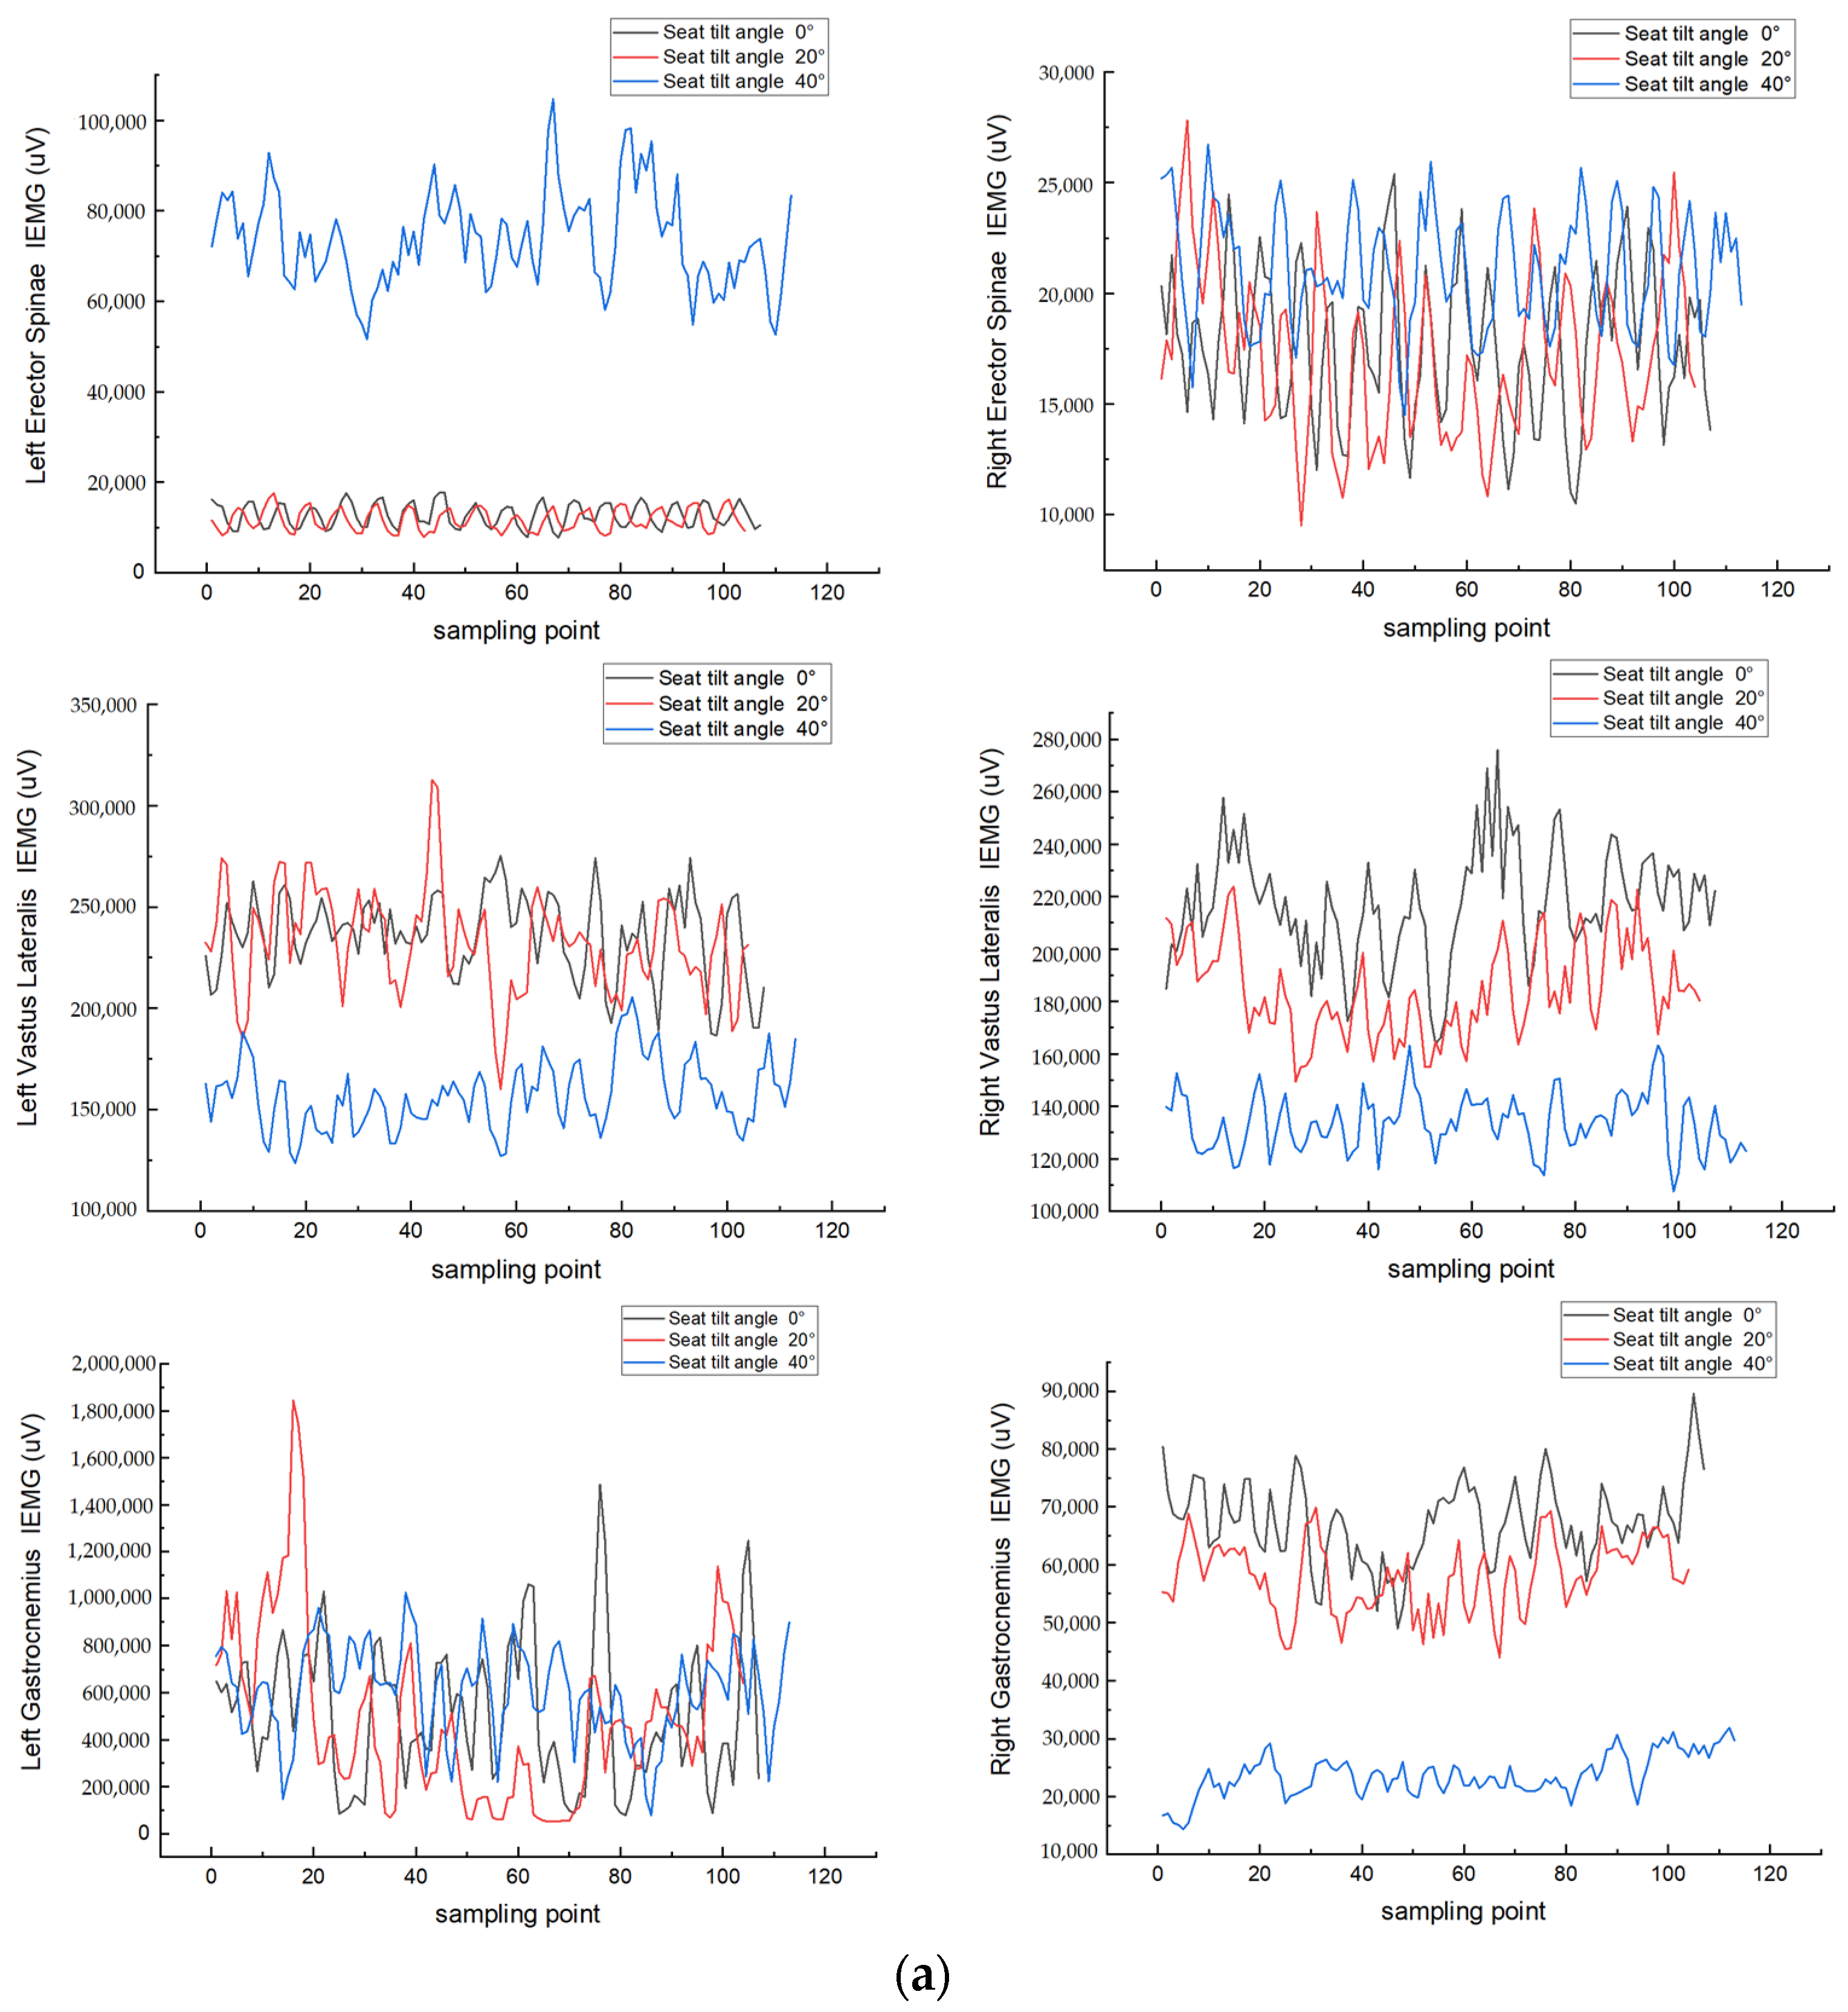
Additionally, as shown in Figure 9, some EMG signal data exhibit periodic peaks, indicating the repetitiveness of the measured activities. For example, during computer typing and writing tasks, the periodic peaks correspond to the repetitive movements of the hands and fingers, resulting in continuous bursts of muscle activity. Similarly, during the ironing process, the repetitive back-and-forth movements of the iron produce periodic peaks in the EMG signals of the shoulder and arm muscles. These patterns are crucial for understanding muscle activation and fatigue.
Considering both body pressure distribution and surface electromyographic (sEMG) signals, our analysis indicates that a seat incline angle of 20° generally provides higher levels of comfort during computer and writing tasks. However, during ironing tasks, the comfort of the erector spinae muscles is notably enhanced at a 20° incline angle, while the comfort of the vastus lateralis and gastrocnemius muscles is maximized at 0°. These findings underscore the individualized nature of comfort preferences across different task scenarios, suggesting that users may tailor their choice of seat incline angle to suit the demands of their specific work tasks or accommodate their unique physical health considerations.
These experimental results, obtained through various experimental methods, are generally consistent with the findings of Nicoletti et al. [8]. Unlike previous studies that only focused on muscle parameters [11,12], our method combines body pressure distribution and sEMG, overcoming the limitations of past approaches and making this objective measure of comfort more convincing.
Certainly, there are several limitations in this study.
Although a sample size of 12 participants is sufficient to detect significant differences (medium effect size, effect size = 0.8) according to Cohen’s guidelines, it remains relatively small for this experiment, limiting the generalizability of the results. Within the graduate student population, factors such as different majors, genders, and health statuses might lead to varying outcomes. The experiment’s participants were primarily graduate students, whose age, health status, and lifestyle habits are relatively uniform, potentially not representing a broader population or individuals from other age groups. While this homogeneity reduces variability caused by individual differences, it also restricts the external validity of the results.
Individuals with different weights and body types exhibit significant differences in contact area and pressure distribution at various chair angles. Despite efforts to select participants with similar heights but different weights, the range of BMI and weight distribution was still narrow, failing to adequately represent the diversity of the broader population. Therefore, the applicability of the results to people with different weights and body types is limited.
While the study selected key muscle groups (bilateral erector spinae, bilateral vastus lateralis, and bilateral gastrocnemius) to reflect muscle activity in different parts of the body, these muscle groups mainly reflect the muscle activity in the lower back, legs, and calves. They do not include other muscle groups that may significantly impact sitting comfort and dynamic balance, such as the gluteus maximus and abdominal muscles.
There are also certain inaccuracies inherent to the experimental instruments used, and environmental conditions such as temperature, humidity, and lighting might have affected the experimental results, which were not precisely controlled during the experiment.
Although this study has limitations in sample selection, sample size, muscle group selection, and experimental environment, its findings still make significant contributions to the field. The versatility in seat incline angle preferences highlights the importance of ergonomic adaptability in seating design, allowing users to optimize comfort based on task requirements and individual needs. Moreover, our research highlights the complementary roles of pressure sensors and surface electromyography (sEMG) signals in providing comprehensive assessments of seat ergonomic quality. By integrating these evaluation methods, our study contributes to advancing the understanding of human sitting comfort and informs the development of more ergonomically optimized standing chairs.
Ultimately, our findings pave the way for future research endeavors aimed at refining seating designs to better support human comfort and well-being in various occupational settings. By leveraging the insights gleaned from pressure distribution and muscle activity analyses, designers and manufacturers can further enhance the ergonomic performance of standing chairs, thereby promoting healthier and more comfortable working environments.

5. Conclusions

The experimental method devised for the standing chair in this paper bridges the gap in research by integrating classical human body pressure distribution testing with refined electromyographic signal collection, thus delving into the forefront of this field. By simultaneously analyzing the interface pressure indices of the buttocks and soles of the feet under both static and dynamic sitting postures, alongside muscle activity data, researchers can comprehensively assess human comfort. This approach not only provides a thorough evaluation of seating comfort but also furnishes diverse data support, thereby bolstering the credibility of experimental findings. Through such a holistic assessment strategy, we gain deeper insights into how various work environments and seat incline angles impact human comfort, paving the way for more insightful future research and refined seating design.

Author Contributions

Conceptualization, W.Z. and Y.L.; methodology, W.Z., Y.L. and C.F.; software, W.Z. and C.F.; validation, W.Z. and C.C.; formal analysis, W.Z. and C.C.; investigation, W.Z. and Y.L.; data curation, W.Z., Y.L. and C.C.; writing—original draft preparation, W.Z. and Y.L.; writing—review and editing, W.Z., Y.L. and C.F. All authors have read and agreed to the published version of the manuscript.

Funding

This research was funded by the National Key R&D Program of China (2022YFC360 1704), the Xi’an Jiaotong University City College Youth Programme (2024Q04) and the University Innovation Team.

Institutional Review Board Statement

Ethical review and approval were waived for this study due to the following reasons: 1. Since the research subject is standing seats, the study does not involve invasive experiments on human subjects. 2. The research collects physiological parameters related to seat comfort, which are generally not considered sensitive information. 3. The risk is low and does not pose significant physical or psychological harm to participants. 4. Additionally, the study on seat comfort does not fall under the medical research category.

Informed Consent Statement

Informed consent was obtained from all participants involved in the study.

Data Availability Statement

The raw data supporting the conclusions of this article will be made available by the authors on request.

Acknowledgments

The authors would like to thank all the participants in the experiment and the members of the seat digital design team.

Conflicts of Interest

The authors declare no conflicts of interest.

Appendix A

The average pressure, denoted as p v , is calculated as the arithmetic mean of all pressure measurement points. It is computed by summing up the pressure values p i of each test point and dividing by the total number of test points N . Mathematically, it can be expressed as
p v = 1 N i = 1 N p i
Here, N represents the total number of test points, and p i denotes the pressure measured at each test point.
Let N represent the length of a segment of sEMG signal, i.e., the number of valid sampling points; x i represents the amplitude of the i -th point within this segment. Integrated Electromyography (IEMG) reflects the intensity of muscle activity over time. The calculation formula is as follows:
I E M G = N 2 N 1 X ( t )
Here, N 1 represents the starting point of integration, N 2 represents the end point of integration, and X ( t ) denotes the collection of time-series signals x 1 , x 2 , , x i .
The median frequency is the frequency at which half of the total power of the power spectrum is below and half is above. Its formula is as follows:
i = 1 M F p i = i = M F N p i = 1 2 i = 1 N p i

References

  1. Graf, M.; Krieger, R.; Läubli, T.; Martin, B.J. Should we recommend people to stand more than sit at work. In Proceedings of the 19th Triennial Congress of the IEA, Melbourne, Australia, 9–14 August 2015. [Google Scholar]
  2. Fang, Y.; Pan, S.; Duan, J. Health hazards of musculoskeletal disorders in office sedentary work and its countermeasures. Health Health Educ. Health Promot. 2014, 9, 326–329. [Google Scholar]
  3. Andersen, J.H.; Haahr, J.P.; Frost, P. Risk Factors for More Severe Regional Musculoskeletal Symptoms A Two-Year Prospective Study of a General Working Population. Arthritis. Rheum. 2007, 56, 1355–1364. [Google Scholar] [CrossRef] [PubMed]
  4. Saiklang, P.; Chatprem, T.; Karoonsupcharoen, O.; Saiklang, P.; Puntumetakul, R. The Comparison of the Effect of Prolonged Sitting on Lumbar Repositioning Error in Asymptomatic and Chronic Low Back Pain Participants with Seated Sedentary Behavior. Trends Sci. 2024, 21, 7332. [Google Scholar] [CrossRef]
  5. Wnuk, B.R.; Ziaja, D.; Buczek, M.; Ziaja, K.; Banyś, M. Effect of passive ankle movement in the sitting position on the symptoms of chronic venous insufficiency with long-term observation. Adv. Clin. Exp. Med. 2024, 33, 135–141. [Google Scholar] [CrossRef] [PubMed]
  6. Bailey, D.P.; Locke, C.D. Breaking up prolonged sitting with light-intensity walking improves postprandial glycemia, but breaking up sitting with standing does not. J. Sci. Med. Sport. 2015, 18, 294–298. [Google Scholar] [CrossRef]
  7. Koepp, G.A.; Manohar, C.U.; McCrady-Spitzer, S.K.; Ben-Ner, A.; Hamann, D.J.; Runge, C.F.; Levine, J.A. Treadmill desks: A 1-year prospective trial. Obesity 2013, 21, 705–711. [Google Scholar] [CrossRef]
  8. Nicoletti, C.; Läubli, T. Leg and back muscle activity, heart rate, performance and comfort during sitting, standing, and using a sit-stand-support with different seat angles. Int. J. Ind. Ergon. 2018, 67, 73–80. [Google Scholar] [CrossRef]
  9. Bendix, T.; Krohn, L.; Jessen, F.; Aarås, A. Trunk posture and trapezius muscle load while working in standing, supported-standing, and sitting positions. Spine 1985, 10, 433–439. [Google Scholar] [CrossRef]
  10. Buchman-Pearle, J.M.; Gruevski, K.M.; Gallagher, K.M.; Barrett, J.M.; Callaghan, J.P. Defining the lumbar and trunk-thigh neutral zone from the passive stiffness curve: Application to hybrid sit-stand postures and chair design. Ergonomics 2023, 66, 338–349. [Google Scholar] [CrossRef]
  11. Antle, D.M.; Vézina, N.; Côté, J.N. Comparing standing posture and use of a sit-stand stool: Analysis of vascular, muscular and discomfort outcomes during simulated industrial work. Int. J. Ind. Ergon. 2015, 45, 98–106. [Google Scholar] [CrossRef]
  12. Gao, Y.; Cronin, N.J.; Pesola, A.J.; Finni, T. Muscle activity patterns and spinal shrinkage in office workers using a sit-stand workstation versus a sit workstation. Ergonomics 2016, 59, 1267–1274. [Google Scholar] [CrossRef] [PubMed]
  13. Gao, L.; Flego, A.; Dunstan, D.W.; Winkler, E.A.; Healy, G.N.; Eakin, E.G.; Willenberg, L.; Owen, N.; LaMontagne, A.D.; Lal, A.; et al. Economic evaluation of a randomized controlled trial of an intervention to reduce office workers’ sitting time: The “Stand Up Victoria” trial. Scand. J. Work. Environ. Health 2018, 44, 503–511. [Google Scholar] [CrossRef] [PubMed]
  14. Zhu, W.; Gutierrez, M.; Toledo, M.J.; Mullane, S.; Stella, A.P.; Diemar, R.; Buman, K.F.; Buman, M.P. Long-term effects of sit-stand workstations on workplace sitting: A natural experiment. J. Sci. Med. Sport. 2018, 21, 811–816. [Google Scholar] [CrossRef]
  15. Rao, G.; Men, Q.; Xie, W.; Chen, F. Research on Static Equilibrium Parameters of Office Seat. Mach. Des. Manuf. 2019, 09, 172–175+180. [Google Scholar]
  16. Makhsous, M.; Lin, F.; Hanawalt, D.; Kruger, S.L.; LaMantia, A. The effect of chair designs on sitting pressure distribution and tissue perfusion. Hum. Factors 2012, 54, 1066–1074. [Google Scholar] [CrossRef] [PubMed]
  17. Ahmadian, M.; Seigler, T.M.; Clapper, D.; Sprouse, A. Alternative Test Methods for Long Term Dynamic Effects of Vehicle Seats; SAE Technical Work; SAE International: Warrendale, PA, USA, 2014. [Google Scholar]
  18. Matsushita, Y.; Kuwahara, N.; Morimoto, K. Relationship between Comfortable Feelings and Distribution of Seat Pressure in Sustaining a Sitting Posture for a Long Time; Stephanidis, C., Ed.; HCI 2014; CCIS; Springer: Cham, Switzerland, 2014; Volume 435, pp. 473–478. [Google Scholar]
  19. Fasulo, L.; Naddeo, A.; Cappetti, N. A study of classroom seat (dis)comfort: Relationships between body movements, center of pressure on the seat, and lower limbs’ sensations. Appl. Ergon. 2019, 74, 233–240. [Google Scholar] [CrossRef] [PubMed]
  20. Kingma, I.; van Dieën, J.H. Static and dynamic postural loadings during computer work in females: Sitting on an office chair versus sitting on an exercise ball. Appl. Ergon. 2009, 40, 199–205. [Google Scholar] [CrossRef] [PubMed]
  21. Weston, E.; Le, P.; Marras, W.S. A biomechanical and physiological study of office seat and tablet device interaction. Appl. Ergon. 2017, 62, 83–93. [Google Scholar] [CrossRef]
  22. Gold, J.E.; Driban, J.B.; Yingling, V.R.; Komaroff, E. Characterization of posture and comfort in laptop users in non-desk settings. Appl. Ergon. 2012, 43, 392–399. [Google Scholar] [CrossRef]
  23. Wang, H.; Weiss, K.J.; Haggerty, M.C.; Heath, J.E. The effect of active sitting on trunk motion. J. Sport Health Sci. 2014, 3, 333–337. [Google Scholar] [CrossRef]
  24. Sánchez, M.B.; Loram, I.; Darby, J.; Holmes, P.; Butler, P.B. A video based method to quantify posture of the head and trunk in sitting. Gait Posture 2017, 51, 181–187. [Google Scholar] [CrossRef] [PubMed]
  25. Dong, R.-C.; He, L.; Du, W.; Cao, Z.-K.; Huang, Z.-L. Effect of sitting posture and seat on biodynamic responses of internal human body simulated by finite element modeling of body-seat system. J. Sound. Vib. 2019, 438, 543–554. [Google Scholar] [CrossRef]
  26. Dong, N. Study on the Chaise Longue Back Measurements of Body Comfort Based on Body Pressure Distribution. Master’s Thesis, Central South University of Forestry & Technology, Changsha, China, 2015. [Google Scholar]
  27. Lu, S.-Y.; Liu, C.-C.; Lee, C.-L.; Lin, Y.-H. Vertical Vibration Frequency and Sitting Posture Effects on Muscular Loads and Body Balance. Int. J. Ind. Ergon. 2019, 74, 102860. [Google Scholar] [CrossRef]
  28. Barroso, F.O.; Neto, O.P.; Filho, P.J.S. Evaluation of Muscle Activity and Postural Changes During Prolonged Sitting on a Novel Sit-Stand Stool. Appl. Ergon. 2021, 92, 103317. [Google Scholar]
  29. Bagherzadeh Fini, M.; Jafarnezhadgero, A.A.; Rahimi, A.; Aminian, G. Trunk Muscle Activation During Sitting on Stable and Unstable Surfaces: A Systematic Review and Meta-analysis of Electromyographic Studies. Clin. Biomech. 2018, 59, 174–183. [Google Scholar]
  30. Guan, Q.; Yang, Z.; Lu, H.; Guo, S. Analysis of Comfort during Transfer by a Dual-Arm Care Robot Based on Human Body Pressure and Surface Electromyographic Signals. Bioengineering 2023, 10, 903. [Google Scholar] [CrossRef]
  31. Nicol, K.; Rusteberg, D. Pressure distribution on mattresses. J. Biomech. 1993, 26, 1479–1486. [Google Scholar] [CrossRef]
  32. De Looze, M.P.; Kuijt-Evers, L.F.; van Dieën, J. Sitting comfort and discomfort and the relationships with objective measures. Ergonomics 2003, 46, 985–997. [Google Scholar] [CrossRef]
  33. Huang, S.; Zhang, Z.; Xu, Z.; He, Y. Modeling of human model for static pressure distribution prediction. Int. J. Ind. Ergon. 2015, 50, 186–195. [Google Scholar] [CrossRef]
  34. Hermens, H.J.; Freriks, B.; Disselhorst-Klug, C.; Rau, G. Development of recommendations for SEMG sensors and sensor placement procedures. J. Electromyogr. Kinesiol. 2000, 10, 361–374. [Google Scholar] [CrossRef]
  35. Zhang, K. Study on Prediction of Muscle Force and Quantitative Evaluation of Muscle Fatigue Algorithm of Upper Limb Elbow joint. Master’s Thesis, Xinjiang University, Urumqi, China, 2020. [Google Scholar]
Figure 1. Research method flow chart.
Applsci 14 06009 g001
Figure 2. Experimental equipment and scene: (a) EMG signal collector; (b) human body pressure distribution acquisition instrument; (c) experimental scenarios.
Applsci 14 06009 g002
Figure 3. Standing seat model: (a) seat tilt angle 0°; (b) seat tilt angle 20°; (c) seat tilt angle 40°s.
Applsci 14 06009 g003
Figure 4. Two-dimensional diagram of the contact area between hip and sole: (a) pressure distribution when the tilt angle of the seat is 0°; (b) pressure distribution when the tilt angle of the seat is 20°; (c) pressure distribution when the tilt angle of the seat is 40°.
Applsci 14 06009 g004
Figure 5. Contact area between hip and sole.
Applsci 14 06009 g005
Figure 6. Average pressure on hips and soles.
Applsci 14 06009 g006
Figure 7. Maximum pressure on hips and soles.
Applsci 14 06009 g007
Figure 8. sEMG pretreatment process.
Applsci 14 06009 g008
Figure 9. Comparison of IEMG of different muscles: (a) IEMG of muscles under computer tasks; (b) IEMG of muscles under the writing task; (c) IEMG of muscles under ironing tasks.
Applsci 14 06009 g009aApplsci 14 06009 g009bApplsci 14 06009 g009c
Table 1. Demographic information of participants.
GenderAgeHeight (mm)Weight (kg)
P1male2617565.0
P2female2716360.2
P3male2617779.6
P4male2818275.8
P5female2617351.5
P6female2716565.3
P7male2518475.5
P8male2418180.2
P9male2617372.5
P10female2416063.0
P11female2716158.1
P12female2516070.2
Table 2. Changes in the mean value of MPF of each muscle under the three tilt angles of the chair surface (Hz).
Name of MuscleMean Muscle MPF under Computer TasksMean Muscle MPF under the Writing TaskMean Muscle MPF under Ironing Tasks
20°40°20°40°20°40°
Erector Spinae (left)146.06148.06147.09128.81149.68151.06156.00152.00139.78
Erector Spinae (right)155.02157.60160.44156.67157.15154.88155.34152.60142.78
Vastus Lateralis (left)153.58155.09154.21154.65156.67153.56154.12153.70151.42
Vastus Lateralis (right)149.60149.41148.81149.26149.22150.65149.56149.31148.06
Gastrocnemius (left)167.76167.79168.27150.51154.66151.38145.26136.98131.41
Gastrocnemius (right)152.90153.80152.03167.27167.85168.13168.81167.58168.49
Table 3. The more advantageous angle values for each muscle in different task environments.
Name of MuscleComputer TasksWriting TaskIroning Tasks
IEMGMPFIEMGMPFIEMGMPF
erector spinae muscle (left)20°20°20°40°20°
erector spinae muscle (right)20°40°20°20°20°
Lateral femoral muscle (left)40°20°40°20°40°
Lateral femoral muscle (right)40°20/40°40°40°20°
Gastrocnemius muscle (left)20°20/40°20°20°
Gastrocnemius muscle (right)40°20°40°20°40°
Disclaimer/Publisher’s Note: The statements, opinions and data contained in all publications are solely those of the individual author(s) and contributor(s) and not of MDPI and/or the editor(s). MDPI and/or the editor(s) disclaim responsibility for any injury to people or property resulting from any ideas, methods, instructions or products referred to in the content.

