
A Standard Penetration Test-Based Step-by-Step Inverse Method for the Constitutive Model Parameters of the Numerical Simulation of Braced Excavation


Abstract
1. Introduction
2. SPT-Based Determination Method for Constitutive Parameters
2.1. Parameter Analysis of Constitutive Model
2.2. Multi-Parameter Optimization Method
2.3. SPT-Based Inverse Method for Constitutive Parameters
3. Case Study and Numerical Modeling
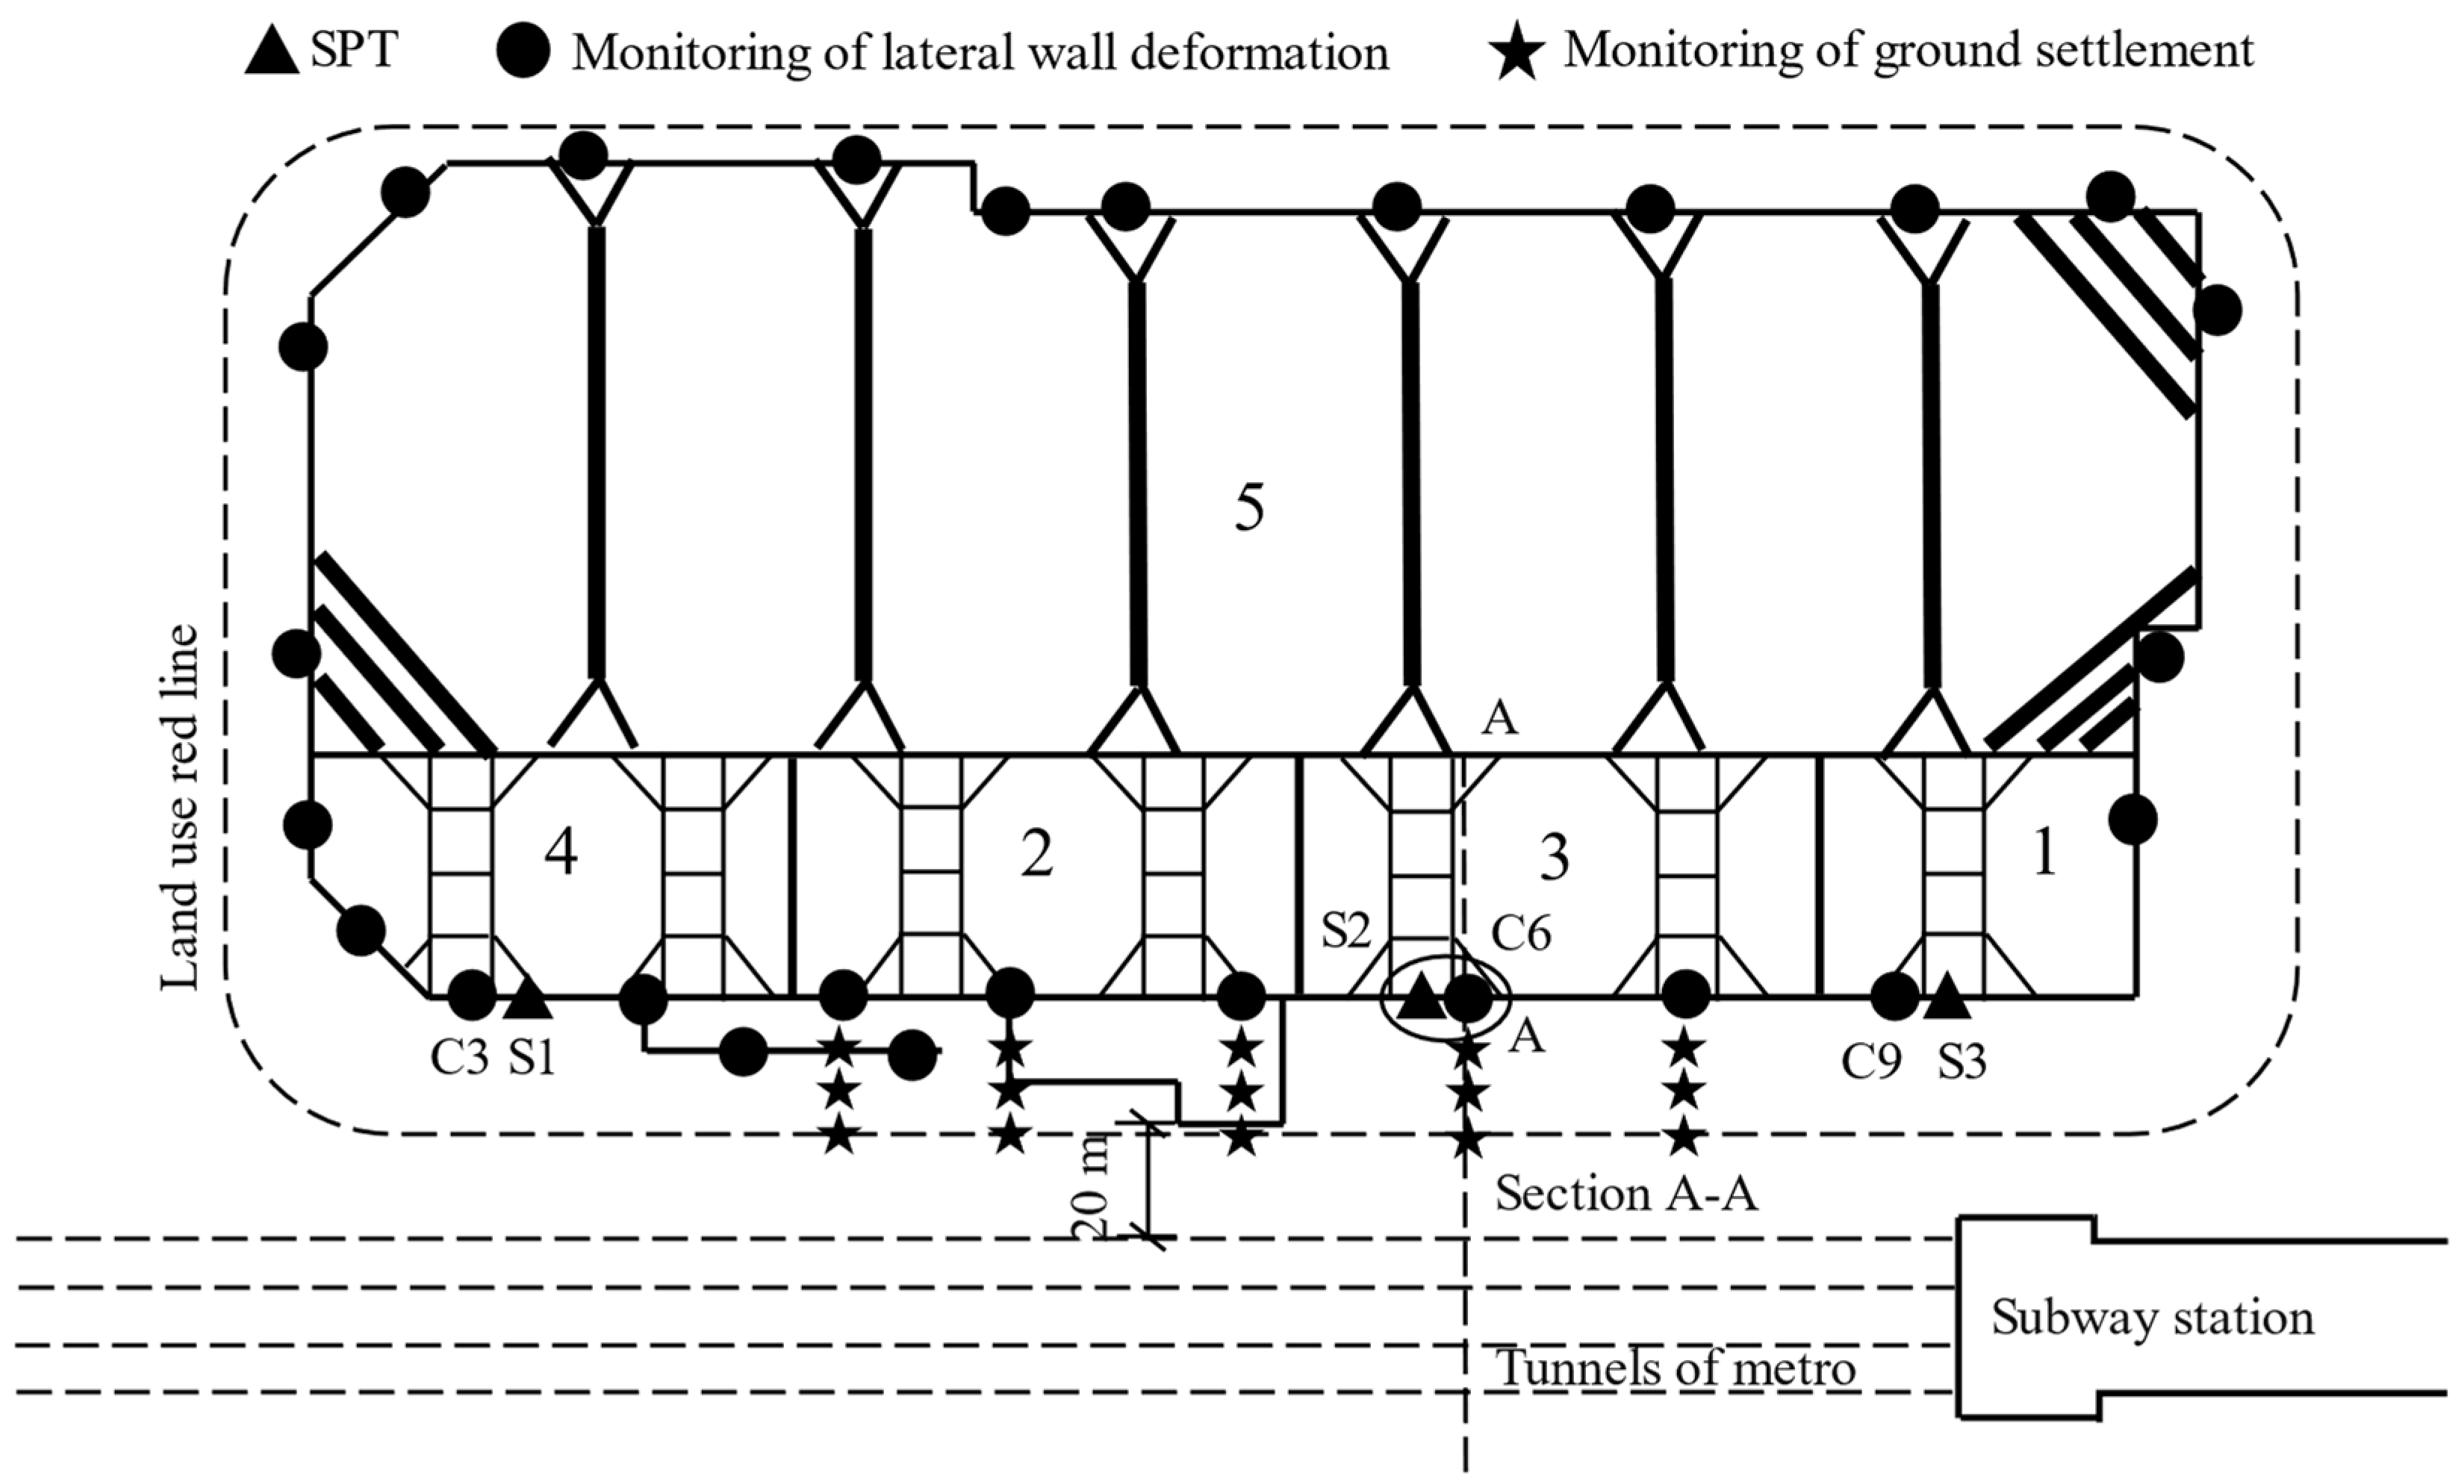
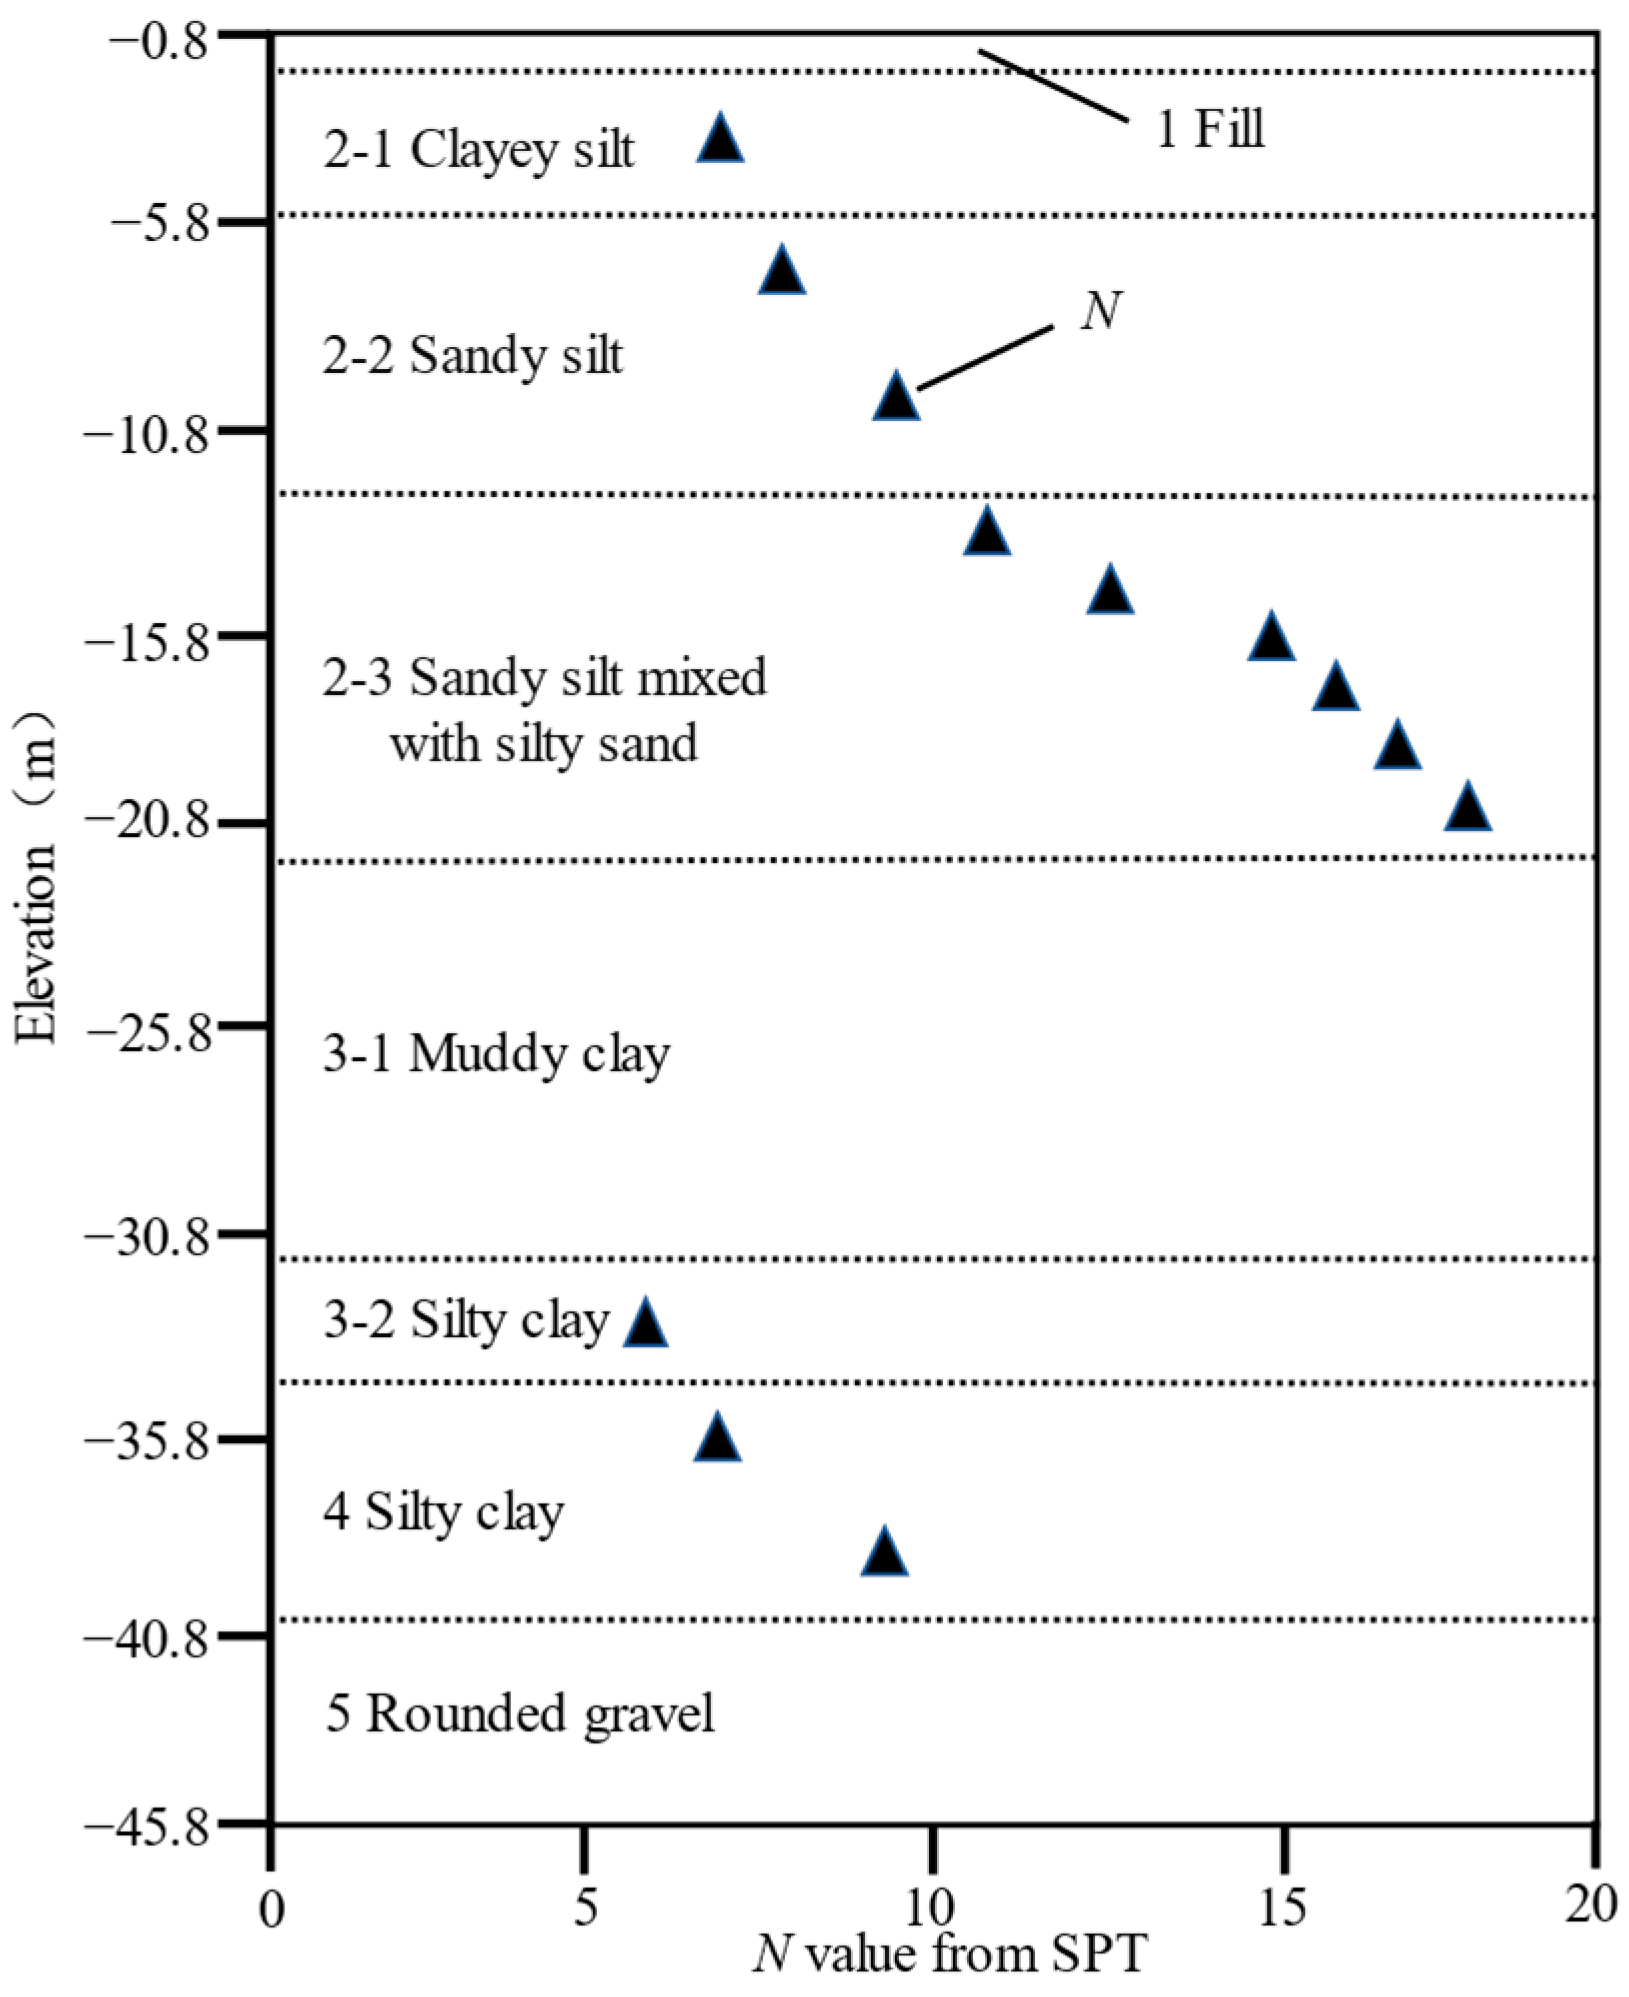
3.1. Construction Site
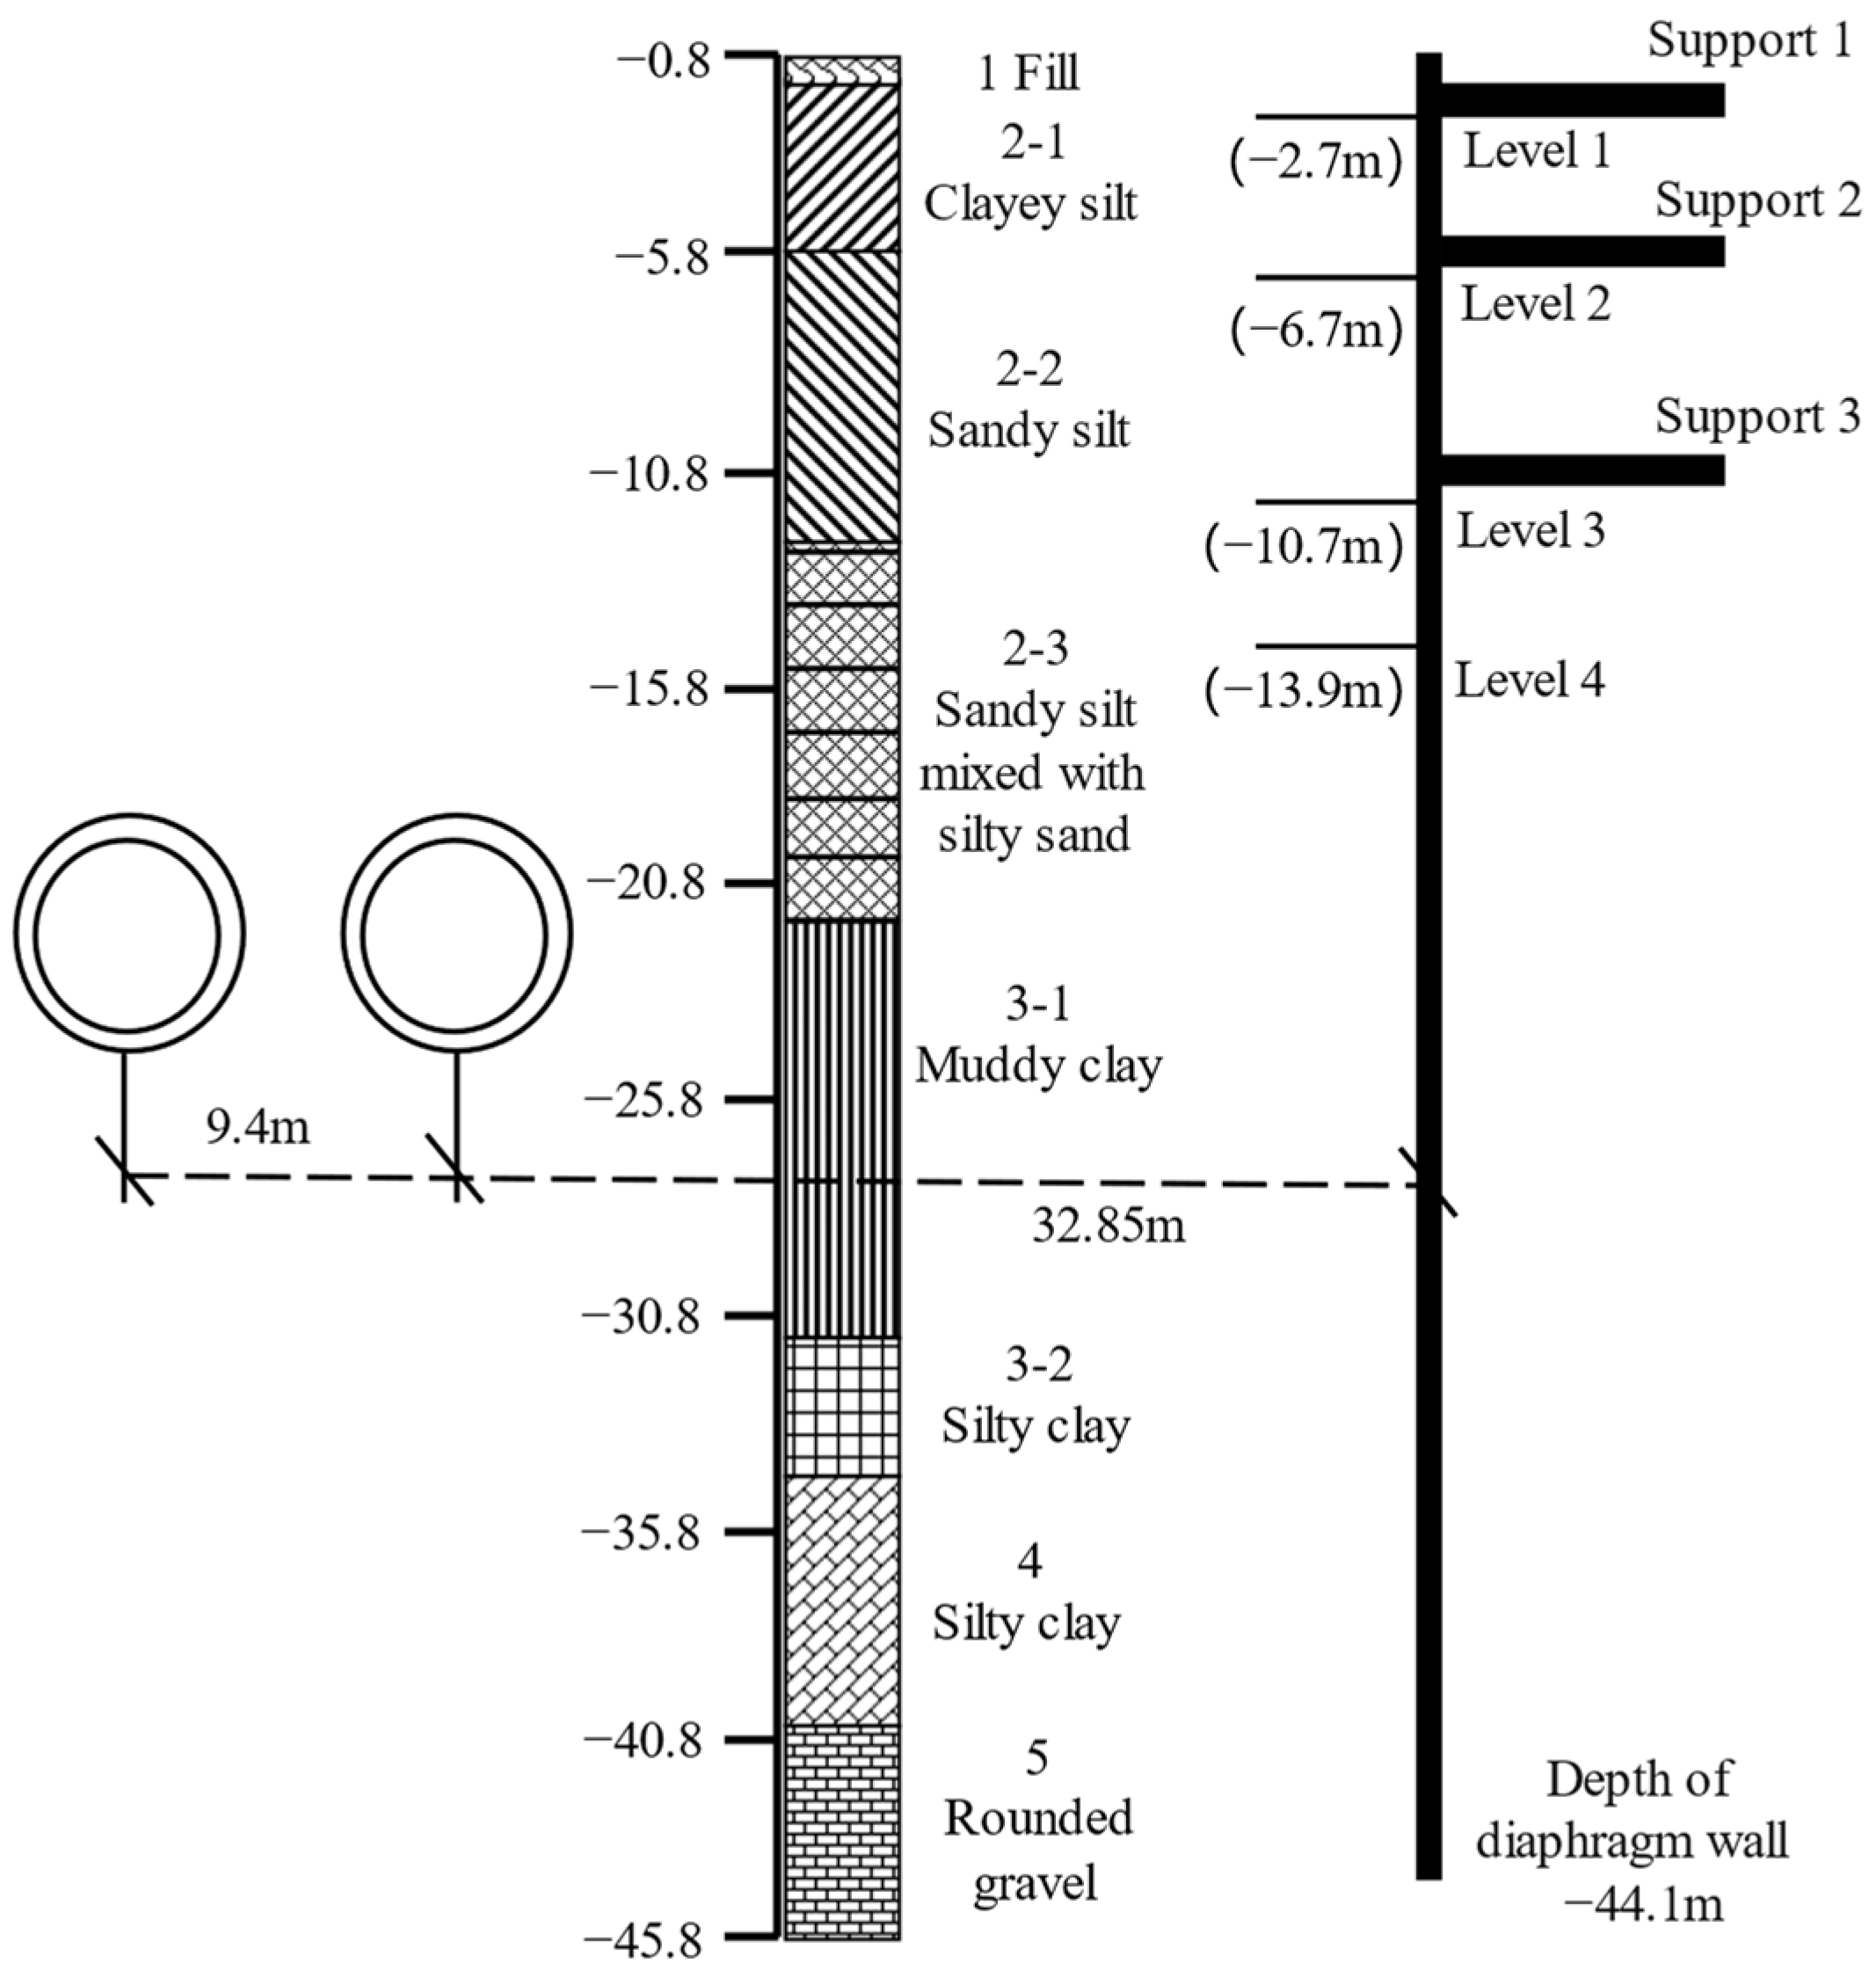
3.2. Finite Element Modeling

| Structural Parameters | Support Wall | Strut |
|---|---|---|
| Bending stiffness, EI (kN·m2/m) | 1,280,000 | / |
| Axial stiffness, EA (kN/m) | 24,000,000 | 19,200,000 |
| Poisson’s ratio (υ) | 0.2 | / |
| Horizontal spacing (m) | / | 8 |
4. Results and Discussion
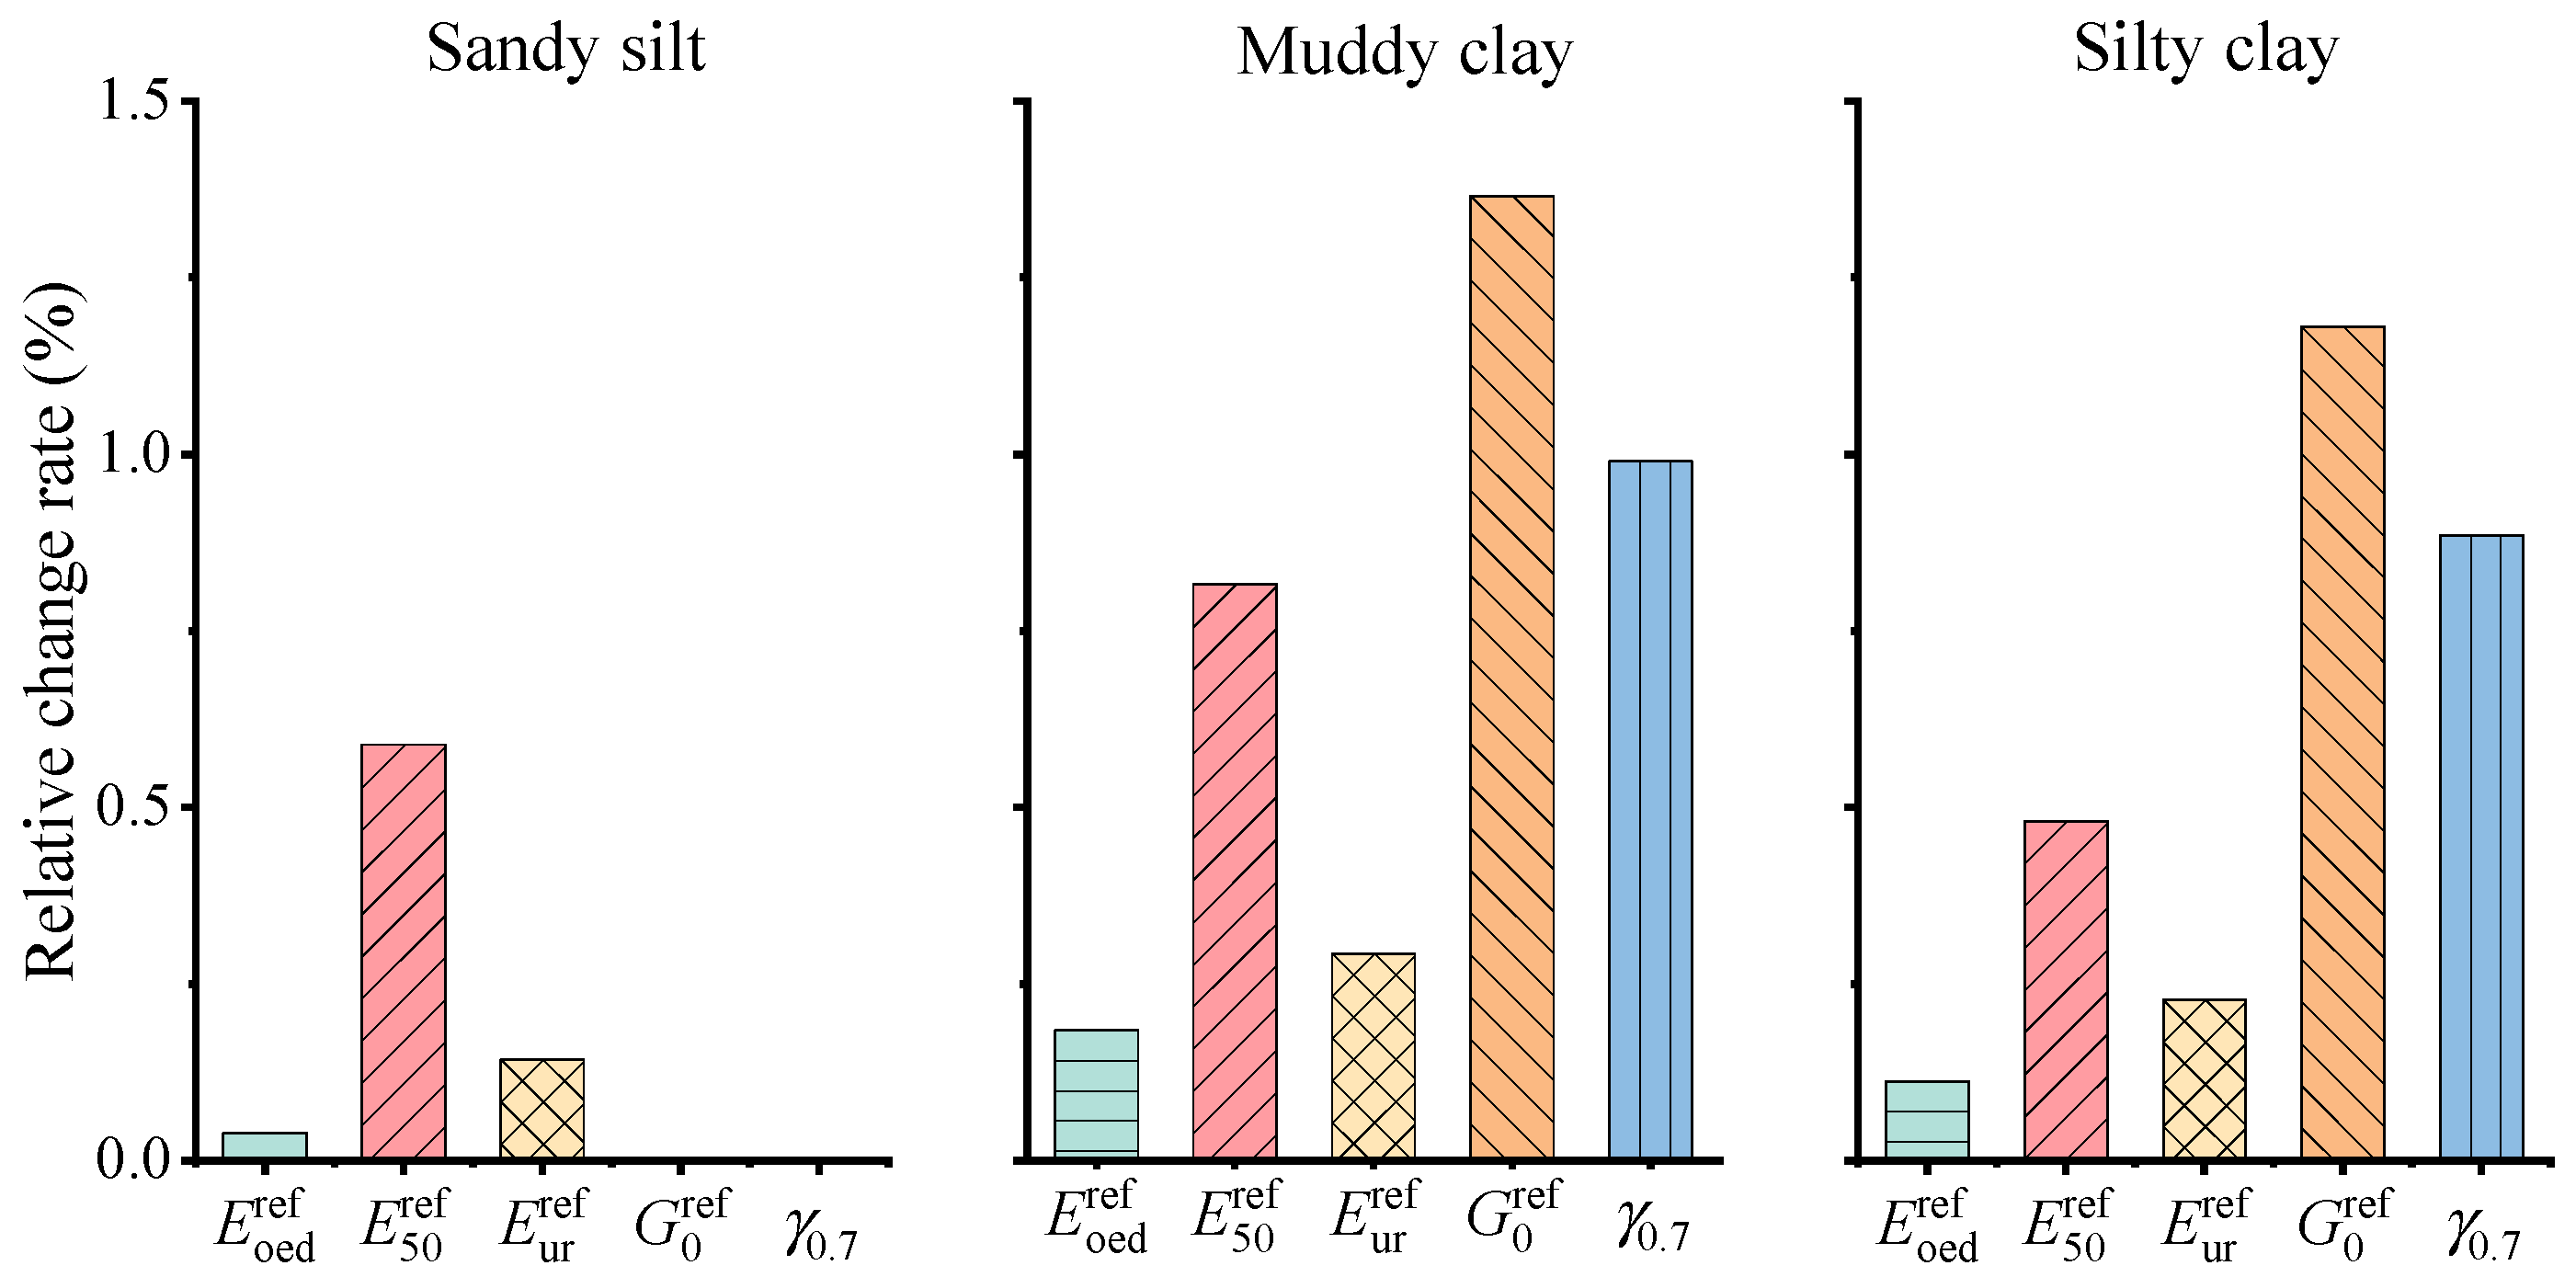
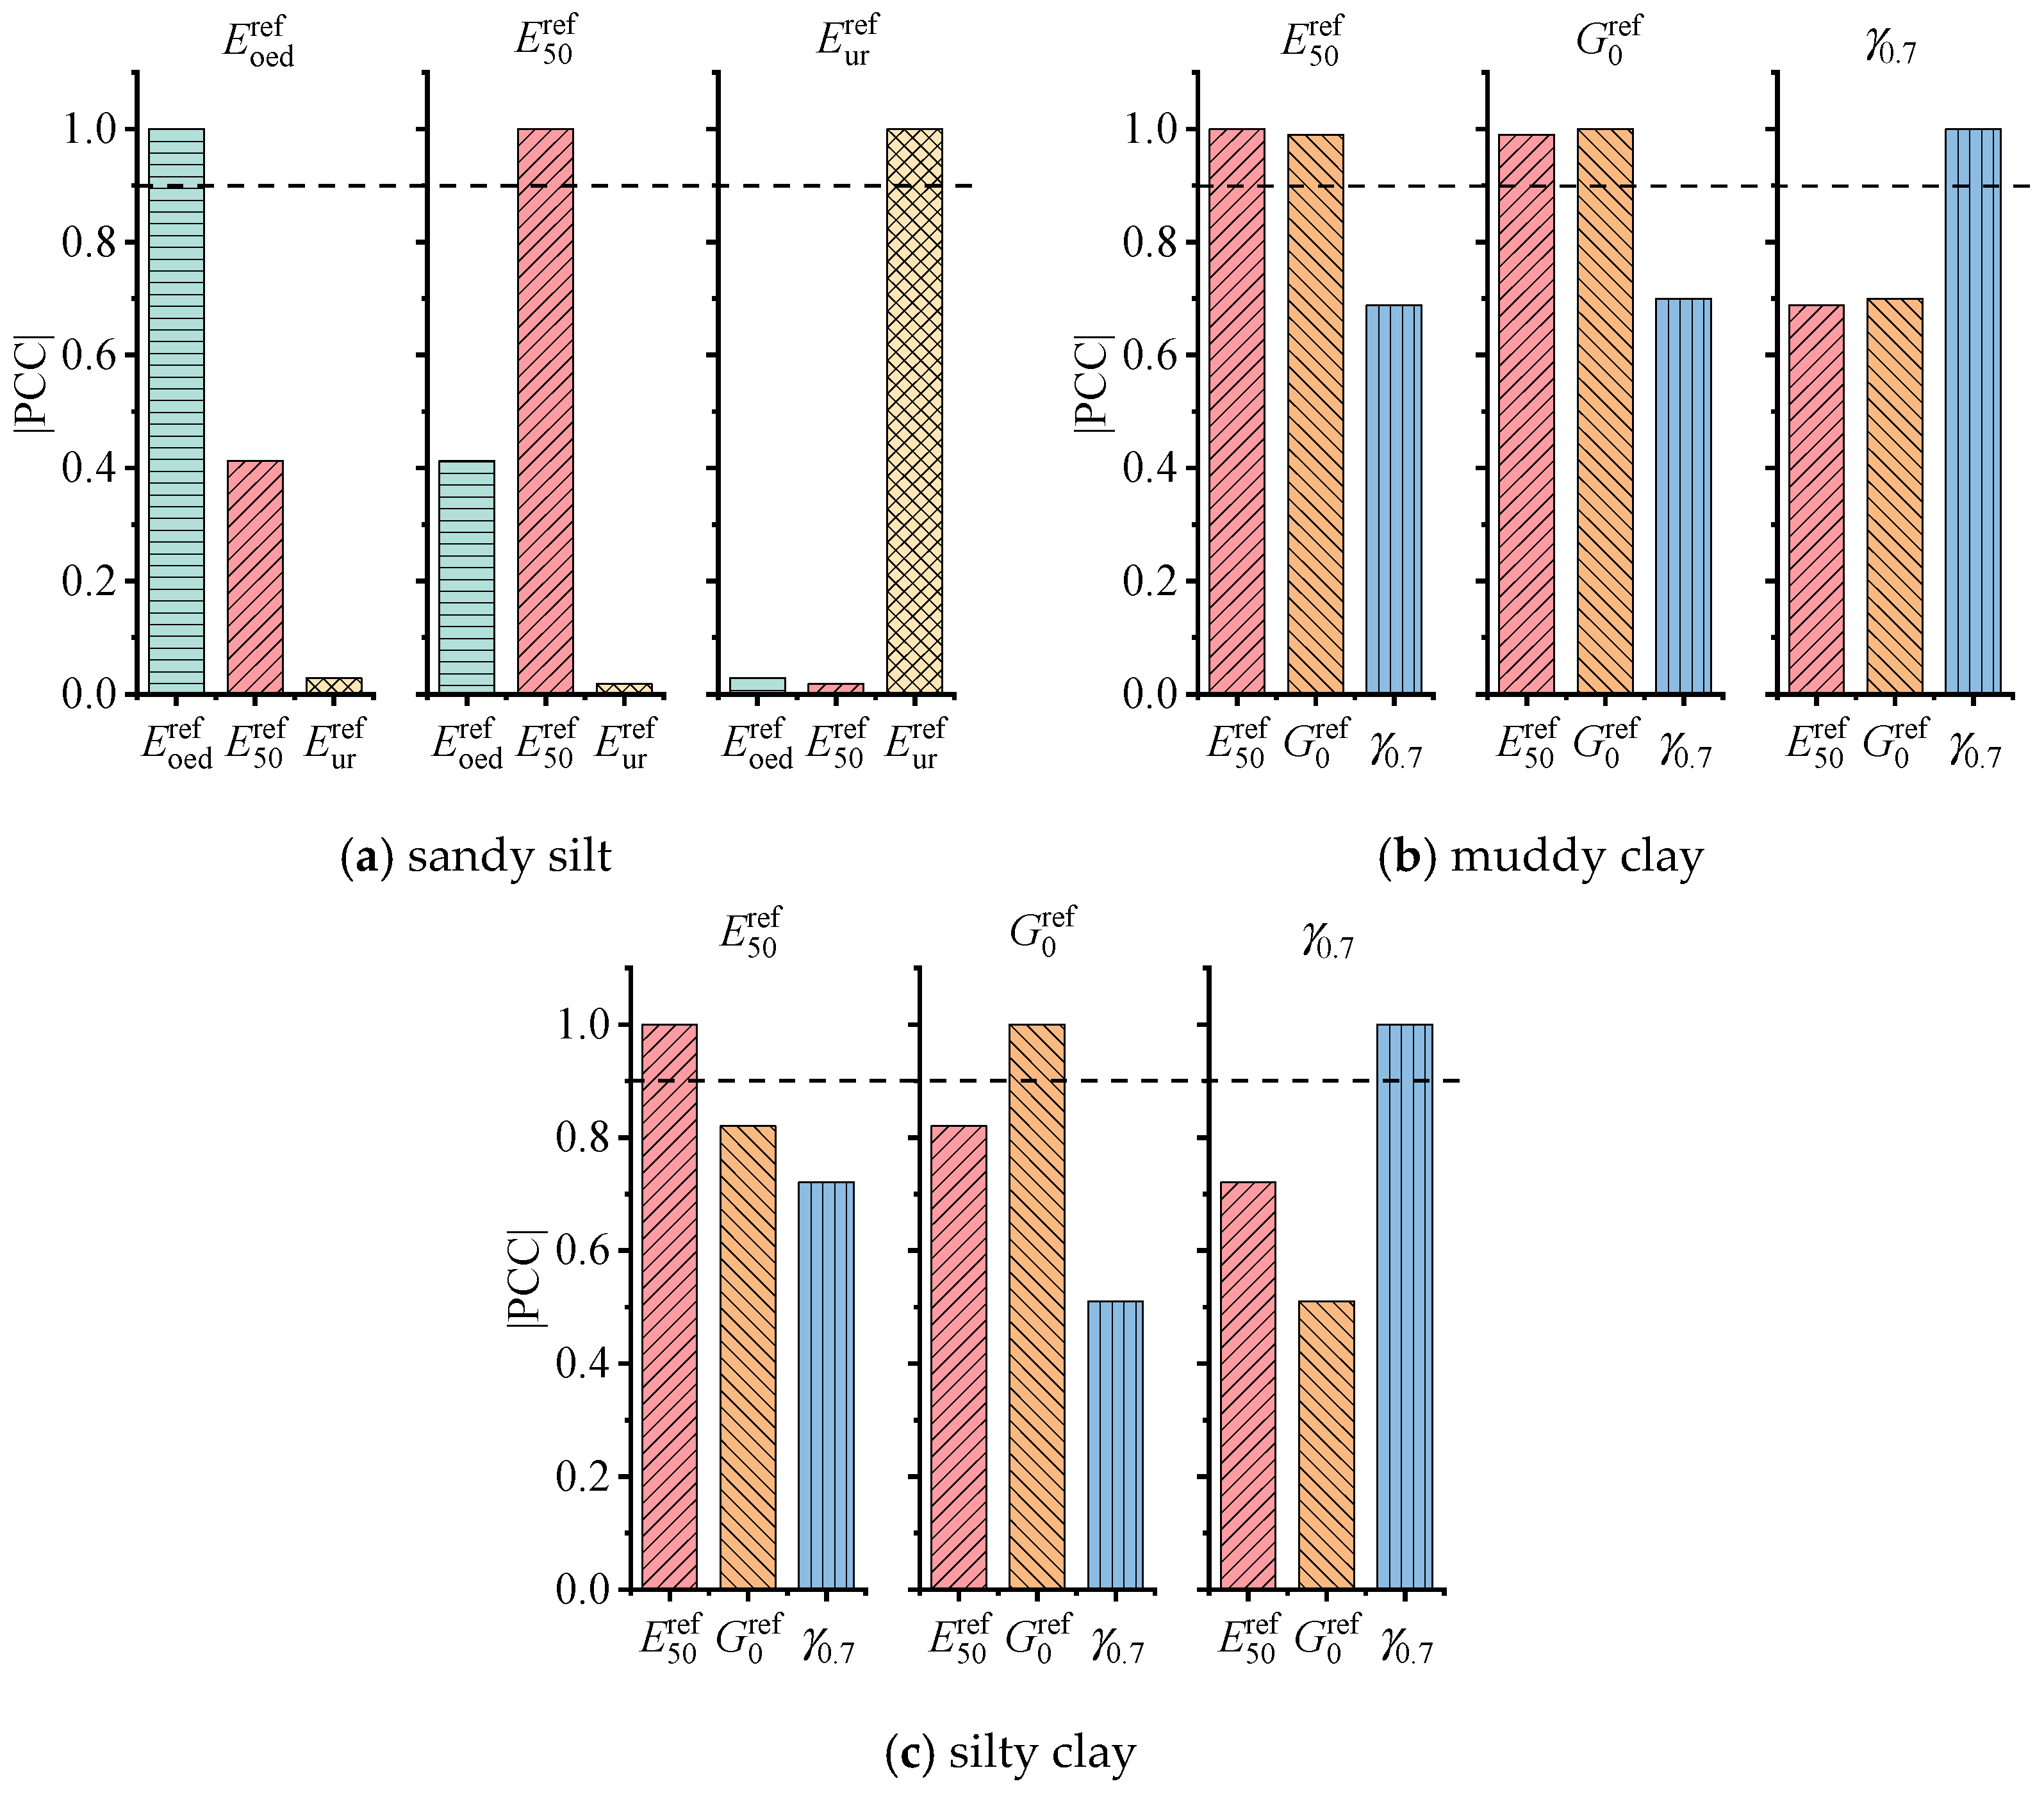
4.1. Selection of Key Constitutive Parameters
4.2. Inversion Results of Constitutive Model Parameters
4.2.1. Multi-Parameter Optimization Analysis
| Soil Type | Sandy Silt | Muddy Clay | Silty Clay | ||||||||
|---|---|---|---|---|---|---|---|---|---|---|---|
| Ratio | :Es1-2 | : | : | :Es1-2 | : | : | : | :Es1-2 | : | : | : |
| Range | 0.9–2.8 | 0.9–1.4 | 3–5.6 | 0.82–1.34 | 1.08–1.38 | 6.6–11 | 6.6–22 | 0.92–1.1 | 0.93–1.4 | 5.8–8.4 | 5.8–16.8 |
| 1 | 0.9 | 0.945 | 4.20 | 1.08 | 1.2 | 9.4 | 17.8 | 1 | 1.15 | 7.96 | 16.8 |
| 2 | 1.07 | 1.035 | 5.64 | 7.4 | 12.2 | 7.24 | 15.8 | ||||
| 3 | 1.24 | 1.125 | 3.96 | 10.6 | 6.6 | 6.52 | 14.8 | ||||
| 4 | 1.41 | 1.215 | 5.40 | 8.6 | 19.2 | 5.80 | 13.8 | ||||
| 5 | 1.58 | 1.305 | 3.72 | 6.6 | 13.6 | 8.20 | 12.8 | ||||
| 6 | 1.75 | 1.400 | 5.16 | 9.8 | 8.0 | 7.48 | 11.8 | ||||
| 7 | 1.92 | 0.900 | 3.48 | 7.8 | 20.6 | 6.76 | 10.8 | ||||
| 8 | 2.09 | 0.990 | 4.92 | 11.0 | 15.0 | 6.04 | 9.8 | ||||
| 9 | 2.26 | 1.080 | 3.24 | 9.0 | 9.4 | 8.44 | 8.8 | ||||
| 10 | 2.43 | 1.170 | 4.68 | 7.0 | 22.0 | 7.72 | 7.8 | ||||
| 11 | 2.6 | 1.260 | 3.00 | 10.2 | 16.4 | 7.00 | 6.8 | ||||
| 12 | 2.8 | 1.350 | 4.44 | 8.2 | 10.8 | 6.28 | 5.8 | ||||
4.2.2. Parameter Inversion of Constitutive Model
4.3. Empirical Relationship with the SPT Blow Counts
5. Conclusions
- (1).
- Through sensitivity and correlation analysis of the important parameters in the constitutive models, and γ0.7 are identified as the key parameters in the HS and HSS constitutive models. Given the relatively small strain associated with foundation pit excavation, the sensitivity of small strain parameters is significantly higher than that of large strain parameters.
- (2).
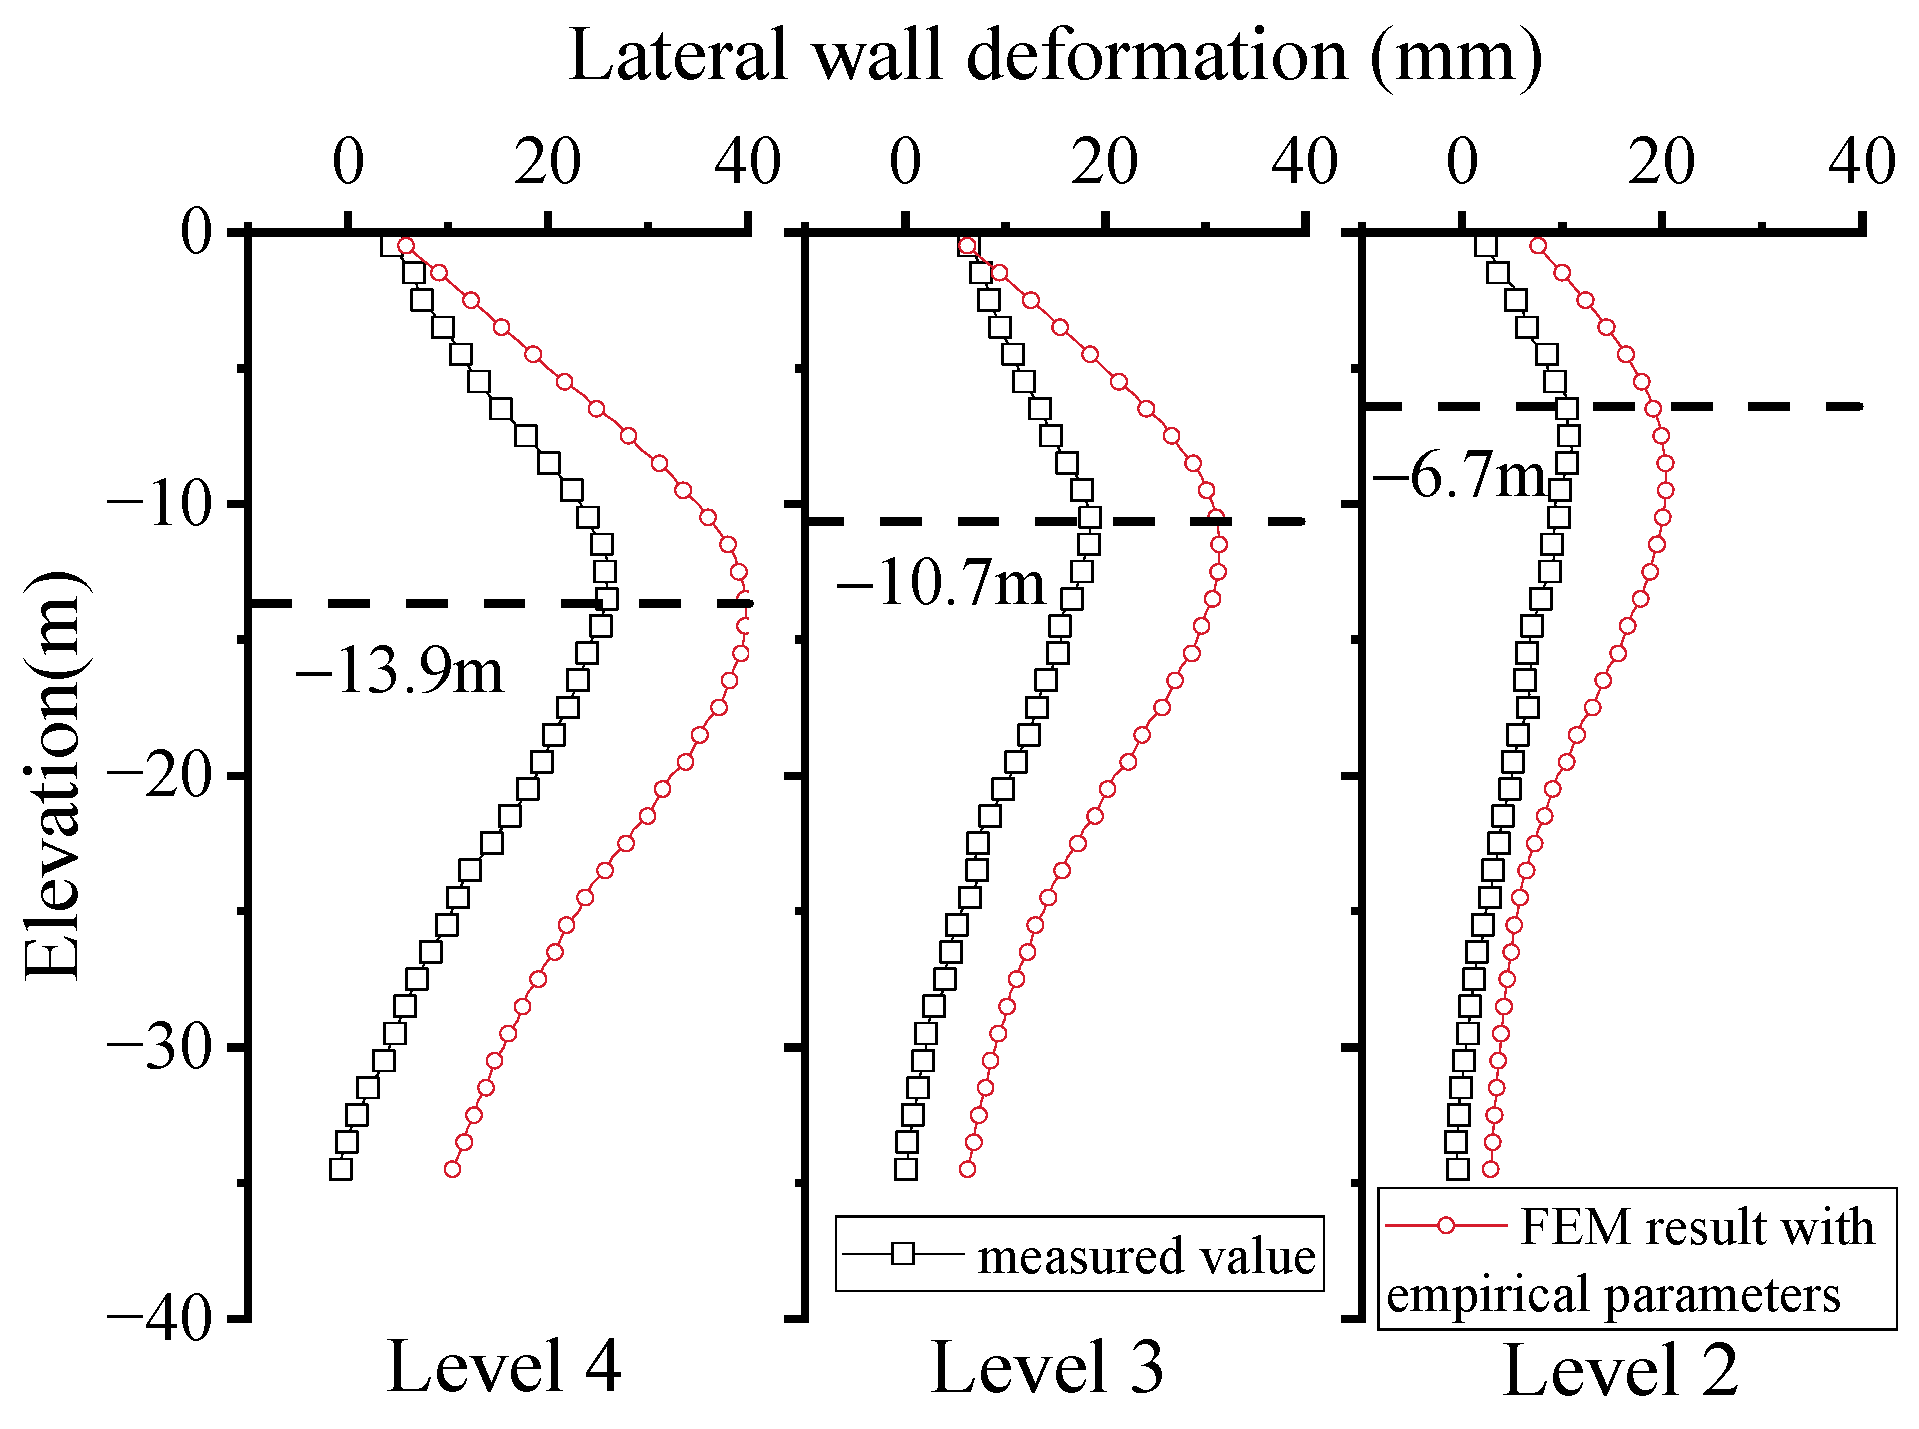
- The step-by-step inverse method not only reduces the number of parameters, but also improves the predicting accuracy. The maximum horizontal displacement of the retaining wall predicted by the proposed method is within ±15% of the measured value.
- (3).
- For the soil layer composed of sandy silt mixed with silty sand, the goodness of fit R2 between the key parameter of the HS model and the SPT blow counts was found to be 0.93, indicating a good linear correlation between them.
- (4).
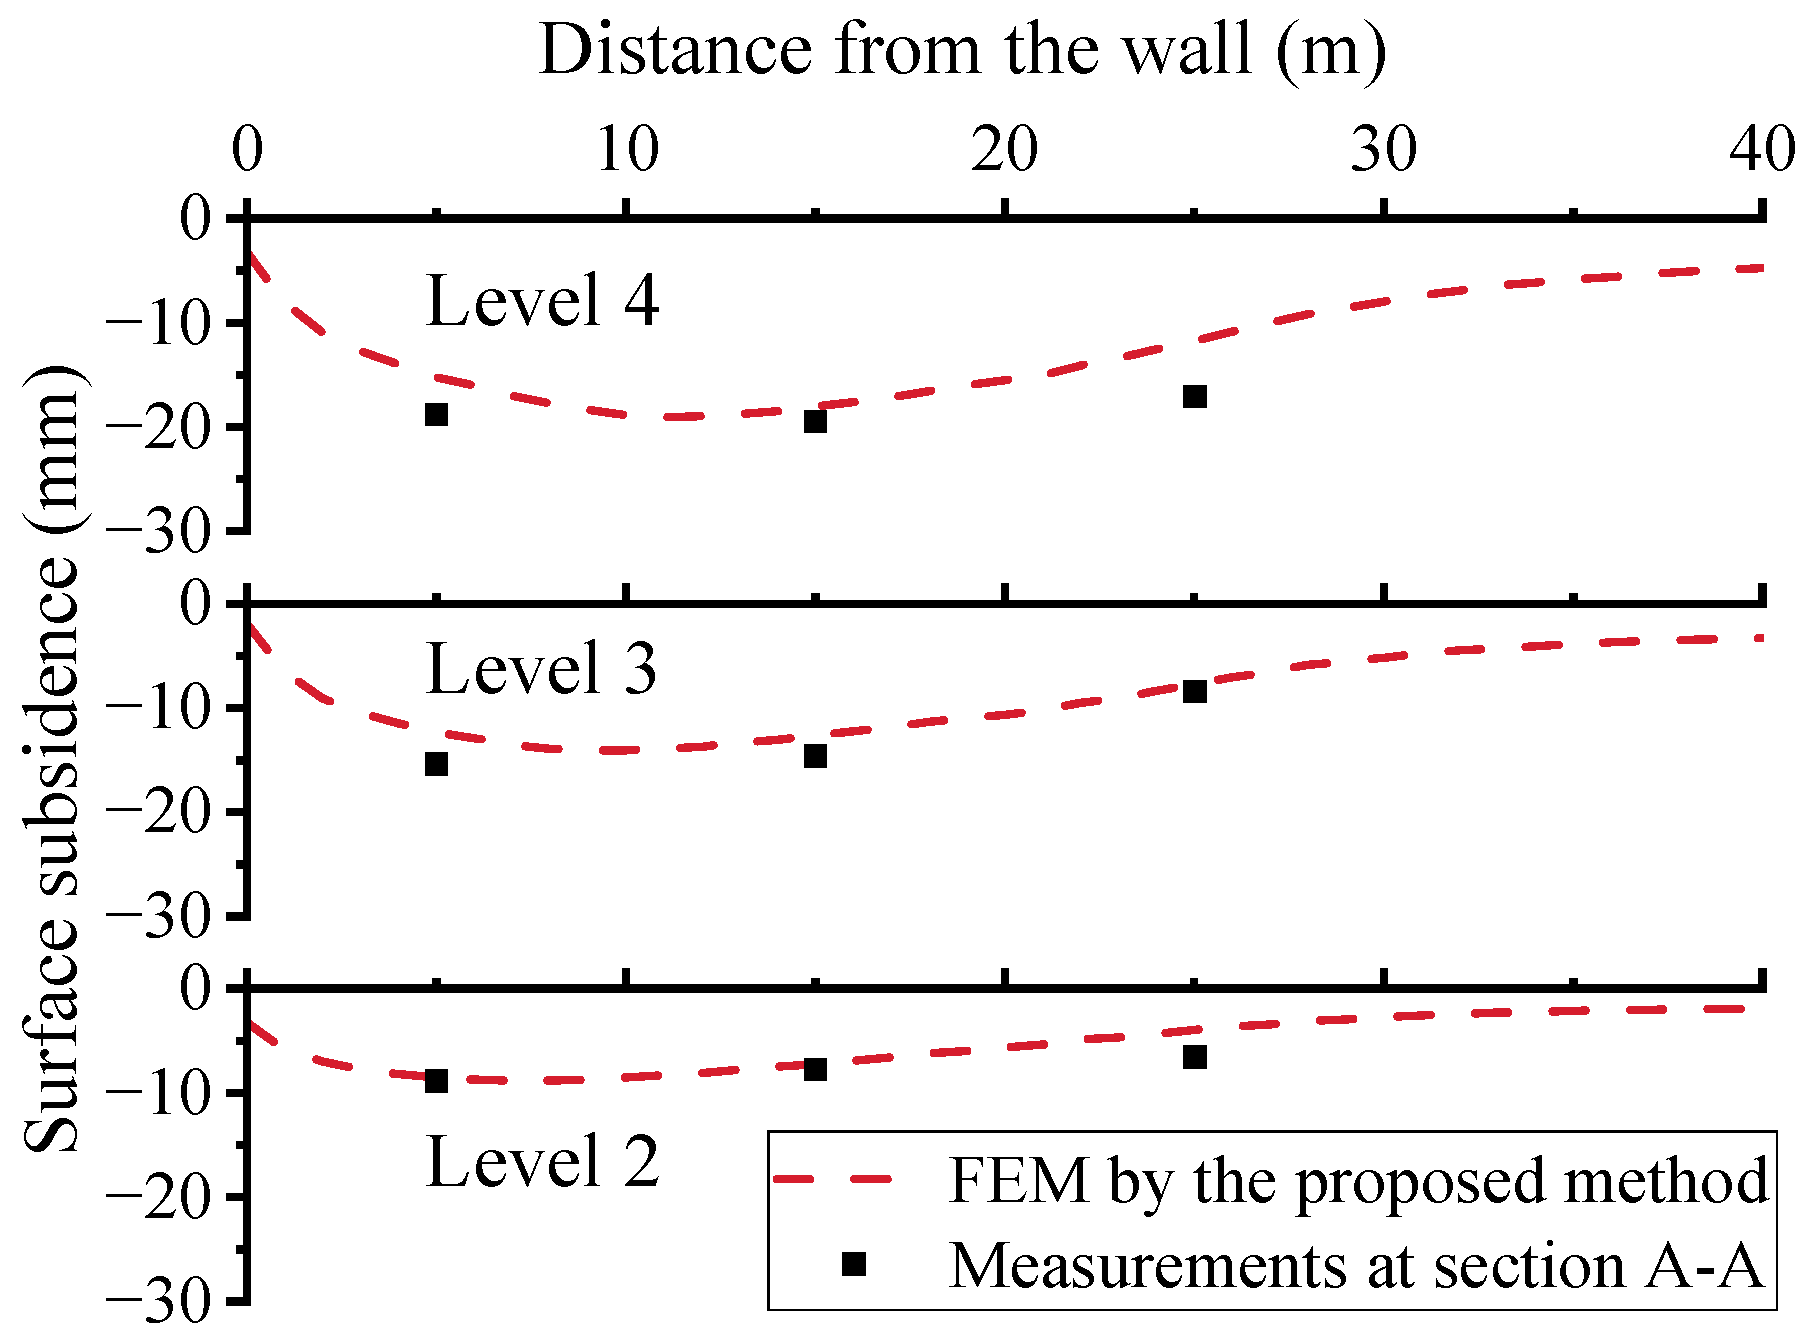
- The proposed SPT-based step-by-step inverse method can effectively predict the horizontal displacement of the retaining wall and the ground settlement at multiple excavation stages, demonstrating that it is an accurate, practical, and efficient method for parameter determination.
Author Contributions
Funding
Institutional Review Board Statement
Informed Consent Statement
Data Availability Statement
Conflicts of Interest
References
- Ou, C.Y.; Shiau, B.Y.; Wang, I.W. Three-Dimensional Deformation Behavior of the Taipei National Enterprise Center (TNEC) Excavation Case History. Can. Geotech. J. 2000, 37, 438–448. [Google Scholar] [CrossRef]
- Faheem, H.; Cai, F.; Ugai, K.; Hagiwara, T. Two-Dimensional Base Stability of Excavations in Soft Soils Using FEM. Comput. Geotech. 2003, 30, 141–163. [Google Scholar] [CrossRef]
- Wu, B.; Ge, C.; Li, P.; Yang, M.; Li, L. Influence of Deep Foundation Pit Excavation on Adjacent Pipelines: A Case Study in Nanjing, China. Appl. Sci. 2024, 14, 572. [Google Scholar] [CrossRef]
- Do, T.-N.; Ou, C.-Y.; Chen, R.-P. A Study of Failure Mechanisms of Deep Excavations in Soft Clay Using the Finite Element Method. Comput. Geotech. 2016, 73, 153–163. [Google Scholar] [CrossRef]
- Likitlersuang, S.; Surarak, C.; Wanatowski, D.; Oh, E.; Balasubramaniam, A. Finite Element Analysis of a Deep Excavation: A Case Study from the Bangkok MRT. Soils Found. 2013, 53, 756–773. [Google Scholar] [CrossRef]
- Uribe-Henao, A.F.; Arboleda-Monsalve, L.G.; Ballesteros, C.; Zapata-Medina, D.G. Method for Estimating Fully Coupled Response of Deep Excavations in Soft Clays. J. Geotech. Geoenviron. Eng. 2023, 149, 04023026. [Google Scholar] [CrossRef]
- You, X.; Zhou, Q.; Xiao, Y.; Tong, L.; Yang, Q. Numerical Study on the Coupling Effect on a Retaining Structure of a Complex Deep Foundation Pit Group Excavation in a Soft-Soil Area. Appl. Sci. 2023, 13, 3263. [Google Scholar] [CrossRef]
- Ardakani, A.; Bayat, M.; Javanmard, M. Numerical Modeling of Soil Nail Walls Considering Mohr Coulomb, Hardening Soil and Hardening Soil with Small-Strain Stiffness Effect Models. Geomech. Eng. 2014, 6, 391–401. [Google Scholar] [CrossRef]
- Tao, Y.; Zeng, S.; Sun, H.; Cai, Y.; Zhang, J.; Pan, X. A Spatiotemporal Deep Learning Method for Excavation-Induced Wall Deflections. J. Rock Mech. Geotech. Eng. 2024. [Google Scholar] [CrossRef]
- Zhang, R.; Zhang, W.; Goh, A.T.C. Numerical Investigation of Pile Responses Caused by Adjacent Braced Excavation in Soft Clays. Int. J. Geotech. Eng. 2021, 15, 783–797. [Google Scholar] [CrossRef]
- Gu, X.; Wu, R.; Liang, F.-Y.; Gao, G. On HSS Model Parameters for Shanghai Soils with Engineering Verification. Rock Soil Mech. 2021, 42, 833–845. [Google Scholar]
- Deghoul, L.; Gabi, S.; Hamrouni, A. The Influence of the Soil Constitutive Models on the Seismic Analysis of Pile-Supported Wharf Structures with Batter Piles in Cut-Slope Rock Dike. Stud. Geotech. Mech. 2020, 42, 191–209. [Google Scholar] [CrossRef]
- Ng, C.W.W.; Zheng, G.; Ni, J.; Zhou, C. Use of Unsaturated Small-Strain Soil Stiffness to the Design of Wall Deflection and Ground Movement Adjacent to Deep Excavation. Comput. Geotech. 2020, 119, 103375. [Google Scholar] [CrossRef]
- Liang, F.-Y.; Jia, Y.; Ding, Y.-J.; Huang, M.-S. Experimental Study on Parameters of HSS Model for Soft Soils in Shanghai. Chin. J. Geotech. Eng. 2017, 39, 269–278. [Google Scholar]
- Wang, W.; Wang, H.; Xu, Z. Study of Parameters of HS-Small Model Used in Numerical Analysis of Excavations in Shanghai Area. Rock Soil Mech. 2013, 34, 1766–1774. [Google Scholar]
- Wang, W.; Wang, H.; Xu, Z. Experimental Study of Parameters of Hardening Soil Model for Numerical Analysis of Excavations of Foundation Pits. Rock Soil Mech. 2012, 33, 2283–2290. [Google Scholar]
- Finno, R.J.; Calvello, M. Supported Excavations: Observational Method and Inverse Modeling. J. Geotech. Geoenviron. Eng. 2005, 131, 826–836. [Google Scholar] [CrossRef]
- Knabe, T.; Schweiger, H.F.; Schanz, T. Calibration of Constitutive Parameters by Inverse Analysis for a Geotechnical Boundary Problem. Can. Geotech. J. 2012, 49, 170–183. [Google Scholar] [CrossRef]
- Wang, Z.-Z.; Goh, S.H.; Koh, C.G.; Smith, I.F. An Efficient Inverse Analysis Procedure for Braced Excavations Considering Three-Dimensional Effects. Comput. Geotech. 2019, 107, 150–162. [Google Scholar] [CrossRef]
- Mu, L.; Huang, M. Small Strain Based Method for Predicting Three-Dimensional Soil Displacements Induced by Braced Excavation. Tunn. Undergr. Space Technol. 2016, 52, 12–22. [Google Scholar] [CrossRef]
- Kim, S.; Finno, R.J. Inverse Analysis of a Supported Excavation in Chicago. J. Geotech. Geoenviron. Eng. 2019, 145, 04019050. [Google Scholar] [CrossRef]
- Kim, S.; Finno, R.J. Inverse Analysis of Hypoplastic Clay Model for Computing Deformations Caused by Excavations. Comput. Geotech. 2020, 122, 103499. [Google Scholar] [CrossRef]
- Hashash, Y.M.; Song, H.; Osouli, A. Three-Dimensional Inverse Analyses of a Deep Excavation in Chicago Clays. Int. J. Numer. Anal. Methods Geomech. 2011, 35, 1059–1075. [Google Scholar] [CrossRef]
- Li, L.; Liu, J.; Li, K.; Huang, H.; Ji, X. Study of Parameters Selection and Applicability of HSS Model in Typical Stratum of Jinan. J. Rock Soil Mech. 2019, 40, 4021–4029. [Google Scholar]
- Jiang, J.; Li, X.; Luo, G. Experimental Study on Correlativity between SPT and Physical and Mechanical Parameters of Foundation Soil of Nanjing Subway. J. China Railw. Soc. 2010, 32, 123–127. [Google Scholar]
- Aktaş Engin, T.; Çokça, E. Automated Inverse Analysis of a Deep Excavation in Ankara Clay Using Finite Element Analysis. Arab. J. Geosci. 2021, 14, 1991. [Google Scholar] [CrossRef]
- Ayizula, A.; Liu, J. Inverse Analysis on Compressibility of Toronto Clays. Soils Found. 2023, 63, 101280. [Google Scholar] [CrossRef]
- Calvello, M.; Finno, R.J. Selecting Parameters to Optimize in Model Calibration by Inverse Analysis. Comput. Geotech. 2004, 31, 410–424. [Google Scholar] [CrossRef]
- Fang, K.-T.; Lin, D.K.; Winker, P.; Zhang, Y. Uniform Design: Theory and Application. Technometrics 2000, 42, 237–248. [Google Scholar] [CrossRef]
- Liu, S.; Wang, C.; Zhou, L.; Tang, Z. Application and Analysis of Hardening Soil Model in Deep Foundation Pits in Wuxi District. Chin. J. Rock Mech. Eng. 2014, 33, 3022. [Google Scholar]
- Finno, R.J.; Kim, S.; Lewis, J.; Van Winkle, N. Observed Performance of a Sheetpile-Supported Excavation in Chicago Clays. J. Geotech. Geoenviron. Eng. 2019, 145, 05018005. [Google Scholar] [CrossRef]
- Kim, T.; Jung, Y.-H. Optimizing Material Parameters to Best Capture Deformation Responses in Supported Bottom-up Excavation: Field Monitoring and Inverse Analysis. KSCE J. Civ. Eng. 2022, 26, 3384–3401. [Google Scholar] [CrossRef]


| Soil Layer No. | Constitutive Model | γ (kN/m3) | c (kPa) | φ (°) | m * | Rf * | Pref * | υ * | K0 * | (MPa) | (MPa) | (MPa) | γ0.7 (×10−4) | (MPa) |
|---|---|---|---|---|---|---|---|---|---|---|---|---|---|---|
| 1 | HSS | 16.1 | 14.6 | 8.3 | 0.7 | 0.9 | 100 | 0.2 | 0.826 | 3.0 | 3.0 | 12.0 | 2.0 | 36.0 |
| 2-1 | HS | 18.6 | 3.0 | 31.6 | 0.8 | 0.9 | 100 | 0.2 | 0.476 | 9.0 | 9.0 | 36.0 | / | / |
| 2-2 | HS | 18.6 | 1.9 | 32.0 | 0.5 | 0.9 | 100 | 0.2 | 0.478 | 9.5 | 13.3 | 40.0 | / | / |
| 2-3 | HS | 18.7 | 1.7 | 32.3 | 0.5 | 0.9 | 100 | 0.2 | 0.481 | 10.5 | 14.7 | 45.0 | / | / |
| 3-1 | HSS | 19.5 | 8.4 | 27.0 | 0.8 | 0.9 | 100 | 0.2 | 0.546 | 2.5 | 3.8 | 37.5 | 3.2 | 75.0 |
| 3-2 | HSS | 19.6 | 5.8 | 30.4 | 0.8 | 0.9 | 100 | 0.2 | 0.494 | 5.0 | 5.0 | 35.0 | 3.2 | 70.0 |
| 4 | HSS | 19.9 | 5.0 | 31.0 | 0.8 | 0.9 | 100 | 0.2 | 0.485 | 6.5 | 6.5 | 45.5 | 3.2 | 91.0 |
| 5 | HS | 21.0 | 3.0 | 35.0 | 0.5 | 0.9 | 100 | 0.2 | 0.426 | 20.0 | 20.0 | 80.0 | / | / |
| Calculation Phase | Construction Activity |
|---|---|
| 1 | Self-weight stress generation |
| 2 | Tunnel construction (displacement reset) |
| 3 | Construction of the diaphragm wall |
| 4 | Excavation level 1 (−1.9 m) |
| 5 | Installation of the first brace |
| 6 | Excavation level 2 (−5.9 m) |
| 7 | Installation of the second brace |
| 8 | Excavation level 3 (−9.9 m) |
| 9 | Installation of the third brace |
| 10 | Excavation of foundation pit 4 (−13.9 m) |
| Parameter | 1 | 2 | 3 | 4 | 5 | 6 | 7 | 8 | 9 | 10 | 11 | 12 |
|---|---|---|---|---|---|---|---|---|---|---|---|---|
| R2 | −5.390 | −5.413 | −6.651 | −0.752 | −5.301 | −4.557 | −1.462 | −1.602 | −5.322 | −0.252 | −2.316 | −2.203 |
| M | 23.302 | 20.362 | 23.098 | 6.996 | 19.297 | 17.916 | 8.513 | 8.762 | 19.355 | 2.008 | 10.146 | 10.440 |
| W | −0.231 | −0.266 | −0.288 | −0.107 | −0.275 | −0.254 | −0.172 | −0.183 | −0.275 | −0.126 | −0.228 | −0.211 |
| Soil Layer | (MPa) | (MPa) | (MPa) | (MPa) | γ0.7 |
|---|---|---|---|---|---|
| 2-1 Clayey silt | 9.4500 | 9.450 | 37.800 | / | / |
| 2-2 Sandy silt | 12.345 | 15.000 | 81.000 | / | / |
| 2-3 Sandy silt mixed with silty sand 1 | 13.179 | 16.012 | 86.465 | / | / |
| 2-3 Sandy silt mixed with silty sand 2 | 13.251 | 16.100 | 86.940 | / | / |
| 2-3 Sandy silt mixed with silty sand 3 | 13.338 | 16.206 | 87.512 | / | / |
| 2-3 Sandy silt mixed with silty sand 4 | 13.419 | 16.304 | 88.041 | / | / |
| 2-3 Sandy silt mixed with silty sand 5 | 13.507 | 16.411 | 88.619 | / | / |
| 2-3 Sandy silt mixed with silty sand 6 | 13.589 | 16.507 | 89.138 | / | / |
| 3-1 Muddy clay | 4.167 | 5.000 | 43.000 | 96.000 | 2.3 × 10⁻⁴ |
| 3-2 Silty clay | 6.087 | 7.000 | 40.600 | 96.600 | 2.7 × 10⁻⁴ |
| 4 Silty clay | 6.087 | 7.000 | 40.600 | 96.600 | 2.7 × 10⁻⁴ |
Disclaimer/Publisher’s Note: The statements, opinions and data contained in all publications are solely those of the individual author(s) and contributor(s) and not of MDPI and/or the editor(s). MDPI and/or the editor(s) disclaim responsibility for any injury to people or property resulting from any ideas, methods, instructions or products referred to in the content. |
© 2024 by the authors. Licensee MDPI, Basel, Switzerland. This article is an open access article distributed under the terms and conditions of the Creative Commons Attribution (CC BY) license (https://creativecommons.org/licenses/by/4.0/).
Share and Cite
Shen, M.; Zhong, W.; Zhan, H.; Zhang, X. A Standard Penetration Test-Based Step-by-Step Inverse Method for the Constitutive Model Parameters of the Numerical Simulation of Braced Excavation. Appl. Sci. 2024, 14, 5970. https://doi.org/10.3390/app14145970
Shen M, Zhong W, Zhan H, Zhang X. A Standard Penetration Test-Based Step-by-Step Inverse Method for the Constitutive Model Parameters of the Numerical Simulation of Braced Excavation. Applied Sciences. 2024; 14(14):5970. https://doi.org/10.3390/app14145970
Chicago/Turabian StyleShen, Mengfen, Wencheng Zhong, Hong Zhan, and Xuefeng Zhang. 2024. "A Standard Penetration Test-Based Step-by-Step Inverse Method for the Constitutive Model Parameters of the Numerical Simulation of Braced Excavation" Applied Sciences 14, no. 14: 5970. https://doi.org/10.3390/app14145970
APA StyleShen, M., Zhong, W., Zhan, H., & Zhang, X. (2024). A Standard Penetration Test-Based Step-by-Step Inverse Method for the Constitutive Model Parameters of the Numerical Simulation of Braced Excavation. Applied Sciences, 14(14), 5970. https://doi.org/10.3390/app14145970