Article

Parameter Design and Optimization of Grass Aerial Seeding Tower Based Computational Fluid Dynamics

School of Architecture, Southwest Jiaotong University, Chengdu 611756, China
*
Author to whom correspondence should be addressed.
Appl. Sci. 2024, 14(14), 5971; https://doi.org/10.3390/app14145971
Submission received: 17 April 2024 / Revised: 19 May 2024 / Accepted: 20 June 2024 / Published: 9 July 2024
(This article belongs to the Special Issue Advances in Fluid Dynamics and Building Ventilation)

Abstract

Unstable airflow driven by natural wind forces inside a grass aerial seeding tower is a technical problem that needs to be improved. The authors used FLUENT 2020 R2 to simulate a basic nozzle unit, which is the fundamental component of a grass aerial seeding tower. The interior flow characteristics of the tower were first analyzed. Then, an optimization was undertaken to enhance the internal airflow’s uniform stability, taking the cross-sectional inclination angle as the design parameter. The coefficient of variation, uniformity index, and velocity direction index were considered as constraints. The simulation results indicate that, subsequent to traversing the Laval nozzle unit, the grass seeds undergo a considerable acceleration. At an inclination angle of 15°, while ensuring the attainment of desired exit velocities, a commendable balance of uniformity and directional consistency was achieved.

1. Introduction

Desertification, a concerning environmental phenomenon, represents the gradual transformation of fertile land into arid desert landscapes due to various factors such as climate change, unsustainable land management practices, and human activities. With over 100 countries and regions grappling with the effects of desertification, urgent action and sustainable solutions are imperative to mitigate its devastating impact and safeguard the health and resilience of ecosystems worldwide [1,2,3]. The alarming rate of expansion of land desertification each year has significant impacts on both natural and social environments [4,5,6,7,8]. China faces various forms of desertification, mainly wind erosion, comprising nearly 70% of cases [4,9]. Successful management efforts in places like the Mu Us and Kubuqi Deserts highlight the importance of proactive measures [10,11]. Yang et al. have found that the restoration of degraded grasslands after light harrowing takes about 30 years to return to native vegetation [12]. Therefore, adopting effective prevention and control measures to address land desertification is imperative.
No-tillage reseeding technology has emerged as a promising solution, especially in the northern regions of China, notably in arid and semi-arid areas. This technology not only finds applicability in agricultural production but also plays a significant role in grassland improvement and prairie ecosystem construction. However, due to environmental factors, issues such as the stability of total seeding volume, consistency in row spacing, and uniformity in seeding density have emerged. Aerial seeding technology used for unmanned aerial vehicles (UAVs) offers a rapid but costly solution, with successful applications seen in areas like the Bayan-Ondor Desert [13]. Innovations like Fu’s small UAVs design enhance precision and efficiency in aerial seeding efforts [14]. Overall, addressing desertification demands effective measures and innovative technologies to safeguard ecosystems and livelihoods.
Therefore, the construction of a grass aerial seeding tower relying on natural wind power is feasible and has high practical value. Compared to manual methods, it reduces costs, is suitable for open land, and allows for repeated seeding, enabling sustainable development of an area. In comparison to UAVs, it conserves energy as it relies on natural wind power and can be reused in a repetitive cycle, reducing the overall environmental impact. Additionally, periodic seeding can be performed based on seasonal changes, as well as the migration of livestock. In this context, the research team, based on the principles of the Laval nozzle and the design of the one-way filter, designed a grass aerial seeding tower structure that relies on natural wind power. The design was applied in the 2023 eVolo Skyscraper Competition, standing out for its scientific and practical significance. Our team received 1 of only 15 honorable mentions in this international architectural competition. However, the effectiveness of aerial seeding was compromised by internal airflow instability within the structure. Therefore, this paper further utilizes FLUENT 2020 R2 to simulate the fundamental components of the grass aerial seeding tower structure, and the interior flow characteristics of the tower were analyzed. Taking the cross-sectional inclination angle as the design parameter, and considering the coefficient of variation, uniformity index, and velocity direction index as constraints, an optimization was undertaken to enhance the internal airflow’s uniform stability within the structure of the grass aerial seeding tower.

2. Structure and Research Methods

2.1. Theoretical Design Basis

The Laval nozzle is a typical energy conversion device where the gas, during its internal flow process, transforms thermal enthalpy into kinetic energy, ultimately achieving supersonic airflow [15,16]. It has been numerously applied in industrial sectors, such as in aerospace [17,18], supersonic wind tunnels [19,20], ultrafine powder processing [21,22], textile [23], and other fields.
In the converging section, the gas flow is accelerated, and the velocity increases while the pressure decreases. In the diverging section, the gas flow expands, the velocity decreases, and the pressure increases. In the throat, the velocity of the gas flow reaches its maximum.

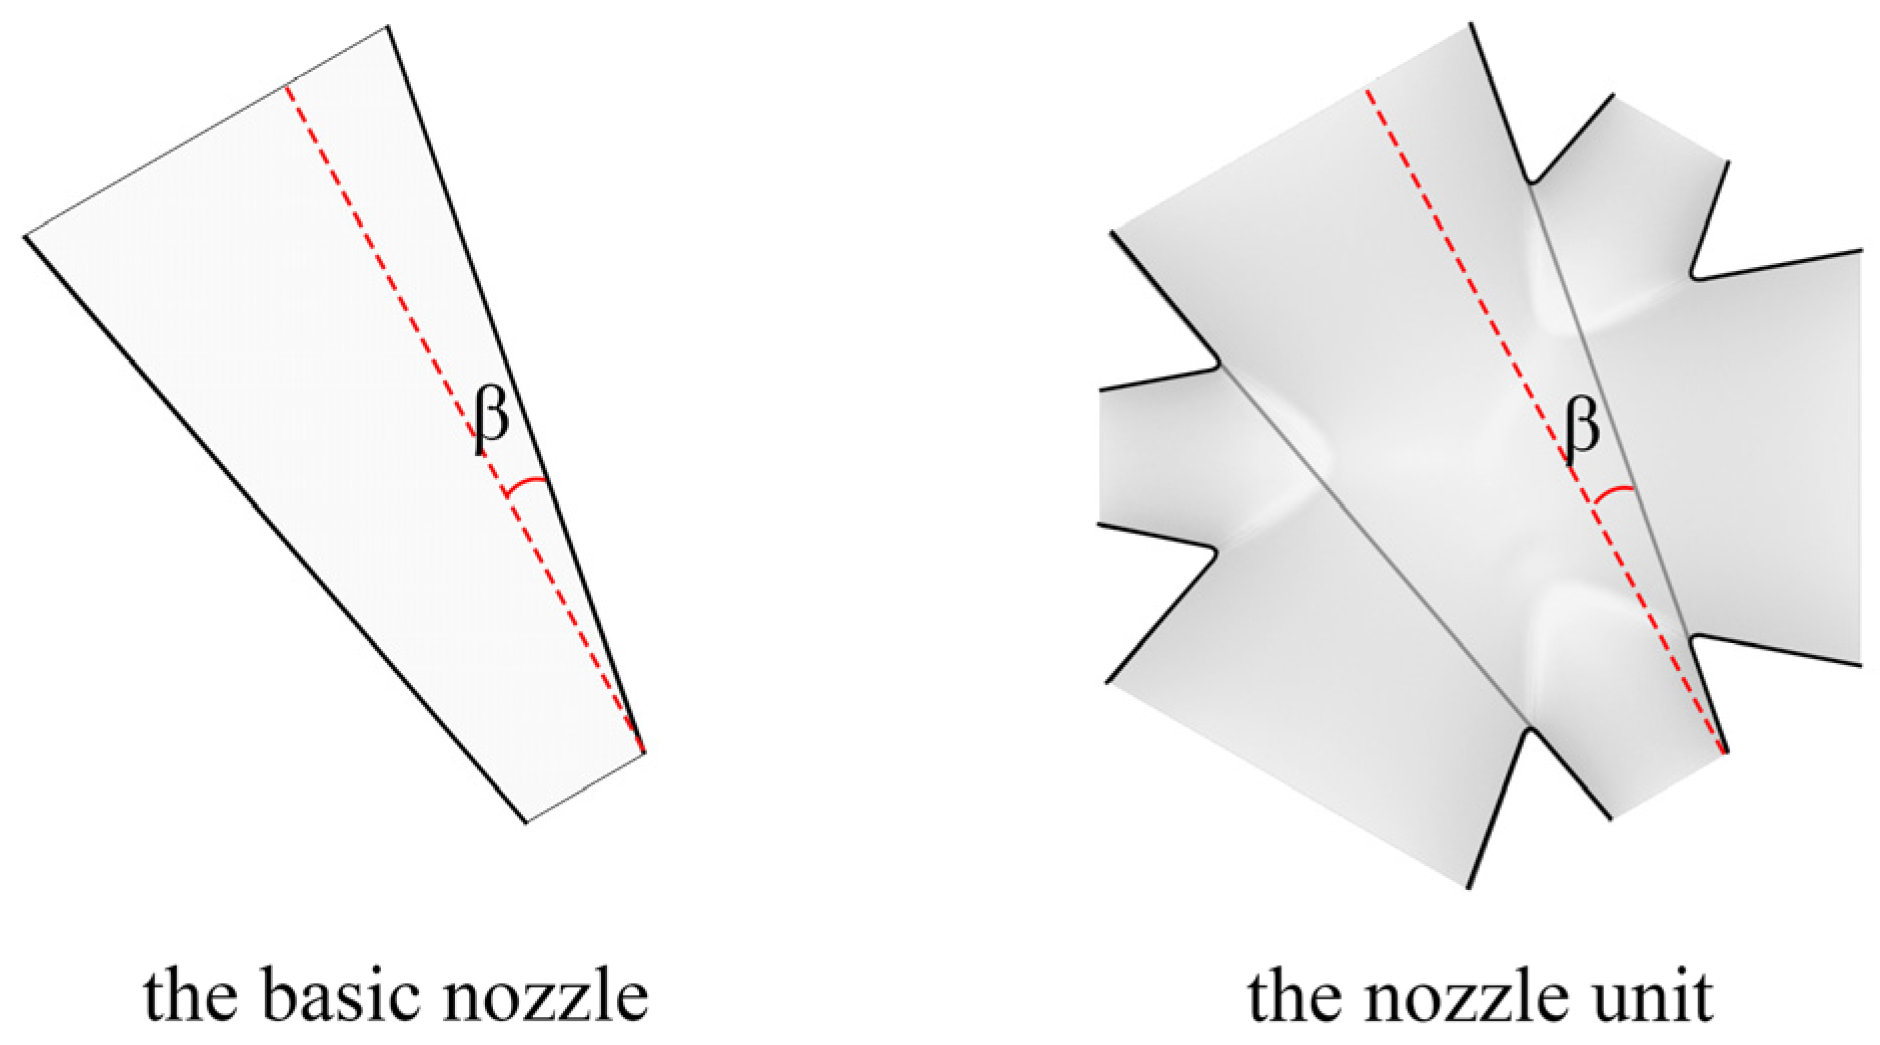
2.2. Modeling of the Basic Nozzle Unit

Based on the actual situation, the Laval nozzle is simplified into a converging tube (shown in Figure 1), in which the β is the cross-sectional inclination angle.
Using Maya for modeling, a basic nozzle is obtained. Fluent Meshing is then used to generate the mesh of the basic nozzle, as shown in Figure 2. The standard k-ε turbulence model [24] is employed to solve the flow field. Air is considered as a compressible ideal gas. The wall of the nozzle is simulated using a no-slip wall boundary condition, with standard wall functions applied near the wall, and the y+ adaptive technique is utilized to refine the near-wall mesh, controlling the y+ value between 30 and 120. The computational domain is set as a cube, with the nozzle positioned at the center and all walls of the computational domain, except for the inlet direction, are set as pressure outlet boundary conditions. For the inlet direction, the pressure far-field boundary condition is applied to the computational domain wall, with the Mach number used to define the inflow velocity.
In order to control the airflow velocity, a box is set on the outside of the nozzle. When airflow enters the box with a velocity of 5 m·s−1, the inlet airflow velocity of the nozzle is 0.5 m·s−1. The simulation results, as shown in Figure 3, indicate that the basic nozzle achieves the desired effect of accelerating the airflow. In this operating condition, with an inlet airflow velocity of 0.5 m·s−1, the outlet velocity reaches 4.545 m·s−1, achieving a more than 9-times increase in velocity. This indicates that the simplified basic nozzle model can well represent the realistic Laval nozzle.
Figure 4 shows the velocity profile along the center line. It is apparent from the figure that air flows towards the nozzle with an initial velocity of 5 m·s−1. As the air gradually approaches the nozzle entrance, its velocity slowly decreases. Upon nearing the nozzle entrance, the velocity sharply declines, reaching approximately 0.5 m·s−1 upon arrival at the nozzle entrance. Subsequently, the air enters the nozzle, where the acceleration effect of the nozzle causes its velocity to swiftly increase, peaking at around 4.5 m·s−1 at the nozzle exit. Even after leaving the nozzle, the air’s velocity continues to increase gradually. This elucidates the pronounced acceleration effect of the structure, achieving the intended outcome.

2.3. Overall Scheme Design

The entire grass aerial seeding tower system is divided into 2 zones: a cultivation zone and a launch zone. Suitable grass seeds, cultivated in the cultivation zone, are transported to storage areas on various levels within the launch zone. Upon reaching a certain wind speed, the pressure sensor at the nozzle opening activates the seed launcher. Seeds then drop at the outlet and are propelled into the distance by the accelerated airflow from the nozzle. Finally, they are trampled by cattle and sheep, completing the seeding process, as shown in Figure 5.
The role of the cultivation zone is to systematically process the seeds. Considering the issue of seed viability, the technology of pelletizing seeds for aerial seeding is employed to prevent seed aggregation caused by wind drift, ensuring good seed uniformity and promoting seed germination [13]. The team of Professor Zhijian Yi extracted a plant-fiber adhesive from plants, achieving a leap in turning sandy soil into arable land by combining it with water [25].
After cultivation, grass seeds are encapsulated layer by layer with organic material into pellets and transported to the launch chamber. The entrance pressure sensor detects the wind pressure, opening the openings of the launch chambers in that direction, allowing the seeds to be launched with the wind.

2.4. Launch Area Structural Design

The primary focus is on designing the launch area structure. The purpose of the structural design is to fully harness wind power, allowing the air to accelerate through the nozzles and ultimately blow out the free tillage grass seeds.
Based on the principle of the Laval nozzle, rotating the nozzle 120° twice resulted in obtaining three nozzles in different directions, named as Unit One. The specific evolution process of this structure is illustrated in Figure 6. However, for Unit One, there is a significant directional limitation. If the wind comes from the opposite direction to normal, this structure cannot effectively achieve the purpose of contracting and accelerating the wind speed.
All the inlets and outlets of Unit One’s nozzles are reversed to create Unit Two. Units One and Two are then stacked vertically to form a combined structure with six wind inlets to accommodate winds from multiple directions. Finally, such combinations are stacked sequentially to create the ultimate tower structure, as shown in Figure 7. Nozzle units at different heights have varying ranges, with seeds from higher units covering longer distances compared to those from lower units. Therefore, each grass aerial seeding tower forms a seeding circle centered around it.

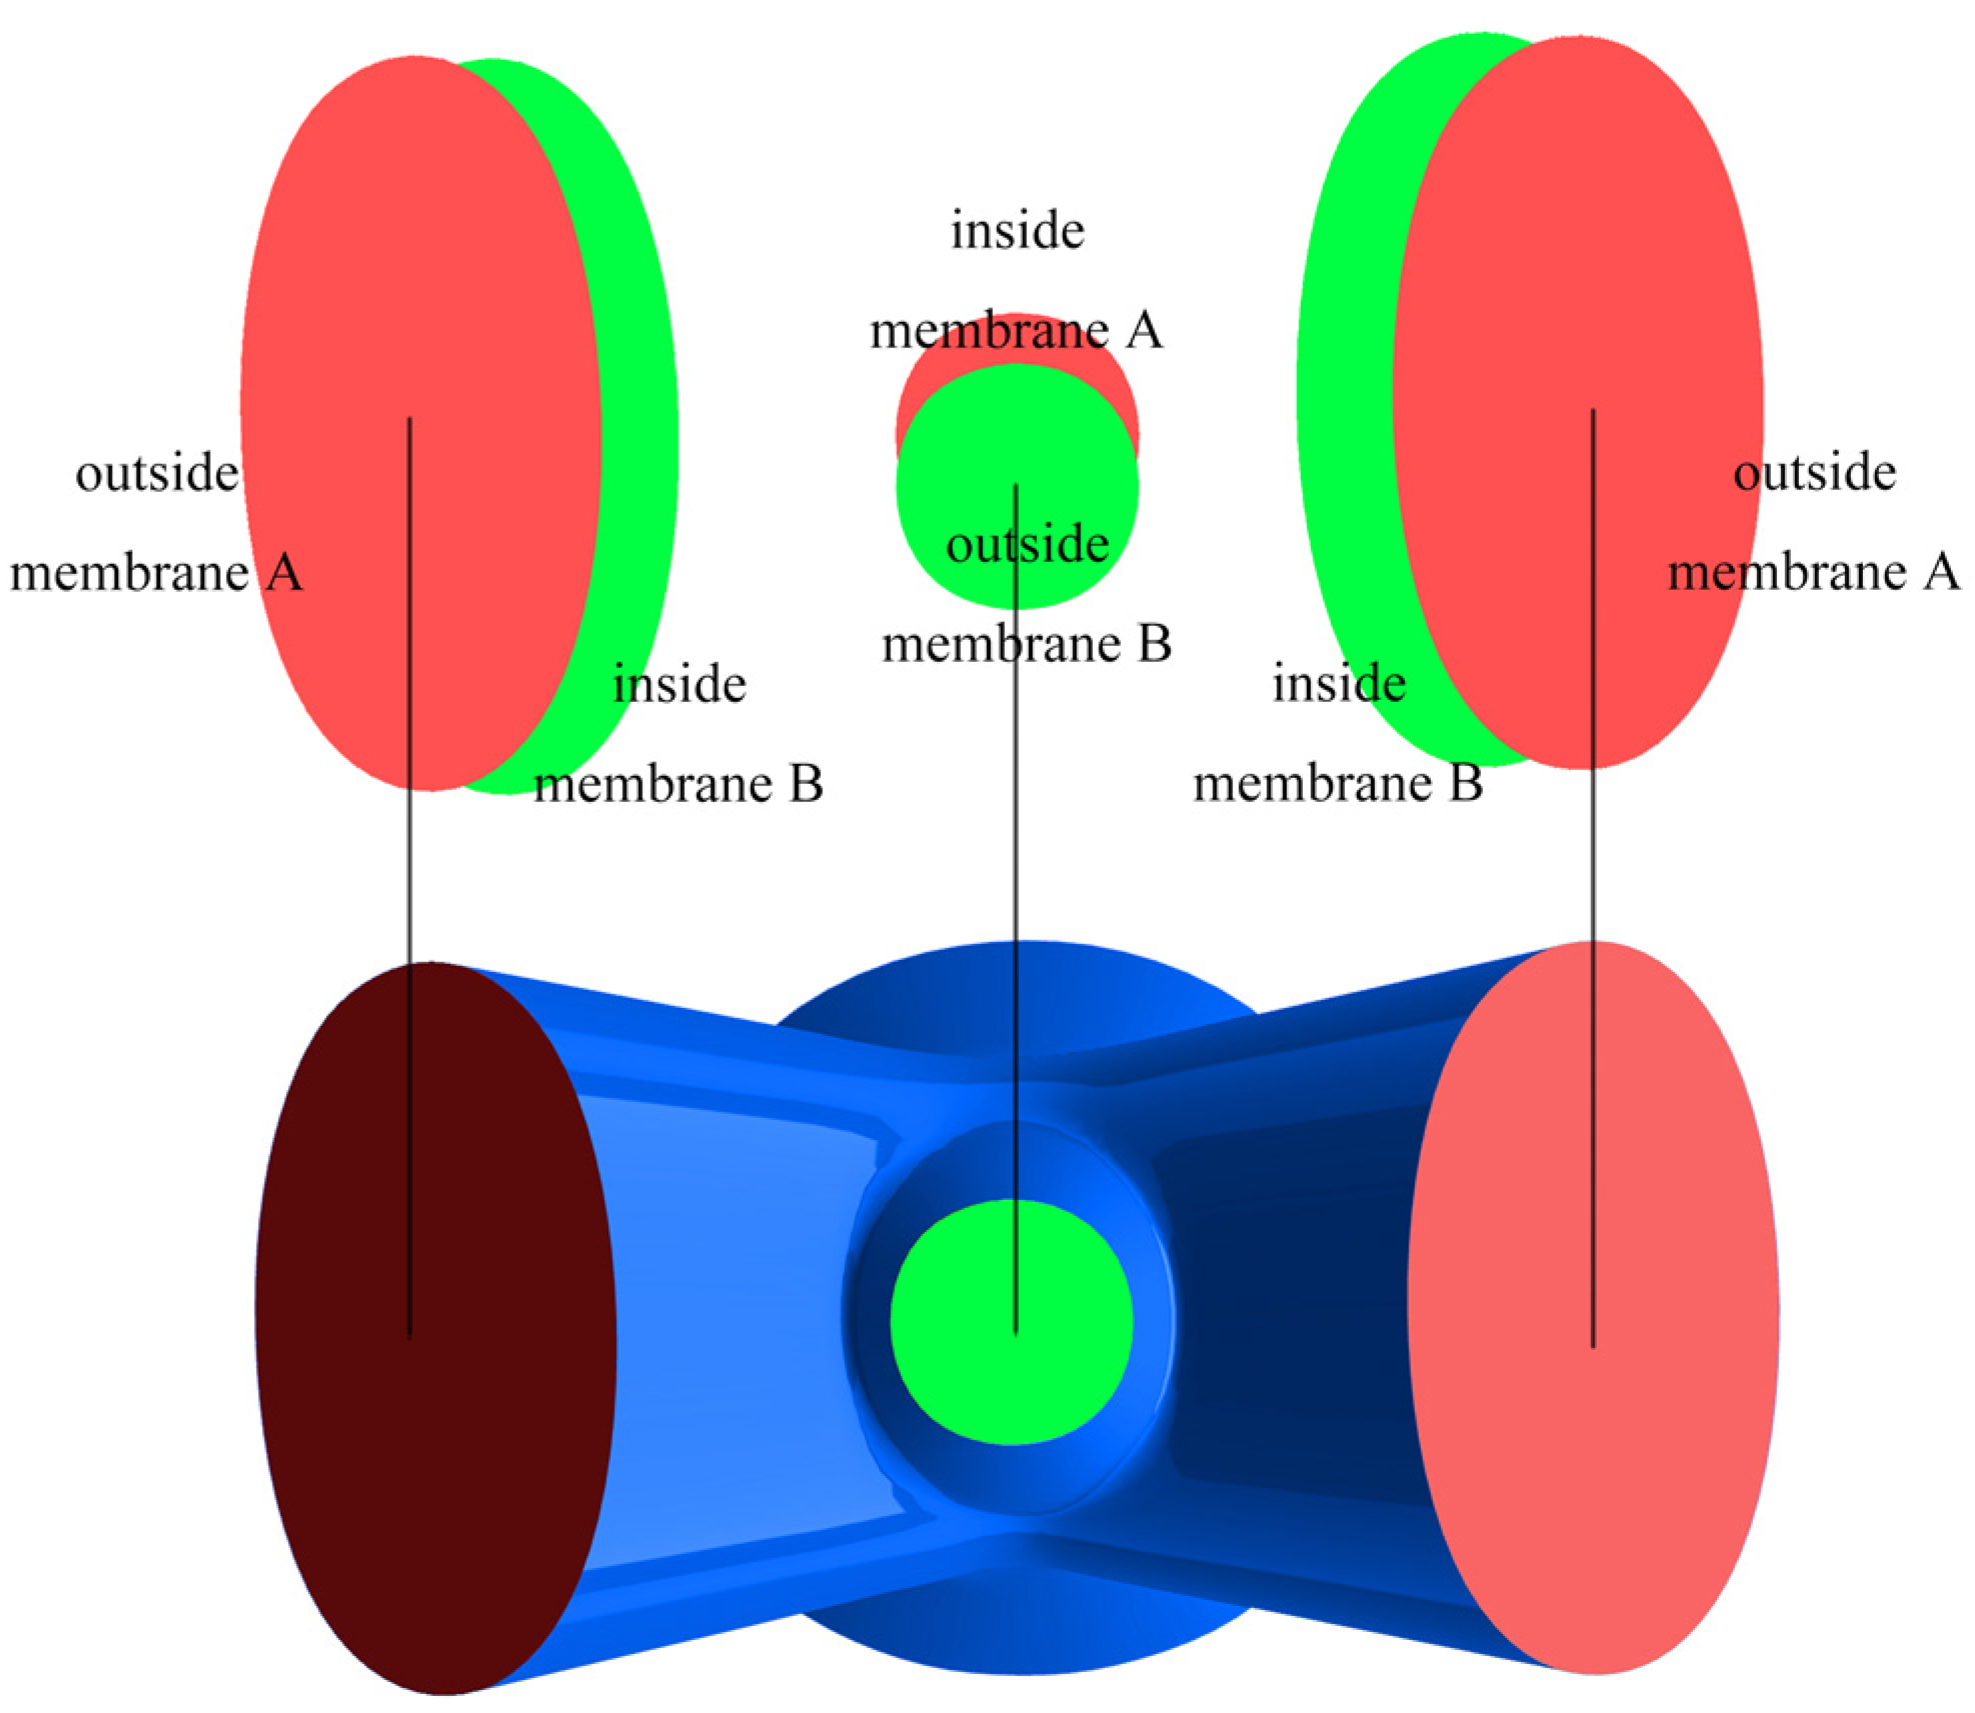
2.5. Imposing Constraints on Velocity Outlet Direction

To validate the accelerating effect of the obtained nozzle unit, flow field simulation was conducted on a single unit by Fluent, and the velocity contour is presented in Figure 8.
As observed from Figure 8, the rotation and alternation of nozzles within the unit disrupt the accelerating mechanism of the basic Laval nozzle, where high-speed airflow enters through a large inlet and accelerates as it exits through a smaller outlet. In this case, the airflow disperses from one large inlet to the other five outlets, and the expected acceleration effect is not achieved. Simulating this scenario, with an inlet airflow velocity of 0.5 m·s−1, the average velocity at the five outlets is calculated to be 0.287 m·s−1.
Figure 9 illustrates the ideal direction of airflow inlet and outlet; ‘a’ represents the direction of air inflow, while ‘b’ represents the direction of air outflow. If it is possible to control the direction of airflow in and out, ensuring that airflow from direction a enters only through the large opening in direction a and exits only through the small opening in direction a’, then the desired acceleration effect can be achieved.
Utilizing simple mechanical principles, a polymer unidirectional filtration membrane, like heart valves controlling blood flow, can be designed, as shown in Figure 10.
The filtration membrane consists of two layers of membranes, with the openings precisely staggered. Membrane A is fixed, while membrane B can move within a limited range. When the fluid flows in the correct direction, it can push membrane B, allowing the fluid to flow out from the gap between the openings of membranes A and B. When the fluid flows in the opposite direction, membrane B is pushed to adhere tightly to membrane A, preventing the fluid from flowing out. Therefore, this mechanism enables acceleration of the airflow in its own direction. The filter is installed at the inlet of the nozzle, as shown in Figure 11.

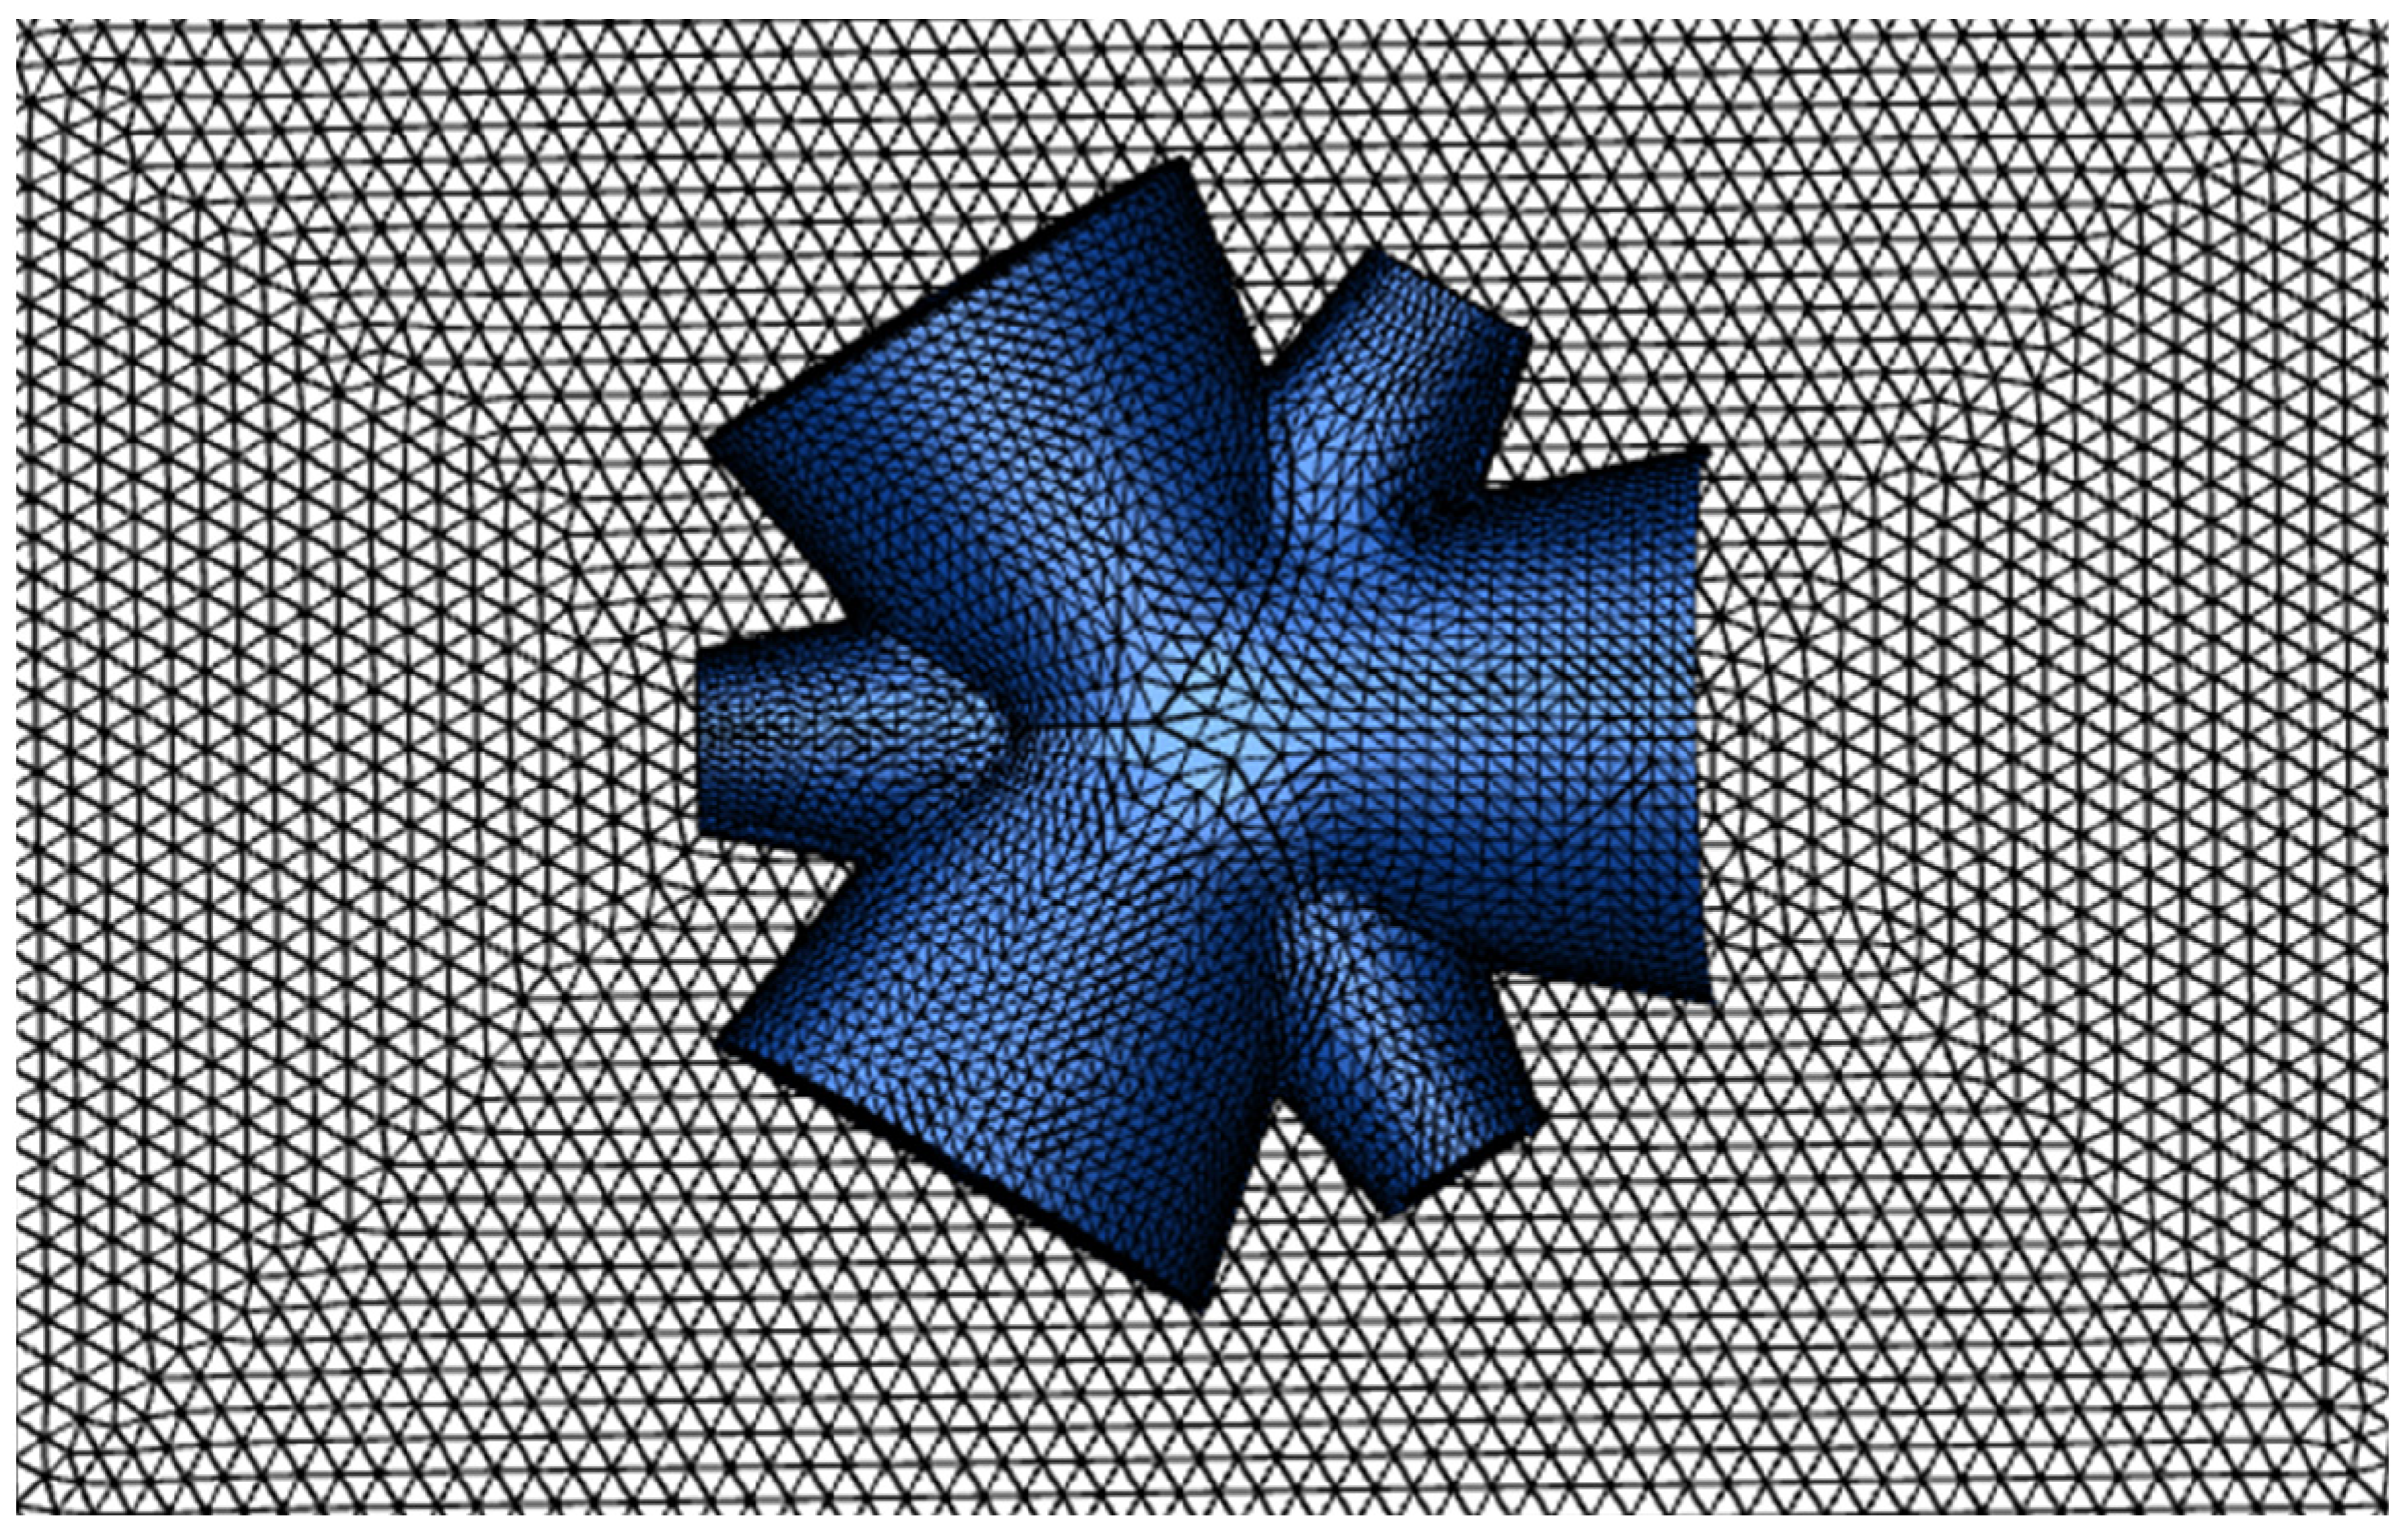
2.6. Physical Modeling and Grid Generation

With the polymer unidirectional filtration membrane, the unit can effectively accelerate the airflow. Therefore, the primary focus is on simulating and studying the flow field distribution within the unit when subjected to wind from a specific direction. However, it was observed that simply rotating the nozzle three times would significantly impact the internal airflow due to sharp angles. Therefore, modeling and analysis will be conducted for various inclination angles. The unit structure will be modeled using Maya, surfaces will be grouped using Space Claim, and Fluent Meshing will be employed for grid generation, with approximately 180 thousand grid cells.
To facilitate the visualization and analysis of the flow field, an external flow domain will be set up around the nozzle unit before simulation. This approach aims to showcase both the internal and external flow fields of the nozzle unit.

3. Parameter Design and Optimization of Basic Nozzle Unit

3.1. Evaluation of Outlet Velocity Uniformity

The uniformity of the flow field velocity distribution can be evaluated by various methods. To ensure accurate assessment, this paper employs both the relative standard deviation and the uniformity index to determine the uniformity of the outlet velocity [26].
(1)
Coefficient of variation
The coefficient of variation (CV) characterizes the measure of relative variability, and it is a dimensionless value. It can be utilized to compare the dispersion of populations with significantly different means and to assess the improvement in uniformity of a flow field. Comparing CV values under different conditions allows for assessment of the uniformity of the flow field on the cross-section. A smaller CV value indicates higher uniformity in the flow field.
(2)
Uniformity Index
The uniformity index, established by Weltens et al. [27] in the early 1990s, is a flow field velocity uniformity evaluation metric. It is based on the definition of statistical deviation and comprehensively reflects the characteristics of fluid velocity distribution across the entire flow section. This index is notable for its strong comparability and wide applicability.
γ v = 1 1 2 n j = 1 n ( v j v ¯ ) 2 v ¯ ,
where γv takes values between [0, 1]. A larger value of γv indicates better flow uniformity, 1 represents an ideal state of uniform flow, and 0 represents a hypothetical condition where the fluid flows only from a single measurement point. Both extreme cases are assumed conditions and do not occur. v j is the velocity at a measurement point, and v ¯ is the average velocity on the measurement cross-section.

3.2. Criteria for Velocity Direction Assessment

If an initial velocity is given at the inlet, the final velocity direction after acceleration through the nozzle may not strictly align with the initial velocity direction. The ratio of the velocity magnitude in the same direction as the initial velocity to the overall velocity can be used as a criterion to assess the directionality of the outlet velocity.
If the inlet velocity is in the x direction, then using S x = V x / | V | represents the directionality of the velocity in the x direction. A larger Sx indicates better directionality.

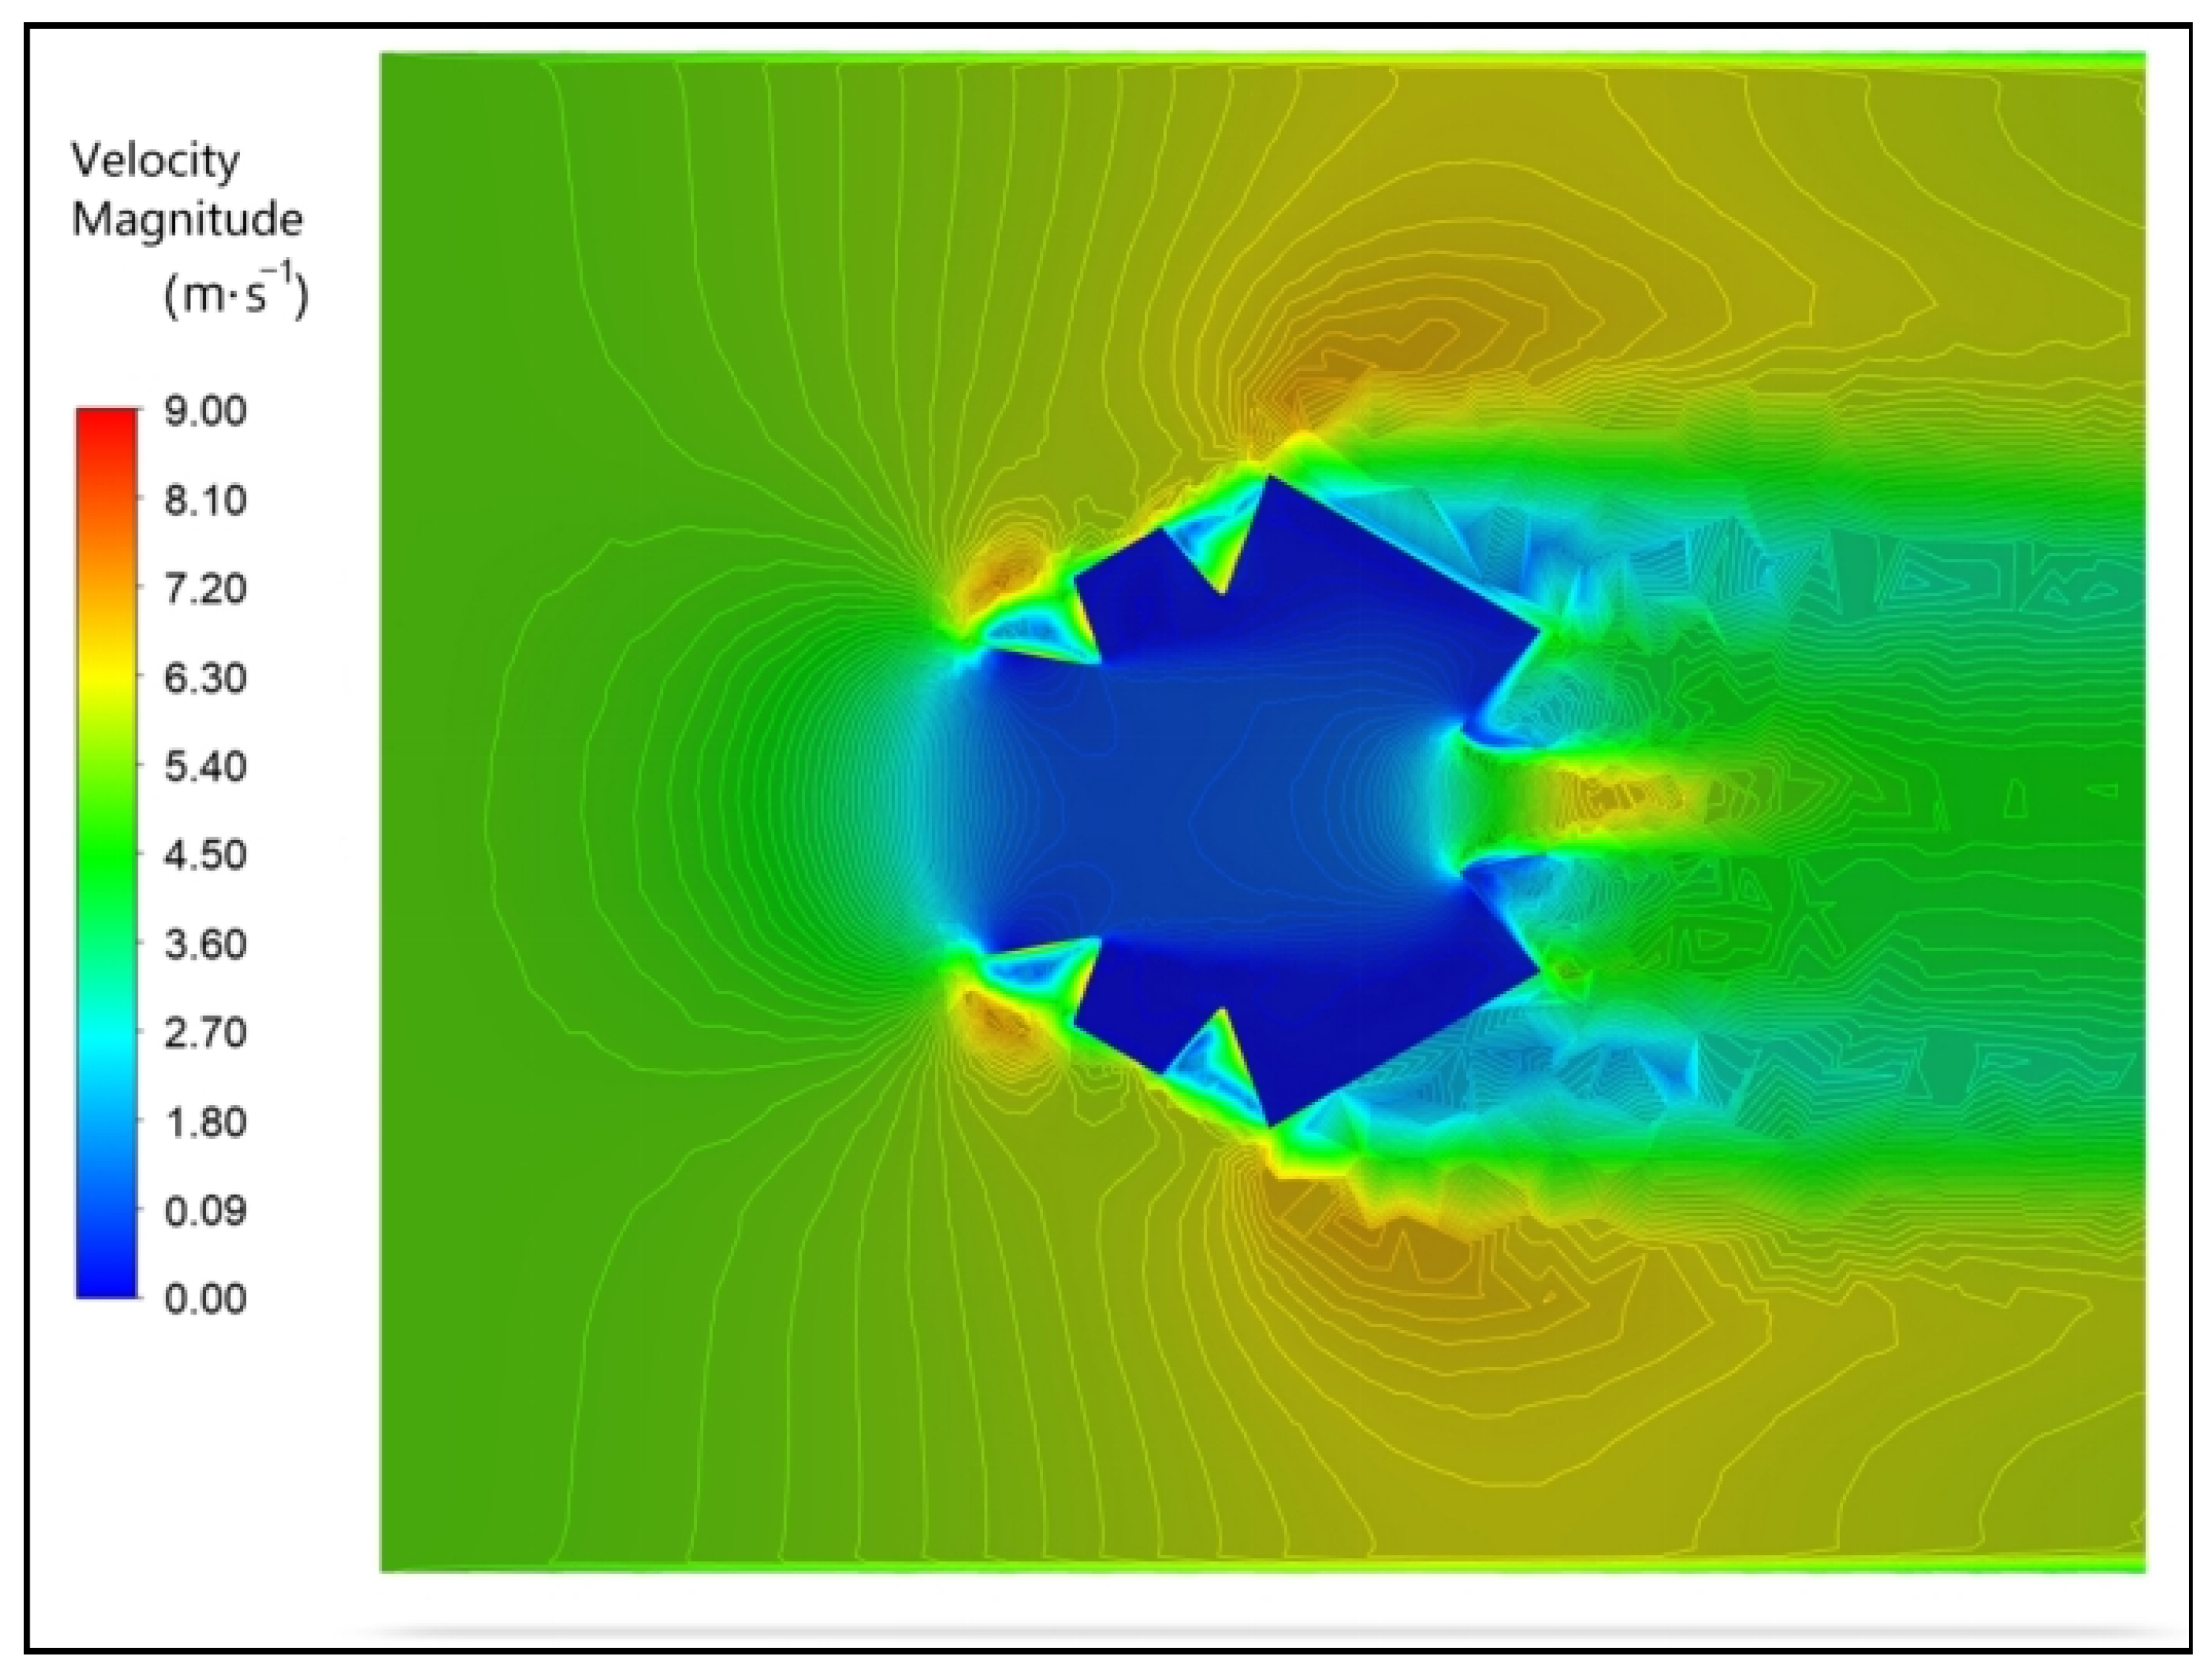
3.3. Analysis of Flow Structure

Due to the inherent symmetry of the basic nozzle unit in the grass aerial seeding tower, with Z = 0 mm serving as the symmetry plane, the analysis is conducted on the X-Y plane at Z = 0 mm.
Figure 12 shows the velocity contour of the basic nozzle unit. Excluding the influence of structural corners on the airflow, it can be observed that the nozzle has a significant accelerating effect on the airflow. The airflow velocity is higher near the outlet and relatively smaller away from the outlet. However, if the airflow distribution at the nozzle outlet is non-uniform, it is highly unfavorable for controlling the launch of grass seeds, and deviations from the expected trajectory may occur.
The installation of a unidirectional filter may affect the velocity and pressure fields within the nozzle. As the air flows through the gap, local acceleration and deceleration phenomena may occur, potentially impacting the uniformity of the flow field’s velocity distribution. The presence of the membrane, even in the correct direction, imposes certain limitations on the flow rate. If the air flow exceeds the membrane’s design capacity, it may cause an increase in upstream pressure, thereby affecting the pressure field within the nozzle. However, these effects are localized and have minimal impact on the main conclusions.

3.4. Structural Optimization Design

To address the issue of non-uniform airflow distribution at the outlet of the original structure, different inclination angles were designed. The velocity contours for the basic nozzle unit with various inclination angles were obtained through simulation, followed by the calculation of outlet velocity non-uniformity, using Equation (1) for different inclination angle conditions.
In the comparison analysis, inclination angles of 11°, 13°, 15°, 17°, and 19° were chosen. The inlet velocity was set to v0 = 0.5 m·s−1, and the inlet radius was consistently set to 500 mm. Figure 13 displays velocity contour inside and outside the basic nozzle unit under different inclination angle conditions.
In these figures, blue regions indicate lower velocities while red regions denote higher velocities. At an inclination angle of 11°, the velocity field of the air entering the nozzle exhibits a relatively uniform distribution, with velocity gradually increasing at the nozzle exit. The low inclination angle prevents significant backflow and turbulence after the air enters the nozzle, resulting in a relatively smooth overall flow. When the inclination angle increases to 13°, the fluid velocity field begins to show more variations. Although the internal velocity distribution within the nozzle remains relatively uniform, the exit area starts to display regions of more pronounced velocity changes. As the inclination angle further increases to 15°, the velocity field undergoes more noticeable changes. The high-velocity regions at the nozzle exit expand significantly, and the larger inclination angle induces more turbulence, particularly at the nozzle exit, where the flow starts to become unstable and the internal velocity distribution becomes less uniform. At an inclination angle of 17°, a more complex velocity distribution appears both inside and outside the nozzle. Notably, at the nozzle exit, there are alternating regions of high and low velocity within the velocity field. The significant inclination angle induces more turbulence and velocity gradient changes, resulting in more complex and less uniform flow, with the possible formation of localized backflow zones. When the inclination angle reaches 19°, the velocity field shows the most dramatic changes. The 19° inclination angle triggers intense turbulence and backflow, leading to extremely unstable flow, with distinct backflow and vortex regions. The velocity field undergoes significant variations, and the overall flow is considerably disrupted.
In summary, as the inclination angle increases, the fluid velocity field becomes more uneven, with alternating high-velocity and low-velocity regions. Turbulence intensity increases, and backflow phenomena start to appear. Additionally, with the increase in inclination angle, the mid-velocity region decreases, while high-velocity and low-velocity regions expand, resulting in decreased overall flow uniformity. The above analysis illustrates the significant impact of the inclination angle on the velocity field inside and outside the nozzle, indicating that selecting an appropriate inclination angle based on specific requirements can optimize system performance.
Table 1 presents the uniformity index for various inclination angles. As shown in Table 1, with the increase in inclination angle, the acceleration effect of the nozzle becomes more pronounced, leading to a gradual increase in the average exit velocity. As the inclination angle increases from 11° to 15°, the average exit velocity rises from 4.562 m·s−1 to 10.611 m·s−1, marking an increase of 133%. Simultaneously, the relative standard deviation CV increases, the uniformity index γ v decreases, and the velocity direction index Sx gradually decreases. This indicates that with a larger inclination angle, although the exit velocity becomes greater, the uniformity of exit velocity decreases, and the directionality worsens.
Although the average exit velocity increases with the increase in inclination angle, as seen in Figure 13, various factors such as structural shape contribute to the lighter color of the velocity contour at an inclination angle of 19° compared to 17°.
Taking factors, such as machining cost, processing difficulty, range of grass seed dispersal, uniformity of velocity, and directionality, into account, the inclination angle is determined to be 15°.

4. Conclusions

Aiming to improve the aerial seeding quality of a grass aerial seeding tower, the current paper faces the problem of unstable airflow existing in this new high-rise architecture structure driven by natural wind forces. The authors used FLUENT 2020 R2 to simulate the basic nozzle unit, which is the fundamental component of the grass aerial seeding tower. The main conclusions are drawn as follows:
(1)
A noticeable acceleration effect is observed when the airflow passes through the nozzle unit. The airflow speed is smaller away from the outlet, and larger as well as more concentrated near the outlet.
(2)
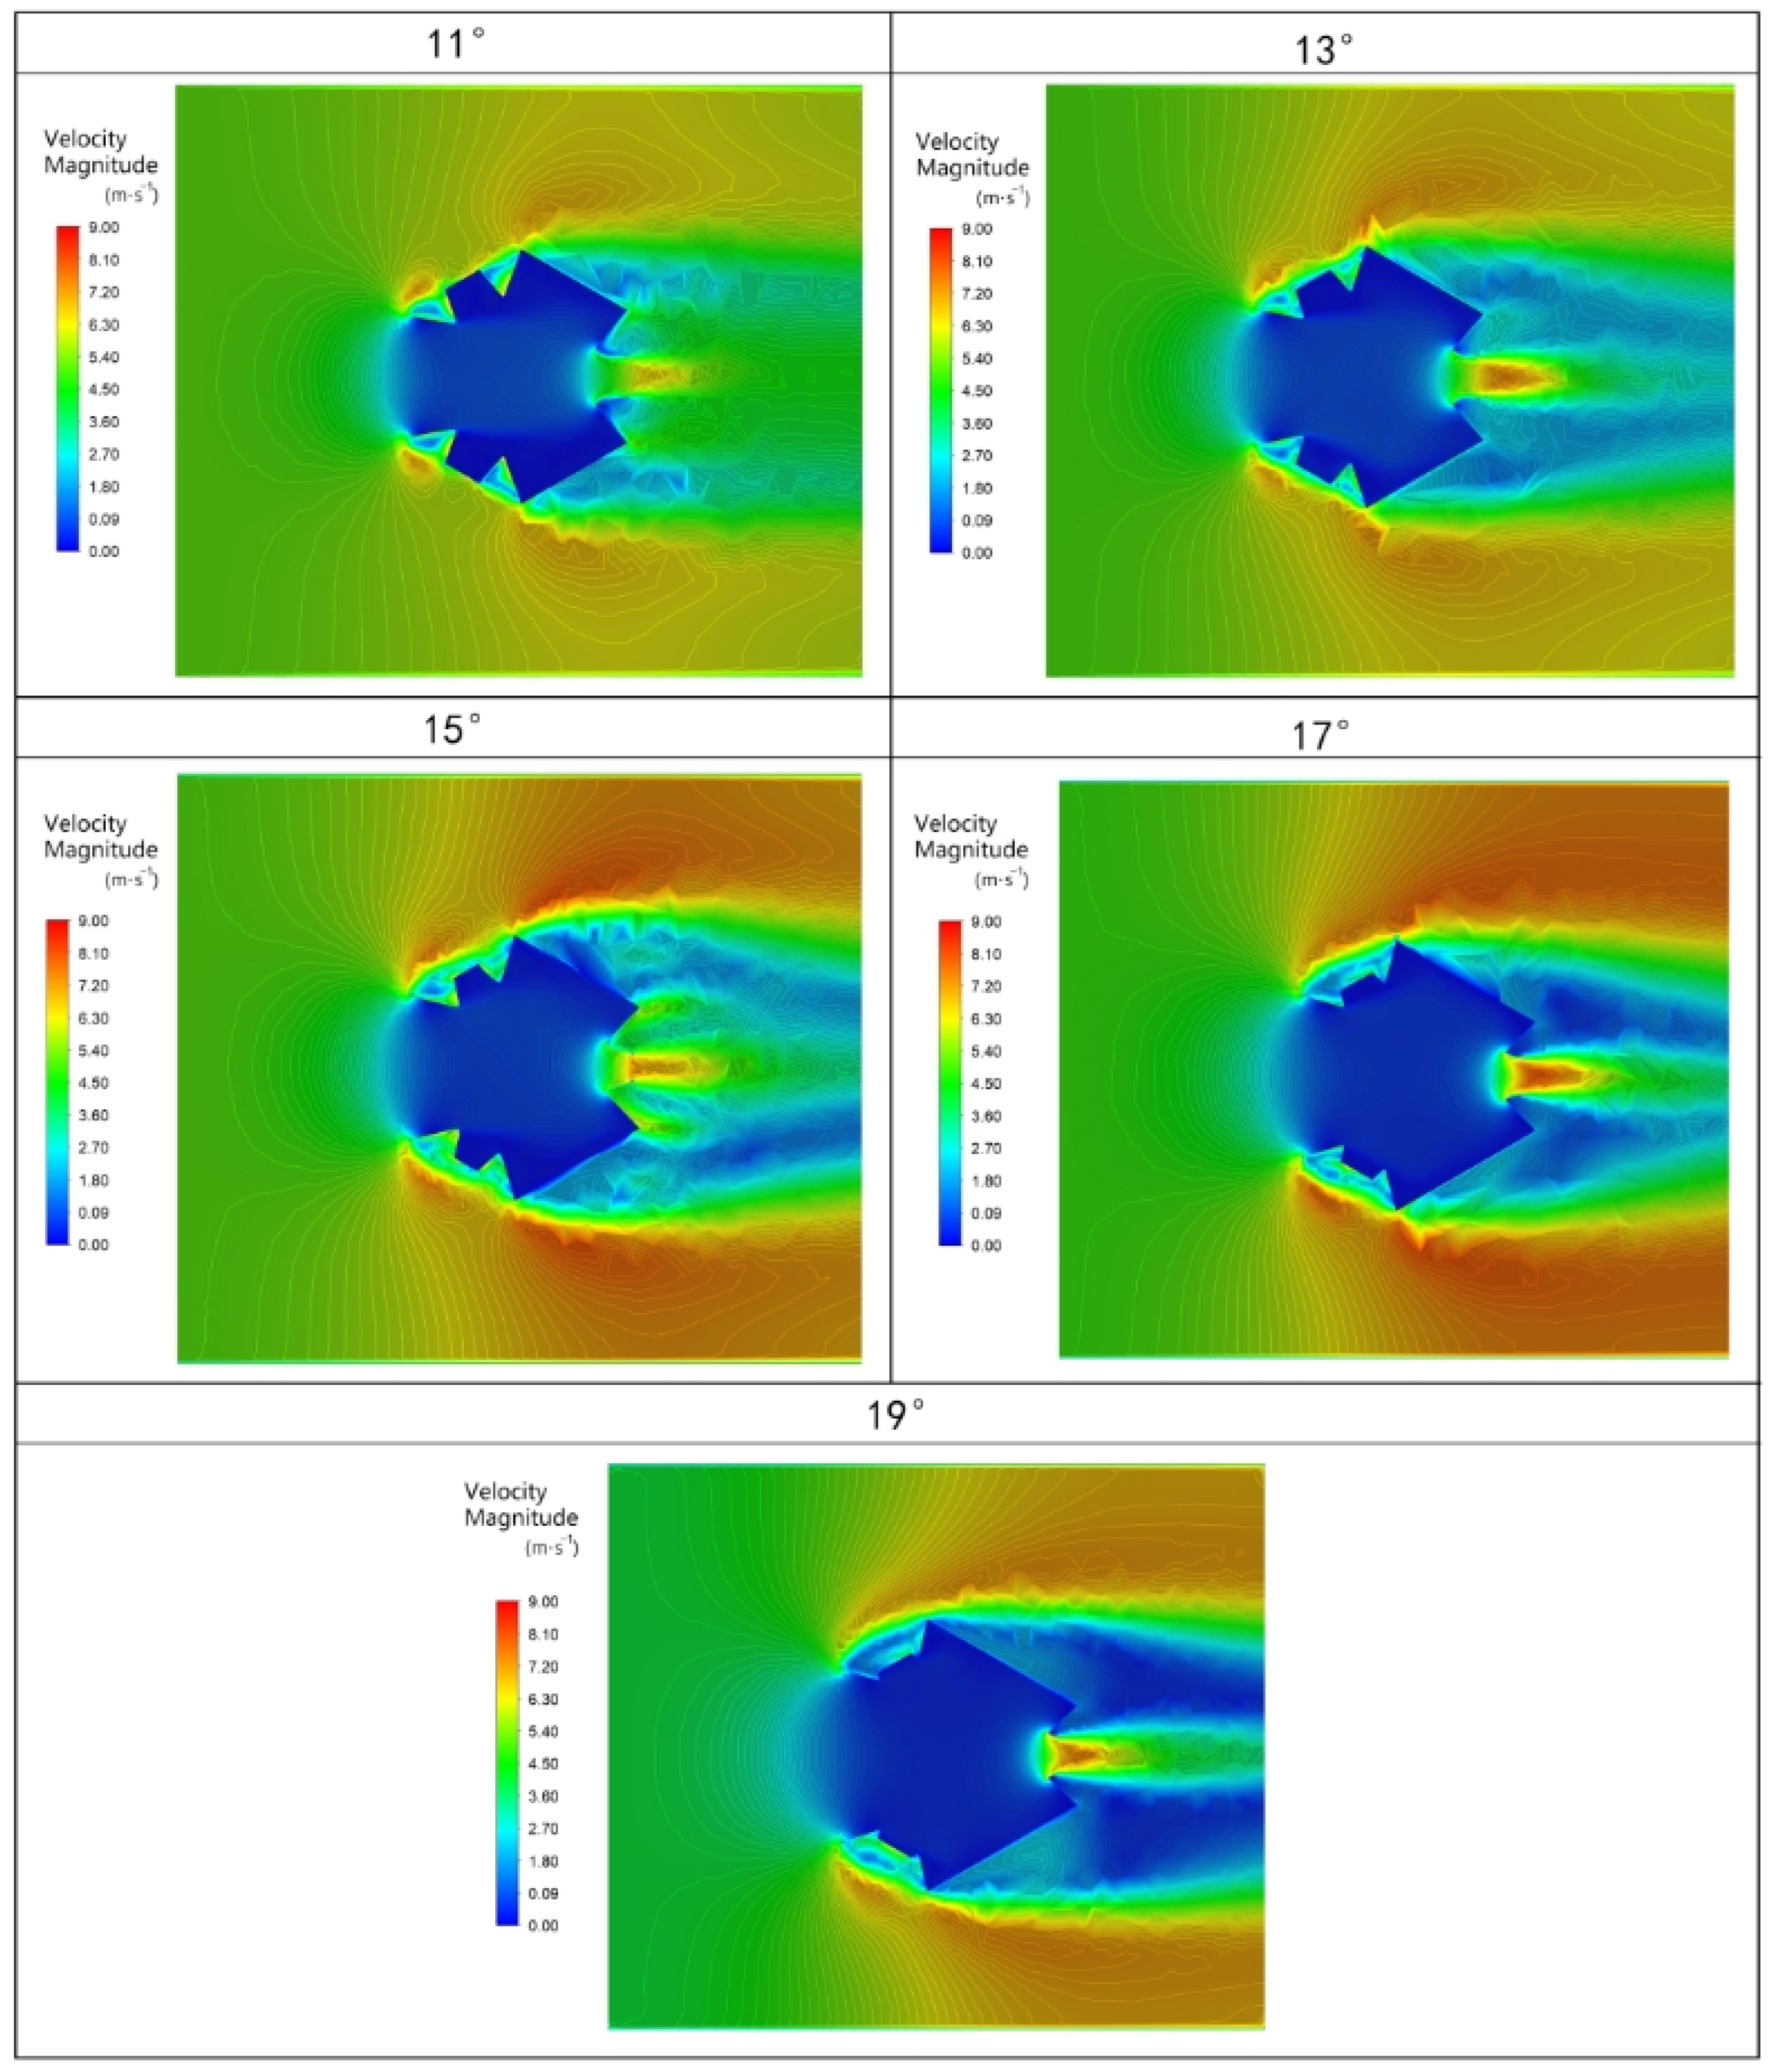
As the inclination angle increases, the velocity field within the nozzle becomes more uneven, with alternating regions of high and low velocity. Turbulence intensity rises, and the overall flow uniformity decreases.
(3)
Through analysis and comparison, an inclination angle of 15° is suggested, maintaining good uniformity and directionality of the outlet flow while ensuring sufficient outlet flow velocity.

Author Contributions

Conceptualization, B.W.; methodology, B.W.; software, B.W.; validation, B.W.; formal analysis, B.W.; investigation, B.W.; resources, B.W.; writing—original draft preparation, B.W.; writing—review and editing, B.W.; visualization, B.W.; supervision, Y.Z.; project administration, Y.Z.; funding acquisition, Y.Z. All authors have read and agreed to the published version of the manuscript.

Funding

This work was supported by the National Key Research and Development Program of China (grant No. 2022YFC3802702).

Institutional Review Board Statement

Not applicable.

Informed Consent Statement

Not applicable.

Data Availability Statement

The original contributions presented in the study are included in the article, further inquiries can be directed to the corresponding author.

Conflicts of Interest

The authors declare no conflicts of interest.

References

  1. Zhu, Z. Current situation and prospec of land desertification problem. Geogr. Res. 1994, 13, 104–113. (In Chinese) [Google Scholar]
  2. Sterk, G.; Stoorvogel, J.J. Desertification–Scientific Versus Political Realities. Land 2020, 9, 156. [Google Scholar] [CrossRef]
  3. AbdelRahman, M.A.E. An overview of land degradation, desertification and sustainable land management using GIS and remote sensing applications. Rend. Lincei. Sci. Fis. Nat. 2023, 34, 767–808. [Google Scholar] [CrossRef]
  4. Tanglin, C.; Yang, J.; Zhu, Q. Study on environmental problems and countermeasures of land desertfication in China. Heilongjiang Huanjing Tongbao 2022, 35, 97–99. (In Chinese) [Google Scholar]
  5. He, P.; Zhang, H.; Wang, Y.; Kang, Y.; Huang, C.; Yang, X. Analysis of influencing factors of land desertification of hexi corridor of linze county. Environ. Eng. 2016, 34, 1111–1116. (In Chinese) [Google Scholar]
  6. Cai, T.; Ju, C. Quantitative assessment of desertification degree in ordos grassland. J. Beljing For. Univ. 2007, 29, 227–231. (In Chinese) [Google Scholar]
  7. Tai, X.; Lu, L.; Jiang, Q.; Chang, D. The perception of desertification, its social impact and the adaptive strategies of ecological migrants in the desertification area, China. Chin. J. Popul. Resour. Environ. 2020, 18, 324–330. [Google Scholar] [CrossRef]
  8. Al-Obaidi, J.R.; Yahya Allawi, M.; Salim Al-Taie, B.; Alobaidi, K.H.; Al-Khayri, J.M.; Abdullah, S.; Ahmad-Kamil, E.I. The environmental, economic, and social development impact of desertification in Iraq: A review on desertification control measures and mitigation strategies. Environ. Monit. Assess. 2022, 194, 440. [Google Scholar] [CrossRef] [PubMed]
  9. Ding, G.D.; Zhao, T.N.; Fan, J.Y.; Du, H. Analysis on development of desertification assessment indicator system. J. Beljing For. Univ. 2004, 26, 92–96. (In Chinese) [Google Scholar]
  10. Hu, D. The evolutionary journey of the maowusu desert. Rep. West. China 2020, 16, 11–17. (In Chinese) [Google Scholar]
  11. Gai, Z.; Ha, S. The governance of kubuci desert promotes “emission peak & carbon neutrality”: An clarification based on the new development concept. Sci. Manag. Res. 2022, 40, 80–87. (In Chinese) [Google Scholar]
  12. Yang, B.; Baoyin, T. Study on restoration succession of plant community in degenerated leymus chinensis steppe after harrowing for thirty years. Chin. J. Grassl. 2014, 36, 36–42. (In Chinese) [Google Scholar]
  13. Qin, S. The main technical measures for aerial seeding afforestation in The Bayan-Ondor Desert. Inn. Mong. For. 2022, 8, 36–37. (In Chinese) [Google Scholar]
  14. Fu, B. A Small UAV with a Precise Aerial Seeding Structure. Chinese Patent CN207135486U, 27 March 2018. (In Chinese). [Google Scholar]
  15. Liu, Z.; Yang, X.; Peng, J. Simulation experiment of aerodynamic characteristics of laval nozzle. Res. Explor. Lab. 2021, 40, 106–110. (In Chinese) [Google Scholar]
  16. Chen, Z.; Liu, G.; Zhao, H.; Deng, J. Analysis of the internal flow features of a CO2 transonic nozzle and optimization of the nozzle shape profile. Appl. Therm. Eng. 2024, 238, 121945. [Google Scholar] [CrossRef]
  17. Pei, X.; Zhang, L.; Wang, X.; Liu, J.; Qian, Q.; Zhu, M. Design and application of intake and exhaust simulation system for altitude ground test facilities. J. Aerosp. Power 2022, 37, 2074–2089. (In Chinese) [Google Scholar]
  18. Chikitkin, A.; Petrov, M.; Dushkov, R.; Shifrin, E. Aerodynamic Design of a Laval Nozzle for Real Gas Using Hodograph Method. Aerospace 2018, 5, 96. [Google Scholar] [CrossRef]
  19. Chen, Z.; Xu, M.; Dang, H. Experimental technique study of supersonic windy fuze dynamotor. Exp. Meas. Fluid Mech. 2004, 18, 58–61. (In Chinese) [Google Scholar]
  20. Gu, S.; Hao, J.; Wen, C. Air thermochemistry in the converging section of de Laval nozzles on hypersonic wind tun-nels. AIP Adv. 2022, 12, 085320. [Google Scholar] [CrossRef]
  21. Zhao, A.; Lin, L.; Li, P. Shape optimization of industrial supersonic nozzle based on computational fluid dynamic. China Powder Sci. Technol. 2017, 23, 6–11. (In Chinese) [Google Scholar]
  22. Dang, X.A.; Wang, L.L.; Yang, L.J. A Study on Novel Gas Atomization Device for Preparing Ultra Fine Metal Powder. Adv. Mater. Res. 2011, 291–294, 741–744. [Google Scholar] [CrossRef]
  23. Du, Y.; Chen, Y.; Zhou, Z.; Dong, C. Optimization design of nozzle flow path shape for foreign fiber sorter. J. Tianjin Polytech. Univ. 2019, 38, 76–82. (In Chinese) [Google Scholar]
  24. Launder, B.E.; Reece, G.J.; Rodi, W. Progress in the development of a Reynolds-stress turbulence closure. J. Fluid Mech. 1975, 68, 537–566. [Google Scholar] [CrossRef]
  25. Yi, Z. Theory and practice of desert “soilization” for ecological restoration. J. Chongqing Jiaotong Univ. 2016, 35, 27–32. (In Chinese) [Google Scholar]
  26. Li, T.; Jin, S.P.; Huang, S.Y.; Liu, W. Evaluation indices of flow velocity distribution uniformity: Comparison and application. Therm. Power Gener. 2013, 42, 60–63, 92. (In Chinese) [Google Scholar]
  27. Weltens, H.; Bressler, H.; Terres, F.; Neumaier, H.; Rammoser, D. Optimisation of catalytic converter gas flow distribution by CFD prediction. In SAE Technical Paper 930780; SAE International: Pittsburgh, PA, USA, 1993; pp. 1–23. [Google Scholar] [CrossRef]
Figure 1. Schematic diagram of the Laval nozzle.
Applsci 14 05971 g001
Figure 2. Model of basic nozzle unit.
Applsci 14 05971 g002
Figure 3. Phenomenon of contraction nozzle acceleration.
Applsci 14 05971 g003
Figure 4. Velocity profile along the center line.
Applsci 14 05971 g004
Figure 5. Process flowchart of the design.
Applsci 14 05971 g005
Figure 6. Evolution of the process.
Applsci 14 05971 g006
Figure 7. Composite configuration and holistic formation.
Applsci 14 05971 g007
Figure 8. Flow field distribution under unrestricted conditions.
Applsci 14 05971 g008
Figure 9. Ideal direction of airflow in and out.
Applsci 14 05971 g009
Figure 10. Schematic diagram of a unidirectional filtration membrane.
Applsci 14 05971 g010
Figure 11. The installed filter at the inlet of the nozzle.
Applsci 14 05971 g011
Figure 12. Velocity contour of the fundamental unit of the nozzle.
Applsci 14 05971 g012
Figure 13. Velocity contour of the fundamental unit of the nozzle.
Applsci 14 05971 g013
Table 1. Uniformity indices under different inclination angles.
Inclination Angle/°Outlet Radius/mmS v ¯ /(m·s−1)CV γ v S x
1115003.1584.5620.0690.984−0.993
1316505.1155.6160.0910.9830.993
1518408.0306.7580.1190.9770.991
17203017.1178.4520.2030.9650.982
19222043.52610.6610.4080.9300.893
Disclaimer/Publisher’s Note: The statements, opinions and data contained in all publications are solely those of the individual author(s) and contributor(s) and not of MDPI and/or the editor(s). MDPI and/or the editor(s) disclaim responsibility for any injury to people or property resulting from any ideas, methods, instructions or products referred to in the content.

