1. Introduction
The development of Advanced Driver Assistance Systems (ADAS) has made significant strides, driven by innovations in artificial intelligence, sensor technology, and vehicle connectivity. ADAS are integral to modern vehicles, providing features such as adaptive cruise control, lane-keeping assist, and automatic emergency braking. These systems aim to enhance road safety and driving comfort by automating certain driving tasks and assisting drivers in complex scenarios. However, situational awareness (SA)—the driver’s understanding of their environment and ability to respond appropriately—is critical for the effectiveness of ADAS.
Situational awareness involves the perception of elements in the environment, comprehension of their meaning, and projection of their future status. In the context of ADAS, maintaining high situational awareness ensures that drivers can seamlessly take control of the vehicle, when necessary, especially as vehicles move towards higher levels of automation. This transition from automated to manual control, often referred to as a “takeover request”, requires that the driver be fully aware of the current driving situation to respond effectively.
Previous research has predominantly focused on using machine learning to predict situational awareness in ADAS. For example, Zhou et al. [
1] utilized eye-tracking data to anticipate situational awareness during takeover transitions in conditionally automated driving, achieving high accuracy with ML models. Machine learning models often involve complex algorithms and large datasets, necessitating significant computational resources for the training phase. These models are computationally intensive, requiring substantial processing power and time, which can limit their real-time applicability in critical driving situations.
Fuzzy logic, on the other hand, offers a flexible and efficient alternative. It is well-suited for handling uncertainty and imprecision, making it an ideal choice for modeling human behavior and environmental factors in driving scenarios. Fuzzy logic systems can potentially process information more quickly than traditional ML models, providing faster responses in real-time applications. Additionally, fuzzy logic models are more interpretable, allowing for easier understanding and adjustment of the decision-making rules based on expert knowledge.
This study aims to investigate whether fuzzy logic can be effectively applied to assess situational awareness, using a database that has been previously explored with ML approaches. By comparing the performance of fuzzy logic with established ML models, this research seeks to highlight the potential advantages of fuzzy logic in terms of its robustness.
The research objectives are:
Evaluate the Feasibility of Fuzzy Logic for Situational Awareness: This study explores the use of fuzzy logic to model situational awareness based on 14 critical predictors categorized into four groups: time-decision, criticality, eye-related metrics, and driver experience.
Compare with Machine Learning Models: The performance of the fuzzy logic model is benchmarked against ML models, particularly focusing on predictive accuracy (RMSE and MAE) and computational efficiency.
The contributions of this research are:
Fuzzy Logic Model in Predicting SA: The study introduces a fuzzy logic model tailored to predict situational awareness, providing a fresh perspective within the ADAS domain.
Performance Comparison: It offers a comparison between fuzzy logic and ML models, highlighting better interpretability and comparable accuracy.
Real-World Implications: The findings suggest that the fuzzy logic system can enhance the safety and efficiency of ADAS by improving real-time situational awareness prediction.
In summary, this study will demonstrate that the fuzzy logic system achieves prediction accuracy comparable to advanced ML methods, offers real-time applicability, and enhances interpretability and robustness, particularly in data-limited scenarios.
The remainder of this paper is organized as follows:
Section 2 reviews related work, providing an overview of existing approaches to situational awareness prediction in ADAS.
Section 3 details the dataset and all features that are measured.
Section 4 outlines the methodology used in this study, including the development of the fuzzy logic model.
Section 5 presents the results, comparing the performance of the fuzzy logic model with that of ML models.
Section 6 discusses the implications of these findings and outlines future research directions. Finally,
Section 7 concludes the paper with a summary of key insights.
2. Related Work
Smart cars are gaining prominence across both educational and business communities [
2]. The study of these vehicles intersects several fields including transportation, psychological and medical sciences, vehicle engineering, digital technologies, energy, and safety. Even as smart cars evolve towards complete automation, several hurdles remain, such as unpredictable environmental and traffic conditions, varied experiences of road users, and the intricacies of interaction between drivers and their vehicles [
3]. Achieving full driving automation necessitates a more comprehensive comprehension of how drivers behave, which is critical for enhancing the efficiency and functionality of these vehicles.
To provide a comprehensive overview of related work, this section summarizes key studies and analyzes their methodologies, findings, and limitations.
Table 1 compares different approaches to highlight both their differences and similarities.
Cognitive or mental workload describes how much of one’s cognitive capacity is employed when carrying out a task [
4]. This element is key in determining human performance, with higher workloads typically leading to reduced effectiveness. Numerous research efforts have focused on analyzing cognitive patterns and mental demands placed on drivers during interactions with vehicle systems while driving.
Several studies have addressed cognitive workload and driver interaction in smart cars using various methods and machine learning models:
Cognitive Workload Assessment via Pupil Diameter and EEG Data: The paper [
5] explores assessing cognitive workload through pupil diameter and EEG data in a simulated driving task. The study compares five machine learning models (KNN, Naive Bayes, Random Forest, SVM, and neural network) and finds that pupil diameter changes (APCPS) are a reliable metric for differentiating cognitive workload levels. The practical implication is the sufficiency of eye tracking over EEG for real-time applications in human–machine interactions.
Estimating Mental and Perceptual Loads Using Machine Learning Frameworks: Study [
6] employs a framework using non-intrusive sensors (heart rate variability and pupil dilation) to estimate cognitive demands. The ensemble of models (KNN, LDA, and AdaBoost) improves prediction accuracy, highlighting the robustness of the approach in reducing cognitive strain and enhancing safety.
Attention-enabled Recognition Network (ARecNet): The study [
7] presents ARecNet, integrating EEG signals, eye movements, and vehicle states via HyperLSTM with a cross-attention mechanism. This model adapts to driving conditions and driver behavior, showing improved real-time classification of cognitive workload levels.
Video-based Drowsiness Detection: Research [
8] introduces a deep-learning framework using facial videos, achieving high accuracy in drowsiness detection. The study also explores other methods such as EEG and eye gaze for evaluating cognitive workload.
Environmental Factors and Psychophysiological Metrics: Various studies [
9,
10,
11,
12] examine the impact of environmental factors on driver stress and workload, utilizing metrics such as gaze, heart rate, and EEG signals. These studies emphasize the importance of monitoring driver attention in semi-automated vehicles.
Shared Control and Decision-Making Models: Studies [
13,
14] focus on shared control algorithms and decision-making models integrating fuzzy logic with driver behavior analysis to enhance road safety and reduce accident rates under varying conditions.
Human-Vehicle Interaction (HVI) for Situation Awareness (SA): Research [
15,
16,
17,
18,
19,
20] investigates HVI mechanisms and interfaces designed to maintain driver awareness and readiness in automated vehicles. These studies highlight the role of multimodal alerts and adaptive interfaces in enhancing situational awareness and trust in automated systems.
Mitigating Label Noise in Machine Learning and Object Detection in Infrared Images: The study [
21] explores the use of a structured transition matrix network (STMN) with an adversarial learning process to mitigate label noise. This method leverages human cognition to improve the estimation accuracy of the label transition matrix, converting noisy labels into true labels. The approach demonstrates superiority over state-of-the-art methods in both synthetic and real-world datasets. Research [
22] introduces a novel backbone network, Deep-IRTarget, for object detection in infrared images. This method combines frequency and spatial feature extraction using a Hypercomplex Infrared Fourier Transform and convolutional neural network. The dual-domain feature resource allocation model enhances detection accuracy significantly across various infrared imagery databases. Few-shot learning approaches human-like fast learning with limited samples, and the paper [
23] introduces a Part-Aware Correlation Network (PACNet) that uses Partial Representation (PR) and Semantic Covariance Matrix (SCM) to enhance understanding the label correlations, outperforming state-of-the-art methods with significant performance gains on benchmark datasets.
Table 1.
Comparison of published methods: summaries and limitations.
Table 1.
Comparison of published methods: summaries and limitations.
| Study | Method | Data Types | Models Used | Key Findings | Limitations |
|---|
| [5] | Cognitive Workload Assessment | Pupil Diameter, EEG | KNN, Naive Bayes, Random Forest, SVM, neural network | Pupil diameter changes as a reliable metric, eye tracking sufficiency | Limited to simulated driving tasks |
| [6] | Mental Load Estimation | Heart Rate, Pupil Dilation | KNN, LDA, AdaBoost | Improved prediction accuracy with ensemble models | Non-intrusive sensors, may not capture all aspects of cognitive load |
| [7] | ARecNet for Workload Recognition | EEG, Eye Movements, Vehicle States | HyperLSTM with Cross-Attention | Real-time classification, adaptive to conditions | Complexity of model, high computational requirements |
| [8] | Drowsiness Detection | Facial Videos | MCNN, LSTM | High detection accuracy, effective feature integration | Sensitivity to light conditions, head movements |
| [9,10,11,12] | Environmental Factors and Workload | Gaze, Heart Rate, EEG | Various ML Models | Importance of monitoring driver attention | Diverse data sources, varying methodologies |
| [13,14] | Shared Control and Decision-Making | Driver Behavior, Environmental Conditions | Fuzzy Logic Models | Enhanced road safety, reduced accident rates | Dependence on accurate behavior prediction |
| [15,16,17,18,19,20] | HVI for Situational Awareness | Multimodal Data | Various HVI Interfaces | Improved situational awareness, trust in automation | Evaluation under controlled conditions, need for real-world validation |
The studies summarized above demonstrate diverse methodologies and approaches to understanding and improving driver interactions with smart car systems. While some focus on physiological metrics such as pupil diameter and EEG data [
5], others utilize machine learning frameworks to classify cognitive and perceptual loads [
6,
7]. The integration of multiple data streams, as seen in the ARecNet model [
7], shows promise for enhancing real-time workload recognition, but the complexity and computational demands of such models pose challenges for practical implementation.
Research on stress detection and drowsiness [
8,
10] highlights the importance of robust detection methods in maintaining driver safety. However, these studies often rely on controlled simulations which may not fully capture the nuances of real-world driving conditions. The use of shared control algorithms [
13] and decision-making models based on fuzzy logic [
14] offers potential solutions for improving road safety and driver assistance, yet these approaches require accurate and comprehensive data to be effective.
Reviews on fuzzy logic [
15] and HVI for situational awareness [
16] provide valuable insights into the evolution and challenges of these technologies. They underscore the need for adaptive and multimodal interfaces that can respond to varying driver states and environmental conditions. The exploration of AR interfaces [
18] further contributes to this understanding by demonstrating how smart user interfaces can optimize situational awareness in complex driving scenarios.
Overall, while significant progress has been made in developing methods for assessing and enhancing driver cognitive workload and situational awareness, there remain limitations related to the generalizability of findings from simulated environments to real-world applications. Future research should focus on validating these models in diverse driving conditions and exploring more adaptive and integrated interface solutions to support driver safety and performance. Additionally, these solutions should be capable of functioning in real-time, whereas currently, this is often not the case.
3. Dataset
Based on the detailed insights and methodologies derived from paper [
1], we continued our exploration by accessing the same dataset utilized in this study [
24]. The database standardized SA scores between zero and one by integrating three performance metrics (placement, distance, and speed estimation of vehicles relative to the ego-vehicle) across simulated driving scenarios. The database is described in this section.
Forty participants took part in an experiment for an MSc-level course at Delft University of Technology, a common practice in automated driving research. After excluding participants who did not adhere to instructions or had insufficient driving experience, 32 participants were included in the analysis. The majority were male, aged between 22 and 29 years, with varying levels of driving frequency and experience. Half of the participants were Dutch, while the others were mostly from China and India [
24].
The videos range from 1 to 20 s in length. Each video presents a three-lane highway, with the ego-car positioned in the middle lane. All videos feature six cars including the ego-car, except for the 20 s videos which include seven cars.
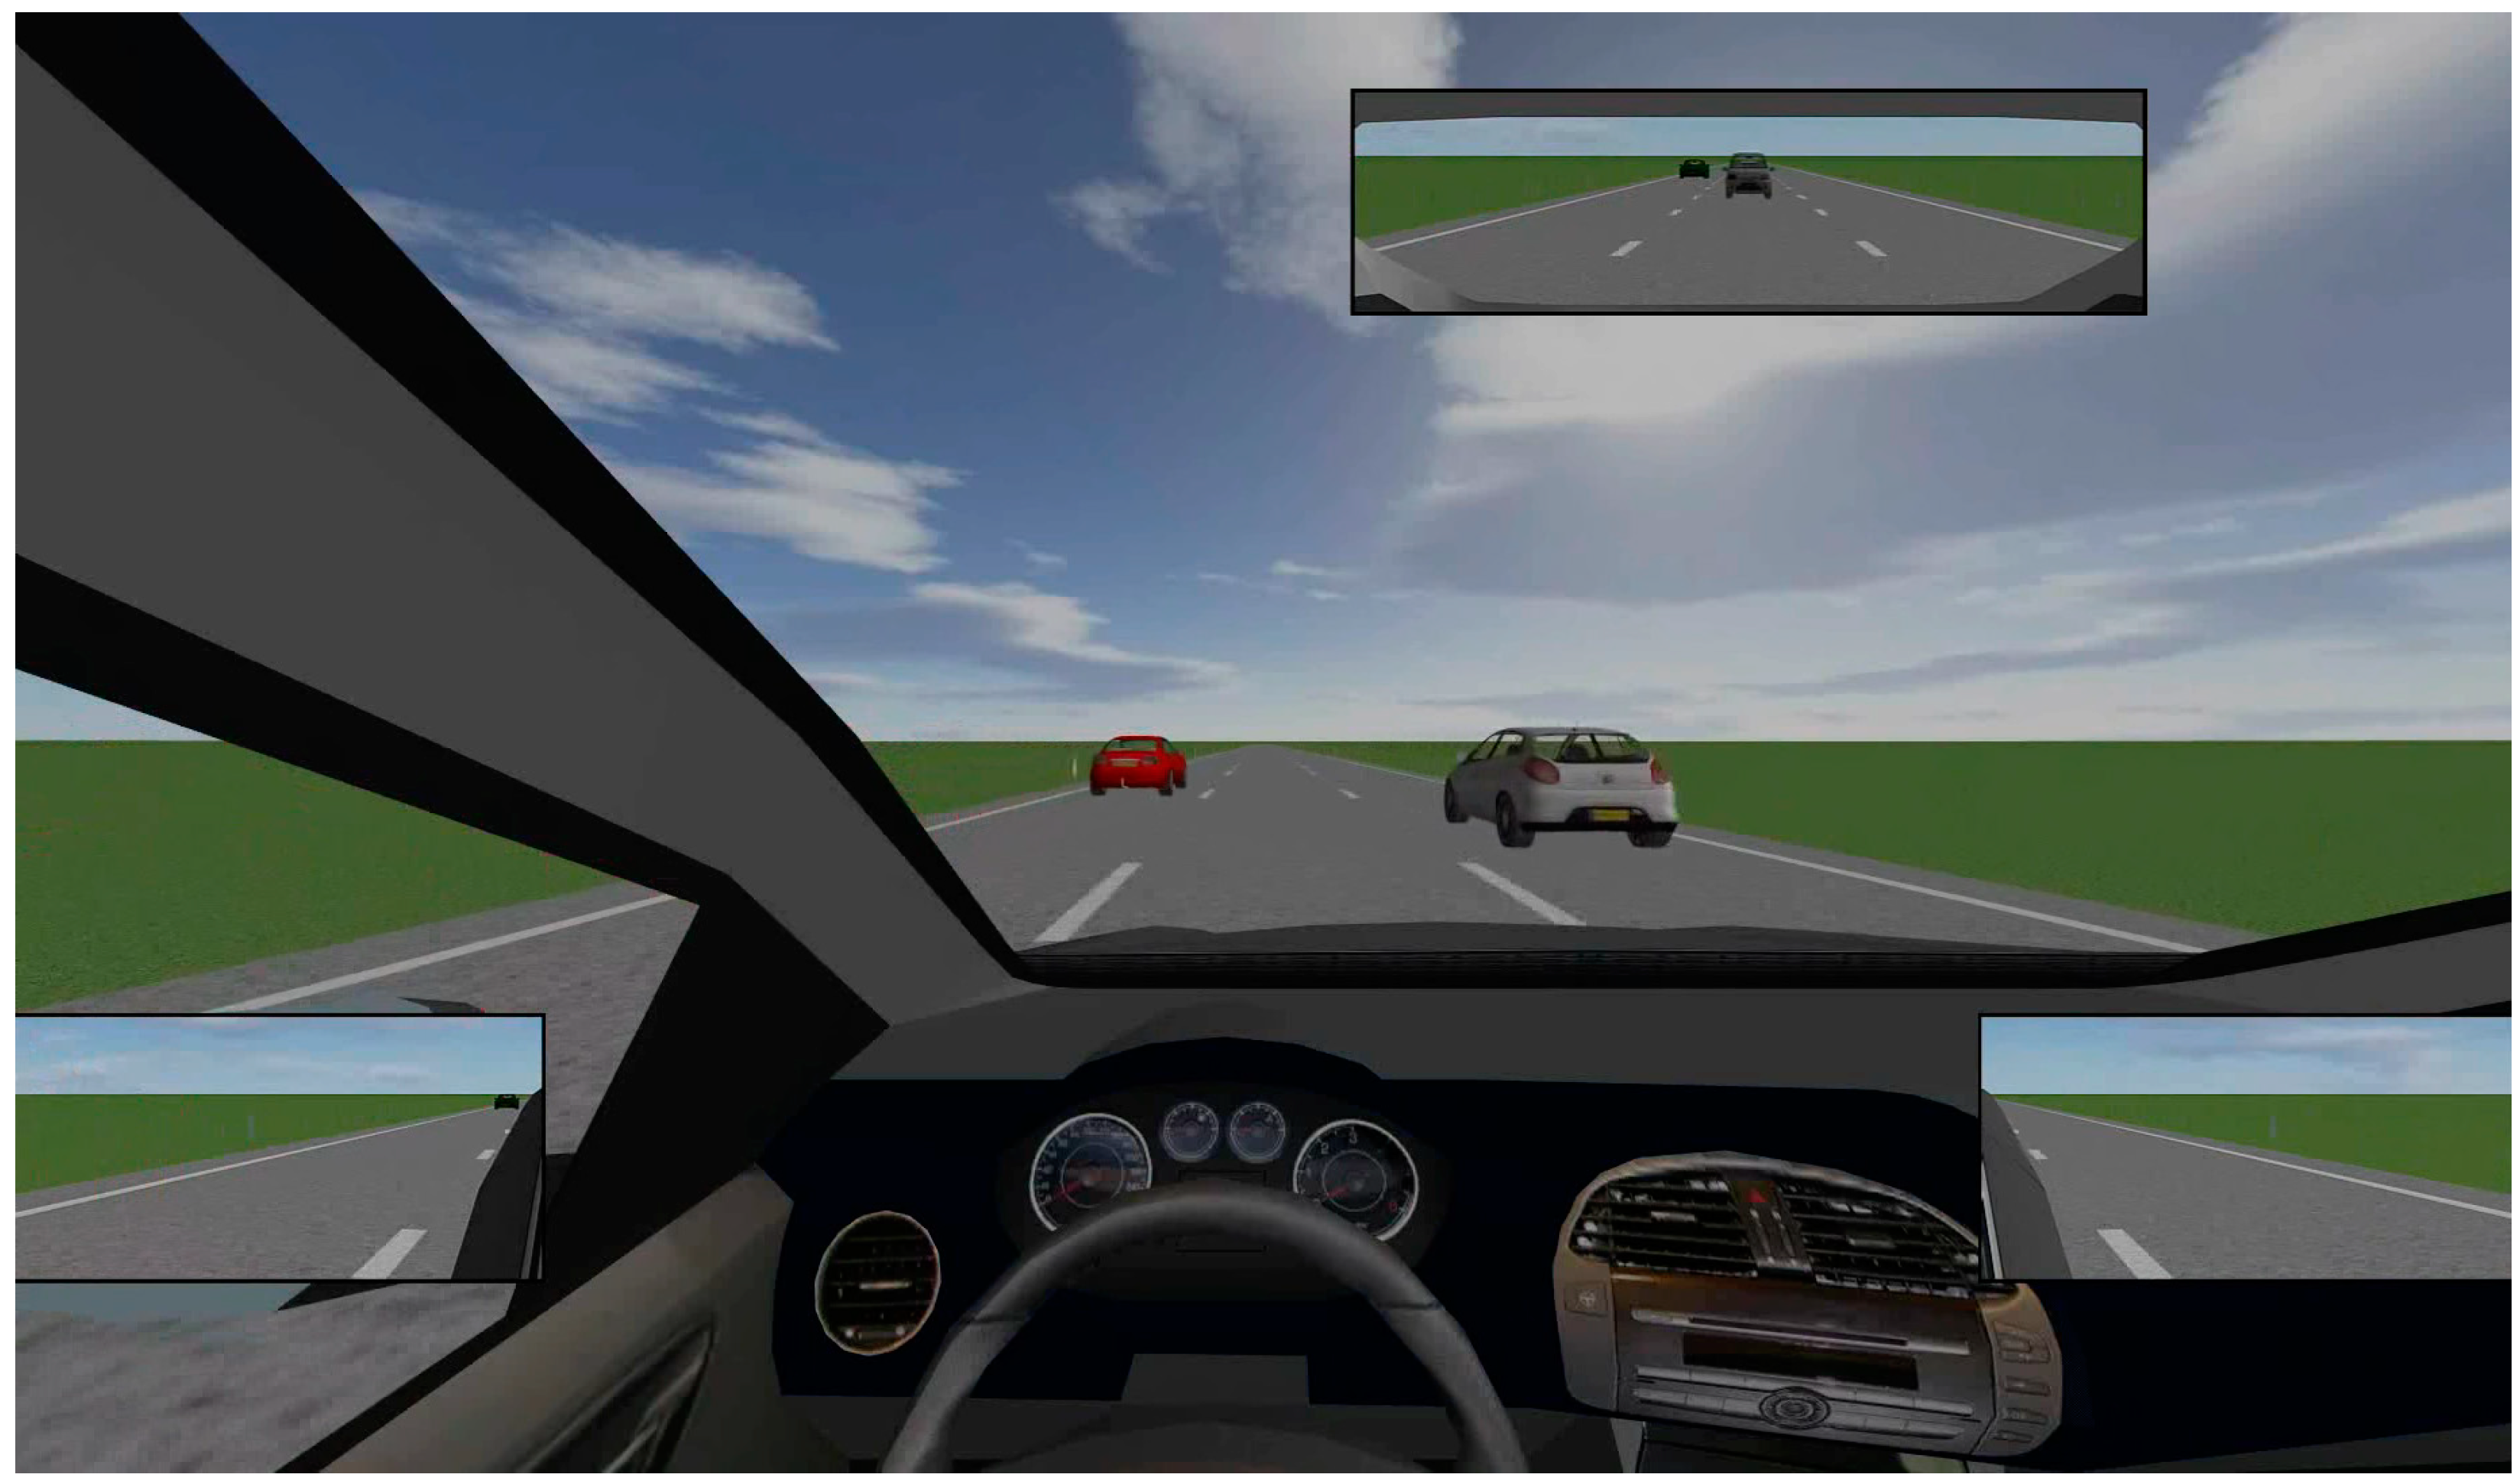
The study describes a simulation involving an ego-car and surrounding cars in three lanes, each with varying speeds (80, 100, and 120 km/h). The simulation aimed to mimic real-world speed variations encountered on roads, with cars randomly selected by color and model. By allowing cars driving at 120 km/h to use all lanes, the design aimed to eliminate the participants’ expectations regarding overtaking regulations in different countries. The simulation did not involve any lane changes, highlighting the speed and positional variations that may occur in real-world driving scenarios. One driving environment is presented in
Figure 1. A front view from the ego-car is given and the view from three mirrors. This environment consists of five cars. The ego-vehicle is in the middle lane, two vehicles are in front of the ego-vehicle and two are behind. In front of the ego-vehicle, one vehicle is in the right lane and one vehicle is in the left lane. Also, there are two more vehicles behind the ego-vehicle, one in the middle lane and one in the left lane, which can be seen in mirrors. This video is called a non-hazard video because there is no car in front of the ego-car in the same lane.
The videos were simulating driving scenarios, including non-hazard situations where all cars drove at a constant speed, and hazard situations where a collision needed to be avoided. The hazard situations involved a car decelerating in front of the ego-car, with variations in lane changes and braking maneuvers to avoid collisions. Additionally, training videos were created with surrounding cars but no hazards. In total, 33 videos were produced, including non-hazard, hazard, and training scenarios, each varying in length and complexity.
Participants signed a consent form, completed a questionnaire, and adjusted their seating. The experiment began with eye tracker calibration and 5 training videos, followed by viewing 28 videos in random order. After each video, participants decided on a take-control response, rated danger, rebuilt the scene, and rated task difficulty.
For predicting the SA of every experiment, paper [
1] shows that 14 measures are the most useful, so the same set of 14 measures were used in this paper, and they are listed and described in
Table 2.
In addition, participants were answering the following questions after every experiment:
How many cars were in the video?
What is the speed of every car (faster than the ego-car, equal speed as the ego-car, slower than the ego-car)?
What is the distance of each car from the ego-car?
For calculating the ground truth of SA for each video, the researchers in [
1] normalized all three error scores inversely on a scale from zero to one and assigned them equal weights. This approach generated a global SA score ranging from zero (indicating the worst SA) to one (indicating perfect SA):
Absolute error in the number of cars placed—measuring the difference between the number of cars placed and the true number of surrounding cars.
Total distance error—indicating the normalized sum of distance errors between placed and true cars.
Total speed error—indicating the normalized sum of distance errors between placed and true cars.
4. Methodology
Fuzzy Logic Control (FLC) is a widely used methodology in control systems for managing uncertainty and imprecision. This study explores the application of Mamdani-type fuzzy inference to enhance situational awareness and decision-making in dynamic driving environments. Mamdani-type fuzzy inference, introduced by Ebrahim Mamdani in 1975, synthesizes linguistic control rules derived from experienced human operators to control systems, initially experimented with a steam engine and boiler combination [
25].
This section details the methodology employed in our research. We begin with an overview of the Mamdani-type fuzzy inference system (MFIS), explaining its foundational principles and relevance to our study. This is followed by a description of our data handling and analysis strategy. The section then covers the implementation of our methodology using the ‘skfuzzy’ library, highlighting the technical aspects of our approach. We also discuss the grouping of predictor variables into logical categories and the development of specific fuzzy modules for each group. Finally, we describe the integration of these fuzzy logic modules into a cohesive system, demonstrating how they interact to produce effective inferences. By the end of this chapter, readers will have a thorough understanding of our methodological framework from theory to practical implementation.
4.1. Overview of Mamdani-Type Fuzzy Inference
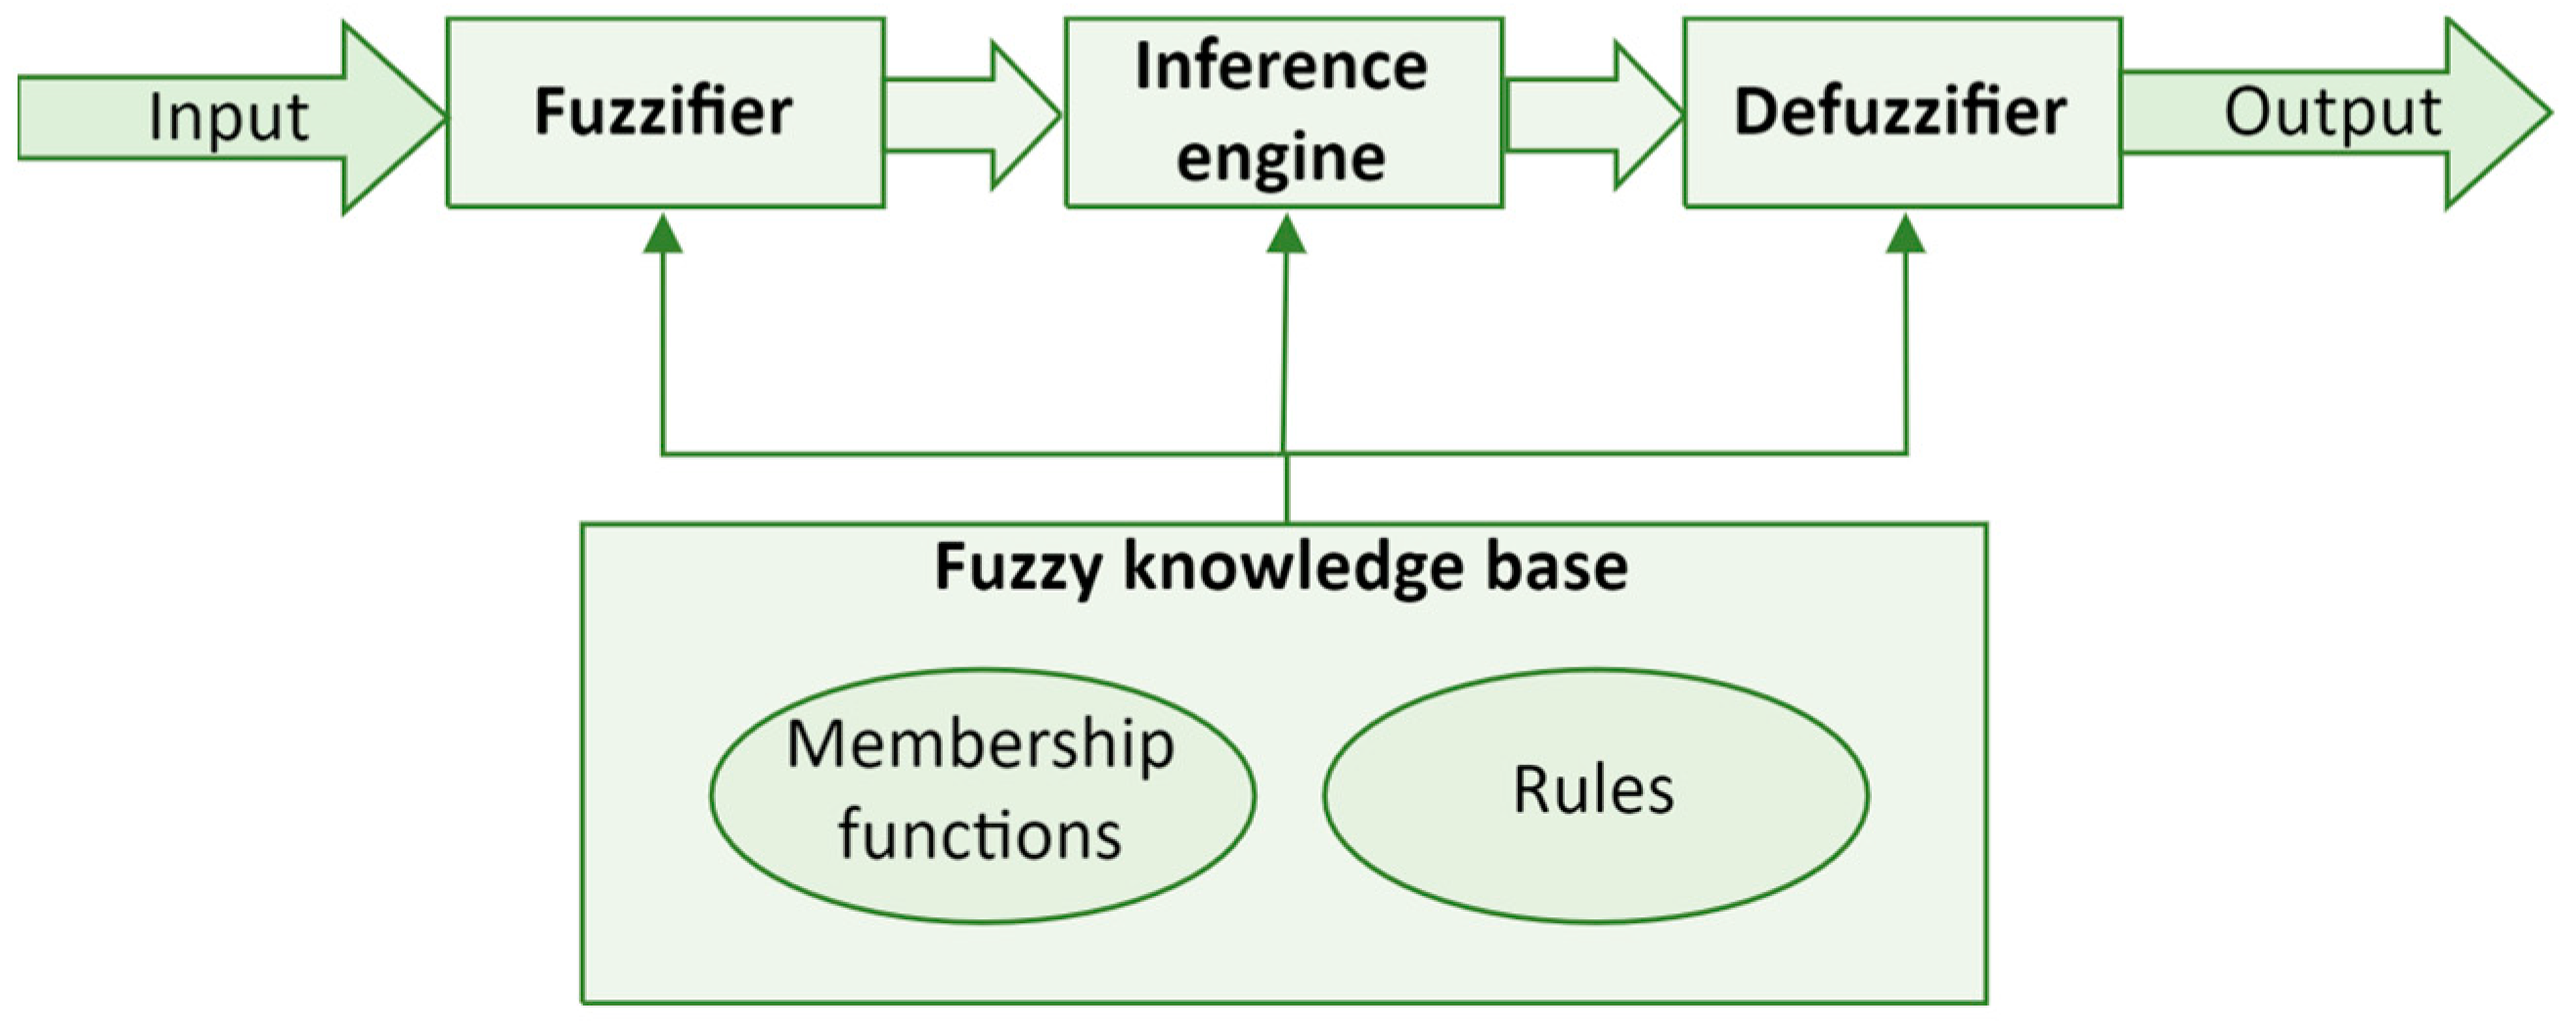
Mamdani’s approach was one of the first to construct a fuzzy control system, which demonstrated the practical application of fuzzy set theory. The Mamdani-type fuzzy inference system represents a departure from classical binary logic, which typically views conditions in black-or-white terms. Introduced to embody the complexity and gradation found in human reasoning, fuzzy logic allows for the representation of uncertainty and imprecision in computational systems. The Mamdani-type fuzzy inference system, shown in
Figure 2, includes three steps:
These three stages are connected to a fuzzy knowledge base, forming the foundation of a system that depends on four primary components.
The first component is a fuzzification module—Fuzzifier. In the fuzzification step, crisp inputs are converted into fuzzy sets. These inputs are applied to the antecedents of the fuzzy rules. For instance, if the input is traffic density, e.g., the number of cars passing through an intersection in a half-hour period, it could be converted into fuzzy values like ‘low’, ‘medium’, or ‘high’.
The second component is a Fuzzy knowledge base. This contains fuzzy rules that define the desired system behavior. For example, a simple rule in a traffic control system might be: “If traffic density is high, then the traffic light should change more often”.
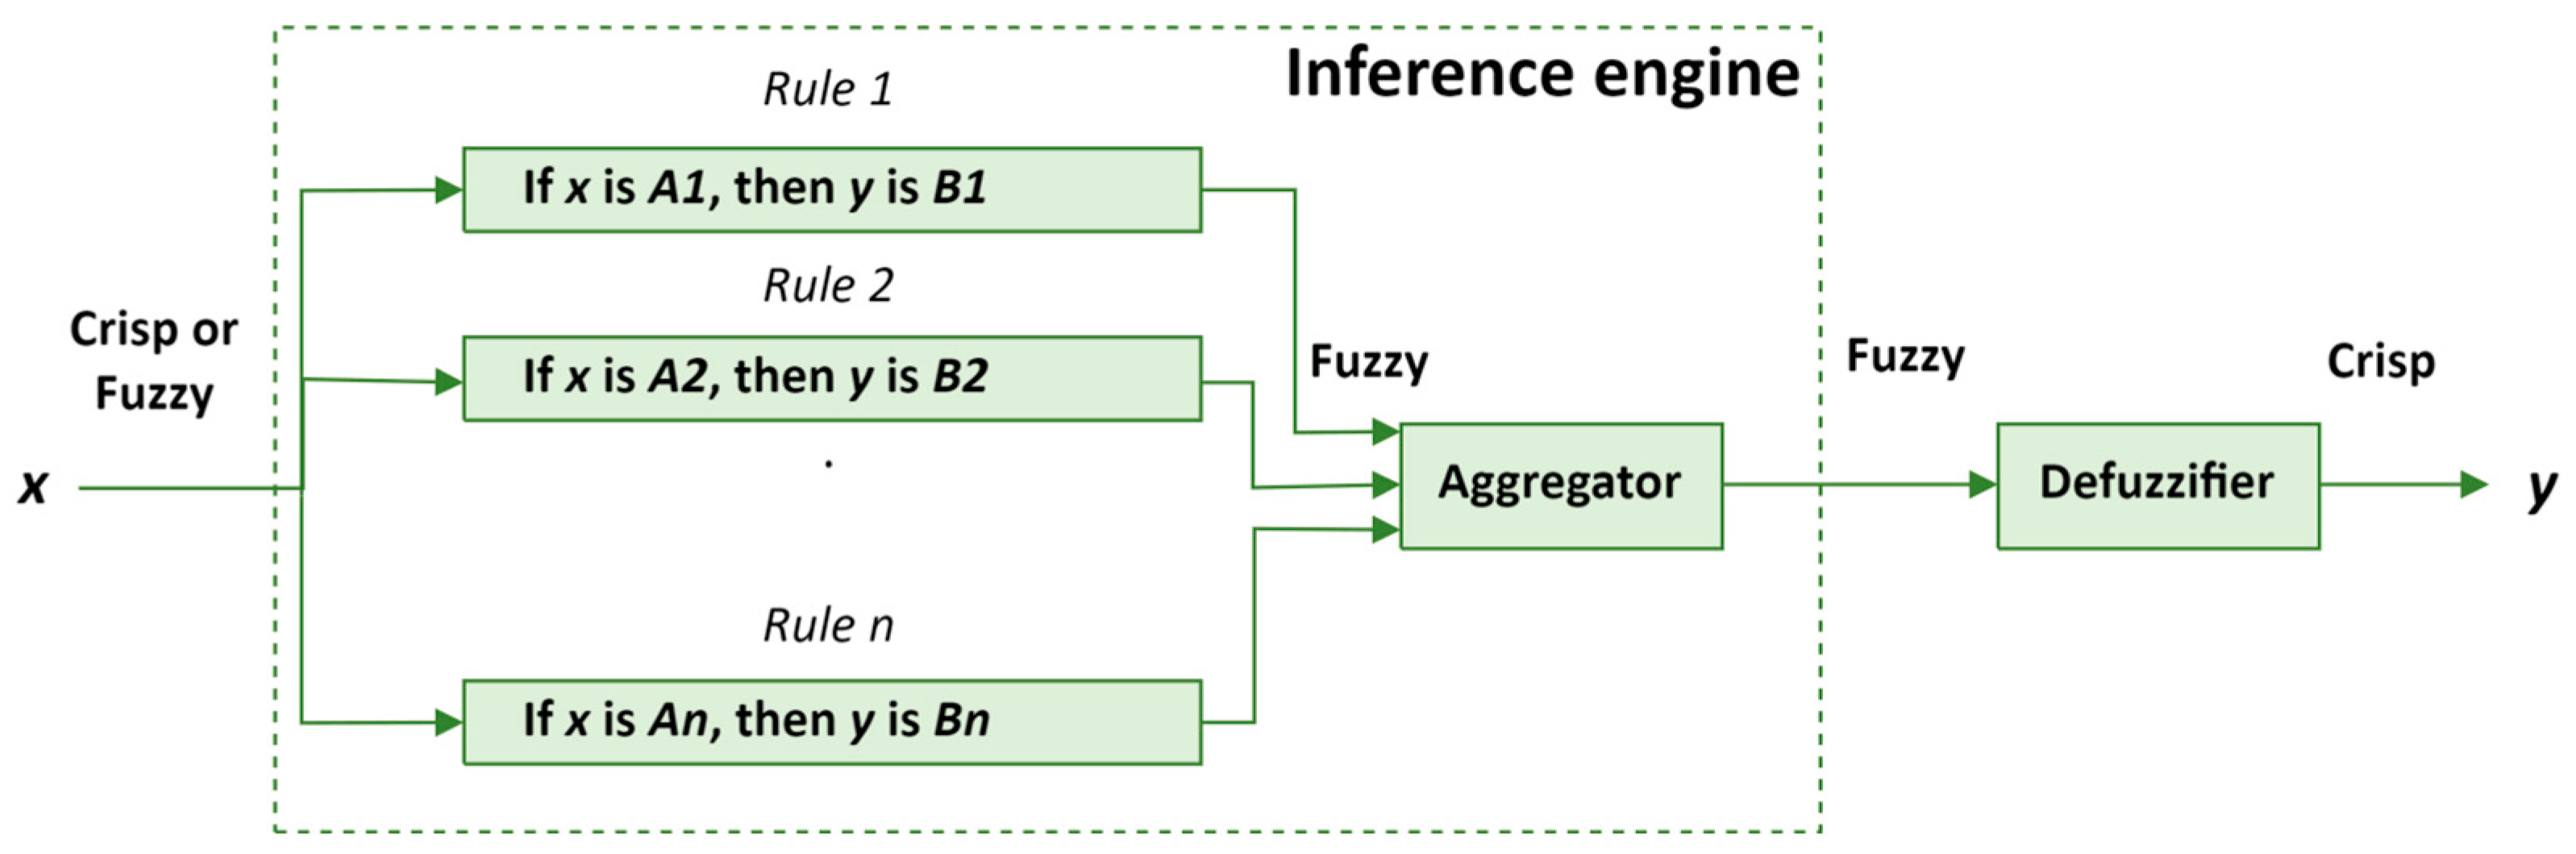
The third component is an
Inference engine shown in
Figure 3. In MFIS, the inference engine plays a crucial role in processing input data and executing fuzzy logic to arrive at appropriate outputs.
The fuzzy inference engine executes a process to map an input space to an output space using fuzzy logic principles. The key steps involve applying fuzzy logic operators and aggregating the results to produce a single output decision. For example, consider a rule:
Here,
A,
B, and
C are fuzzy sets in the input and output spaces. The fuzzy operator ‘
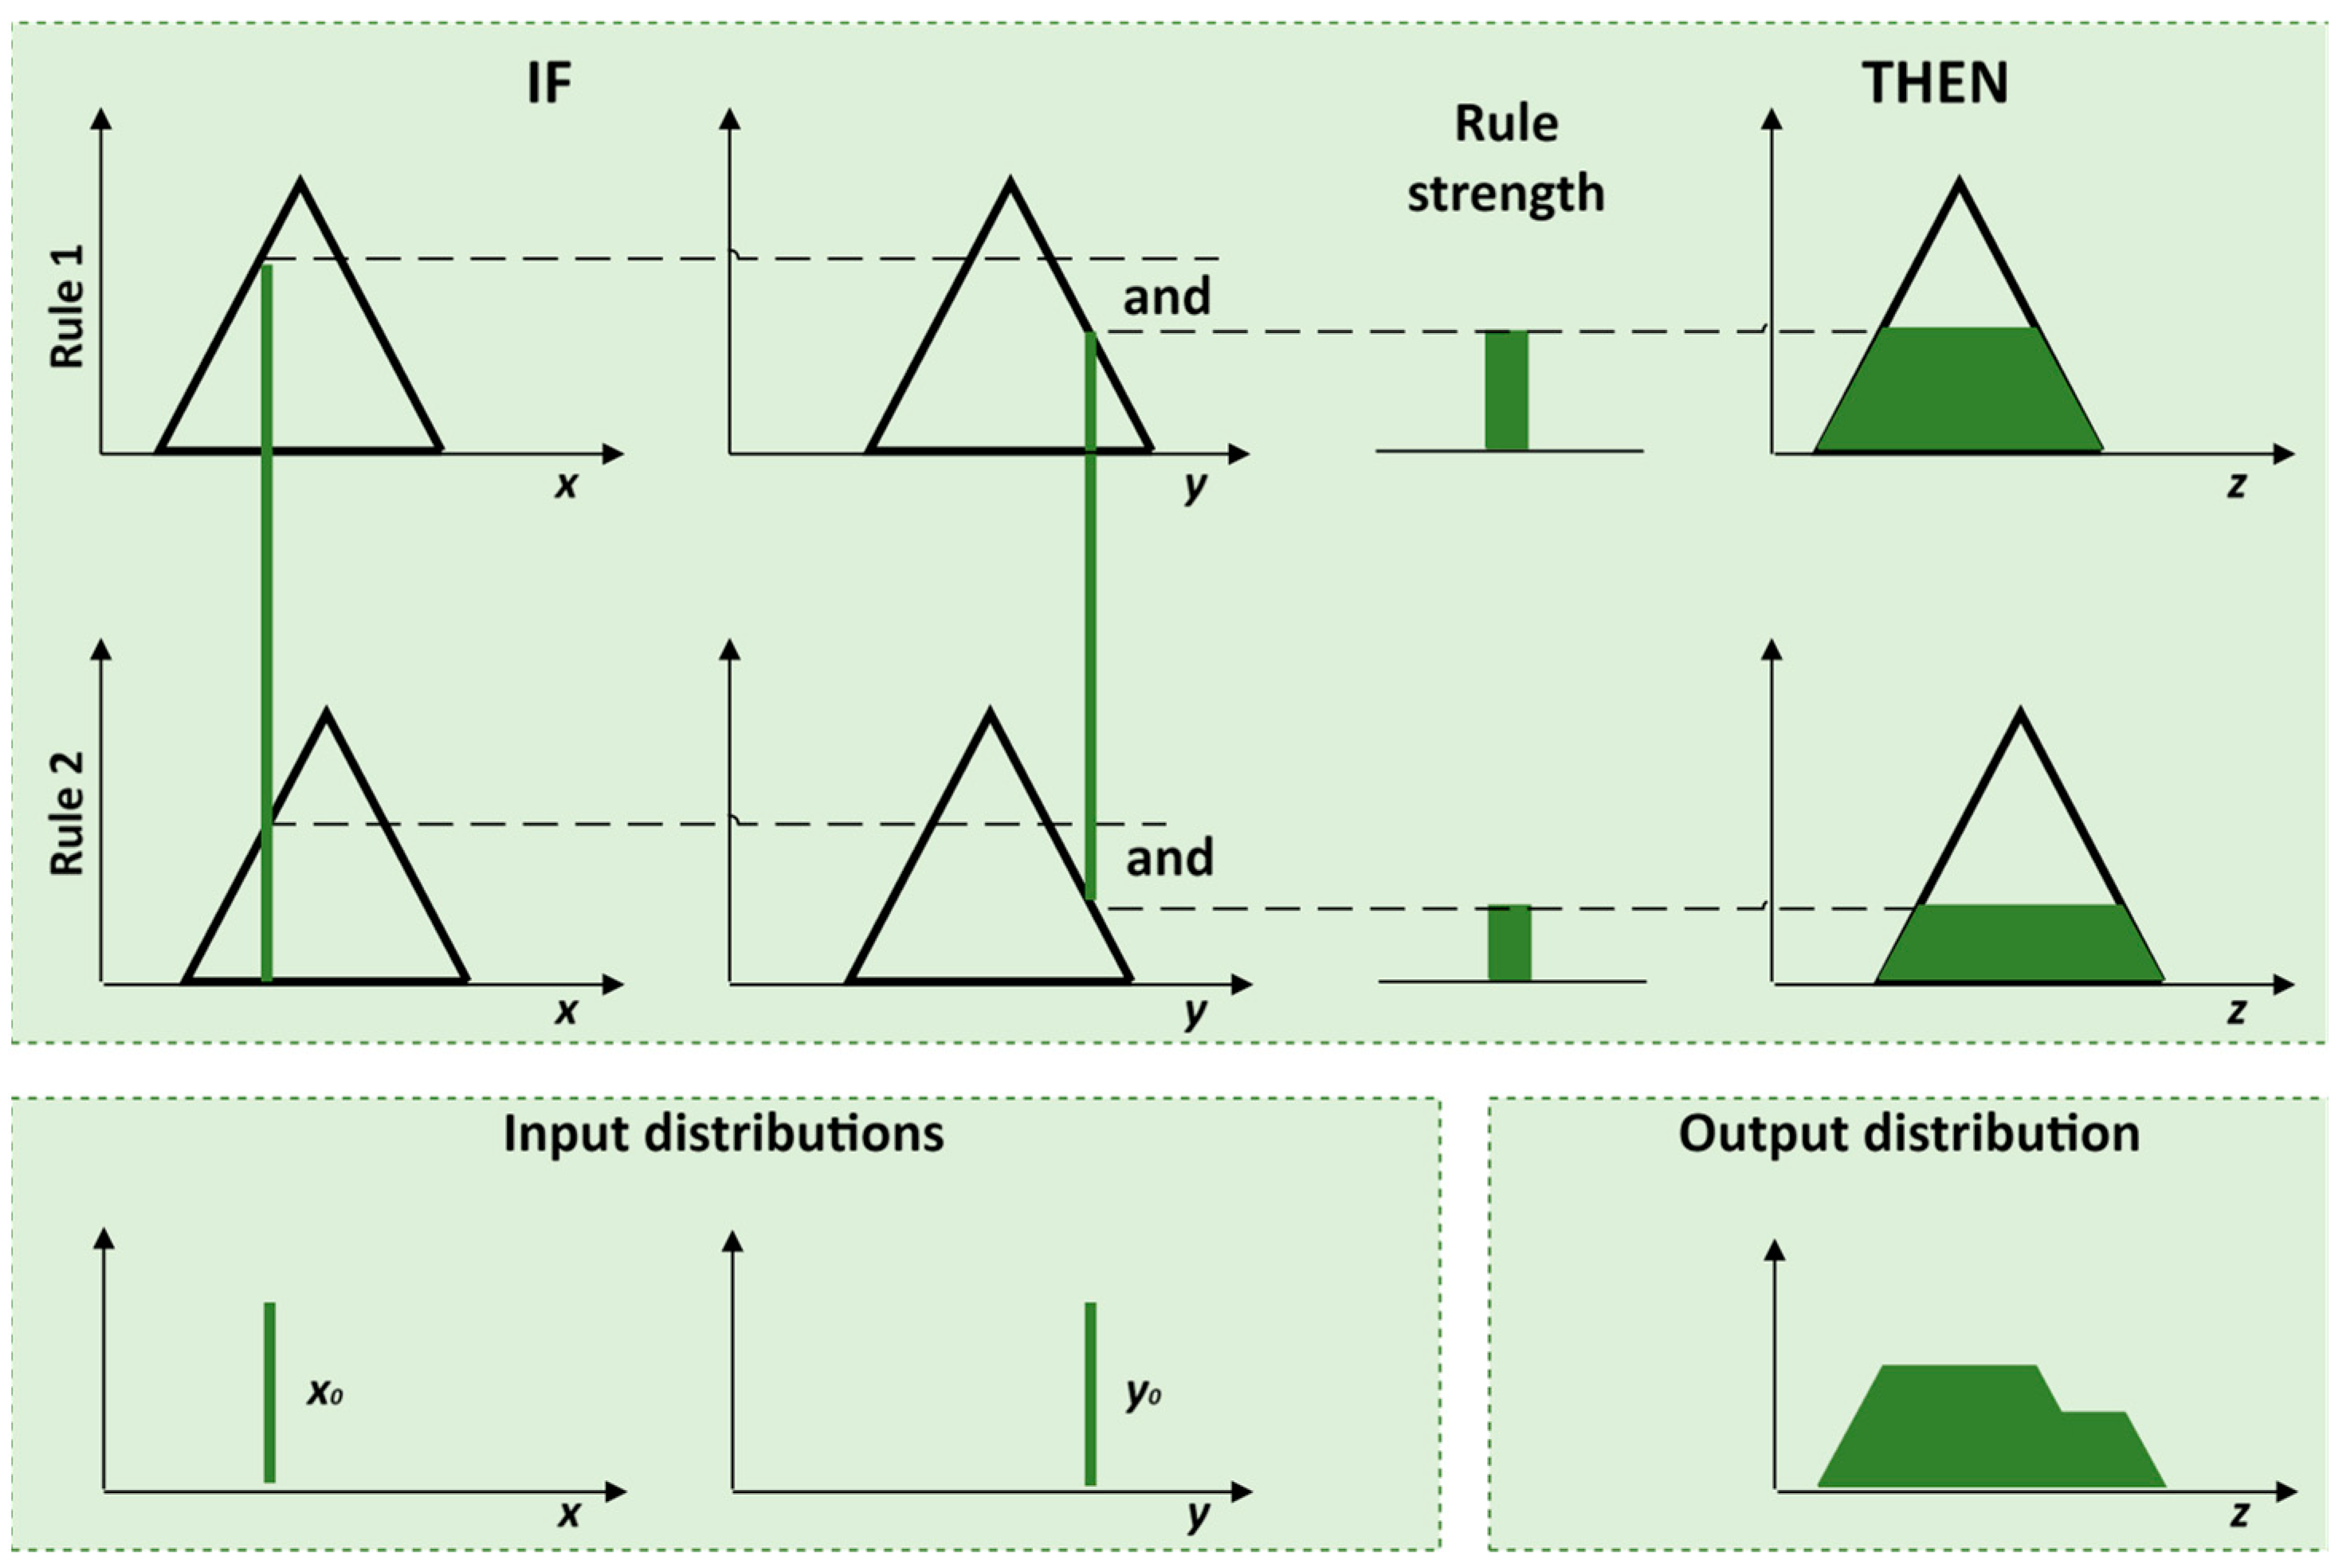
and’ is typically implemented as a minimum or maximum operator:
where
µR is the membership function of the fuzzy rule
R, and
µA and
µB are the membership functions of the fuzzy sets
A and
B (
Figure 4).
Let us consider the application of this in a traffic density control system, where the density is measured as the number of cars passing through an intersection in a half-hour period. In this context, the inference engine takes fuzzified inputs—categorized as ‘
low’ ‘
medium’, or ‘
high’ traffic density—and applies fuzzy reasoning to determine the necessary duration of traffic light phases. For example, the fuzzy rules are created by traffic management experts and encapsulate practical traffic control strategies. These rules might specify, for instance:
These rules are applied using fuzzy logic operators such as ‘and’, ’or’, and ‘not’, with the minimum operator commonly used for the ‘and’ condition in a Mamdani system. This means that the output fuzzy value for a rule is determined by the smallest membership value of the inputs involved in the rule.
Once the inference engine evaluates the traffic density against these rules, each rule generates a fuzzy output value. These outputs must then be aggregated to form a single fuzzy set that reflects the collective decision of the system. This aggregated fuzzy set incorporates all the nuances and variations captured by the individual rules, ensuring a comprehensive decision-making process that considers the varying conditions of traffic density at the intersection. The aggregated fuzzy set, representing the overall system’s decision on how long the green light should last based on current traffic conditions, is then ready for the final stage of the fuzzy inference process: defuzzification.
The fourth component of Mamdani-type fuzzy inference is a defuzzification module—Defuzzifier. Defuzzification is the final step, converting a fuzzy output set into a precise, actionable value. This is the process of producing a quantifiable result in Mamdani systems to derive a crisp output. For example, to translate this fuzzy output into a specific time duration that can be set on the traffic light timer, defuzzification is necessary. Choosing the appropriate defuzzification method affects how the system responds to varying conditions. Let us explore how different defuzzification methods would apply in this scenario:
Centroid Method (Center of Area, CoA): This method calculates the center of gravity of the fuzzy output set, providing a balanced representation of all contributing membership values. For our traffic light example, if the fuzzy output suggests varying degrees of appropriateness for extending the green light from 30 to 90 s, the centroid method will calculate the precise duration that best represents the overall suggestion of the fuzzy set. This method provides a balanced approach, often leading to smooth transitions between different traffic light durations based on changing traffic densities.
Mean of Maximum (MoM): This approach calculates the average of the output values that have the highest membership degrees in the fuzzy set. If the highest membership values are concentrated around certain durations, say 60 and 70 s, the MoM method would average these to determine the green light duration. This method might be preferred in conditions where traffic patterns consistently show peaks at specific times.
Smallest of Maximum and Largest of Maximum: These methods would choose either the smallest or largest duration value that has the highest degree of membership, depending on whether the system aims to minimize or maximize the traffic flow. In a scenario where traffic is critical and safety must be ensured by not overextending the green phases, the smallest of the maximum methods might be used. This approach could be critical in scenarios focusing on specific safety or efficiency metrics.
The centroid method is employed in our research. Its application will be explained in detail in the next subsection.
4.2. Overview of Data Handling and Analysis Strategy
In this section, we explain the comprehensive process of data manipulation and analysis. This research’s main objective is to deepen our understanding of the relationships between driving-related variables and their impacts on outcomes indicative of situational awareness.
The initial investigation used findings from a prior study in [
24] with specific attribute thresholds for classifying driving data. However, due to unsatisfactory predictive accuracy (RMSE of 0.4), we conducted a more detailed data examination. This revealed the need for deeper analysis to uncover finer connections between variables. Subsequently, we adopted a comprehensive data processing approach, focusing on normalization and categorization.
The first step involves applying the min–max normalization technique to all inputs. This method is a common technique used in data preprocessing to scale numerical features to a specific range, typically between 0 and 1. Min–max normalization ensures uniform scaling by subtracting the minimum value of the feature from each data point and then dividing it by the range of the feature (the difference between the maximum and minimum values). By applying min–max normalization, we ensured that all inputs were scaled uniformly between 0 and 1.
The second step in our data analysis process involves aggregating data by specific attributes to calculate counts and means for the target variable, situational awareness (SA). This aggregation helps us understand how different categories within a variable correlate with outcomes. We then dissect the normalized data into quantifiable groups or domains based on these attributes, segmenting the data into deciles or other meaningful segments to assess the distribution of SA across them. For instance, the attribute ‘age’ might be divided into segments such as 22–23, 24–25, and so on, with each segment evaluated for its statistical distribution regarding SA. This step is crucial for determining the influence each age group has on outcomes, which aids in constructing models based on fuzzy logic or machine learning.
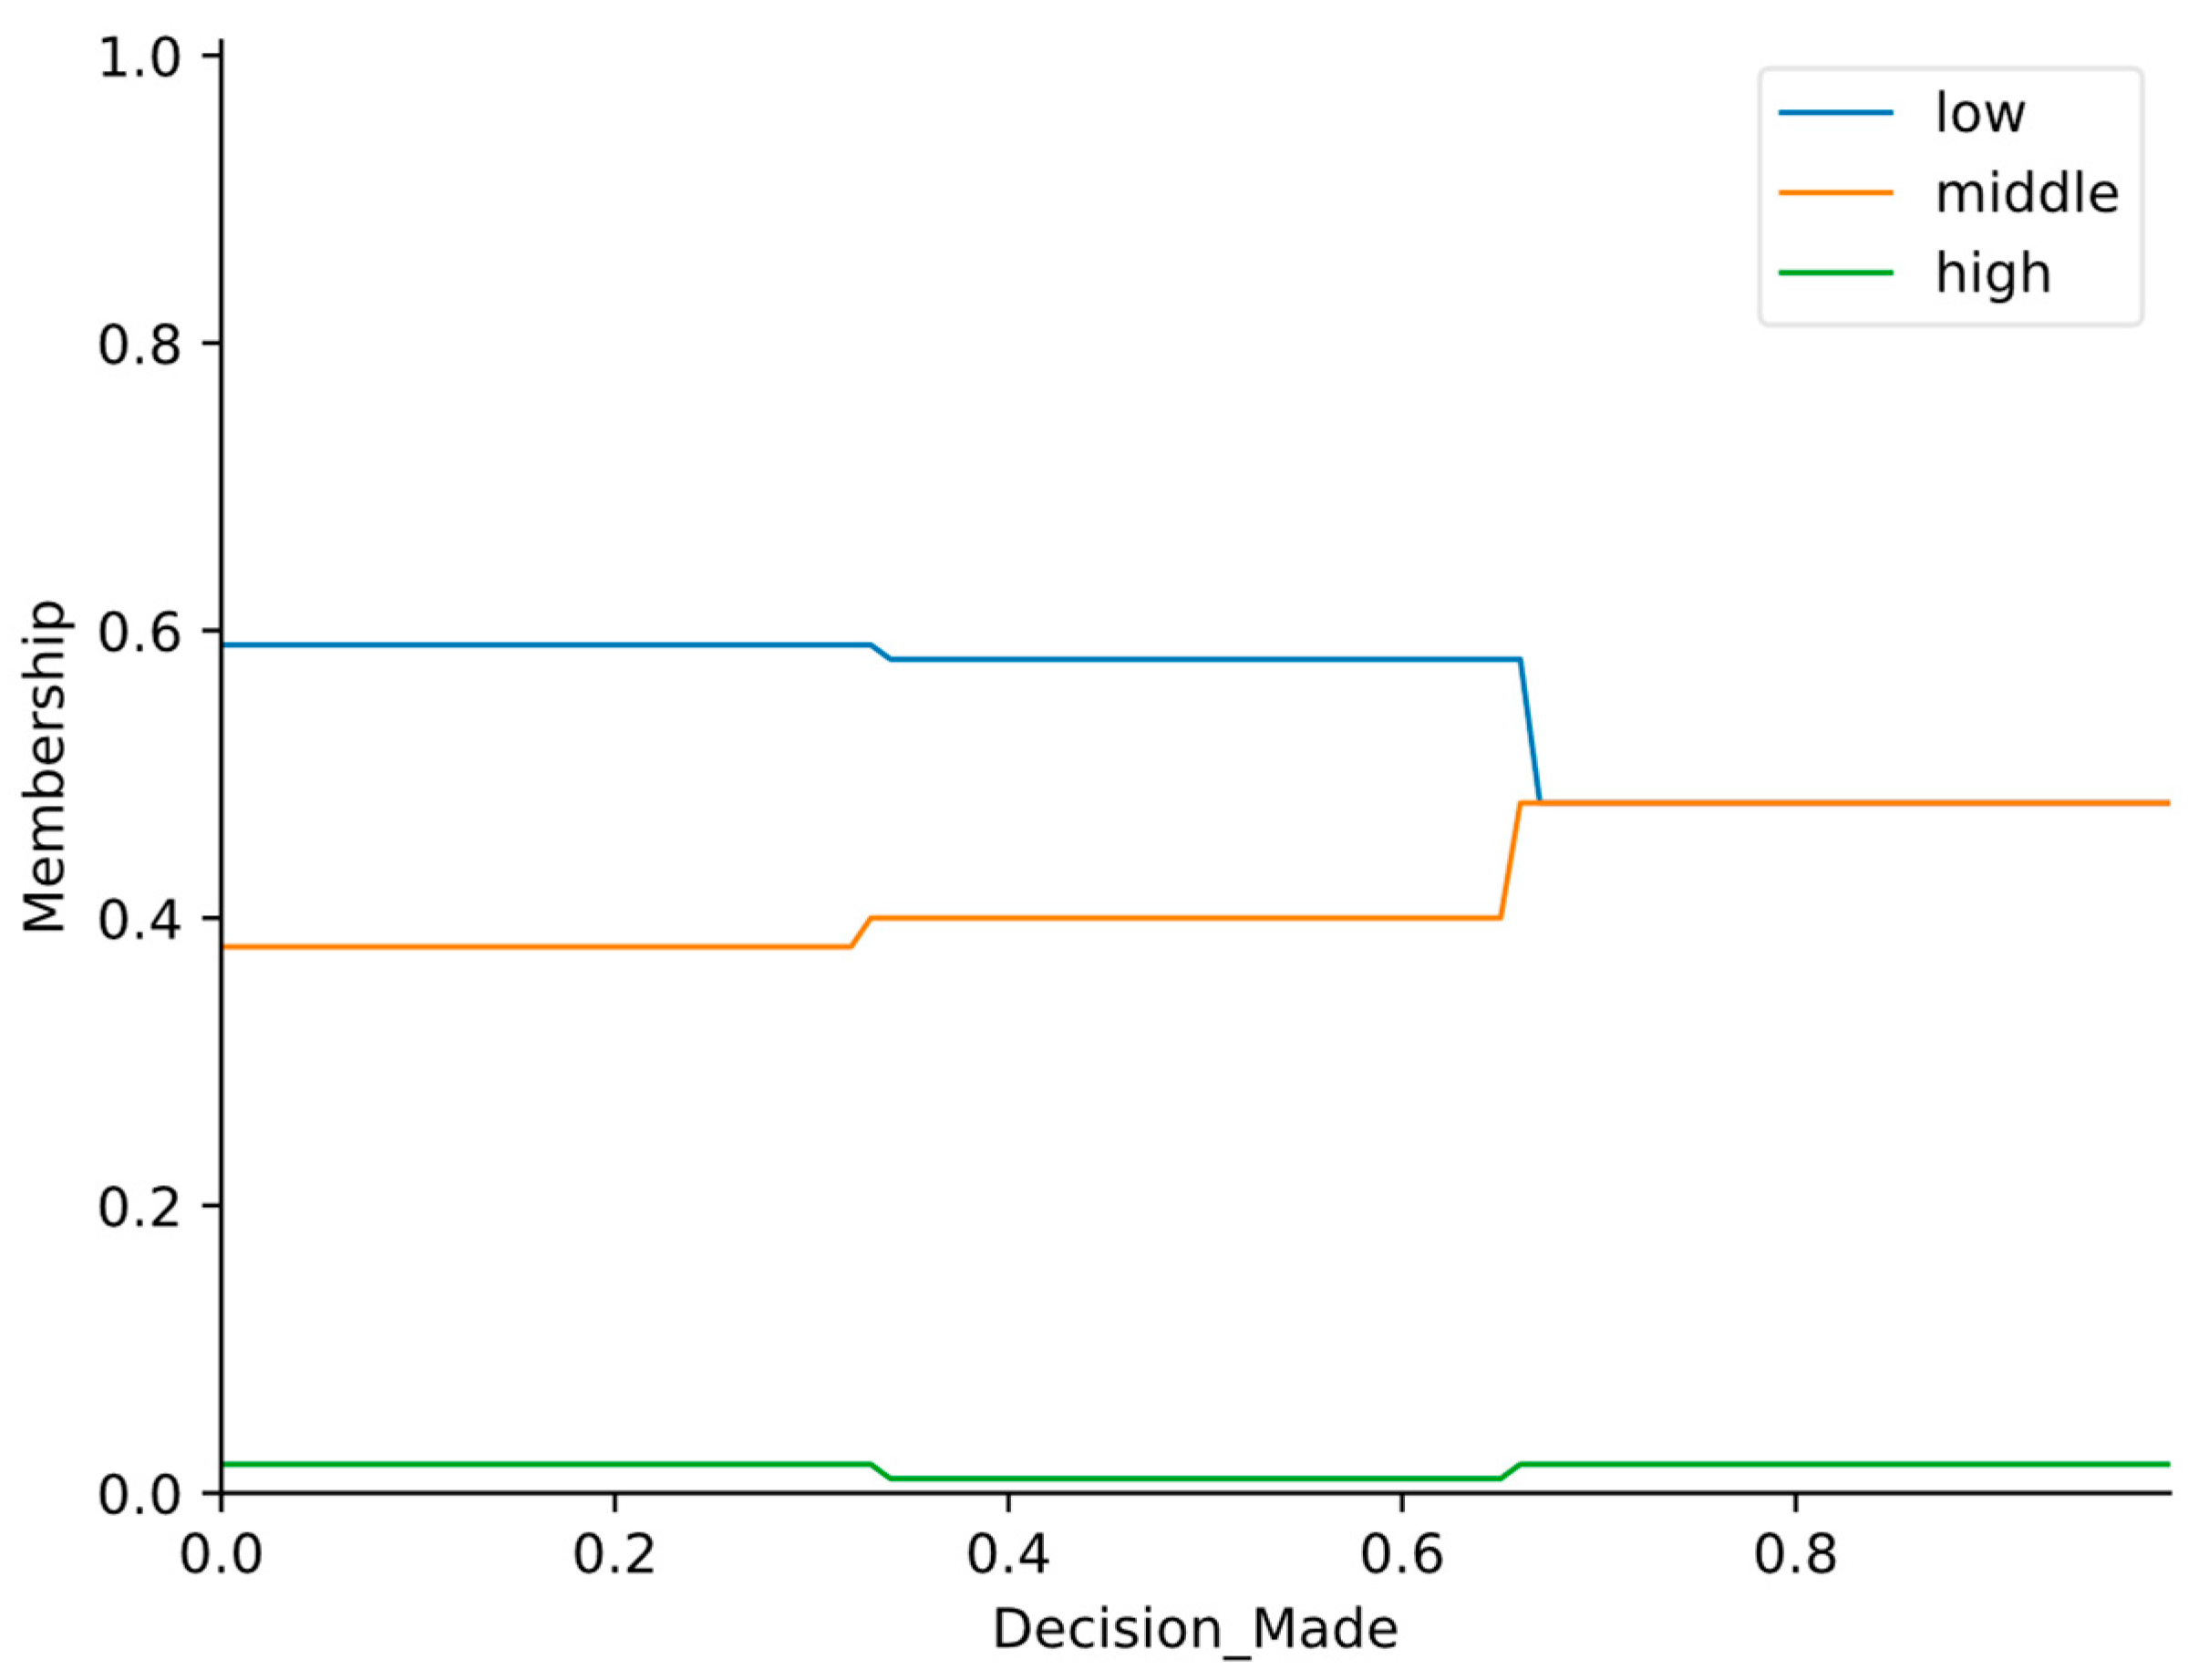
Our primary concern with SA is classifying it into three levels: ‘low’ (SA less than 0.3) indicating the driver’s inability to control the vehicle; ‘middle’ (SA between 0.3 and 0.6) suggesting the driver can take control but may need more time; and ‘high’ (SA over 0.6) where the driver is ready to take immediate control. Our goal is to categorize the driver’s SA into these groups effectively.
To establish meaningful categories from continuous or semi-continuous data, we use a function that divides the data into predefined or quantitatively determined segments. This division can be achieved through:
Equal-width binning: Dividing the range of an attribute into bins of equal size, such as segmenting ‘age’ into 21–30, 31–40, etc.
Quantile-based binning: Dividing the data into quantiles using the ‘pd.qcut‘ function, ensuring each bin contains roughly the same number of data points. This method is particularly useful for handling skewed distributions.
Once segmented, we analyze the distribution of the target variable ‘Y’ within these segments. We calculate the percentage of data falling into predefined categories (‘low’, ‘medium’, and ‘high’) based on the value of SA. This categorization helps identify how different segments influence the target outcome, informing the weighting factors in predictive modeling.
Consider a practical application of this method with the attribute ‘drivingFrequency’. The data is segmented into groups, and for each group, the proportions of ‘low’, ‘middle’, and ‘high’ SA values are calculated. These might be presented as follows:
Group 1 (Driving Frequency 0–1): ‘low’: 25%, ‘middle’: 50%, ‘high’: 25%
Group 2 (Driving Frequency 2–3): ‘low’: 20%, ‘middle’: 40%, ‘high’: 40%
These results are analyzed to identify patterns or trends, which are then synthesized into weighted factors indicating the relative importance of each driving frequency category on the target outcome. The distributions gained from this analysis are used to define weighted factors that could influence the modeling or predictive analytics part of the study. This approach is indicative of a fuzzy logic or machine learning application, where inputs are weighted according to their relevance and contribution to the outcome variable.
Finally, the distribution metrics are used to derive weight factors for each domain. These weight factors represent the influence or importance of each segment in predicting the outcome, such as assigning a greater weight to a particular age group that consistently shows a higher percentage in the ‘high’ category of SA. Insights from grouped data are further refined by sorting and categorizing into predefined domains, allowing for structured classification based on the data distribution.
As an illustration of a predictor after applying weight factors, the
decisionMade predictor is shown in
Figure 5.
4.3. Implementation Using ‘SciKit-Fuzzy’ Library
We utilized SciKit-Fuzzy (version 0.4.2), a fuzzy logic toolbox for Python. This package (also known as ‘skfuzzy’) provides a variety of useful tools for projects involving fuzzy logic. We implemented this approach using the ‘compute’ method of a ‘ControlSystemSimulation’ object from the ‘skfuzzy’ library. This method transforms inputs into fuzzy truth values, evaluates them against fuzzy logic rules, combines the results, and converts them back into crisp outputs. The ‘skfuzzy’ library is designed for fuzzy logic controllers, which rely on fuzzy set theory, fuzzy if–then rules, and fuzzy reasoning.
First, we created an instance of ‘ControlSystemSimulation’ with a specific ‘ControlSystem’ (e.g., ‘sub_system2’), which includes fuzzy rules, membership functions, and relationships between input and output variables. We assigned precise values to the input variables, which were then fuzzified using the ‘compute’ method.
The
fuzzification process uses membership functions (explained in
Section 4.2) to determine the truth values for each part of the fuzzy sets defined for the input variables. The system then evaluates the fuzzy rules, where each rule’s antecedent (if-part) is checked against the fuzzified inputs to determine its truth value using fuzzy logic operators. The consequent (then-part) uses these truth values to influence the output variables’ membership functions.
After evaluating all the rules, the aggregation process combines the fuzzy outputs from each rule into a single fuzzy set for each output variable using the maximum operator. Finally, the ‘compute’ method defuzzifies these sets into precise outputs using methods like the centroid method. This precise value is the final output used by the fuzzy control system for decision-making.
The centroid method computes the precise value as the center of gravity of the shape formed by the membership function of a fuzzy set. The formula for the centroid
C of a fuzzy set
A with a membership function
µA(
x) defined over a universe of discourse
X is given by:
Here,
x is a point in the universe of discourse, and
µA(
x) is the membership value at
x. The numerator of the fraction computes the weighted sum of all points, where the weights are the membership values. The denominator computes the area under the curve of the membership function, which normalizes the result. For discrete systems, the formula is approximated as:
where
xi are discrete points and
µA(
xi) are their corresponding membership values.
The computational complexity of the centroid method depends on several factors. In practical implementations, especially for computational purposes, the continuous membership functions are discretized. A finer discretization improves the accuracy of the centroid approximation but increases computational costs. Simple shapes with analytical forms can be integrated easily, whereas complex or piecewise functions require more computational effort. Each output variable with its own fuzzy output set requires separate defuzzification, multiplying the computational workload. The centroid method’s computational time is predominantly influenced by the number of calculations involved in both the numerator and the denominator. For each segment or point in the discretized output fuzzy set, a multiplication and a summation operation are required. Thus, the time complexity in a discrete setting can be estimated as O(n) where n is the number of points in the discretized domain.
4.4. Fuzzy Logic Groups of Predictor Variables
The study in [
1] identified 28 parameters, of which only 14 were found to significantly impact the outcomes. With these influential predictors as a foundation, we separated them into four groups:
Time-decision group—focuses on factors related to decision and timing;
Criticality group—assesses criticality factors;
Eye group—considers eye-related metrics;
Experience group—evaluates factors related to driver experience and age.
These 14 predictors, organized into their respective groups, are shown in
Table 3 including their corresponding units.
4.5. Fuzzy Modules for Each Group of Predictors
Individual modules, namely FuzzyDecision, FuzzyCriticality, FuzzyEye, and FuzzyExperience, are developed to assess related parameters using fuzzy logic. In the following text, each of those modules will be explained.
4.5.1. FuzzyDecision Module
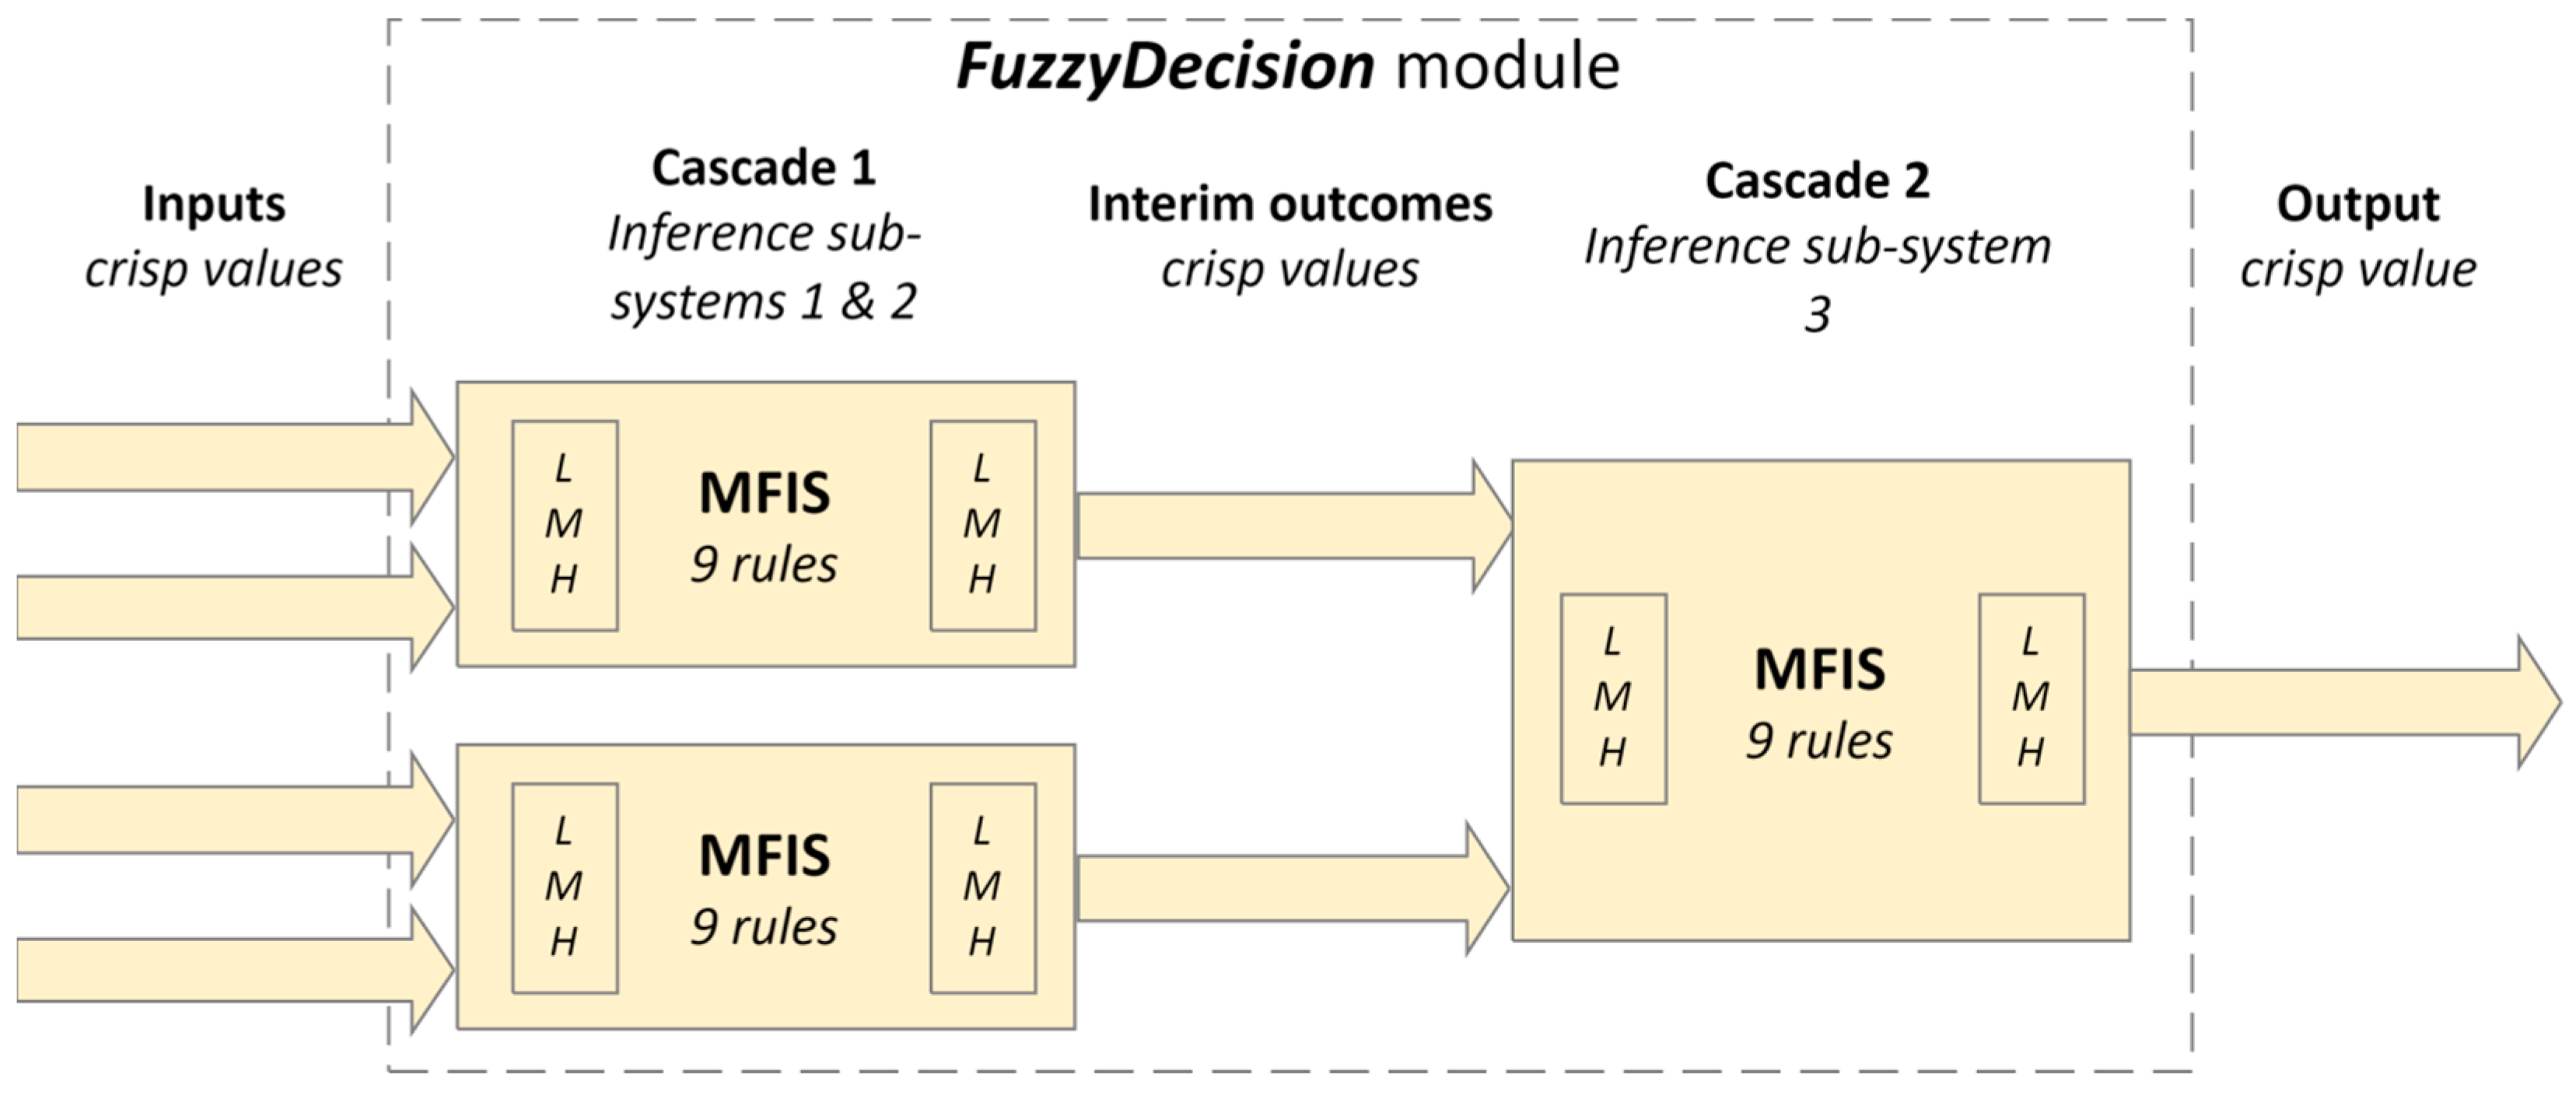
The
FuzzyDecison module (
Figure 6) consists of a cascade fuzzy inference system with four input predictors and their corresponding membership functions used in the fuzzification process:
videoLength: Assessed over a range from 0 to 22 min, divided into fuzzy sets labeled ‘low’, ‘middle’, and ‘high’. These sets are defined by trapezoidal membership functions which categorize the video length into intervals reflecting short, moderate, and long durations.
decisionTime: Ranges from 0 to 6 s and categorized into ‘short’, ‘moderate’, and ‘long’ also using trapezoidal membership functions to indicate quick, average, and slow-decision times.
correctDecision: Measured on a scale, categorized into ‘do nothing’, ‘evade’, and ‘brake’ where each category is defined to reflect the accuracy and appropriateness of the decisions made.
decisionMade: This involves the actual decision made by the driver or system, categorized similarly into ‘do nothing’, ‘evade’, and ‘brake’.
For example, a combination of ‘low’ video length and ‘long’ decision time led to a ‘low’ outcome, indicating a potentially rushed or uninformed decision. Conversely, a ‘brake’ correct decision and a ‘brake’ decision made result in a ‘high’ outcome, suggesting a well-informed and appropriately executed action.
In Cascade 1 of the FuzzyDecision module, the inputs are combined in two pairs—videoLength and decisionTime pair, and correctDecision and decisionMade pair.
Once each input is fuzzified, the rules are applied. There are nine rules for each input pair.
Table 4 shows the rules for combining fuzzified inputs, e.g., combining
videoLength and
decisionTime (as Parameter 1 and Parameter 2) and combining
correctDecision and
decisionMade.Those rules are used in fuzzy logic inference sub-systems 1 and 2 (
Figure 6) to process subsets of inputs and generate interim outcomes after the defuzzification process.
Each sub-system generates a crisp outcome:
crispDecisionSub1 and
crispDecisionSub2. In
Cascade 2, within inference sub-system three, each outcome undergoes fuzzification, followed by the application of nine rules. This results in a
fuzzifiedDecision, and after the defuzzification process, we obtain the final
crispDecision output from the
FuzzyDecision module. The rules are the same as those in
Table 4.
4.5.2. FuzzyCriticality Module
The FuzzyCriticality module is crucial for identifying situations that demand immediate driver intervention or automated responses, thereby contributing significantly to preventing accidents and improving road safety. This module leverages fuzzy logic to assess the severity of driving scenarios based on potential hazards, vehicle speed, and prevailing environmental conditions. This module not only enhances vehicle safety but also assists drivers in navigating complex driving environments, thereby reducing cognitive load and potential human errors.
This module consists of a fuzzy inference system with two input predictors (
Figure 7), categorized after the fuzzification process similarly into ‘
low’, ‘
middle’, and ‘
high’. The fuzzified inputs are combined to produce the
fuzzifiedCriticality value from which the final
crispCriticality value is derived after the defuzzification process.
There are nine rules for the fuzzified values for the
difficulty and
danger pair, which correspond exactly to those listed in
Table 4.
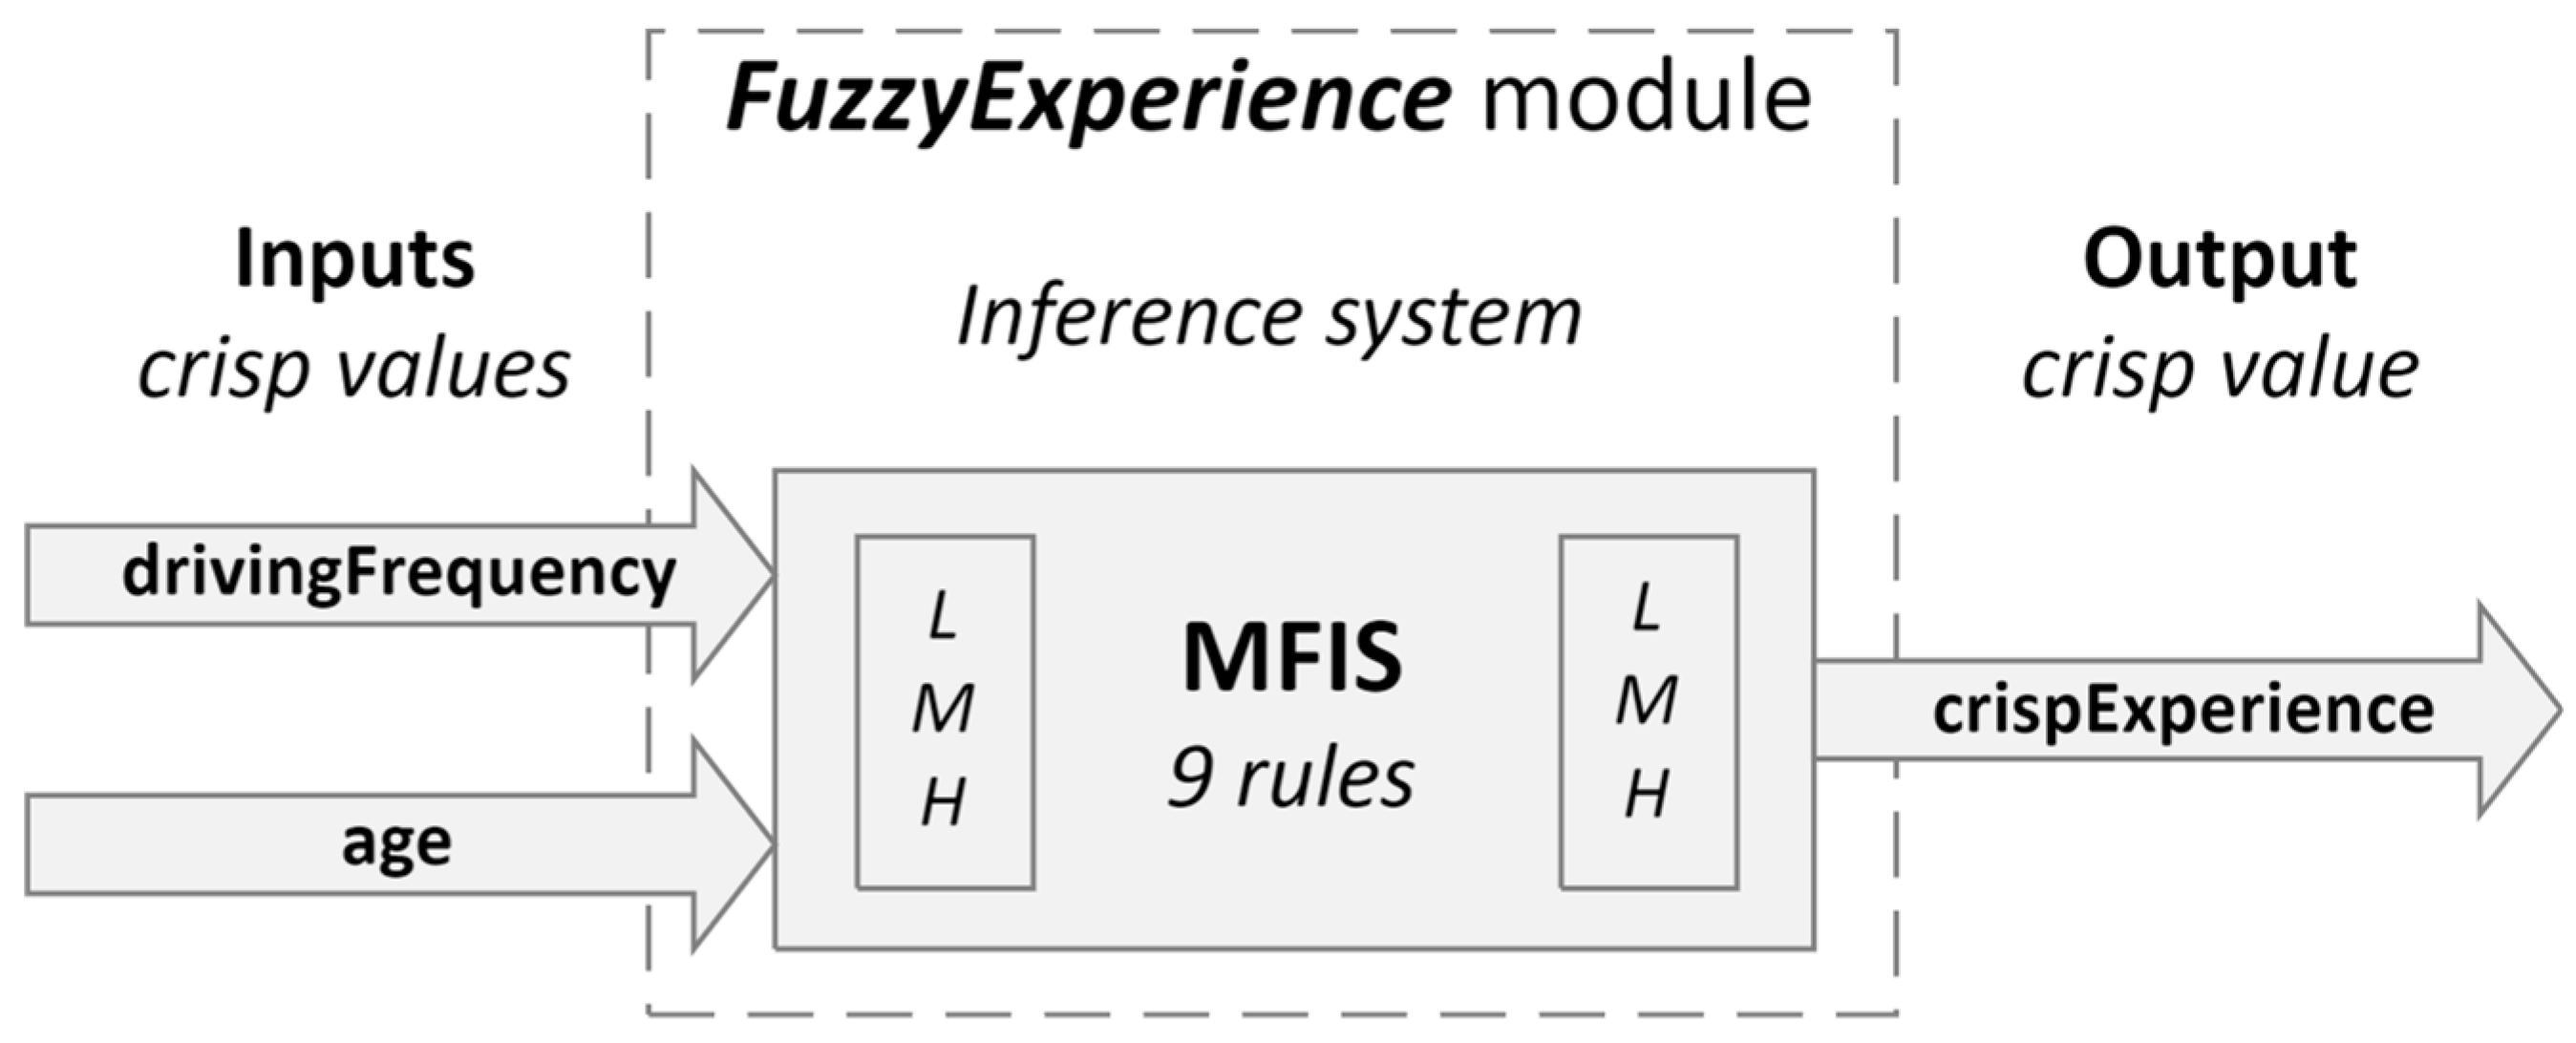
4.5.3. FuzzyExperience Module
The
FuzzyExperience module is integral in evaluating driver-specific parameters, such as driving frequency and experience, using fuzzy logic. This module is presented in
Figure 8.
The input variables and their corresponding membership functions for this module are:
drivingFrequency: Similar to experience, the driving frequency could be defined with terms such as ‘rare’, ‘occasional’, and ‘frequent’. These terms help evaluate how often the driver engages with various driving scenarios, which influences their reflexes and decision-making speed.
Age: This variable might be categorized so that each category has a corresponding fuzzy membership function defining the range of years associated with each level.
The system utilizes a set of rules to infer the driver’s overall capability based on the input variables. For example, if the driver is of ‘middle’ age and ‘frequent’ driving frequency, then the driver’s capability is ‘high’. If the driver is of ‘young’ age and ‘rare’ driving frequency, then the driver’s capability is categorized as ‘low’.
There are nine rules for the fuzzified values for the
drivingFrequency and
age pair, which align with those specified in
Table 4.
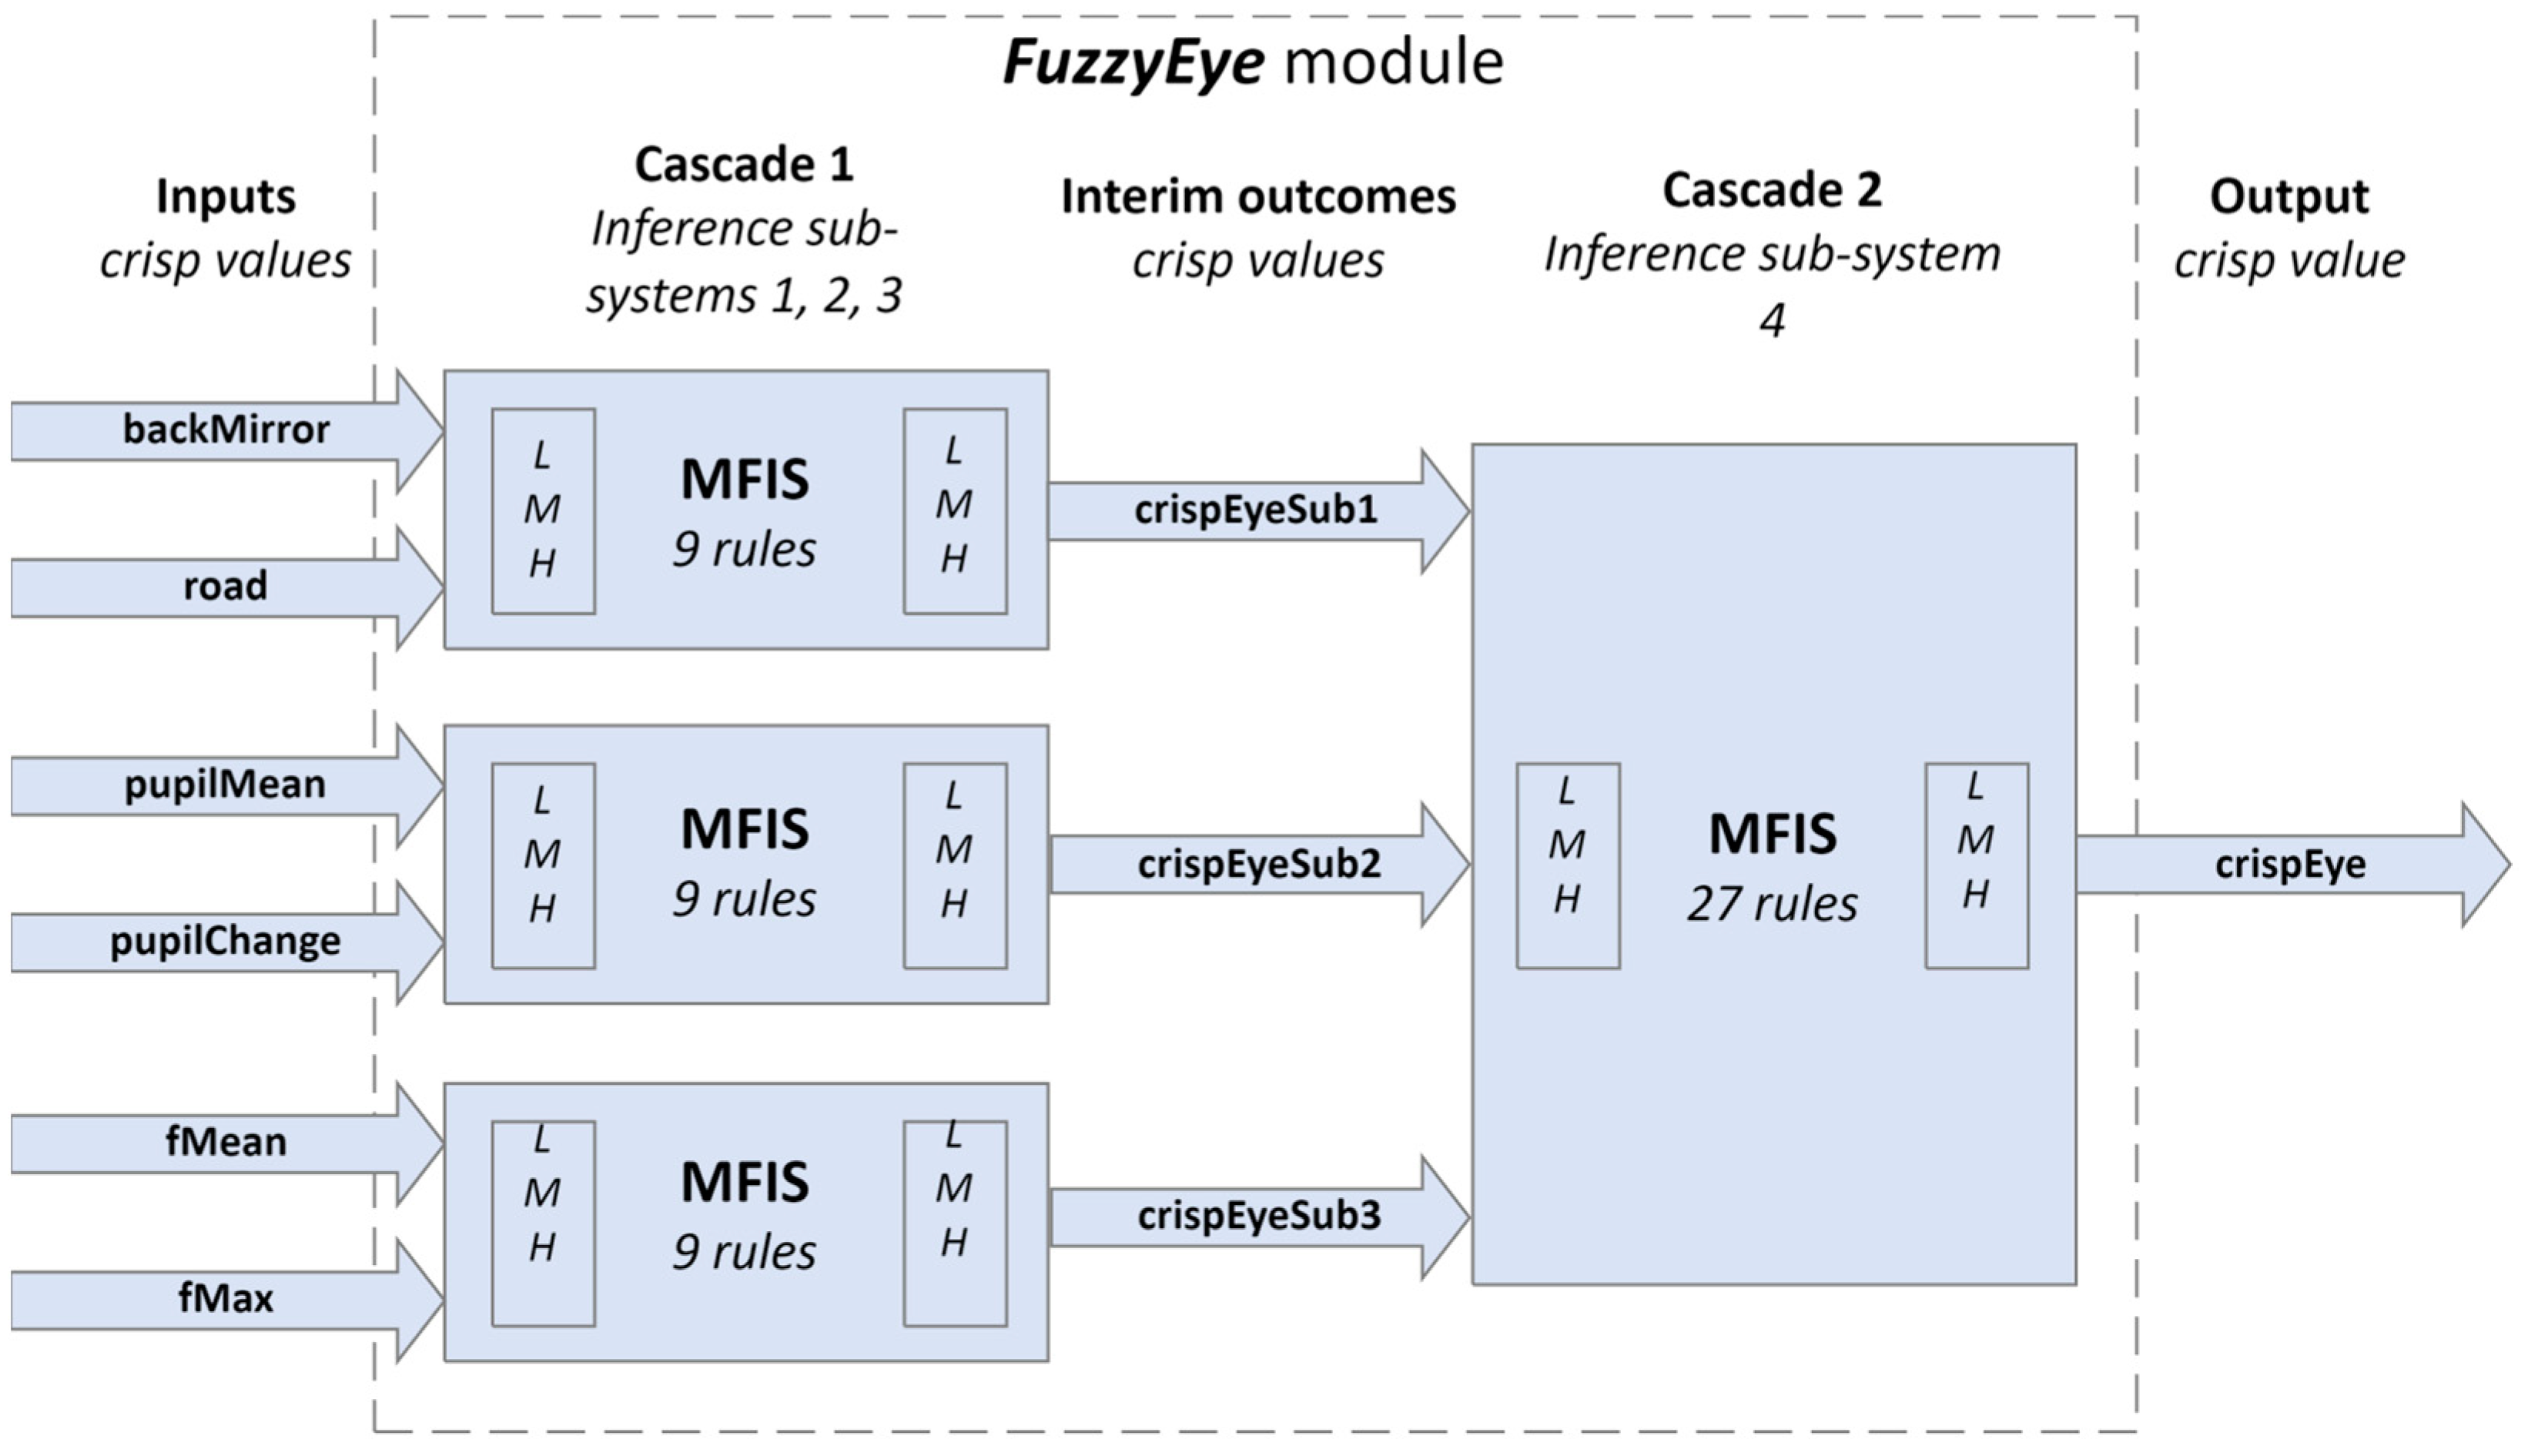
4.5.4. FuzzyEye Module
Pupil size variation is a physiological response that is closely linked to a person’s cognitive and emotional state. In the context of driving, changes in pupil size can indicate a driver’s level of alertness, cognitive load, or stress, making it a valuable metric for ADAS. We added
FuzzyEye module that utilizes fuzzy logic to interpret these variations and provide real-time assessments of a driver’s situational awareness (
Figure 9). This module utilizes fuzzy logic to assess various parameters such as back mirror usage, road awareness, pupil mean diameter, pupil change rate, fMean, and fMax. Each parameter is categorized into linguistic variables—’
low’, ‘
middle’ and ‘
high’, allowing for a nuanced interpretation of the driver’s current state.
There are three pairs of predictors:
backMirror and
road,
pupilMean and
pupilChange, as well as
fMax and
fMean. Rules for their combinations are given in
Table 4.
The module utilizes separate fuzzy logic controllers (sub-systems 1, 2, and 3) in
Cascade 1 to process subsets of inputs and generate interim outcomes. Each sub-system generates outcomes (
crispEyeSub1,
crispEyeSub2 and
crispEyeSub3). There are 27 rules for combining these fuzzified outcomes (
fuzzifiedEyeSub1,
fuzzifiedEyeSub2, and
fuzzifiedEyeSub3) to produce the
fuzzifiedEye value. This value is then defuzzified into the final
crispEye output through the fuzzy inference sub-system 4. The rules are shown in
Table 5.
4.6. Integration of Fuzzy Logic Modules
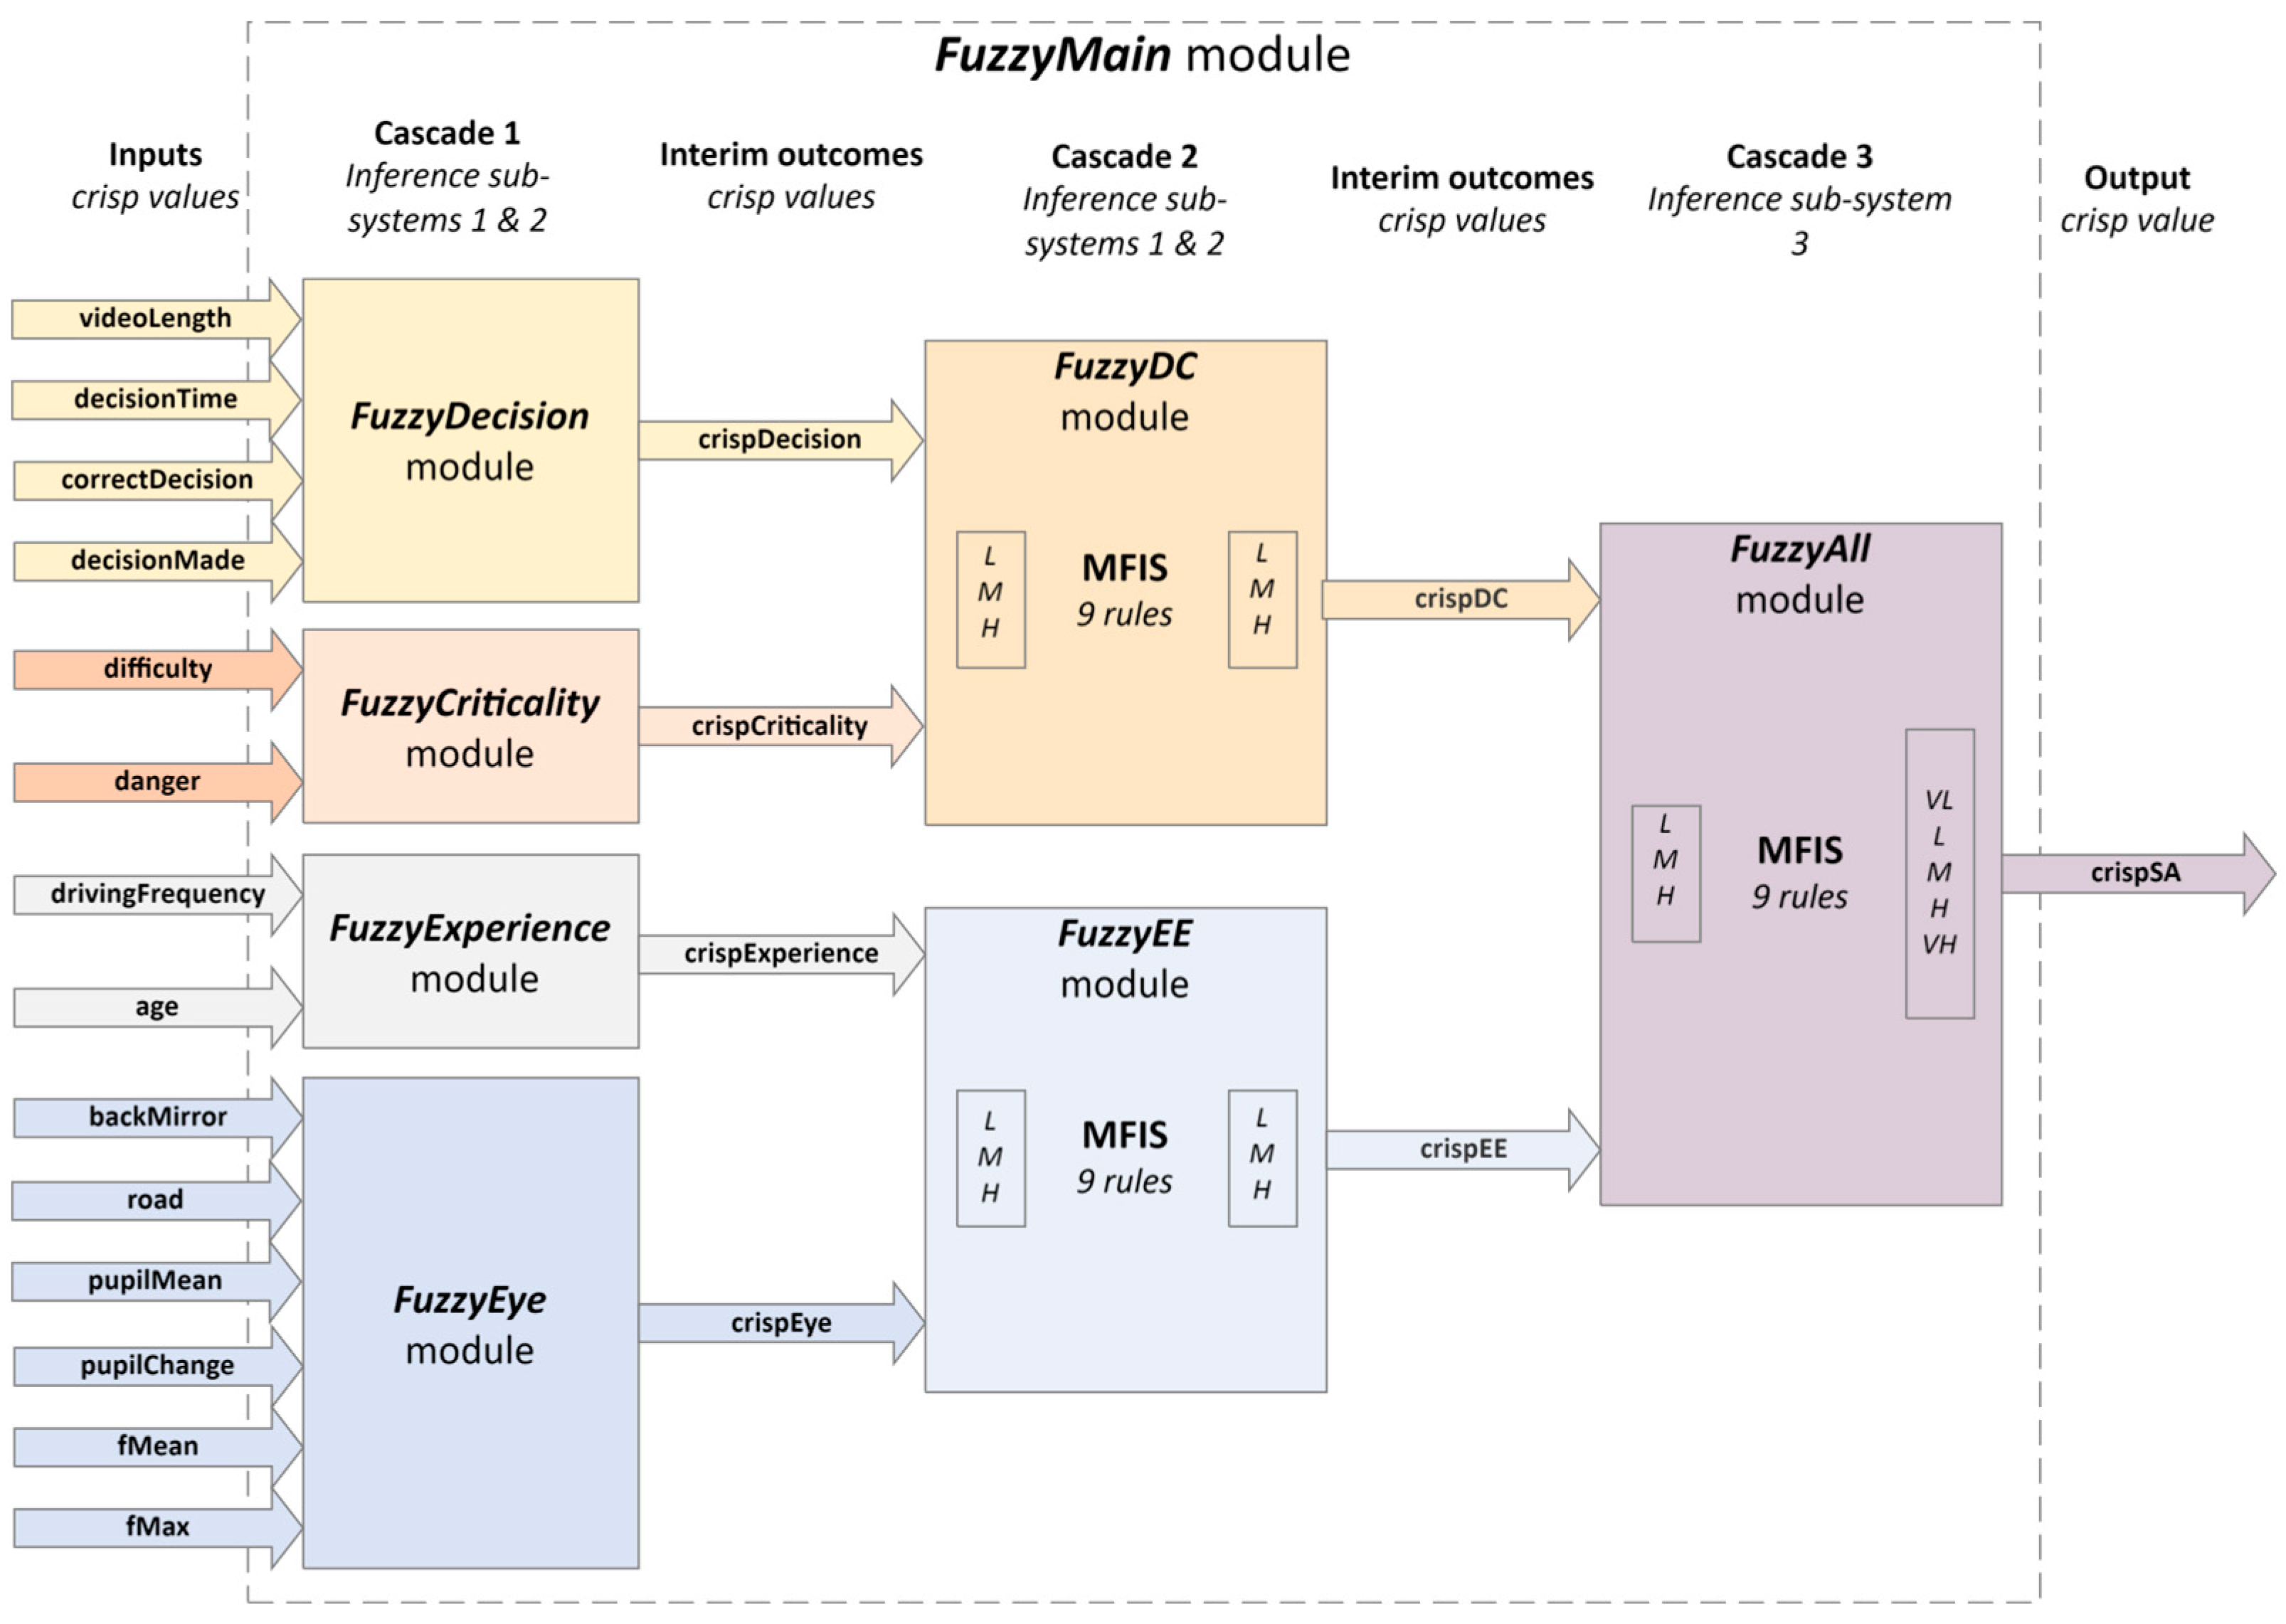
The integration of presented fuzzy logic modules forms a complex decision-making system, named
FuzzyMain (
Figure 10).
The outputs
crispDecision,
crispCriticallity,
crispExperience, and
crispEye from the modules
FuzzyDecision,
FuzzyCriticality,
FuzzyExperience, and
FuzzyEye, from
Cascade 1 of the
FuzzyMain component, are normalized values within a 0–1 range, representing the assessed state from low to high criticality or significance. These outputs are then fed as inputs to the next fuzzy logic decision modules
FuzzyDC and
FuzzyEE, forming
Cascade 2 of the
FuzzyMain component. Rules for combining fuzzified values of
crispDecision and
crispCriticallity pair, and
crispExperience and
crispEye pair, are identical to those specified in
Table 4.
For instance, a rule states that if both the crispEye and crispExperience variables are fuzzified as ‘low’, the outcome should also be ‘low’, indicating the minimal intervention needed. Conversely, if crispCriticality and the crispDecision variable are fuzzified as ‘high’, then the system outputs a ‘high’ intervention requirement, signaling the need for immediate and decisive action.
The defuzzified outcomes crispDC and crispEE from modules FuzzyDC and FuzzyEE are being propagated to the final decision module, FuzzyAll. This module is also the last cascade, named Cascade 3, from the FuzzyMain component.
There are 25 rules to combine fuzzified values of
crispDC and
crispEE (fuzzifiedDC and
fuzzifiedEE) to calculate the value named
fuzzifiedSA. The rules are shown in
Table 6.
Finally, through the defuzzification phase applied to the value fuzzifiedSA, the final crispSA is produced as the output from the FuzzyMain component, representing the predicted situational awareness.
This approach allows for nuanced processing and decision-making, ensuring that all relevant factors are considered. The system leverages fuzzy logic to analyze and synthesize data from multiple sources, aiming to produce optimal decisions under varied driving conditions.
By merging outputs from multiple fuzzy modules, this cascaded approach enhances the robustness and adaptability of ADAS. It allows for a more holistic assessment of both the driver’s state and environmental conditions, leading to safer and more efficient driving decisions.
5. Results
In this section, we present the experimental results of our proposed approach for enhancing situational awareness and decision-making using a cascade-type MFIS. We conducted experiments to evaluate the performance of our fuzzy logic model compared to the findings reported in [
1].
We applied 10-fold cross-validation as in [
1] using the same dataset [
24]. We assessed the performance of our approach using three widely adopted metrics: Root Mean Square Error (
RMSE), Mean Absolute Error (
MAE), and correlation coefficient (
Corr) between the predicted SA and the ground truth values, defined as follows:
where
N is the total number of the samples in the dataset,
yi is the
i-th value of SA samples,
is the
i-th predicted SA,
is the mean value of all the SA samples, and
′ is the mean value of all the predicted SA results.
We compared the results obtained for three different combinations of fuzzy sets in the input and output spaces. Let us name these three models as follows, specifying the corresponding number of fuzzy sets used for input fuzzification and the number of sets used for the defuzzification process in the final FuzzyAll module of the FuzzyMain component:
Fuzzy Logic 3–5: Three input and five output fuzzy sets (nine rules);
Fuzzy Logic 3–7: Three input and seven output fuzzy sets (nine rules);
Fuzzy Logic 5–7: Five input and seven output fuzzy sets (25 rules).
Table 6 shows the rules for combining fuzzified inputs
fuzzifiedDC and
fuzzifiedEE for the
Fuzzy Logic 3–5 combination, while
Table 7 and
Table 8 show the rules for the
Fuzzy Logic 3–7 case, respectively.
Table 9 shows the comparative performance for three different combinations of a number of inputs and outputs of the
FuzzyAll module.
Table 10 shows the comparative performance of the selected regression models from paper [
1] across the three performance measures (RMSE, MAE, and correlation coefficient). Paper [
1] found that LightGBM had the best performance, where LightGBM (all) included all the predictor variables and LightGBM (best) included only the top 14 predictor variables.
Our fuzzy logic model, with an RMSE of 0.126 and an MSE of 0.101, achieves performance comparable to the regression models discussed in the cited referenced work [
1]
The model was tested on a Windows 10 Pro 22H2 system with a PC running at 4 GHz, 16 GB of RAM, and an SSD. We measured the execution time of our algorithm, and the average execution time achieved is approximately 4 ms.
6. Discussion and Future Work
Our results indicate slightly higher RMSE and MAE compared to the referenced models. However, the metrics remain comparable to those achieved by machine learning methods.
With a loop time of 4 ms, our algorithm is efficient enough for real-world applications, making our model, or similar ones, suitable for being a replacement of ML models as part of larger systems.
ML models based on gradient methods, such as gradient boosting or neural networks, can achieve efficient prediction times but often require substantial computational resources during training due to iterative optimization processes. In contrast, fuzzy logic systems typically involve simpler computations, leading to comparable prediction times, though designing and fine-tuning the rules may require manual effort.
Our fuzzy logic model is characterized by its ease of understanding, ease of fine-tuning, and robustness. An even better performance could be achieved using a more optimal embedded platform and with further code optimization.
For future work, we plan to investigate the potential of integrating specific components of our fuzzy logic model into a larger hybrid system based on machine learning models. We also plan to experiment with different rules for sub-systems of features and explore various settings for defining the fuzzy logic system.
7. Conclusions
This study presents a fuzzy logic system for enhancing situational awareness (SA) and decision-making in automated driving scenarios. Our results demonstrate that the proposed model achieves performance comparable to advanced machine learning (ML) methods, offering several distinct advantages. Key innovative points and their implications are listed below.
Performance and Accuracy:
The fuzzy logic model, particularly the 3–5 configuration, achieves an RMSE of 0.126 and an MSE of 0.101, which are competitive with the best-performing ML models (e.g., LightGBM with an RMSE of 0.108).
This highlights the model’s ability to deliver accurate predictions of situational awareness, comparable to state-of-the-art machine learning techniques.
Efficiency and Real-World Applicability:
With an average execution time of approximately 4 ms, the fuzzy logic model is efficient enough for real-time applications, ensuring it can be integrated into practical automated driving systems without significant computational overhead.
The simplicity and speed of the fuzzy logic computations make it a viable alternative to more resource-intensive ML models, particularly in scenarios with limited data and computational resources.
Interpretability and Generalization:
Unlike many ML models, the fuzzy logic system offers enhanced interpretability, allowing for easier understanding and fine-tuning of the decision-making process.
The cascade-type fuzzy logic model demonstrates robustness against overfitting and resilience to data variations, ensuring reliable performance across different conditions.
Robustness and Data Efficiency:
Fuzzy logic systems are effective with smaller datasets, addressing a common limitation of many ML algorithms that require large amounts of training data.
This makes the fuzzy logic model particularly suitable for applications where data is scarce or expensive to obtain.
In summary, this research underscores the potential of fuzzy logic systems as a practical and efficient alternative to traditional machine learning approaches for SA prediction in automated driving. The proposed model matches the predictive accuracy of leading ML methods, offers real-time applicability, and brings additional benefits in terms of interpretability, and robustness. Future work will focus on integrating our fuzzy logic components into hybrid systems and exploring further optimizations to enhance performance.
Author Contributions
Conceptualization, G.F., D.S., I.T. and D.T.; methodology, G.F., D.S., I.T. and D.T.; software, G.F., D.S., I.T. and D.T.; validation, G.F., D.S., I.T. and D.T.; formal analysis, G.F., D.S., I.T. and D.T.; investigation, G.F., D.S., I.T. and D.T.; resources, G.F., D.S., I.T. and D.T.; data curation, G.F., D.S., I.T. and D.T.; writing—original draft preparation, G.F., D.S., I.T. and D.T.; writing—review and editing, G.F., D.S., I.T. and D.T.; visualization, G.F., D.S., I.T. and D.T.; supervision, G.F., D.S., I.T. and D.T.; project administration, G.F., D.S., I.T. and D.T.; funding acquisition, G.F., D.S., I.T. and D.T. All authors have read and agreed to the published version of the manuscript.
Funding
This work is supported by the EU Commission AWARE2ALL project, which has received funding from the Horizon Europe research and innovation programme under grant agreement No. 101076868.
Institutional Review Board Statement
Not applicable.
Informed Consent Statement
All participants provided written informed consent. The research was approved by the TU Delft Human Research Ethics Committee [
24].
Data Availability Statement
Conflicts of Interest
The authors declare that the research was conducted in the absence of any commercial or financial relationships that could be construed as a potential conflict of interest.
References
- Zhou, F.; Yang, X.J.; de Winter, J.C.F. Using Eye-Tracking Data to Predict Situation Awareness in Real Time During Takeover Transitions in Conditionally Automated Driving. IEEE Trans. Intell. Transp. Syst. 2022, 23, 2284–2295. [Google Scholar] [CrossRef]
- Gabbard, J.L.; Fitch, G.M.; Kim, H. Behind the Glass: Driver Challenges and Opportunities for AR Automotive Applications. Proc. IEEE 2014, 102, 124–136. [Google Scholar] [CrossRef]
- Sotelo, M.A. Electrical, Connected, and Automated Transportation. IEEE Intell. Transp. Syst. Mag. 2016, 8, 2. [Google Scholar]
- Longo, L.; Wickens, C.D.; Hancock, G.; Hancock, P.A. Human mental workload: A survey and a novel inclusive definition. Front. Psychol. 2022, 13, 883321. [Google Scholar] [CrossRef] [PubMed]
- Aygun, A.; Lyu, B.; Nguyen, T.; Haga, Z.; Aeron, S.; Scheutz, M. Cognitive Workload Assessment via Eye Gaze and EEG in an Interactive Multi-Modal Driving Task. In Proceedings of the 2022 International Conference on Multimodal Interaction, Bengaluru, India, 7–11 November 2022; pp. 337–348. [Google Scholar]
- Gomaa, A.; Alles, A.; Meiser, E.; Rupp, L.H.; Molz, M.; Reyes, G. What’s on your mind? A Mental and Perceptual Load Estimation Framework towards Adaptive In-vehicle Interaction while Driving. In Proceedings of the 14th International Conference on Automotive User Interfaces and Interactive Vehicular Applications, Seoul, Republic of Korea, 17–20 September 2022; pp. 215–225. [Google Scholar]
- Luo, R.; Weng, Y.; Jayakumar, P.; Brudnak, M.J.; Paul, V.; Desaraju, V.R.; Stein, J.L.; Ersal, T.; Yang, X.J. Real-Time Workload Estimation Using Eye Tracking: A Bayesian Inference Approach. Int. J. Hum. Comput. Interact. [CrossRef]
- Lyu, J.; Yuan, Z.; Chen, D. Long-term multi-granularity deep framework for driver drowsiness detection. arXiv 2018, arXiv:1801.02325. [Google Scholar]
- Odachowska, E.; Ucinska, M.; Kruszewski, M.; Gąsiorek, K. Psychological factors of the transfer of control in an automated vehicle. Open Eng. 2021, 11, 419–424. [Google Scholar] [CrossRef]
- Zontone, P.; Affanni, A.; Bernardini, R.; Piras, A.; Rinaldo, R. Stress Detection Through Electrodermal Activity (EDA) and Electrocardiogram (ECG) Analysis in Car Drivers. In Proceedings of the 2019 27th European Signal Processing Conference (EUSIPCO), Coruña, Spain, 2–6 September 2019; pp. 1–5. [Google Scholar]
- Kashevnik, A.; Shchedrin, R.; Kaiser, C.; Stocker, A. Driver Distraction Detection Methods: A Literature Review and Framework. IEEE Access 2021, 9, 60063–60076. [Google Scholar] [CrossRef]
- Morales-Alvarez, W.; Sipele, O.; Léberon, R.; Tadjine, H.H.; Olaverri-Monreal, C. Automated Driving: A Literature Review of the Take over Request in Conditional Automation. Electronics 2020, 9, 2087. [Google Scholar] [CrossRef]
- Sarabia, J.; Marcano, M.; Díaz, S.; Zubizarreta, A.; Pérez, J. Lateral Evasive Maneuver with Shared Control Algorithm: A Simulator Study. Sensors 2024, 24, 562. [Google Scholar] [CrossRef] [PubMed]
- D’aniello, G. Fuzzy logic for situation awareness: A systematic review. J. Ambient Intell. Humaniz. Comput. 2023, 14, 4419–4438. [Google Scholar] [CrossRef]
- Almadi, A.I.M.; Al Mamlook, R.E.; Almarhabi, Y.; Ullah, I.; Jamal, A.; Bandara, N. A Fuzzy-Logic Approach Based on Driver Decision-Making Behavior Modeling and Simulation. Sustainability 2022, 14, 8874. [Google Scholar] [CrossRef]
- Capallera, M.; Angelini, L.; Meteier, Q.; Abou Khaled, O.; Mugellini, E. Human-vehicle interaction to support driver’s situation awareness in automated vehicles: A systematic review. IEEE Trans. Intell. Veh. 2022, 8, 2551–2567. [Google Scholar] [CrossRef]
- Li, Y.; Sharma, A.; John, A.P.; Alabi, B.N.; Chen, S.; Labi, S. Development of Situational Awareness Enhancing System for Manual Takeover of AV; The Center for Connected and Automated Transportation, Purdue University: West Lafayette, IN, USA, 2023. [Google Scholar]
- Gao, X.; Wu, X.; Ho, S.; Misu, T.; Akash, K. Effects of Augmented-Reality-Based Assisting Interfaces on Drivers’ Object-wise Situational Awareness in Highly Autonomous Vehicles. In Proceedings of the 2022 IEEE Intelligent Vehicles Symposium (IV), Aachen, Germany, 4–9 June 2022; pp. 563–572. [Google Scholar]
- Schwindt, S.; Von Graevenitz, P.; Abendroth, B. Situational Awareness in the Context of Automated Driving–Adapting the Situational Awareness Global Assessment Technique. In Human Factors in Transportation, Proceedings of the AHFE International Conference on Physical Ergonomics and Human Factors, San Francisco, CA, USA, 20–24 July 2023; AHFE Open Access: Darmstadt, Germany, 2023; pp. 161–171. [Google Scholar]
- Petersen, L.; Robert, L.; Yang, X.J.; Tilbury, D.M. Situational awareness, drivers trust in automated driving systems and secondary task performance. arXiv 2019, arXiv:1903.05251. [Google Scholar]
- Zhang, R.; Cao, Z.; Yang, S.; Si, L.; Sun, H.; Xu, L.; Sun, F. Cognition-Driven Structural Prior for Instance-Dependent Label Transition Matrix Estimation. IEEE Trans. Neural Netw. Learn. Syst. 2024, 1–14. [Google Scholar] [CrossRef] [PubMed]
- Zhang, R.; Xu, L.; Yu, Z.; Shi, Y.; Mu, C.; Xu, M. Deep-IRTarget: An Automatic Target Detector in Infrared Imagery Using Dual-Domain Feature Extraction and Allocation. IEEE Trans. Multimed. 2021, 24, 1735–1749. [Google Scholar] [CrossRef]
- Zhang, R.; Tan, J.; Cao, Z.; Xu, L.; Liu, Y.; Si, L.; Sun, F. Part-Aware Correlation Networks for Few-shot Learning. IEEE Trans. Multimed. 2024, 1–13. [Google Scholar] [CrossRef]
- Lu, Z.; Happee, R.; de Winter, J.C. Take over! A video-clip study measuring attention, situation awareness, and decision-making in the face of an impending hazard. Transp. Res. Part F Traffic Psychol. Behav. 2020, 72, 211–225. [Google Scholar] [CrossRef]
- Baturone, I.; Barriga, A.; Jimenez-Fernandez, C.; Lopez, D.R.; Sanchez-Solano, S. Microelectronic Design of Fuzzy Logic-Based Systems, 1st ed.; CRC Press: Boca Raton, FL, USA, 2000. [Google Scholar]
Figure 1.
The driving environment. In this non-hazard video, in front of the ego-vehicle, one car is in the left lane and one car is in the right lane, and there are also two cars behind the ego-vehicle. In total, there are four surrounding cars with no cars in front of the ego-car in the same lane.
Figure 2.
Mamdani-type fuzzy inference system.
Figure 2.
Mamdani-type fuzzy inference system.
Figure 3.
Fuzzy inference engine.
Figure 3.
Fuzzy inference engine.
Figure 4.
Aggregation of rules using the graphical Mamdani-type inference method with crisp input values.
Figure 4.
Aggregation of rules using the graphical Mamdani-type inference method with crisp input values.
Figure 5.
The decisionMade predictor after applying weight factors.
Figure 5.
The decisionMade predictor after applying weight factors.
Figure 6.
Block diagram of the FuzzyDecision module.
Figure 6.
Block diagram of the FuzzyDecision module.
Figure 7.
Block diagram of the FuzzyCriticality module.
Figure 7.
Block diagram of the FuzzyCriticality module.
Figure 8.
Block diagram of the FuzzyExperience module.
Figure 8.
Block diagram of the FuzzyExperience module.
Figure 9.
Block diagram of the FuzzyEye module.
Figure 9.
Block diagram of the FuzzyEye module.
Figure 10.
Integration of fuzzy logic modules in the FuzzyMain component.
Figure 10.
Integration of fuzzy logic modules in the FuzzyMain component.
Table 2.
Predictor variables used in this paper.
Table 2.
Predictor variables used in this paper.
| Name | Description |
|---|
| Driving Frequency | Driving frequency in last 12 months (everyday driving = 1, 4–6 days/week = 2, 1–3 days/week = 3, 1 month to 1 week = 4, less than 1 month = 5, never = 6) |
| Age | Number of years of the participant |
| Years of driving | How long the participant has experience driving |
| Video length | The length of recorded video that represents the driving simulation (1 s, 3 s, 6 s, 9 s, 12 s, 20 s) |
| Correct decision | The right decision that should be made according to the situation in the driving simulation (no need to take over = 1, evade left = 2, evade right = 3, evade left or right = 4, brake only = 5) |
| Decision made | The decision that the participant made after watching the video (no decision = 0, no need to take over = 1, evade left = 2, evade right = 3, evade left or right = 4, brake only = 5) |
| Decision time | Time that participant took to decide |
| Difficulty | Likert scale on “The situation was dangerous” (from completely disagree = 0 to completely agree = 100) |
| Danger | Likert scale on “The rebuilding task was difficult” (from completely disagree = 0 to completely agree = 100) |
| Back mirror usage | This parameter reflects how frequently the driver checks the rear-view mirror, an indicator of awareness. The system categorizes this activity into three levels: low (none), middle (infrequent), and high (frequent) |
| Road awareness | It evaluates the driver’s attention to the road, crucial for safe driving. Observations range from low (minimal attention) to high (vigilant) |
| Pupil mean diameter | Changes in pupil size can indicate stress or fatigue. The system interprets these changes across a spectrum from constricted (low) to dilated (high) |
| Pupil change rate | This measures the speed of pupil dilation and constriction, which might signal sudden changes in attention or emotional state |
| F mean | Average fixation duration for each participant in one video |
| F max | Maximum value of fixation duration of the participant in one video |
Table 3.
Top 14 predictors categorized into four groups with corresponding units.
Table 3.
Top 14 predictors categorized into four groups with corresponding units.
| Group of Predictors | Predictor | Unit |
|---|
| Time-decision | videoLength | s |
| decisionTime | s |
| correctDecision | - |
| decisionMade | - |
| Criticality | difficulty | Likert scale |
| danger | Likert scale |
| Eye | backMirror | - |
| road | - |
| pupilMean | mm |
| fMean | m |
| pupilChange | mm |
| fMax | ms |
| Experience | drivingFrequency | - |
| age | year |
Table 4.
Rules for outputs of the first cascade of the fuzzy module system.
Table 4.
Rules for outputs of the first cascade of the fuzzy module system.
| AND | | Parameter 1 2 |
|---|
| L 1 | M | H |
|---|
| Parameter 2 | L | L | L | M |
| M | L | M | H |
| H | M | H | H |
Table 5.
Rules for fuzzified values of crispEyeSub1, crispEyeSub2, and crispEyeSub3 combination of inputs to calculate fuzzifiedEye.
Table 5.
Rules for fuzzified values of crispEyeSub1, crispEyeSub2, and crispEyeSub3 combination of inputs to calculate fuzzifiedEye.
| Rule | fuzzifiedEyeSub1 | fuzzifiedEyeSub2 | fuzzifiedEyeSub3 | fuzzifiedEye |
|---|
001
002
003 | L | L | L | VL 1 |
| M | L | L | VL |
| H | L | L | L |
004
005
006 | L | M | L | VL |
| M | M | L | L |
| H | M | L | M |
007
008
009 | L | H | L | L |
| M | H | L | M |
| H | H | L | M |
010
011
012 | L | L | M | VL |
| M | L | M | L |
| H | L | M | M |
013
014
015 | L | M | M | L |
| M | M | M | M |
| H | M | M | M |
016
017
018 | L | H | M | M |
| M | H | M | M |
| H | H | M | H |
019
020
021 | L | L | L | L |
| M | L | M | M |
| H | L | H | M |
022
023
024 | L | M | H | M |
| M | M | H | M |
| H | M | H | H |
025
026
027 | L | H | H | M |
| M | H | H | H |
| H | H | H | VH |
Table 6.
Rules for fuzzifiedDC and fuzzifiedEE combination of inputs to produce fuzzifiedSA.
Table 6.
Rules for fuzzifiedDC and fuzzifiedEE combination of inputs to produce fuzzifiedSA.
| AND | | fuzzifiedDC |
|---|
| L 1 | M | H |
|---|
| fuzzifiedEE | L | VL | L | M |
| M | L | M | H |
| H | M | H | VH |
Table 7.
Rules for outputs of the last module FuzzyAll of the FuzzyMain component (Fuzzy Logic 3–7 models).
Table 7.
Rules for outputs of the last module FuzzyAll of the FuzzyMain component (Fuzzy Logic 3–7 models).
| AND | | fuzzifiedDC |
|---|
| L | M | H |
|---|
| fuzzifiedEE | L | VVL 1 | L | M |
| M | L | M | H |
| H | M | H | VVH |
Table 8.
Rules for outputs of the last module FuzzyAll of the FuzzyMain component (Fuzzy Logic 5–7 model).
Table 8.
Rules for outputs of the last module FuzzyAll of the FuzzyMain component (Fuzzy Logic 5–7 model).
| AND | | | fuzzifiedDC | |
|---|
| VL | L | M | H | VH |
|---|
| fuzzifiedEE | VL | VVL 1 | VL | L | L | M |
| L | VL | L | L | M | M |
| M | L | L | M | M | H |
| H | L | M | M | H | VH |
| VH | M | M | H | VH | VVH |
Table 9.
Performance of three fuzzy logic models (Fuzzy Logic 3–5, Fuzzy Logic 3–7, and Fuzzy Logic 5–7).
Table 9.
Performance of three fuzzy logic models (Fuzzy Logic 3–5, Fuzzy Logic 3–7, and Fuzzy Logic 5–7).
| Model | RMSE | MSE | Corr |
|---|
| Fuzzy Logic 3–5 | 0.126 | 0.101 | 0.690 |
| Fuzzy Logic 3–7 | 0.137 | 0.113 | 0.700 |
| Fuzzy Logic 5–7 | 0.135 | 0.111 | 0.690 |
Table 10.
Performance of the selected machine learning models and Fuzzy Logic 3–5 model used in this paper.
Table 10.
Performance of the selected machine learning models and Fuzzy Logic 3–5 model used in this paper.
| Model 1 | RMSE | MSE | Corr |
|---|
| Fuzzy Logic 3–5 (best) | 0.126 | 0.101 | 0.690 |
| Medium Tree | 0.124 | 0.098 | 0.412 |
| Linear SVM | 0.122 | 0.097 | 0.436 |
| Linear Regression | 0.121 | 0.097 | 0.447 |
| Quadratic SVM | 0.121 | 0.094 | 0.458 |
| Gaussian SVM | 0.115 | 0.089 | 0.529 |
| Random Forest | 0.111 | 0.088 | 0.566 |
| XGBoost | 0.110 | 0.087 | 0.788 |
| LightGBM (all) | 0.109 | 0.086 | 0.796 |
| LightGBM (best) | 0.108 | 0.085 | 0.801 |
| Disclaimer/Publisher’s Note: The statements, opinions and data contained in all publications are solely those of the individual author(s) and contributor(s) and not of MDPI and/or the editor(s). MDPI and/or the editor(s) disclaim responsibility for any injury to people or property resulting from any ideas, methods, instructions or products referred to in the content. |
© 2024 by the authors. Licensee MDPI, Basel, Switzerland. This article is an open access article distributed under the terms and conditions of the Creative Commons Attribution (CC BY) license (https://creativecommons.org/licenses/by/4.0/).


