1. Introduction
Optical materials with a spinel-type structure have attracted researcher’s interest in the past ten years due to the possibility of using
-doped samples for an interesting application of bioimaging. Since the first report on an application of a zinc gallate spinel for bioimaging by Maldiney et.al. [
1], several other hosts from the same (or similar) spinel family have been explored extensively. The research in this direction was extended from imaging probes sensitive in the near infrared (NIR) region around 700 nm (also known as the first biological window) to higher second and/or third biological windows lying deep in the wavelength domain. The important point in all these investigations was to synthesize hosts with crystal fields that can affect the Cr ions (present as dopants) in such a way that there is a shift in the emission maximum from the NIR to a higher wavelength region. This strategy was reported for a magnesium gallate host where the Cr emission shifted to 712 nm as compared to 693 nm for a zinc gallate host [
2]. The technological key point of spinels that makes them suitable for such an application is the presence of antisite defects in the host lattice. Antisite defects make it possible for the dopant ion to sit at a distorted site as compared to the actual site where the ion is expected to be present in the host lattice.
Spinels can be categorized as normal spinels, which have the general formula of
, and an inverse spinels, which have a general formula,
B(AB)O
4. Another class of spinels is complex spinels, which have a mixture of normal and inverse spinels. In recent reports, spinels have also found technological importance as suitable materials for magnetic [
3], high-temperature ceramics [
4], as superhard materials [
5], and as materials suitable for high pressure sensing applications [
6]. The common synthesis procedure of spinel-type materials is a solid-state method. The materials in this procedure are synthesized at high temperatures under a reductive or inert atmosphere. Such an environment is required to keep the host and dopant in the desired valence state, for example, +3 for Cr. From the literature, one can also observe that most of the researchers’ work on normal spinel-type materials, while very little, is published on inverse spinels, probably due to complex synthesis conditions. Another important observation is the recent developments of researchers on UV-emitting persistent luminescent (PersL) materials. UV-emitting PersL materials have found application in anticounterfeiting, photocatalysis, photodynamic therapy, and others, as discussed in a recent review article [
7]. The UV region can be sub-categorized as UV-A, UV-B, and UV-C regions, and some smart techniques are required to prepare such materials.
Based on these two aspects, in the present work, we investigated the influence of synthesis conditions, annealing temperature and ZnO concentration in zinc orthotitanate (Zn
2TiO
4). Zn
2TiO
4 is an inverse spinel that exhibits interesting dielectric and optical properties, making it potentially useful in electronics, photonics, and optoelectronics [
8,
9,
10,
11]. A Zn
2TiO
4 application for photocatalysis involves light to drive chemical reactions, which can be used for environmental remediation and water purification [
11]. It has a band gap of 3.30 eV (375 nm) with a prominent photoluminescence (PL) emission in the wavelength region of 470–800 nm [
12]. The 375 nm band also corresponds to ZnO-related host band gap. Hence, based on this overview and these objectives, we prepared twelve samples using the solid-state synthesis method, modulating the ZnO concentration with the objective to alter the ZnO-related absorption band at 375 nm or to modify the Zn
2TiO
4 band gap. During the initial annealing of samples between temperatures of 700 and 1000 °C, we observed that for the sample annealed at 800 °C with a ZnO:TiO
2 concentration of 2.00:1.00, Zn
2TiO
4-related diffraction peaks could be obtained. We modulated the ZnO concentration first with a decrease in small steps of 0.02 to 0.06 mol in comparison to the TiO
2 ratio, and later, in comparably larger steps of 0.20 to 1.00 mol, to optimize the absorption band related to ZnO. The UV-Visible diffuse reflectance spectra were obtained for all the samples to understand the variation in the band gap of all the samples. The results indicate a clear deviation in band gap from 3.30 eV to 4.40 eV for a sample with ZnO:TiO
2 concentration of 1.40:1.00. Photoluminescence and luminescence decay studies were performed on a phase-pure sample to determine the recombination process and lifetime of charges in their excited state. The optimized sample showed PersL in the wavelength region of 300–390 nm with a decay time of at least 10 min.
3. Results
The present work represents a systematic approach to modulate the ZnO concentration in Zn2TiO4 with the objective of changing the band gap of the matrix.
3.1. Effect of Annealing Temperature
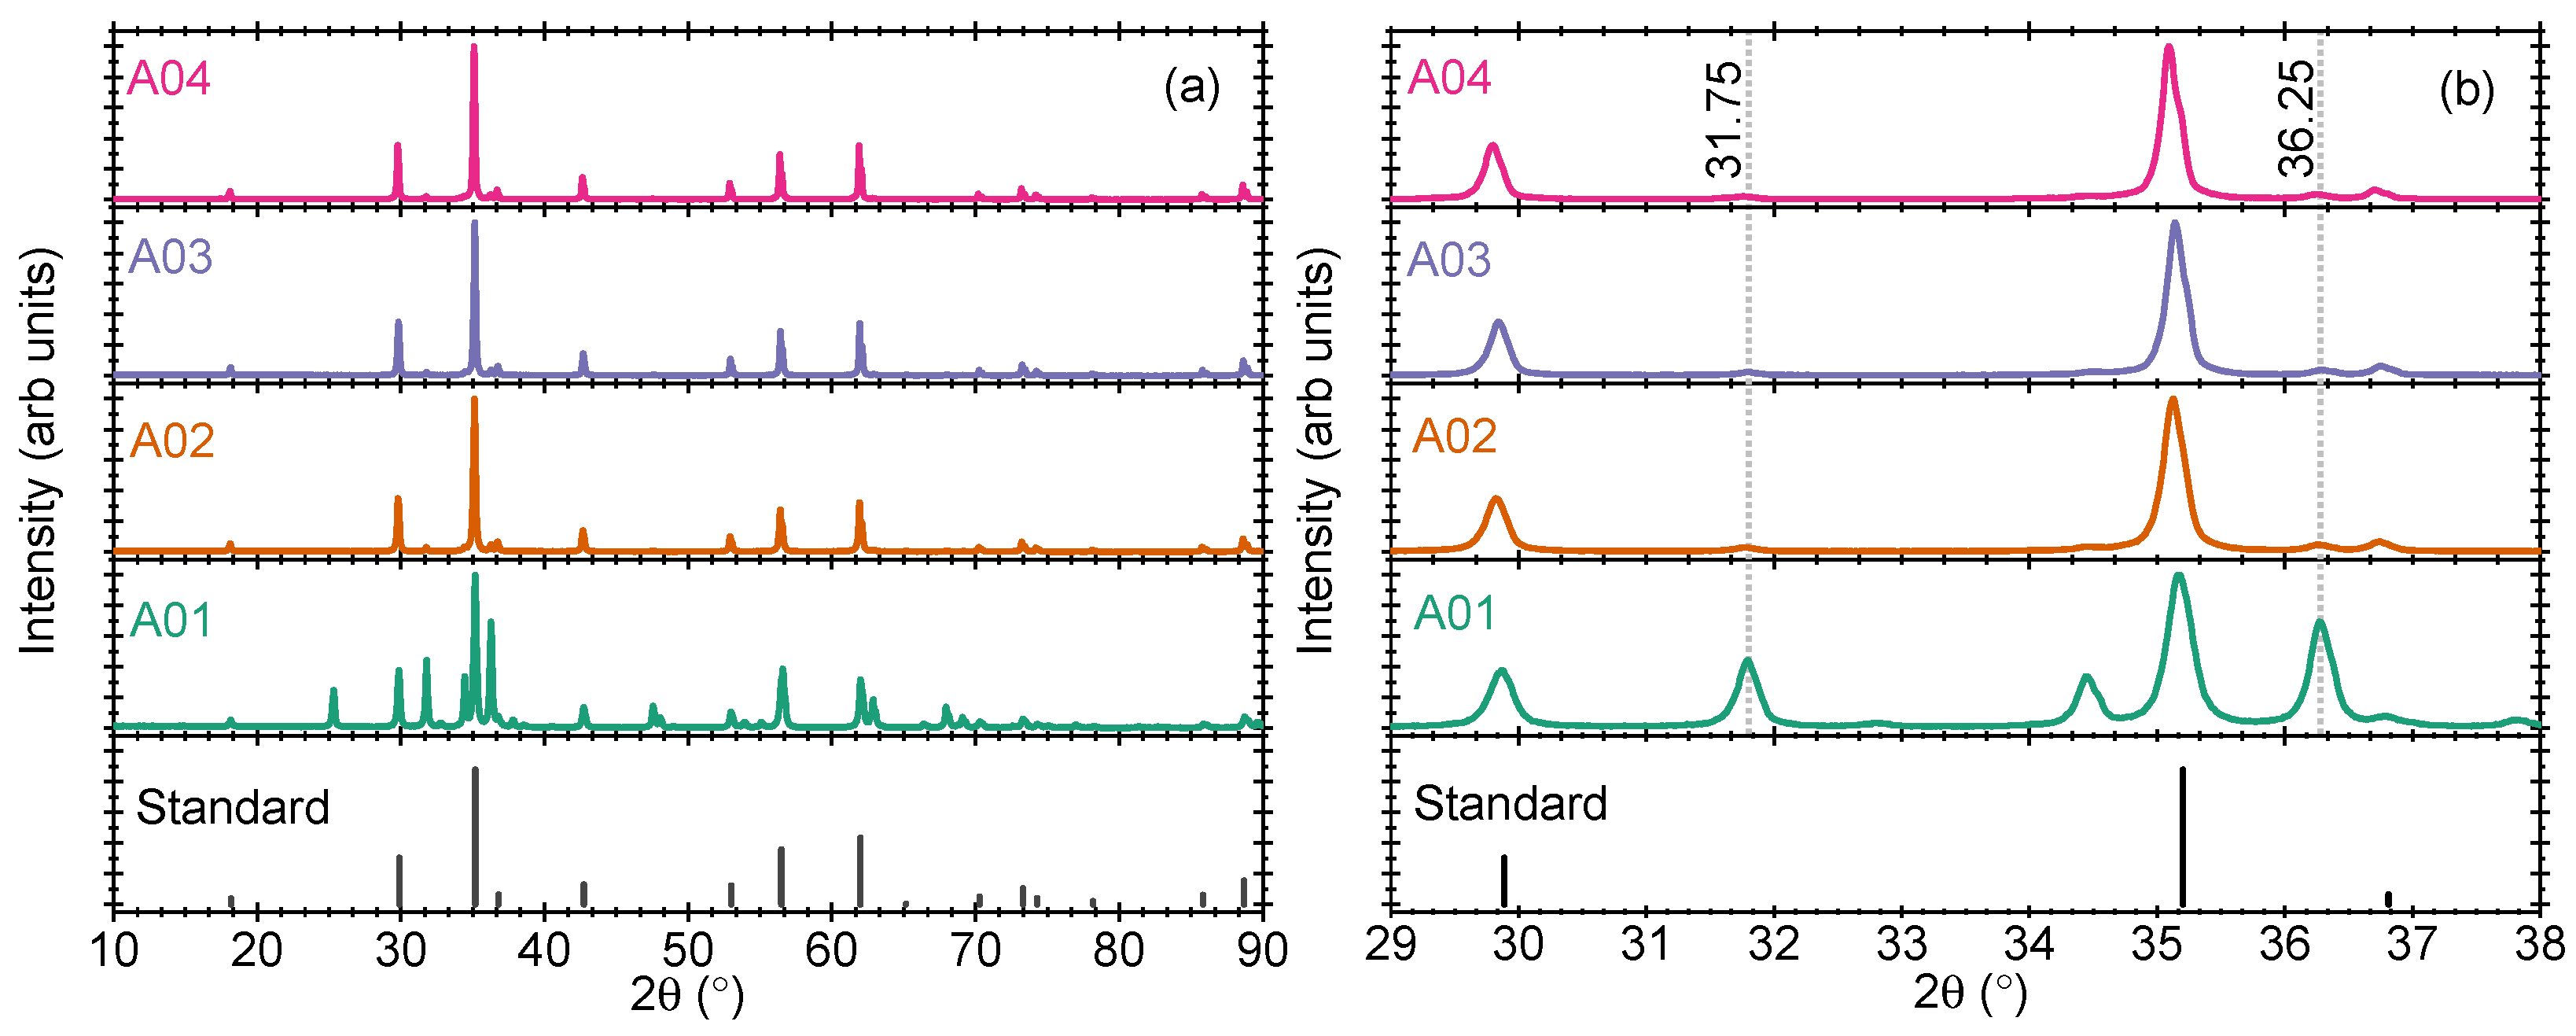
Four samples were prepared by annealing the stoichiometric amount of ZnO and TiO
2 in a ratio of 2.00:1.00 at different temperatures between 700 and 1000 °C (100 °C each). The pXRD pattern of the four samples is shown in
Figure 1a,b. The standard powder diffraction pattern from the Crystallographic Open Database (COD) with file no. 1544562 is also shown for comparison (marked standard). When the sample is calcined at 700 °C (Sample A01), several reflections are obtained which cannot be assigned to Zn
2TiO
4 alone and can thus be considered as a mix of several intermediate crystalline phases [cf.
Figure 1b]. However, when the samples are calcined at 800 °C or at higher temperatures up to 1000 °C (samples A02 to A04), the prominent reflections match closely with the standard file, cf.
Figure 1a,b. A very small amount of unreacted ZnO in the host lattice is also observed, as marked at 31.75 and 36.25 2
values in
Figure 1b. However, the prominent crystallographic lines correspond to ZnZn
2TiO
4 only.
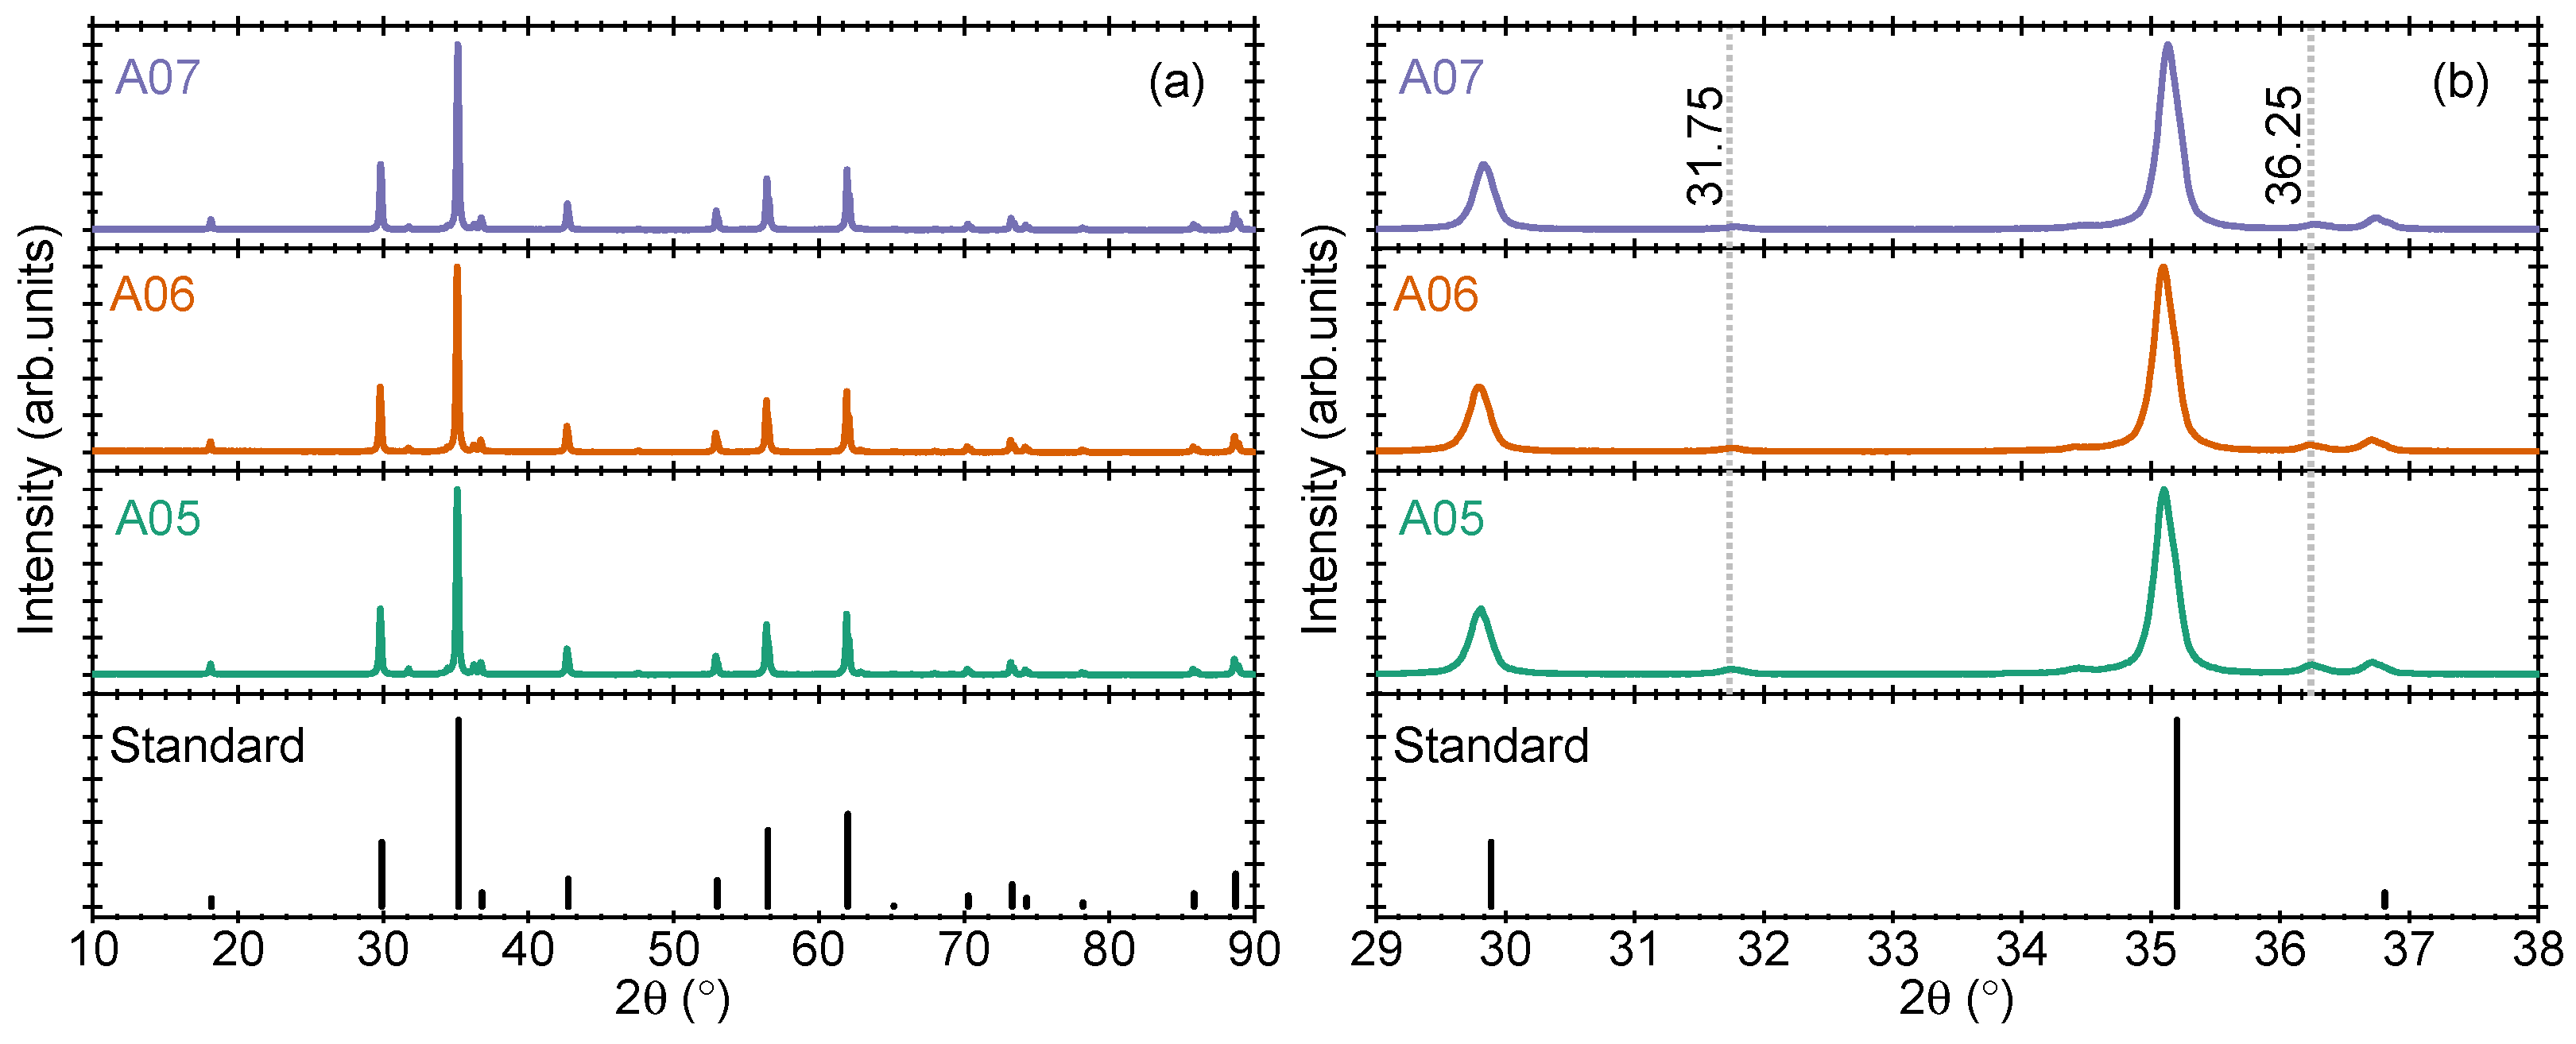
3.2. Change of ZnO Concentration from 2.00:1.00 1.94:1.00
As a first step to modulate the band gap of Zn
2TiO
4, we optimize the ZnO concentration in small steps to 1.98:1.00 (sample A05), 1.96:1.00 (sample A06), and 1.94:1.00 (sample A07). The pXRD results of the three samples are shown in
Figure 2a,b. The reason for this choice is the already reported impact of such modification on the crystallinity of the samples and the improvement of the persistent luminescence properties of doped ZnGa
2O
4 samples [
1,
2]. Looking at the results in
Figure 2a, the positions of the prominent diffraction peaks remain the same in all samples, suggesting that the prominent crystal structure is not distorted upon a small change in the ZnO concentration. However, a decrease in the reflection intensity of unreacted ZnO-related peaks is clearly noticed. A reflection at 31.75 2
values is shown in
Figure 2b for better visualization of this inference. The effect of such modification on the UV-Vis absorption bands (or band gap) is discussed in later sections.
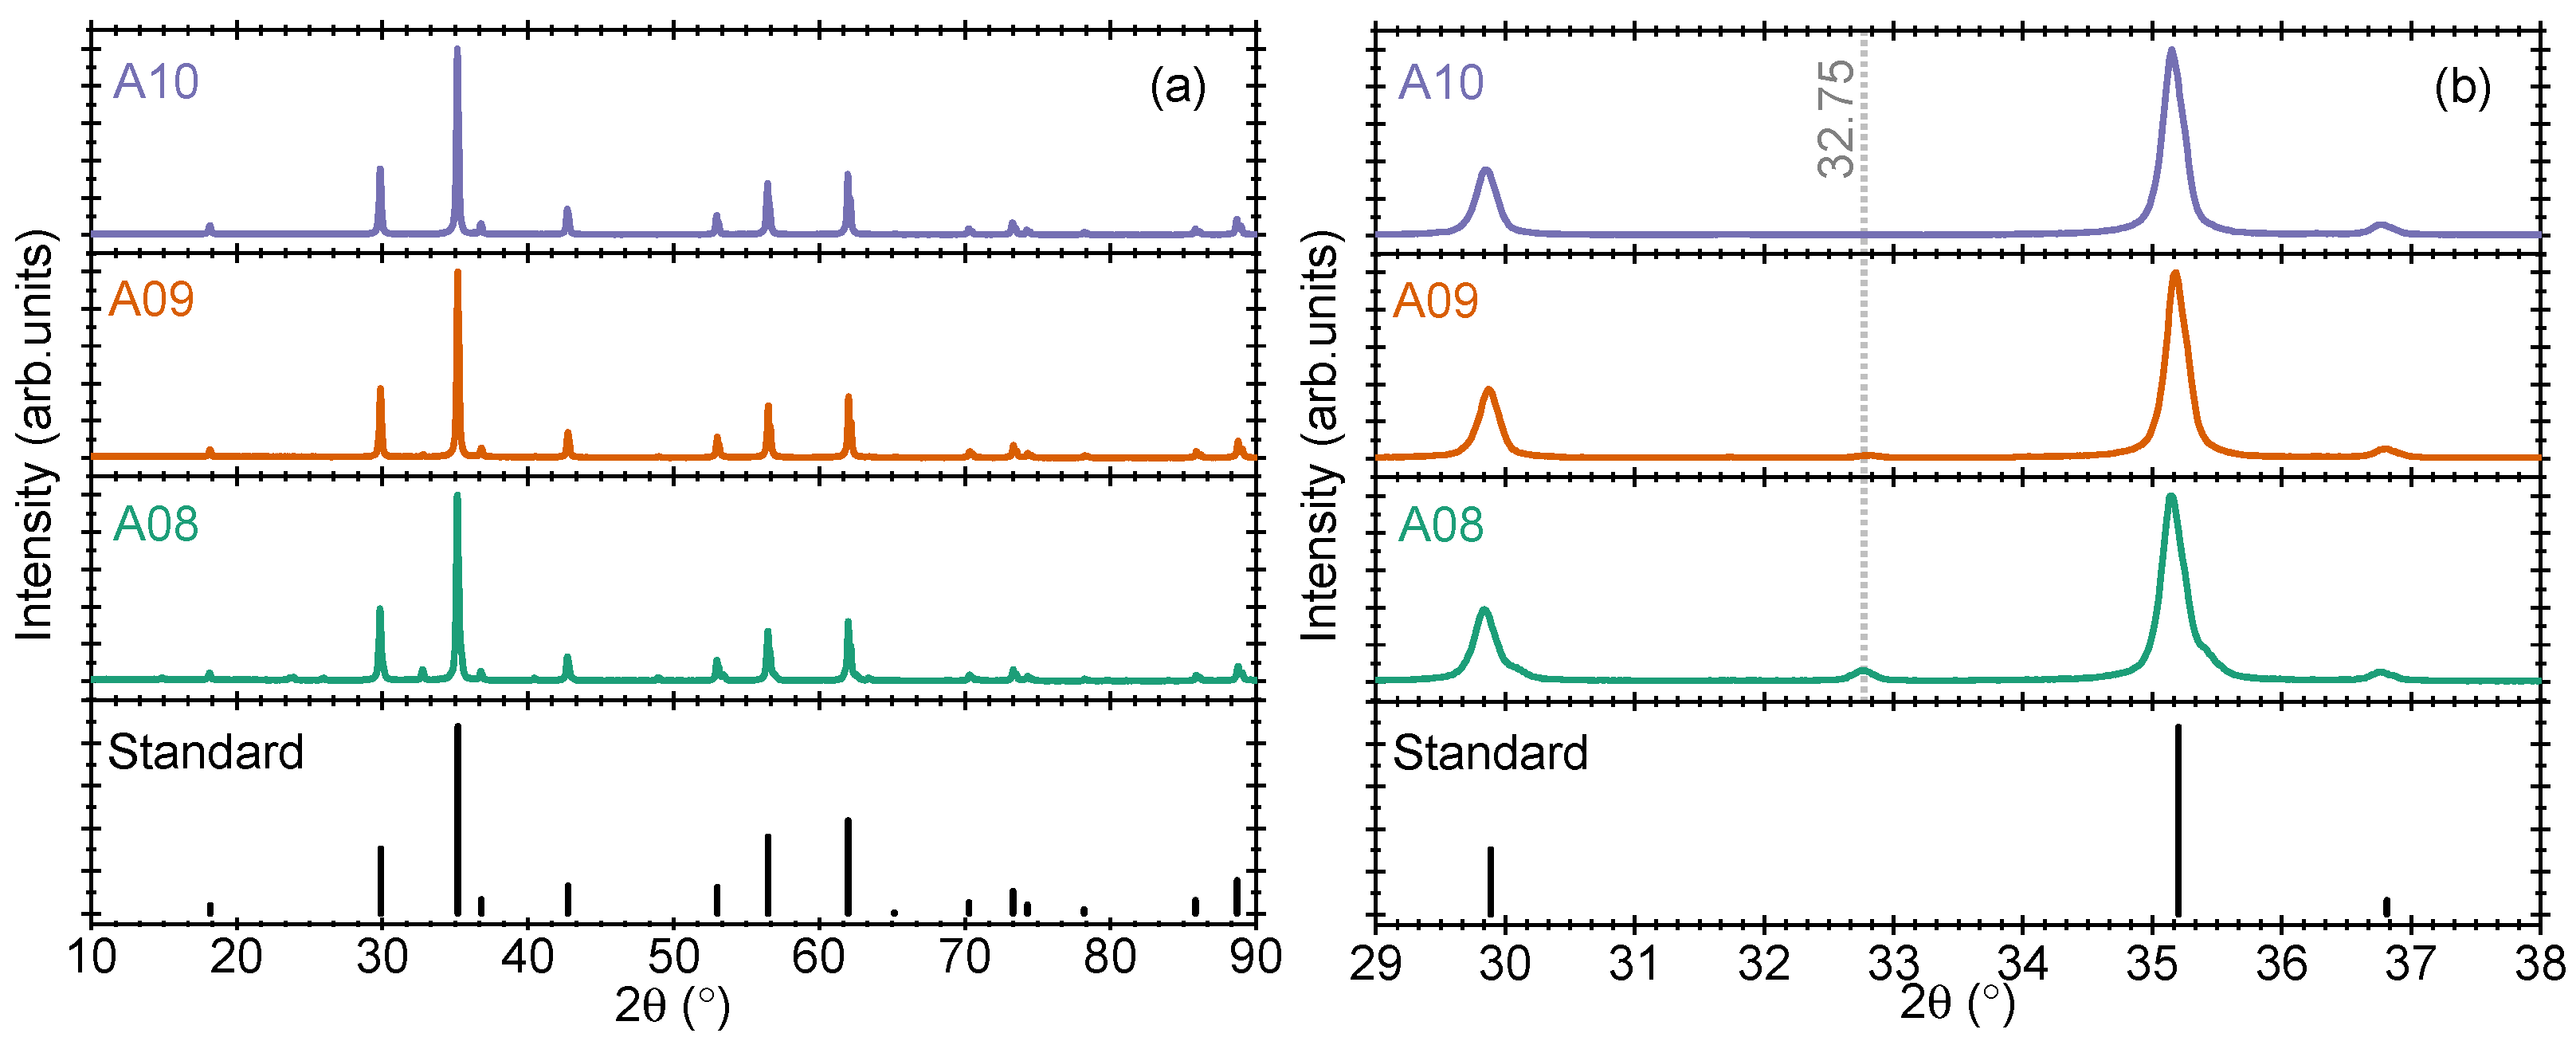
3.3. Change of ZnO Concentration with a 0.20 Step Size
Considering that there is very little change in the ZnO-related reflections in our samples and no change in prominent Zn
2TiO
4-related reflections, we optimized the ZnO ratio in a comparably larger step of 1.80:1.00 (samples A08), 1.60:1.00 (sample A09), and 1.40:1.00 (sample A10). The results of the three samples are shown in
Figure 3a,b. Interestingly, the prominent small peaks that were obtained in
Section 3.2 and
Section 3.3, for example, at 31.75 2
degrees, are not obtained now. Instead, a new reflection at 32.75 2
degree is observed. This reflection was also observed in sample A01, cf.
Figure 1a,b. The origin of the two reflections cannot be the same as they are obtained at different experimental conditions. While looking into the literature, we observe that the reflection at 31.75 2
degrees is due to ZnO in wurtzite phase, while the 32.75 2
degrees reflection is due to zinc blende-type ZnO [
14]. This new reflection can also be associated with Zn
2Ti
3O
8 phase. However, the position of Zn
2TiO
4 related reflections is unaffected by the change in ZnO concentration up to sample A10.
To further understand the effect of a decrease in the concentration ratio of the two precursors, the amount of ZnO is decreased to 1.20:1.00 (sample A11) and 1.00:1.00 (sample A12). For these samples, several additional reflections are observed in the pXRD pattern (results not shown). These additional reflections are present due to a mix of several phases from the ZnO-TiO2 family. As the present work focuses on Zn2TiO4 synthesis and its optimization, we choose to continue our investigations on samples with codes between A01-A10 only. As an important observation from the present results, we infer that sample A10 with ZnO:TiO2 concentration of 1.40:1.00 gives optimized pXRD results where the reflections due to unreacted ZnO vanish, while the main reflections due to Zn2TiO4 are conserved.
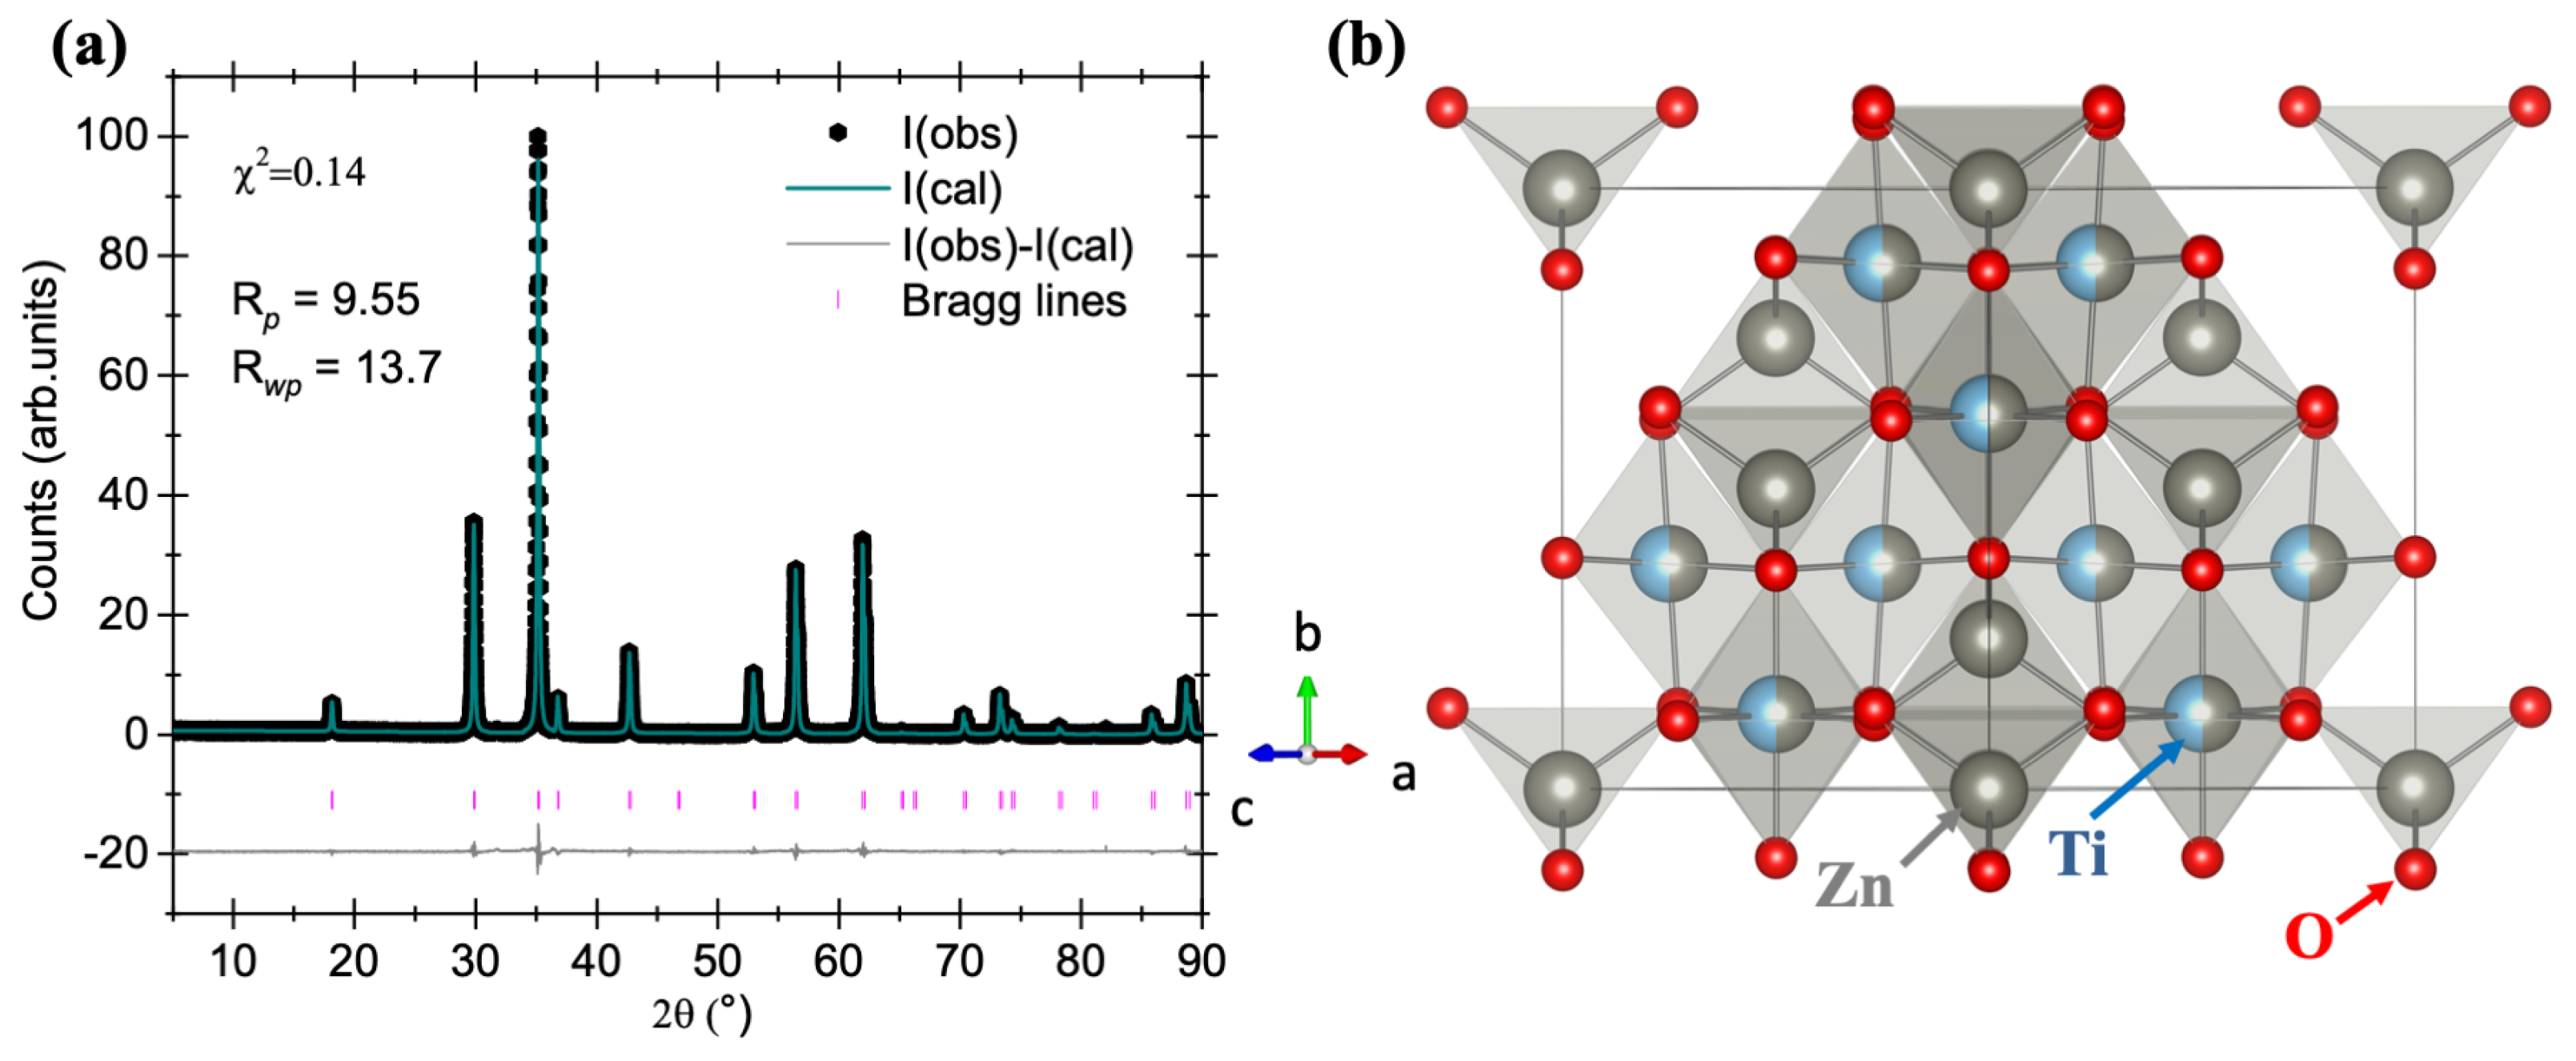
3.4. Rietveld Refinement of Sample A10
The Rietveld refinement of sample A10 was performed to determine the purity of the sample. The results after fitting the pXRD pattern are shown in
Figure 4a. When the experimental and calculated patterns are evaluated for an overlap between the two, a good correlation is observed. The data could be fitted with
= 0.14. The cell parameters are calculated as:
a =
b =
c = 8.4721(5) Å;
90°. The volume of the unit cell is calculated as
V = 608.0975(7) Å
3. When the cell parameters are compared with the standard data, a small change in the lattice parameters is noticed,
,
,
,
< 1%, which suggests that the ZnO concentration-optimized sample is of high purity.
Zn
2TiO
4 has a cubic spinel structure with the space group Fd–3m (#227). In the structure, the
cations occupy the 8a and 16d sites,
cations occupy the 16d sites, and
occupies the 32e site. The representative crystal structure is shown in
Figure 4b. In the crystal structure of
, Zn(1) occupies the tetrahedral site, while Zn(2)-Ti together occupy the octahedral site. The present host can also be written as Zn[ZnTi]O
4 [
15]. We wish to mention here that despite a change in the expected concentration ratio of ZnO:TiO
2 from 2.00:1.00 to 1.40:1.00, no major changes in the crystallographic reflections of Zn
2TiO
4 are observed, and only reflections due to unreacted ZnO diminish.
3.5. FE-SEM Analysis
The morphology and grain size distribution of the prepared samples are determined using FE-SEM analysis. The results of the samples A01 to A04, and A10 are shown in
Figure 5a–e. For all the samples between A01 to A04, larger grain particles (size > 150 nm) are obtained along with little contribution of grains with comparatively smaller size (size < 150 nm), cf.
Figure 5a–d. However, the results of sample A10 show mostly larger grains (size > 150 nm), cf.
Figure 5e. This suggests that the ZnO impurity detected in our pXRD results of samples A01 to A04 has a smaller grain size when compared to grains that belongs to the Zn
2TiO
4 host (sample A10). This is also evident when
Figure 5a and
Figure 5b or
Figure 5e are compared, where in the first case, the grains have a comparably lower size distribution (∼144 nm) and are dominated by the presence of ZnO in the pXRD pattern. For the four samples, an increase in the grain size is observed with a value of ∼144 nm for sample A01, ∼163 nm for sample A02, ∼217 nm for sample A03, and ∼253 nm for sample A04.
This observation is in expected lines as with an increase in the annealing temperature, the crystallinity and grain size are expected to increase. The reason for such a change in the grain size can be attributed to the re-crystallization process. It is also possible that there is a decrease in the deformation and grain boundaries at high temperatures. More interestingly, when the grain size of samples A02 and A10 are compared, both the samples possess a similar grain size of ∼163 nm, suggesting that the modulation of the concentration of ZnO has no impact on the grain size of Zn2TiO4.
The purity and elemental composition of the as-prepared samples were further verified by energy dispersive X-ray spectroscopic (EDS) analysis, as shown in
Figure 5f,g. The EDS spectrum of the selected image shows the peaks of zinc (
= 8.6 keV),
= 1.0 keV), titanium (
= 4.5 keV,
= 4.9 keV), and oxygen (
= 0.5 keV). The EDS semi-quantitative analysis of sample A02 indicates atomic percentages of 30.99% for zinc and 14.98% for titanium, resulting in an atomic ratio of 2.06:1.00 in comparison to the expected value of 2.00:1.00 used during synthesis (see
Table 1). Sample A10 shows atomic percentages of 26.25% for zinc and 19.14% for titanium, resulting in an atomic ratio of 1.39:1.00 in comparison to the expected value of 1.40:1.00 (see
Table 1). It is also to be mentioned here that the Rietveld refinement suggested that sample A10 is the best sample where no additional signatures of unreacted ZnO are observed.
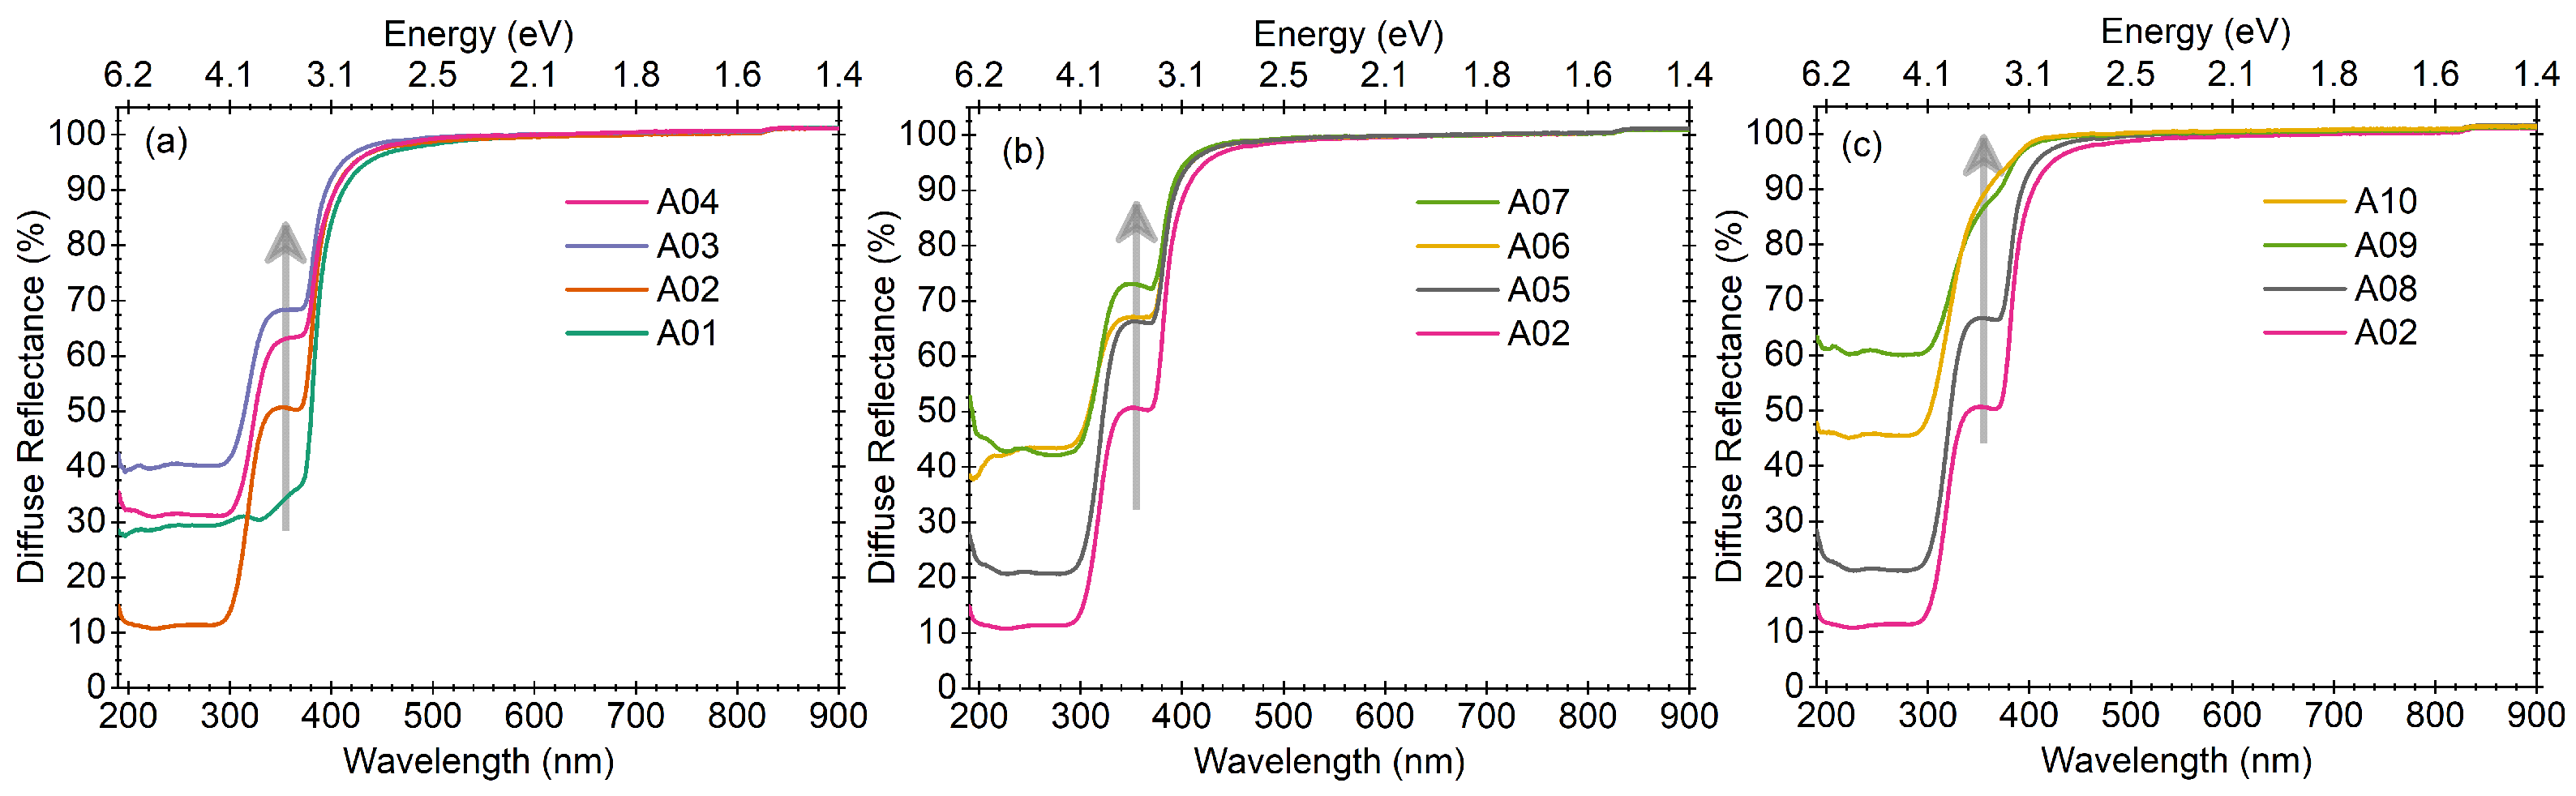
3.6. UV–Vis Diffuse Reflectance
The diffuse reflectance spectra of all the samples are shown in
Figure 6a–c. The spectra can be categorised into three domains: (a) as a function of temperature as per the discussion in
Section 3.1 of samples A01–A04 (
Figure 6a); (b) as a function of small change in ZnO concentration as discussed in
Section 3.2 for samples A05 to A07 (
Figure 6b); and (c) as a function of large change in ZnO concentration as discussed in
Section 3.3 for samples A08 to A10 (
Figure 6c). The results of sample A02 are also shown in all three graphs for comparison.
For sample A01, the UV-Visible diffuse reflectance spectra show a single broad absorption with a maximum at ∼375 nm. In this sample, we noticed several reflections in the pXRD pattern. For samples A02 to A04, the main UV-Visible absorption maximum is observed at 300 nm along with a shoulder at ∼375 nm. Upon decreasing the ZnO concentration in small steps [
Figure 6a], the major change is observed in the 375 nm band, whose intensity decreases with a decrease in the ZnO concentration. The present UV-Visible diffuse reflectance results are in good agreement with the pXRD patterns, where similar observations could be made. Similar results are obtained when the ZnO concentration decreases in larger steps [
Figure 6c]. We observe that the intensity of the shoulder peak at 375 nm decreases and is almost negligible for sample A10, similar to the pXRD pattern. The pXRD and UV-Vis reflectance results are found to be in good agreement with each other.
When we investigate the literature for information regarding the type of bandgap of Zn
2TiO
4, we observe varied information. In ref. [
16] on Zn
2TiO
4 films, the material is mentioned to be a direct band gap semiconductor with an optical band gap energy of 3.09 eV (400 nm). However, in another article, it is mentioned to be indirect in nature with an optical band gap of 3.29 eV (376 nm) [
17]. In our results, we also observe a band at 375 nm similar to these reports. However, this band disappears when the concentration of ZnO decreases, suggesting that the band gap can be modulated without affecting the crystallinity of the host matrix. In one of the articles by Zhang et al. [
18], it is mentioned that the band gap of Zn
2TiO
4 with the highest crystal quality is 4.41 eV (282 nm). When we compare this observation with our results, where we also obtain a band gap maximum in the same wavelength region for sample A10, we infer that the band gap of Zn
2TiO
4 could be ∼4.40 eV, and the band at 3.30 eV as reported in earlier findings could be a result of unreacted ZnO in the host lattice.
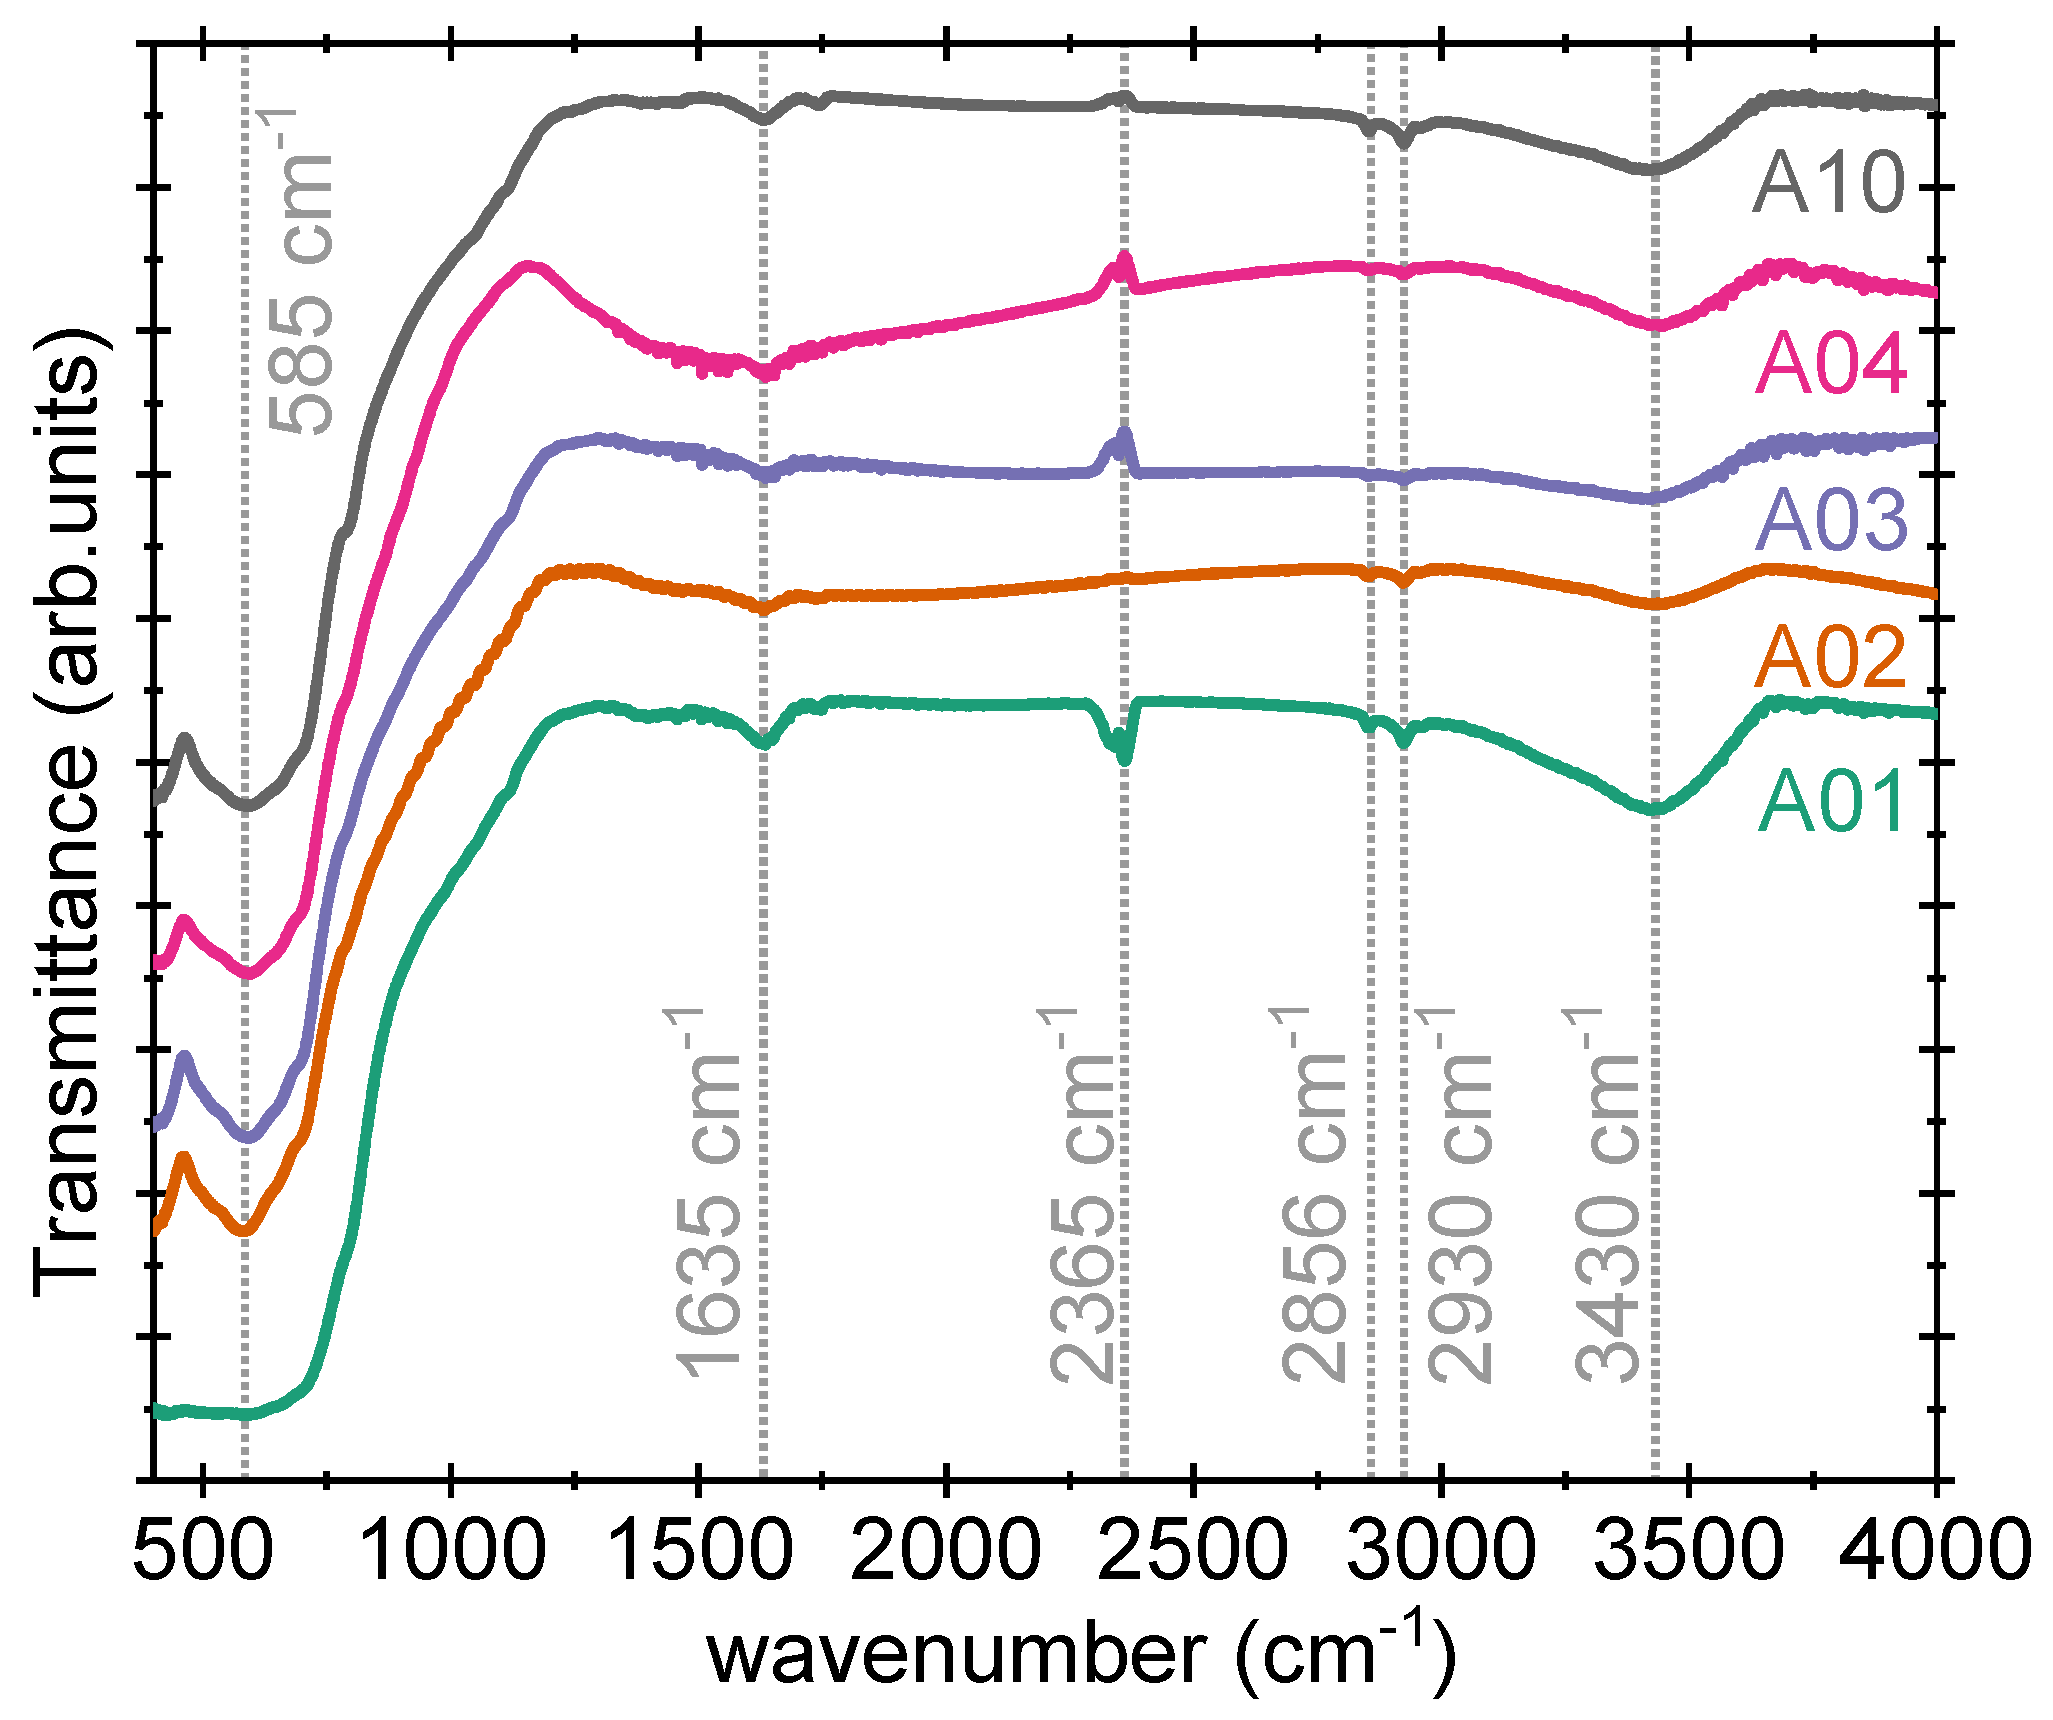
3.7. Fourier Transform Infrared (FTIR) Spectroscopy
Figure 7 shows FTIR spectra of samples A01 to A04 and A10. The samples are measured in the transmission mode within the wavenumber region of 400–4000
. The signatures are observed with maximum transmittance (or absorption) at ∼585
, ∼1635
, ∼2365
, ∼2856
, ∼2930
, and ∼3430
for all the samples. The band at 585
is due to stretching vibration in the
group, while the band around 1635
is attributed to Zn-O bond formation. The third signature around 2365
, which is observed in four samples only, is attributed to the artifact caused by the spectrometer, in accordance with the earlier report by Leen et al. [
19]. We also observed a similar signature in our recent results on
samples [
20]. The origin of FTIR spectra at 2856 and 2930
is unclear at this stage. The broad band with a maximum at 3430
is due to the presence of molecular water in Zn
2TiO
4. It is observed that despite annealing at 1000 °C, the samples show the presence of water in the lattice, suggesting that the water is absorbed by the samples from the air and is hygroscopic in nature. No major difference in the FTIR spectra of samples A02 and A10 is observed, as in one sample there is an excess of ZnO while the other is a ZnO-deficient Zn
2TiO
4 sample.
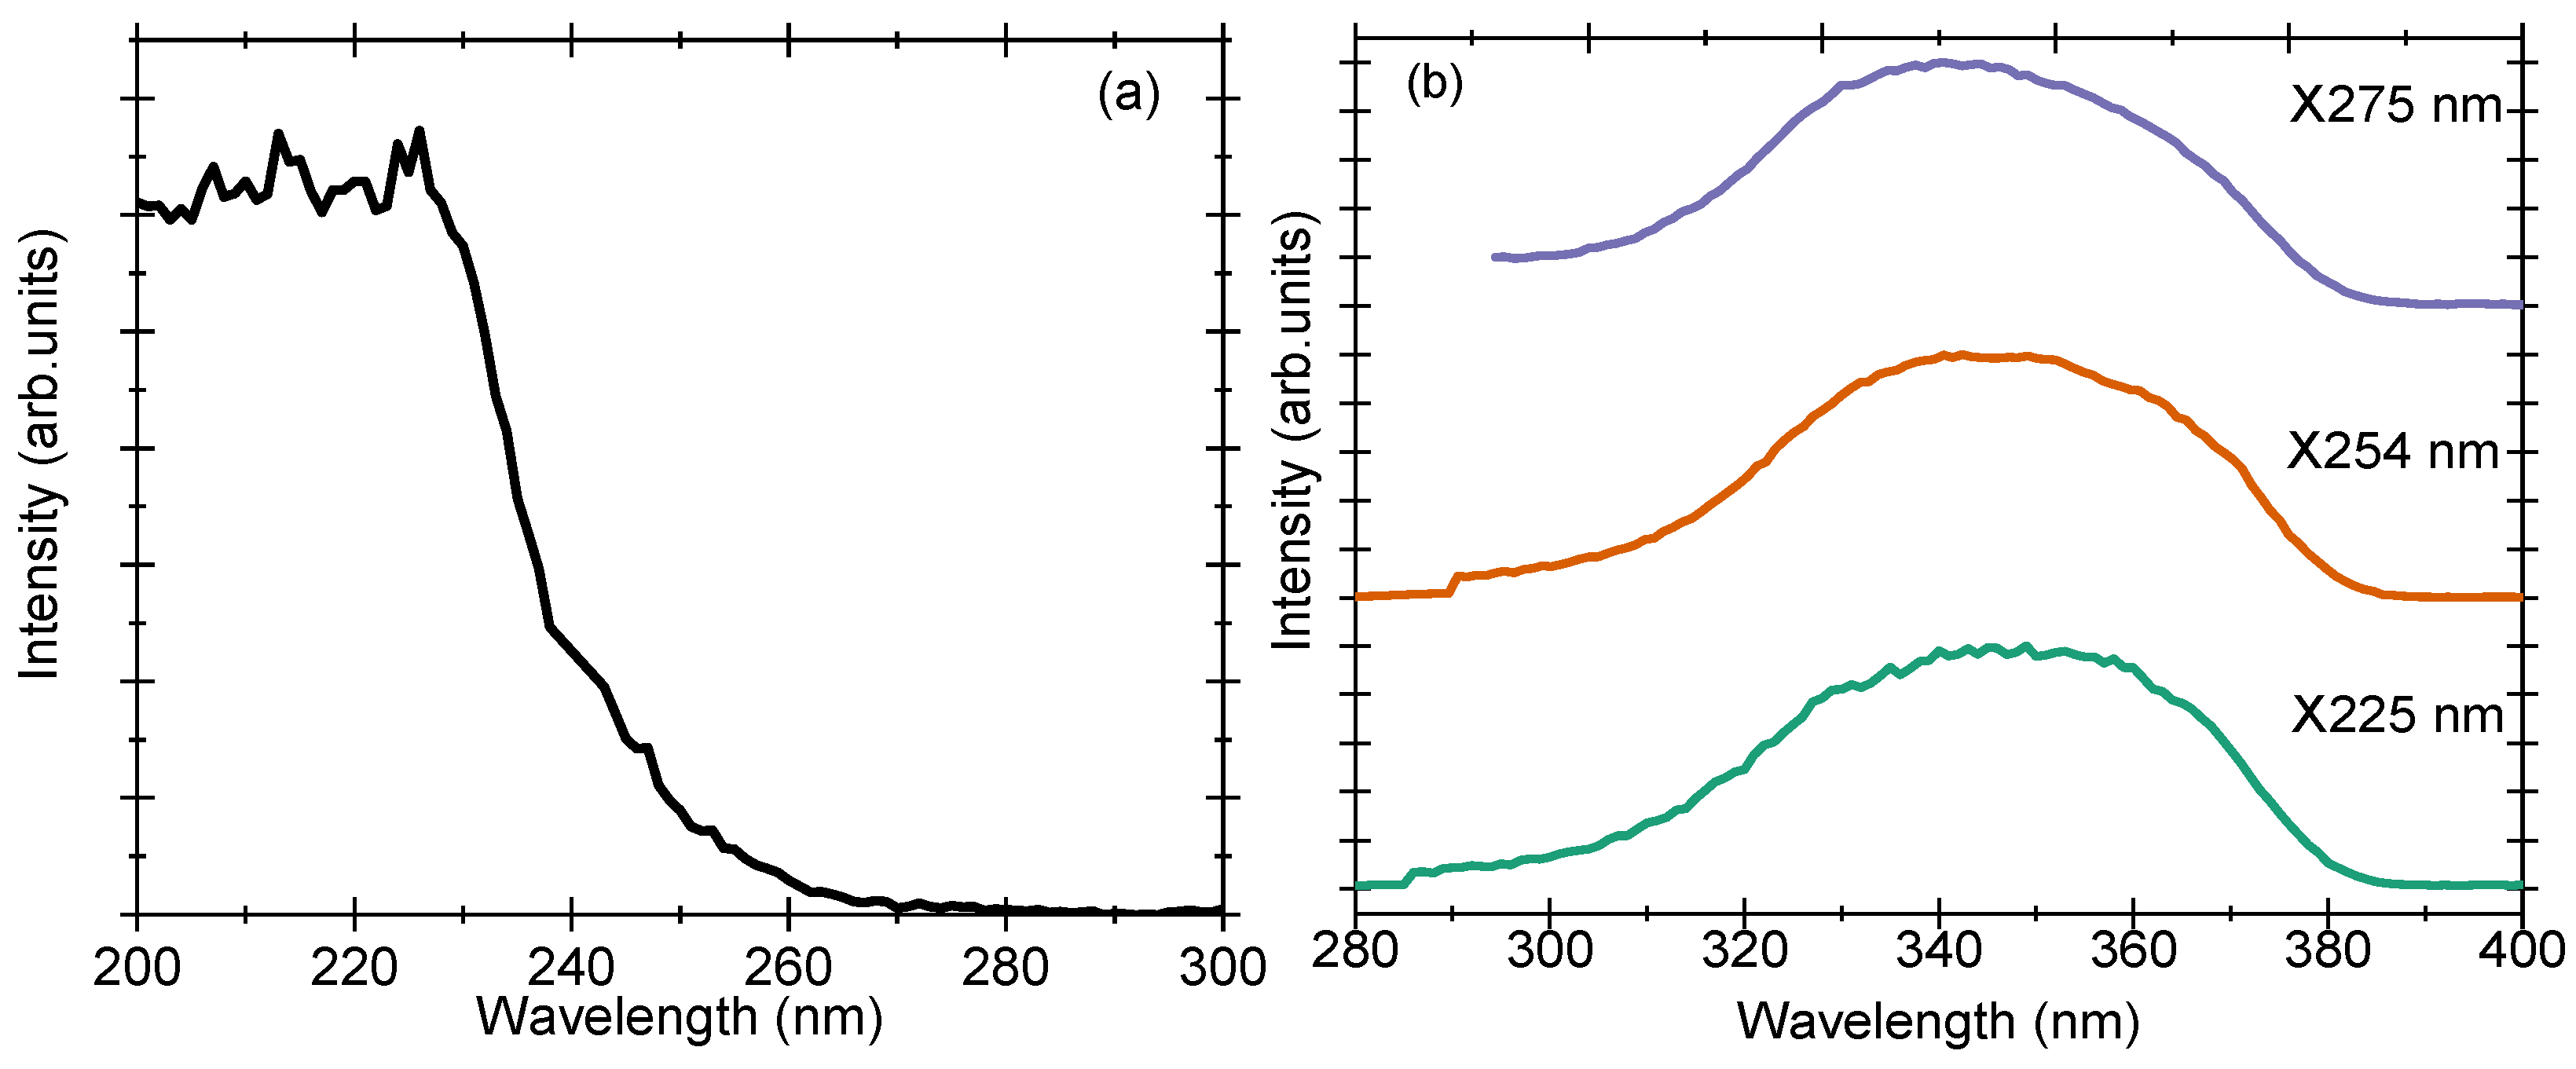
3.8. Photoluminescence (PL) Spectra
The PL excitation and emission spectra of sample A10 (pure Zn
2TiO
4) are shown in
Figure 8a,b. The PL excitation spectrum contains one prominent band at 225 nm when monitored for an emission maximum at 346 nm (
Figure 8a). Upon excitation at wavelengths 225, 254, and 275 nm, the emission maximum is obtained at 346 nm (
Figure 8b). The excitation spectrum overlaps exactly with the UV-Vis diffuse reflectance spectrum, suggesting that the origin of the two is the same. The sample can be excited with any wavelength lower than 280 nm and needs UV-C light to produce efficient PL emission. The emission of the pure Zn
2TiO
4 sample is in the UV-A region and extends between 300 and 390 nm. For this band-to-band excitation, the origin of PL emission is anticipated to be defects similar to the ones observed in undoped ZnGa
2O
4 samples, where the prominent emission has been attributed to the self-activated centres of the octahedral Ga-O group in the spinel lattices [
21]. While looking for information in the literature, we found a recent article that mentions the origin of PL emission in Zn
2TiO
4 to be
and
vacancies related that are present in the crystal lattice [
11]. The conduction band in Zn
2TiO
4 lattice is made up of Ti-3s orbitals and the valance band is composed of Zn-3d and O-2s orbitals [
22].
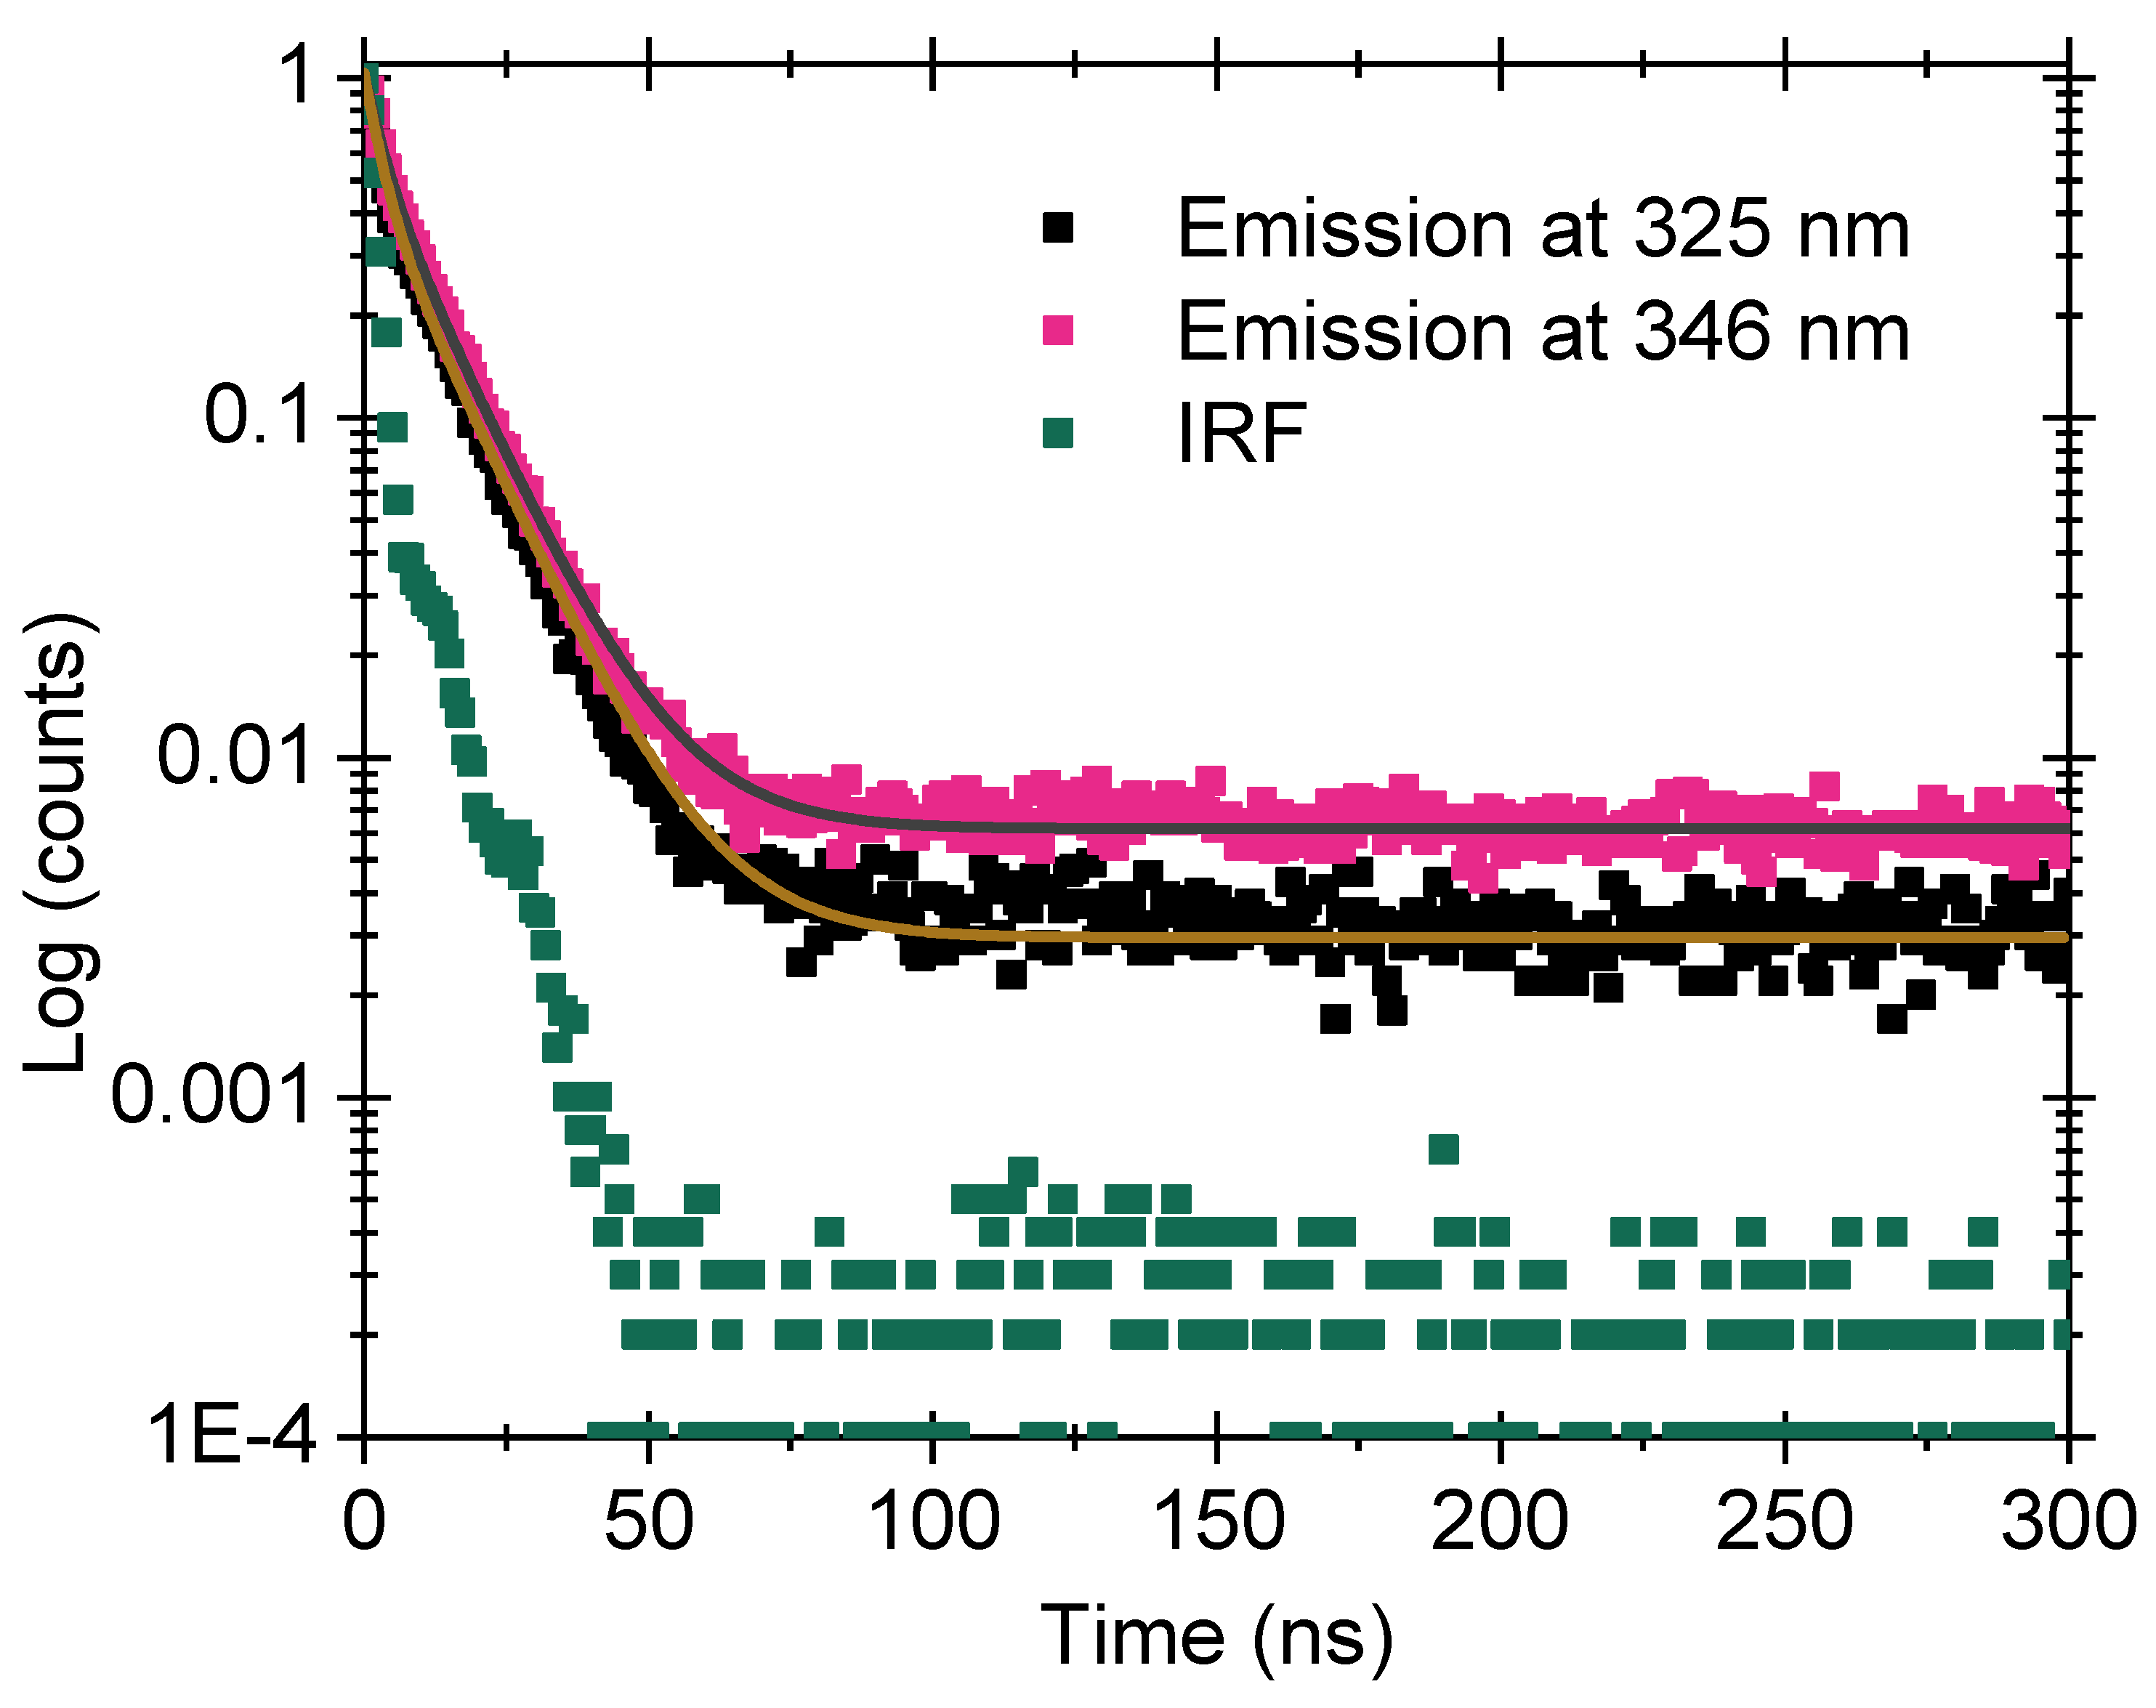
3.9. Luminescence Lifetime
The lifetime of the charges in their excited state is determined for sample A10 by measuring decay curves at the maximums of PL emission at 325 and 346 nm. The results are shown in
Figure 9. The IRF signal is also presented in the figure for comparison. The excitation is performed using a pulsed source with emission at a wavelength of 265 nm. Both curves could not be fitted with a single exponential decay curve, and a double exponential curve is used to fit the curves using Equation (
1).
where,
,
are the amplitudes of individual exponential, and
and
are decay constants. The results are combined in
Table 2.
Generally, when the electron is excited to a higher quantum state from where it is expected to come back to the ground state accompanied by the emission of photons due to electron–hole recombination, the intensity of emission is written as I = exp(−t/). The decay curve in such a case can be fitted with monomolecular or first-order decay kinetics. On the contrary, when ‘n’ number of electrons move to the conduction band, leaving behind ‘n’ number of empty centers, the rate of recombination, ‘r’ is given by (−dn/dt) = r.n2, and the decay curve can be fitted with hyperbolic or second order decay kinetics.
When looking into our results, there are at least two different pathways of electron relaxation from the excited state to the ground state, as is evident from the lifetime of ∼3 ns and ∼11 ns. The results also suggest that the decay follows second-order kinetics. When the decay results are compared upon excitation at 325 and 346 nm, we observe that the relaxation pathways are similar in the two cases.
3.10. Thermoluminescence (TL) and PersL
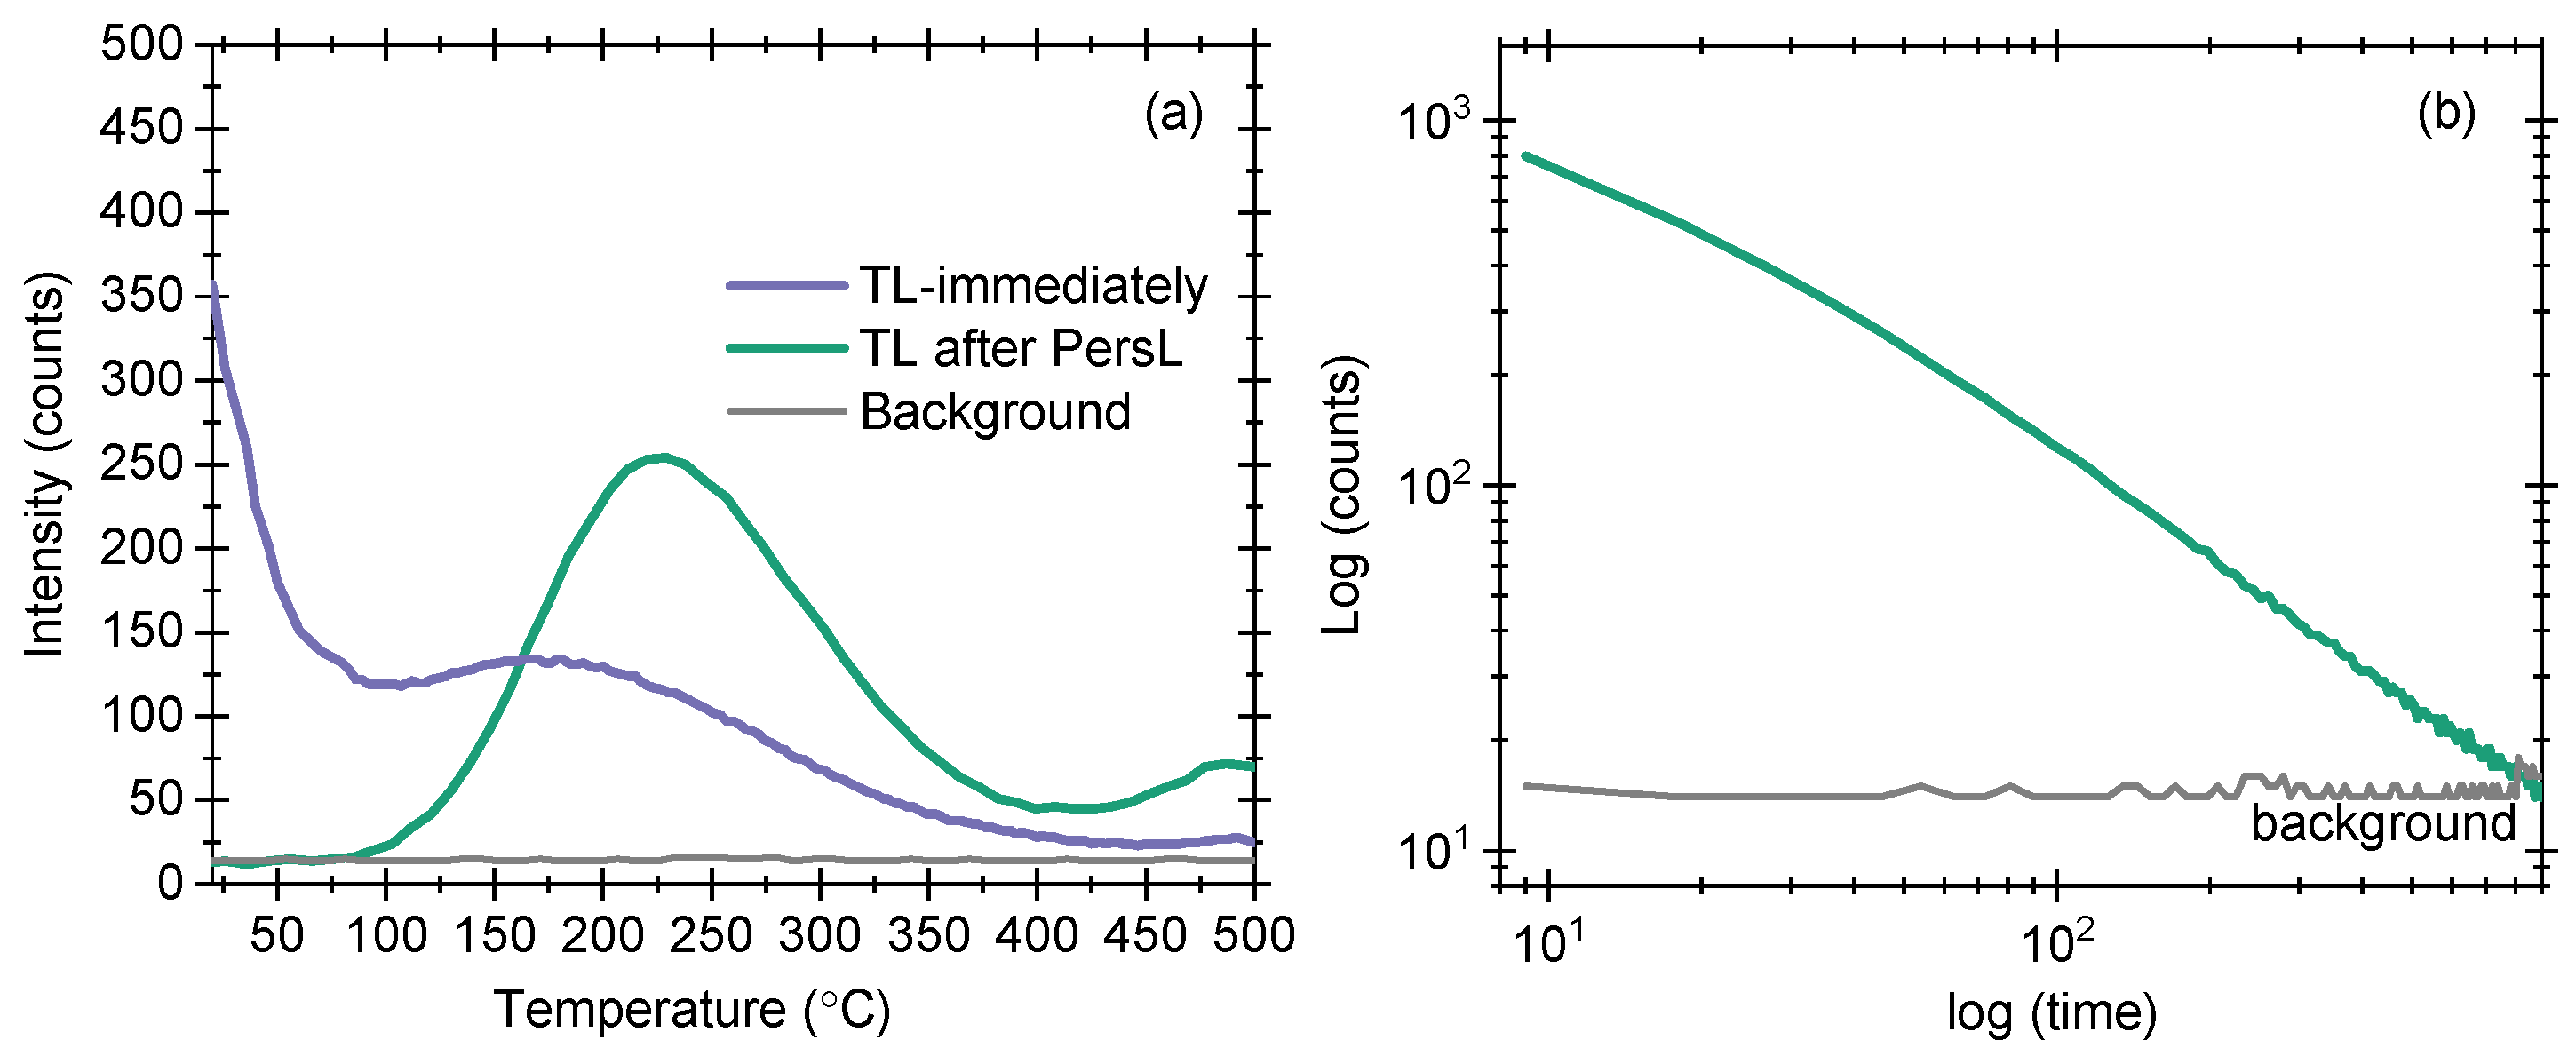
We measured the TL and PersL of sample A10. The results are shown in
Figure 10a,b. The excitation in all cases is performed using 254 nm emitting UV light for 5 min. The choice of 254 nm light was based on the PL excitation spectrum. The TL results obtained immediately (after stopping excitation) show an initial signal at room temperature followed by a maximum at 175 °C, cf.
Figure 10a. The initial signal at room temperature is a clear indication of PersL in sample A10. The reason for PersL is the charge trapping and detrapping at room temperature, suggesting that room temperature provides sufficient energy for charges to become detrapped. These charges have an equal probability of becoming detrapped (and retrapped) at room temperature, producing PersL. We measured PersL at room temperature, and the results are shown in
Figure 10b. The log–log plot shows that the signal decays almost linearly and reaches the background signal after 15 min of measurement time. The background signal is also shown for a comparison of the two signals. In the third measurement, we recorded TL after recording PersL (
Figure 10a [green line]). In this case, the TL maximum is obtained at 225 °C. By assuming first-order kinetics and using the equation 25k
[
23], the activation energy (
) of the charge storing defects is determined to be 1.07 eV. Considering an electron trap model, we infer that these defects are approximately 1.07 eV below the conduction band.
4. Discussion
Zn
2TiO
4 with an inverse spinel crystal structure appears to be an interesting material for bioimaging applications, especially upon doping with Cr ion. Cr ions are expected to produce emissions around 700 nm due to d-d type transitions. It has a reported band gap of 3.30 eV (375 nm). In our case, the sample could be prepared at 800 °C with little noticeable unreacted ZnO, cf.
Figure 1. We prepared all further samples at this temperature only. The 375 nm band overlaps exactly with the host absorption in ZnO, suggesting that upon changing the ZnO concentration, the band gap of the material can be modified. We decreased ZnO concentration (used as a precursor) firstly in a small step of a change of 0.02 mol in comparison to TiO
2 concentration. The pXRD pattern shows that the reflection due to Zn
2TiO
4 remains unchanged while the signatures due to unreacted ZnO decreases slightly (
Figure 2). Upon decreasing ZnO in larger step size (0.20 mol), we observe that Zn
2TiO
4-related reflections remain the same and sample A10 does not show any unreacted ZnO (
Figure 3). We performed Rietveld refinement on this sample and observed a very good correlation between experimental and theoretical data (
Figure 4). From the SEM results, we confirm that the smaller particles observed in micrographs were due to ZnO, as their concentration decreases with a decrease in the concentration of ZnO (
Figure 5). The most interesting observation among all the studies is the change in ZnO-related band in these samples (
Figure 11). A part of these results is also shown in
Figure 6.
Upon modulating ZnO concentration, we observe a decrease in the ZnO-related band, and for sample A10, the 375 nm band vanishes. The pXRD pattern of Zn
2TiO
4 does not change drastically, and the only change is observed in the unreacted ZnO, which is completely removed now for sample A10. This suggests that the band gap of Zn
2TiO
4 is modified to 4.40 eV (
Figure 7). In some reports, the band is also mentioned to be 4.41 eV [
18]. This value is in good agreement with our value. The FTIR results suggest that the samples are hygroscopic in nature, and chemistry-related tools should be used to improve performance in this direction (
Figure 8). The prominent emission in the samples is in the UV-A region, which can find suitable applications in biomedical applications. The luminescence decay time of this emission is in the ‘ns’ regime (
Figure 9). Sample A10 also shows PersL with a decay time of 15 min, while the TL glow curves indicate that the sample possesses a deep defect of
= 1.07 eV (
Figure 10). This defect is capable of acting as a reservoir of charges for storage applications.


