Article

Investigation of the Degree of Monomer Conversion in Dental Composites through Various Methods: An In Vitro Study

1
Department of Restorative Dentistry, Faculty of Dentistry, Altinbas University, Istanbul 34140, Türkiye
2
Department of Restorative Dentistry, Faculty of Dentistry, Eskisehir Osmangazi University, Eskisehir 26140, Türkiye
3
Department of Biochemistry, Faculty of Pharmacy, Altinbas University, Natural Products Research and Development Centre (DUAGEM), Bakirkoy Campus, Istanbul 34140, Türkiye
4
Department of Biophysics, Faculty of Medicine, Bahcesehir University, Istanbul 34730, Türkiye
*
Author to whom correspondence should be addressed.
Appl. Sci. 2024, 14(11), 4406; https://doi.org/10.3390/app14114406
Submission received: 25 March 2024 / Revised: 16 May 2024 / Accepted: 16 May 2024 / Published: 22 May 2024
(This article belongs to the Section Applied Dentistry and Oral Sciences)

Abstract

:
The degree of monomer conversion (DC) values of three different dental composites were examined using three different methods: surface microhardness (ratio of bottom/top), Fourier-transform infrared (FT-IR), and differential scanning calorimetry (DSC). Two of the dental composites included in the study were nanohybrid (Dentsply Neo Spectra ST HV and Omnichroma), and one was a microhybrid-labeled newly marketed composite containing nanoparticles (Dentac Myra). Composite discs were prepared according to the methodology for all methods and analyzed (2 mm thickness × 5 mm diameter). Surface microhardness values were measured in Vickers Hardness Number (VHN), while FT-IR and DSC values were obtained in percentage (%). Significant differences were observed in both bottom/top surface microhardness values and DC values obtained from FT-IR. However, there was no statistical difference in the ratio of bottom/top microhardness values. Neo Spectra ST HV exhibited superior performance in both microhardness and monomer conversion compared to the other two composites. Newly marketed Myra showed values close to Omnichroma. It was found that the values obtained by the DSC method were parallel to those obtained by FT-IR. In conclusion, the structure of dental composites leads to different mechanical properties. Additionally, DSC measurements and FTIR spectra were found to be complementary techniques for characterizing monomer conversion values.

1. Introduction

The demand for both functional and aesthetically pleasing teeth has surged in recent years, leading to a rapid expansion in the utilization of resin-based composites. This growth can be attributed to the escalating aesthetic expectations of patients and the continuous advancements in material manufacturing technologies [1]. Resin-based composites are broadly categorized as hybrid or nanocomposite materials, primarily distinguished by their physico-mechanical attributes, such as filler type, filler particle size, and filler distribution within the composite structure [2]. These materials predominantly consist of a polymeric matrix comprising various high-molecular-weight dimethacrylates, including bisphenol-A-diglycidyl methacrylate (bis-GMA), bisphenol-A-ethoxy dimethacrylate (bis-EMA), triethyleneglycol dimethacrylate (TEGDMA), and urethane dimethacrylate (UDMA) [3].
Dental composites have physico-mechanical qualities and a survival rate comparable to enamel and dentin [4]; this is because the majority of these monomers can be transformed into polymers during the polymerization phase [5]. The release of “residual monomer” may induce post-operative discomfort, secondary caries, and endodontic issues if monomer conversion does not occur adequately [6]. The utilization of resin-based composites in dentistry has revolutionized restorative dentistry practices due to their versatility, durability, and aesthetic appeal [7]. These materials offer clinicians a wide array of options to meet patients’ specific needs, ranging from minor cosmetic enhancements to extensive restorations [8]. Furthermore, resin-based composites have gained popularity over traditional dental materials like amalgam due to their ability to mimic the natural color and translucency of teeth, providing patients with aesthetically pleasing outcomes [9].
Despite their widespread use and numerous advantages, resin-based composites present challenges related to polymerization shrinkage, polymerization stress, and the release of potentially cytotoxic by-products during polymerization [10]. These issues can compromise the longevity and integrity of restorations and contribute to post-operative sensitivity and secondary caries formation. Therefore, understanding the polymerization behavior and mechanical properties of resin-based composites is critical for optimizing their clinical performance and ensuring patient satisfaction. Recent advancements in material science and manufacturing techniques have led to the development of novel resin-based composite formulations with enhanced mechanical properties, reduced shrinkage, and improved biocompatibility [11]. These innovations have broadened the scope of applications for resin-based composites, extending beyond traditional direct restorations to encompass various aesthetic and functional dental procedures such as veneers, inlays/onlays, and even orthodontic appliances [10]. In addition to their clinical significance, resin-based composites play a pivotal role in dental research, serving as model materials for investigating fundamental principles of polymer science, dental material engineering, and biomaterial interactions [12]. By exploring the structure–property relationships of resin-based composites, researchers can uncover new insights into material design, performance optimization, and clinical application, ultimately advancing the field of restorative dentistry.
Several spectroscopic techniques, including Nuclear Magnetic Resonance, Dynamic Mechanical Thermal Analysis, differential scanning calorimetry (DSC), and Fourier-transform infrared (FT-IR), are employed to measure the monomer transformation ratio of resin-based materials [13,14]. FT-IR spectroscopy can be used to analyze organic molecules in different states of matter. Via bond characterization, the bonding status of functional groups in the structures of solid, liquid, or gaseous organic compounds can be identified, as well as whether the structure is aliphatic or aromatic [15]. It has been mentioned that the study of FT-IR spectra is a reliable method for quantitatively determining the degree of monomer conversion of resin-based materials [16], and advanced FT-IR microspectroscopy can be used to examine the substrate surface and hybrid layer in detail [17]. On the other hand, by utilizing the technique of differential scanning calorimetry, a correlation is established between the number of monomer units participating in the reaction and the amount of heat generated during the monomer-to-polymer transformation. This allows for a direct interpretation of the polymerization conversion based on the heat generated throughout the monomer–polymer conversion process.
This study aimed to test the surface and subsurface microhardness values of a series of dental composite materials with different inorganic and organic contents, calculate monomer conversion values using FT-IR spectroscopy, and measure the thermal changes in the polymerization stage of composites through the differential thermal calorimetry method. The null hypothesis of the study is that three different dental composite materials will not exhibit statistically significant differences in any of the methodologies included in this study.

2. Materials and Methods

2.1. Preparation of Samples

In this study, composite restorative materials with distinct organic resin content and structures were employed. The composition and types of the utilized composites are illustrated in Table 1. Using a Teflon mold, five discs (2 mm thickness × 5 mm diameter) were obtained from three different resin composites (n = 5). Following the placement of glass at the bottom and a transparent celluloid tape, the mold was filled with composites by a single operator (M.K.U.) to ensure the absence of air bubbles. After the placement of another transparent celluloid tape (to prevent oxygen inhibition) and glass on top, all samples were polymerized via the same light-curing device (EliparTM S10, 3M-ESPE, St. Paul, MN, USA) according to the manufacturer’s instructions. The polymerized samples were then immersed in distilled water at 37 °C for 24 h.

2.2. Analysis of Surface Microhardness

The prepared samples were positioned in the Vickers hardness testing device. The device allows for computerized control of the applied force, test duration, and other parameters. The test load was set to 300 g, and the holding time was adjusted to 15 s. Using the ×40 magnification eyepiece, the diagonals of the formed equilateral quadrangle on the sample surface were marked, and the Vickers Hardness Number (VHN) value was determined using the device’s digital calculation method. The surface microhardness was determined using the equation H = 1854.4 (Pd−2), where H represents Vickers hardness (kg/mm2), P denotes the applied force (g), and d signifies the average length of the diagonals (μm). The obtained results were reported as VHN. The measurements were taken from three random points on each of the top and bottom surfaces of each sample, equidistant from the edges and each other. The values obtained were recorded, and mean values for the top and bottom surfaces were determined using the data. Furthermore, the mean difference values between the top and bottom surfaces were calculated. Additionally, polymerization conversion rates were determined proportionally via the formula (VHN%) = (bottom surface/top surface) × 100.

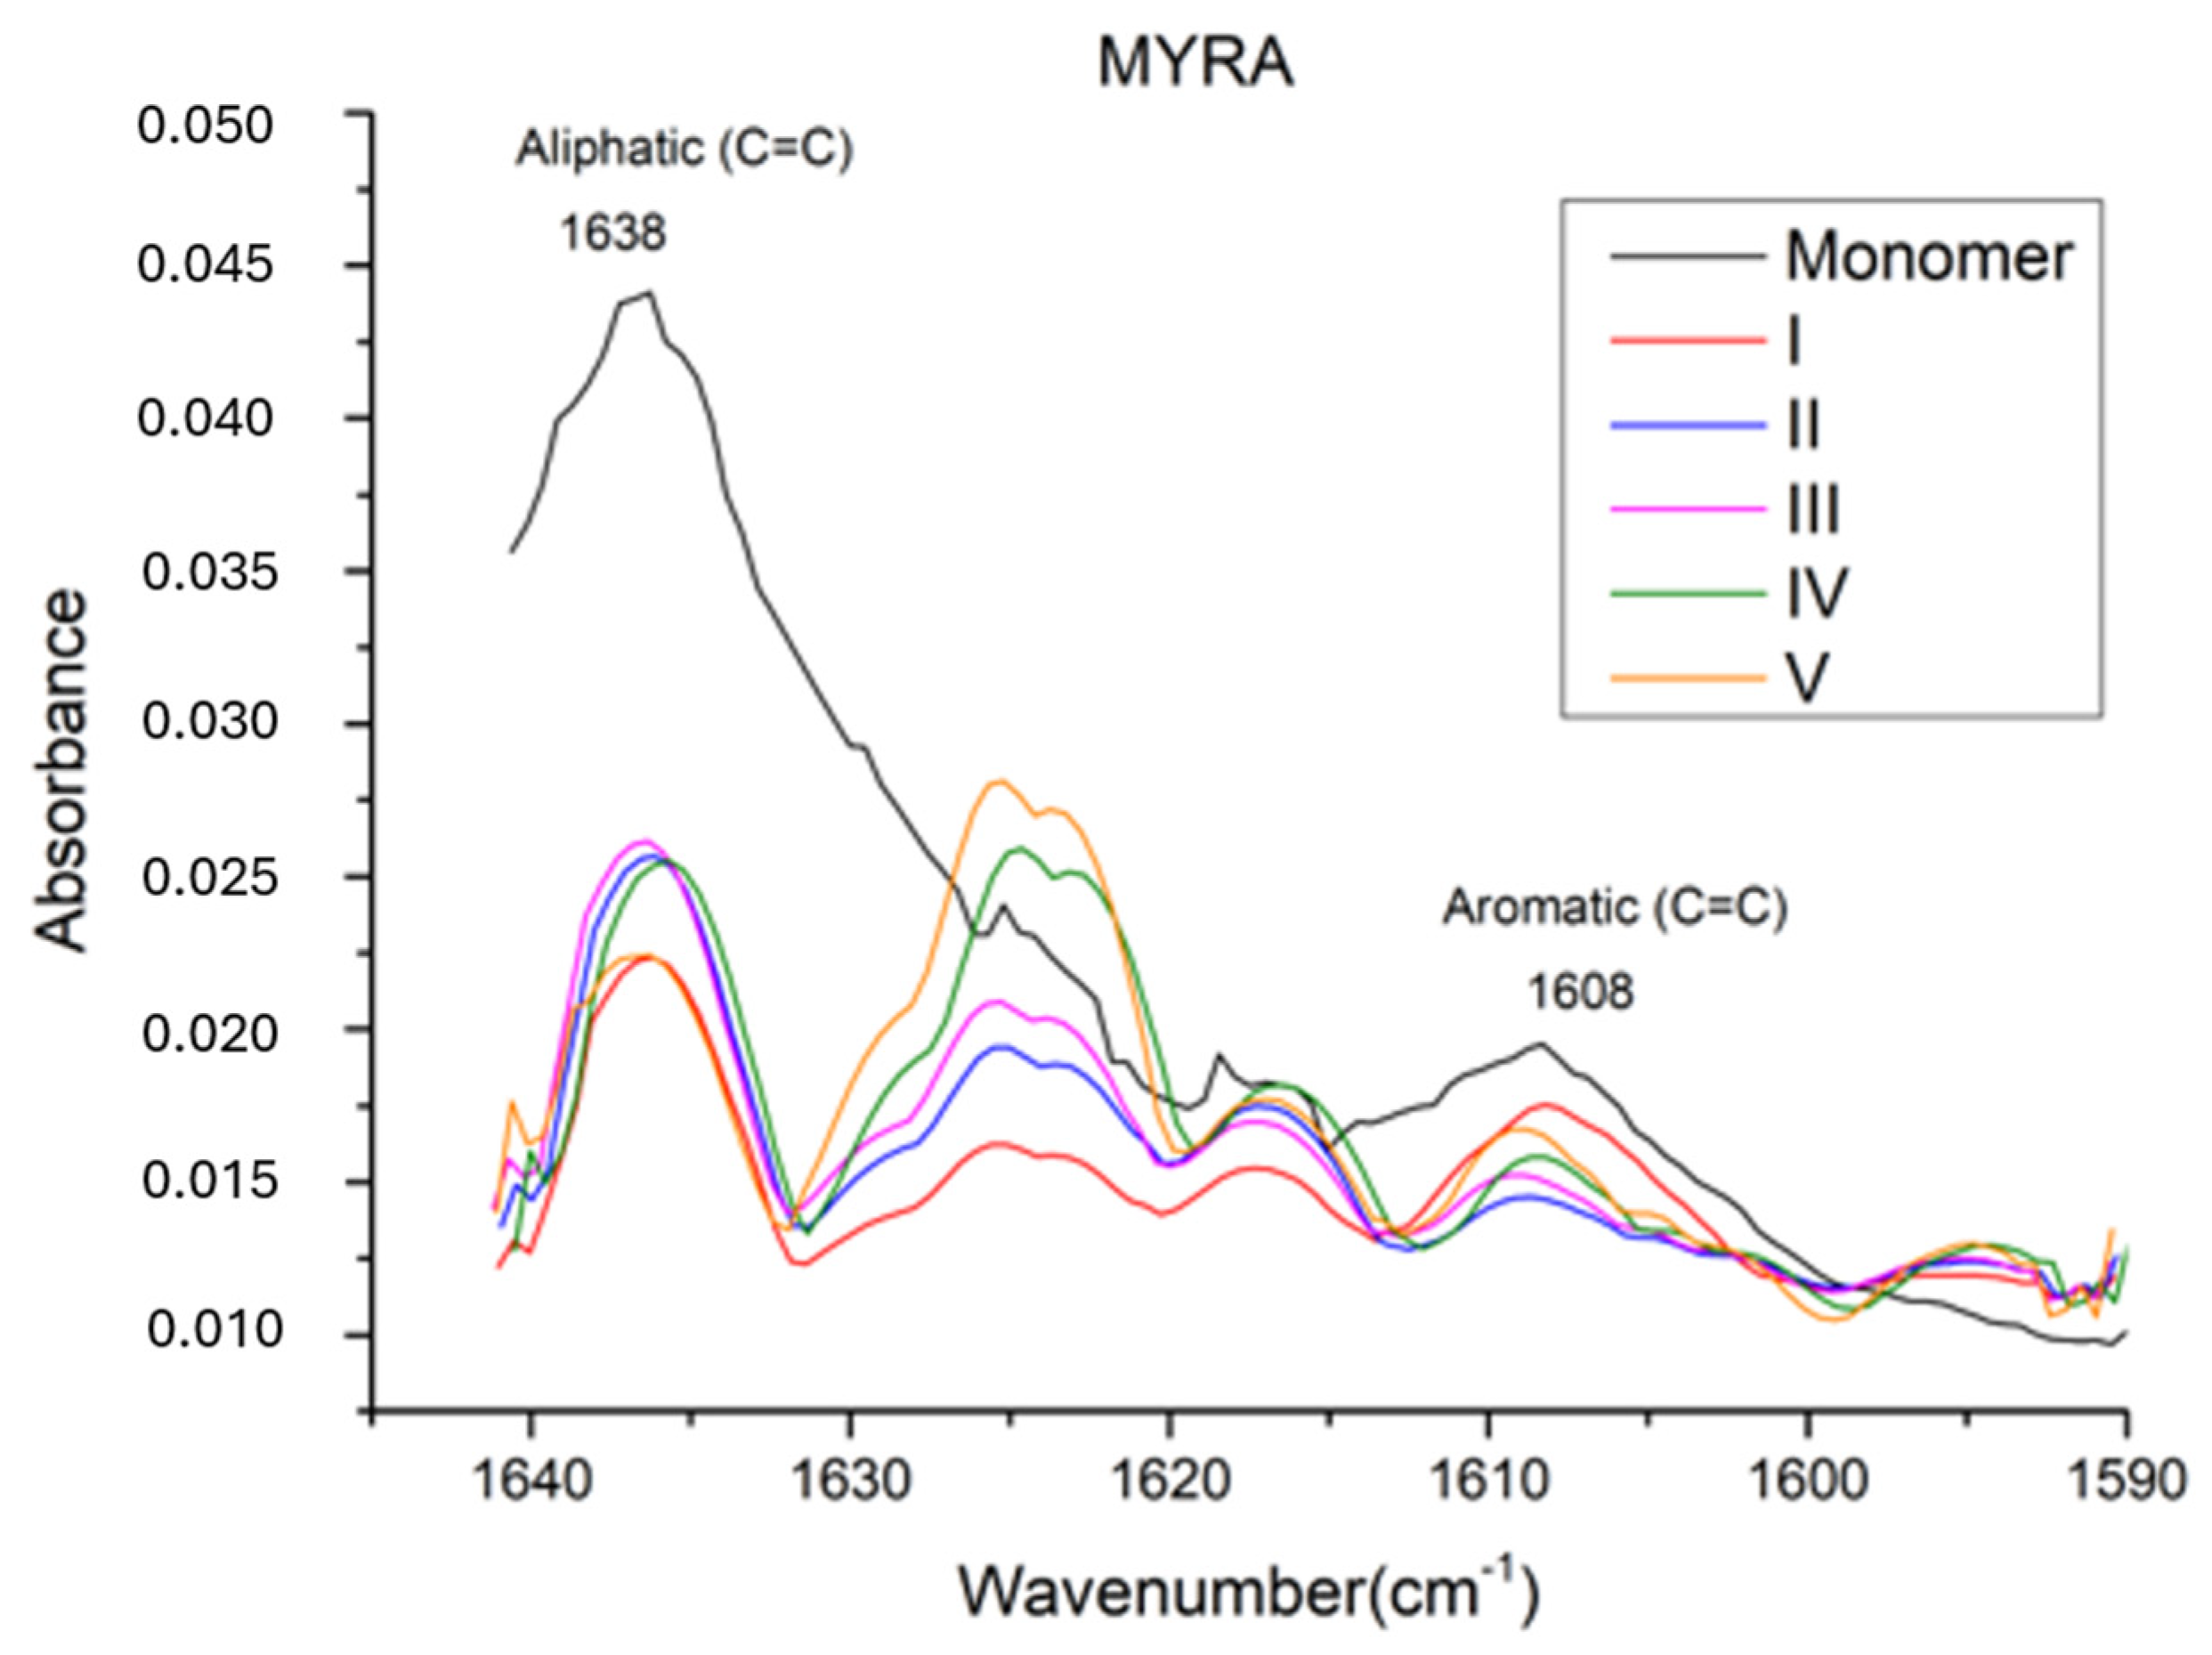
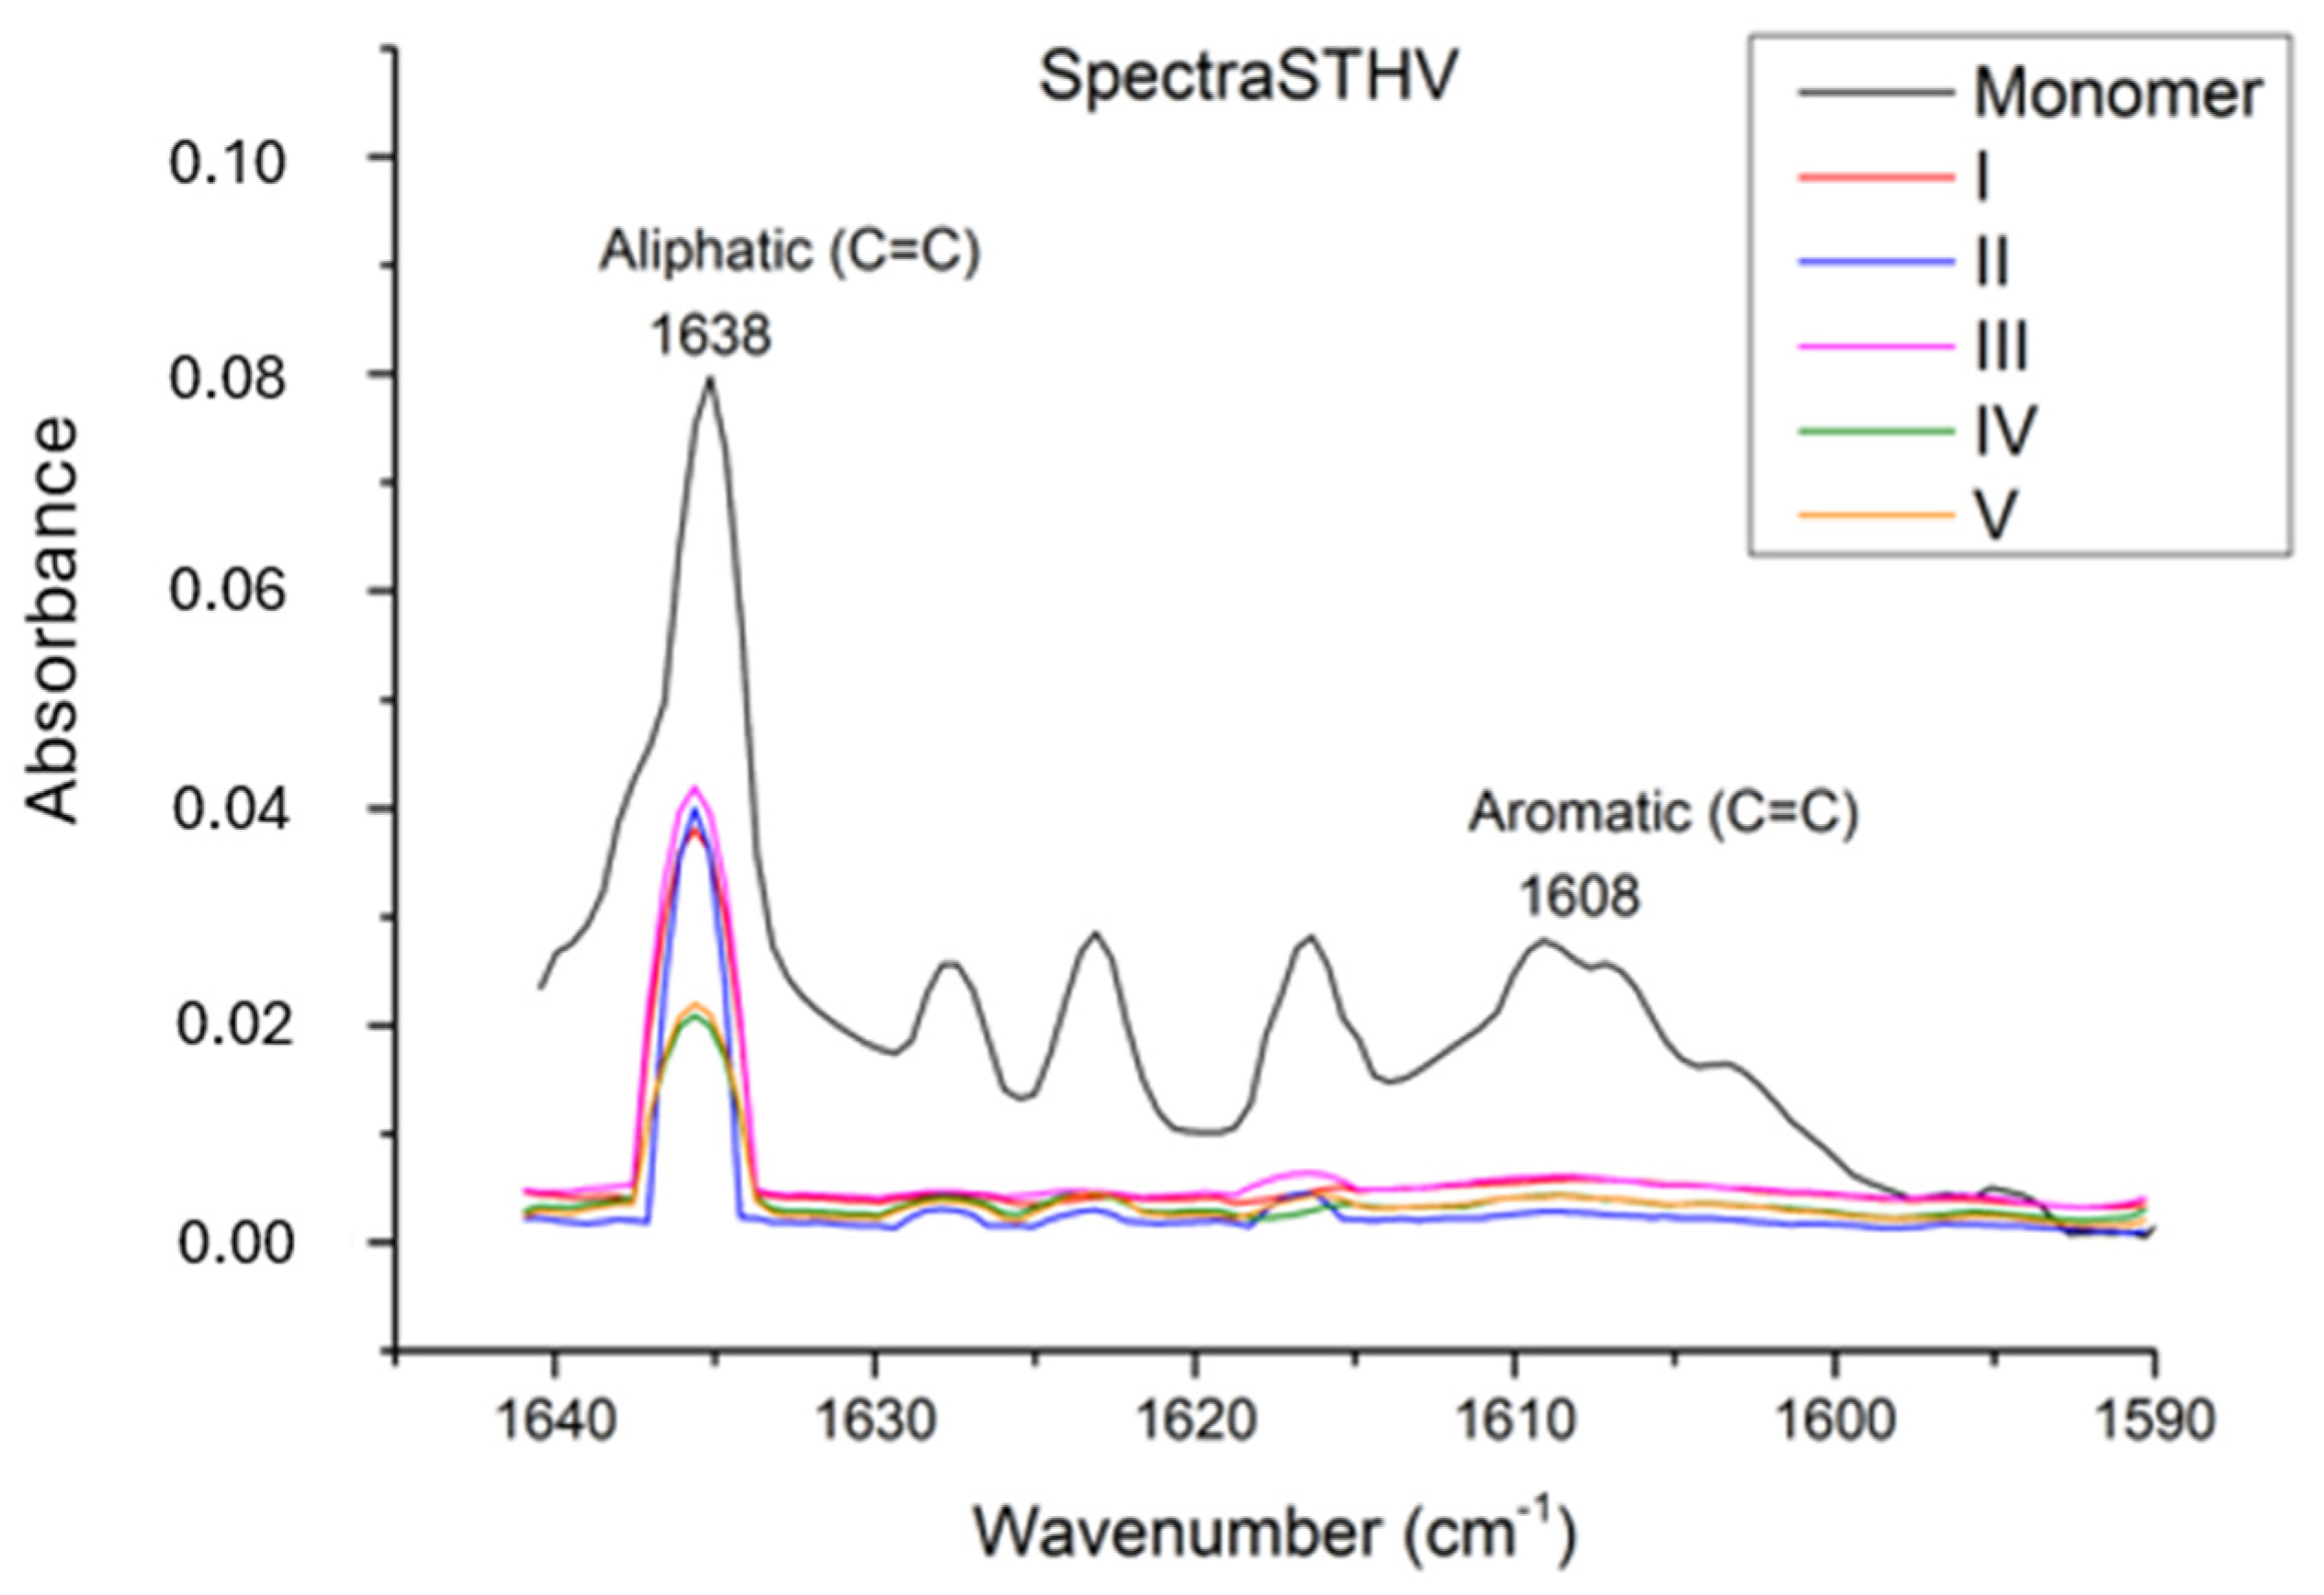
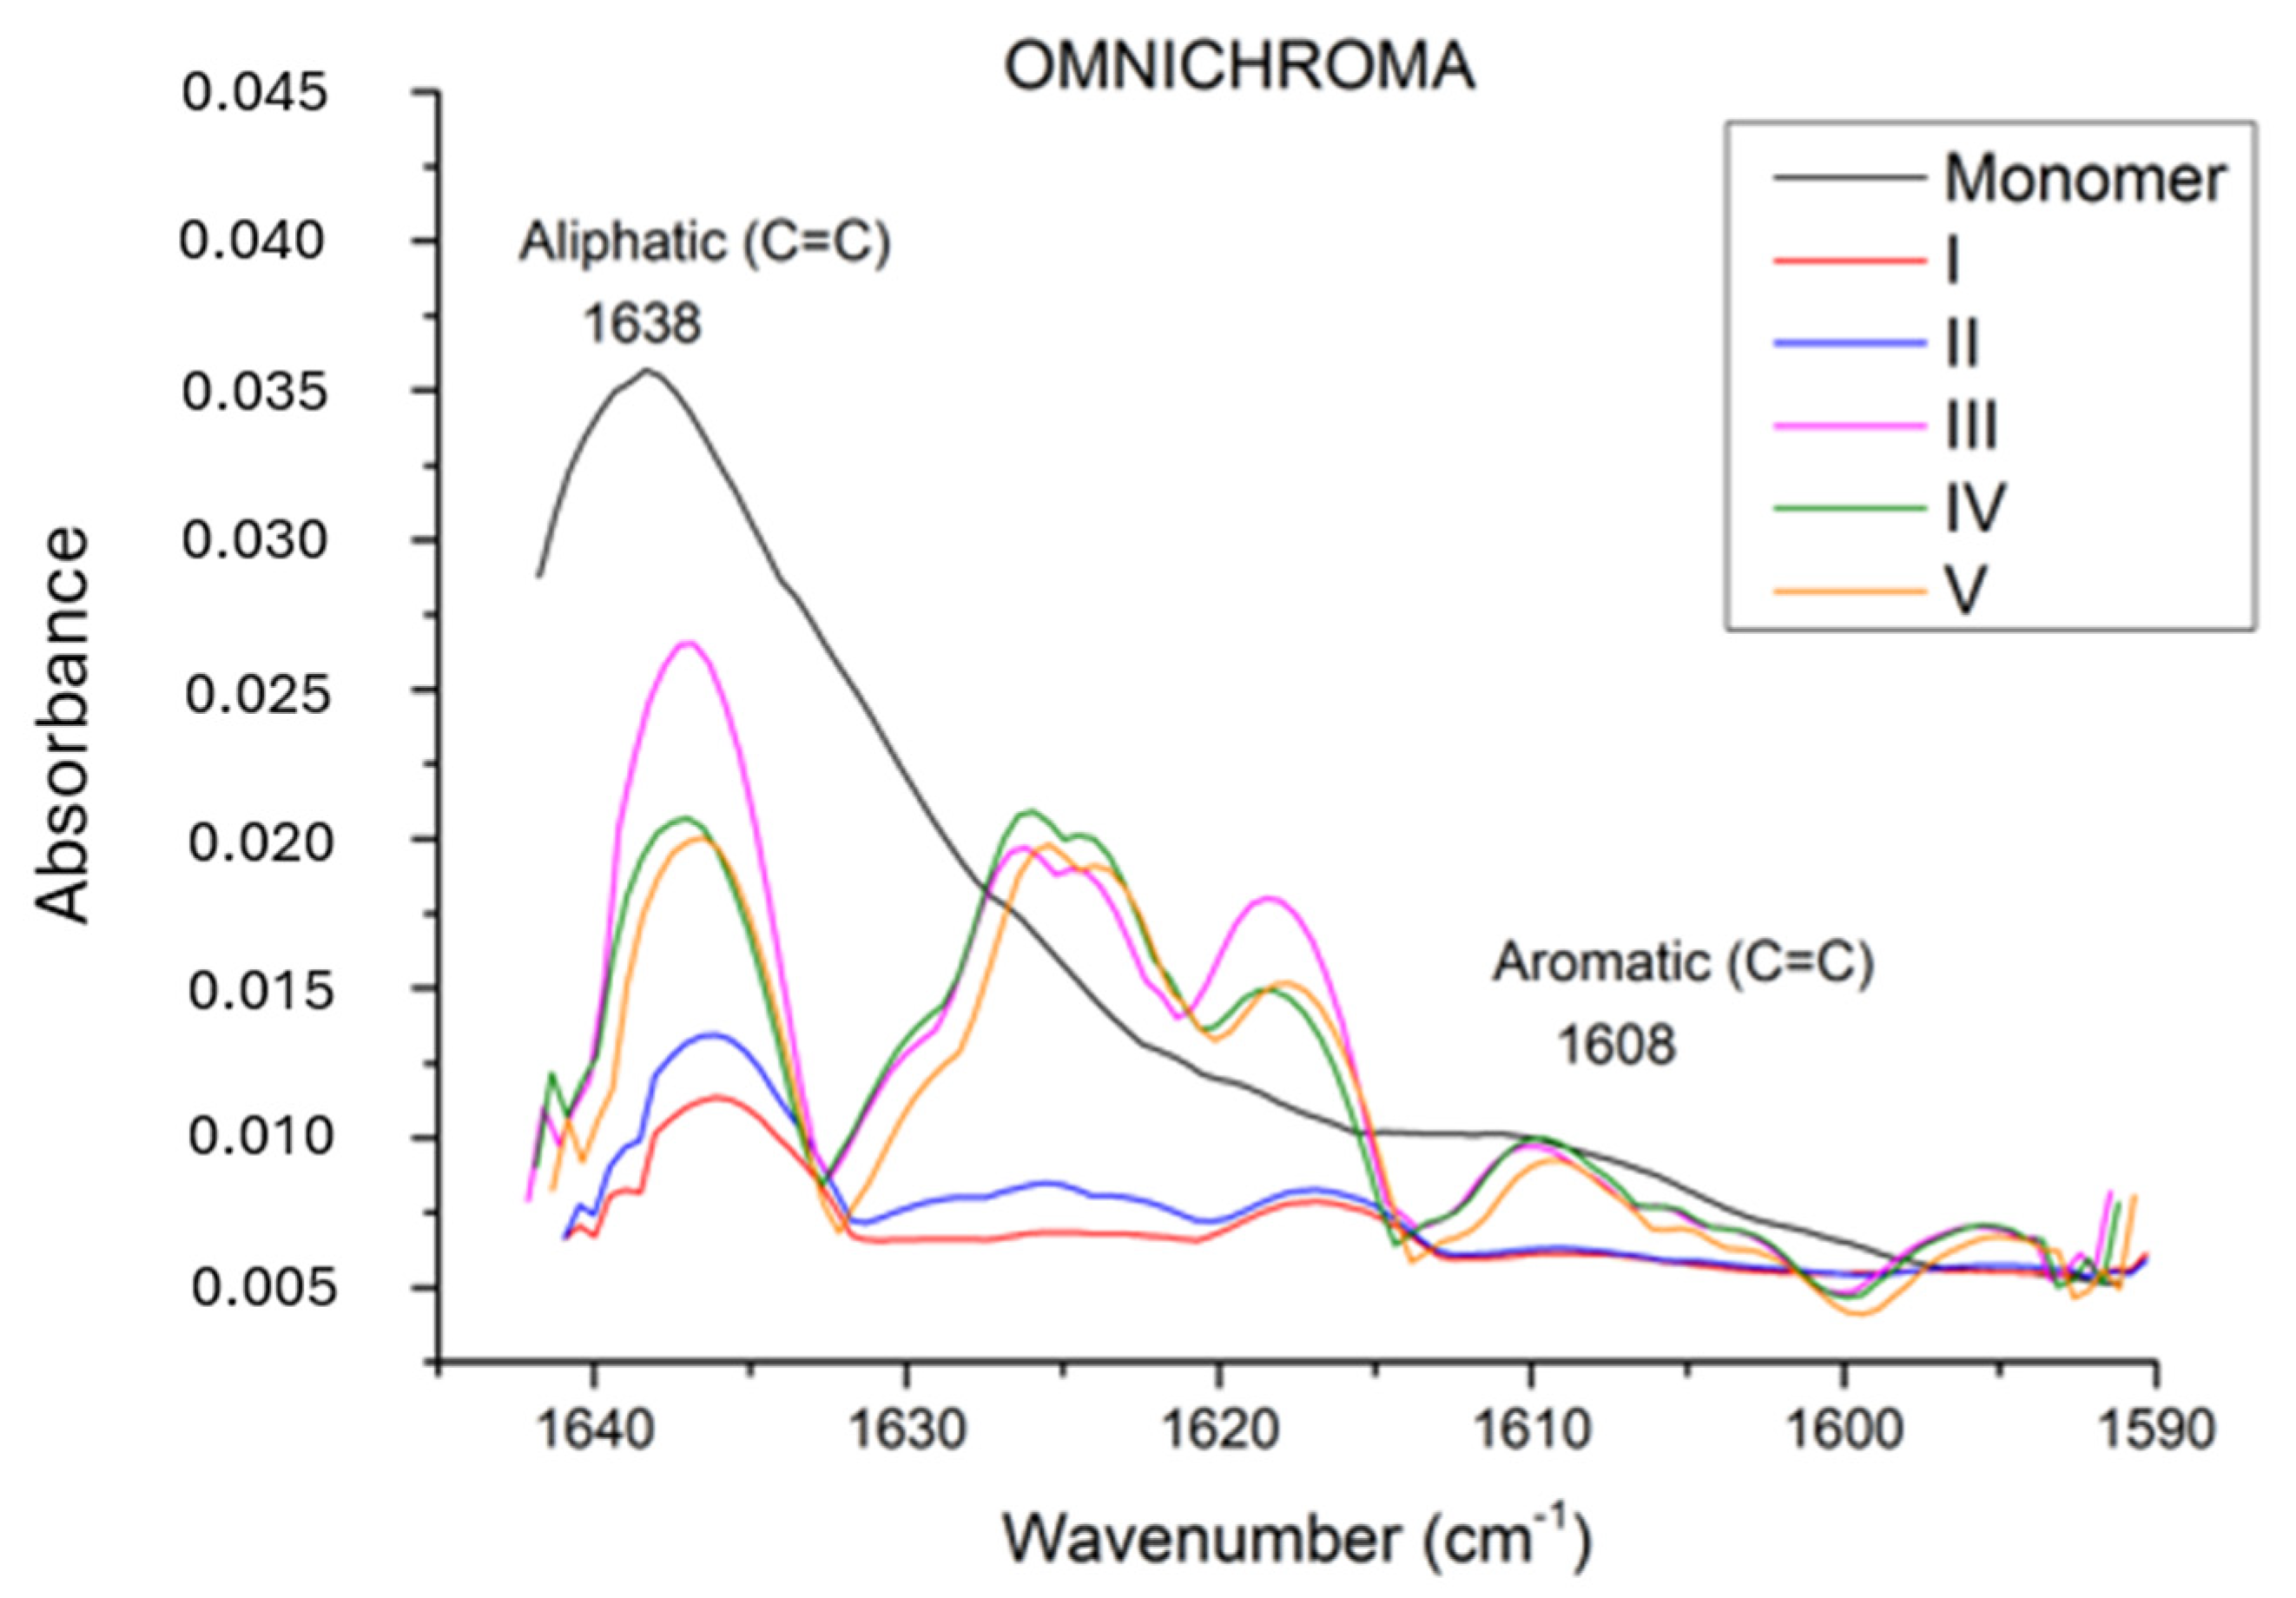
2.3. Analysis of Fourier-Transform Infrared Spectroscopy (FT-IR)

The monomer/polymer conversion degree (DC%) was measured using FT-IR spectroscopy. Composite samples were pulverized using air. Initially, the infrared spectra of unpolymerized and polymerized samples were recorded with a resolution of 2 cm−1. The spectrum in the range of 4000 cm−1 to 400 cm−1 was scanned to determine the conversion degree, focusing on the wave number range of 1560–1670 cm (cm−1). Before each measurement, a background spectrum was obtained for calibration purposes, and the 100% T line was identified. Samples were placed on the crystal of the FTIR device, and ATR-FTIR spectra were recorded in transmission mode. Peaks corresponding to aliphatic (1638 cm−1) and aromatic double bonds (1608 cm−1) were identified for the calculation of the conversion degree. The change in the ratio of aliphatic carbon double bonds was used to calculate the conversion degree using the formula [18]
D C t = 1 A t A m 100 %
  • At: monomer absorbance (post polymerization);
  • Am: monomer absorbance (pre-polymerization).

2.4. Analysis of DSC

Calorimetric analyses were conducted using a differential scanning calorimetry (DSC) instrument in the Department of Biophysics at Bahçeşehir University Faculty of Medicine. The Shimadzu DSC-60 Plus instrument was utilized for calorimetric measurements. Samples of were weighed at 3 mg and placed in sealed aluminum pans. The samples were then heated from 25 °C to a final temperature of 400 °C at a heating rate of 10 °C/min−1 (°C/min). The measurements were performed under a nitrogen atmosphere with a flow rate of 50 mL/min−1 (mL/min). Data obtained from DSC measurements include the peak temperature (T), time (t), heat flow (q) and heat capacity (∆Cp) between the sample pan and reference pan.
The calculated area for the enthalpy change is initially in J/g, which is then converted to kcal/mol. TA60 software (version 8.0) calculates Tm value and Ep value; the energy obtained from the polymerization peak in DSC curves provides valuable information about the residual monomer content in polymers, which can be determined by integrating the area under the peak (see Supplementary Materials for calculation steps).
Molar mass, known ∆Hpol value (The C=C bond requires 60 kJ mol−1 to cleave the π ligation, which is considered the standard enthalpy of polymerization) and the mass value (ma) is the sample mass that is used in DSC measurement [19,20].

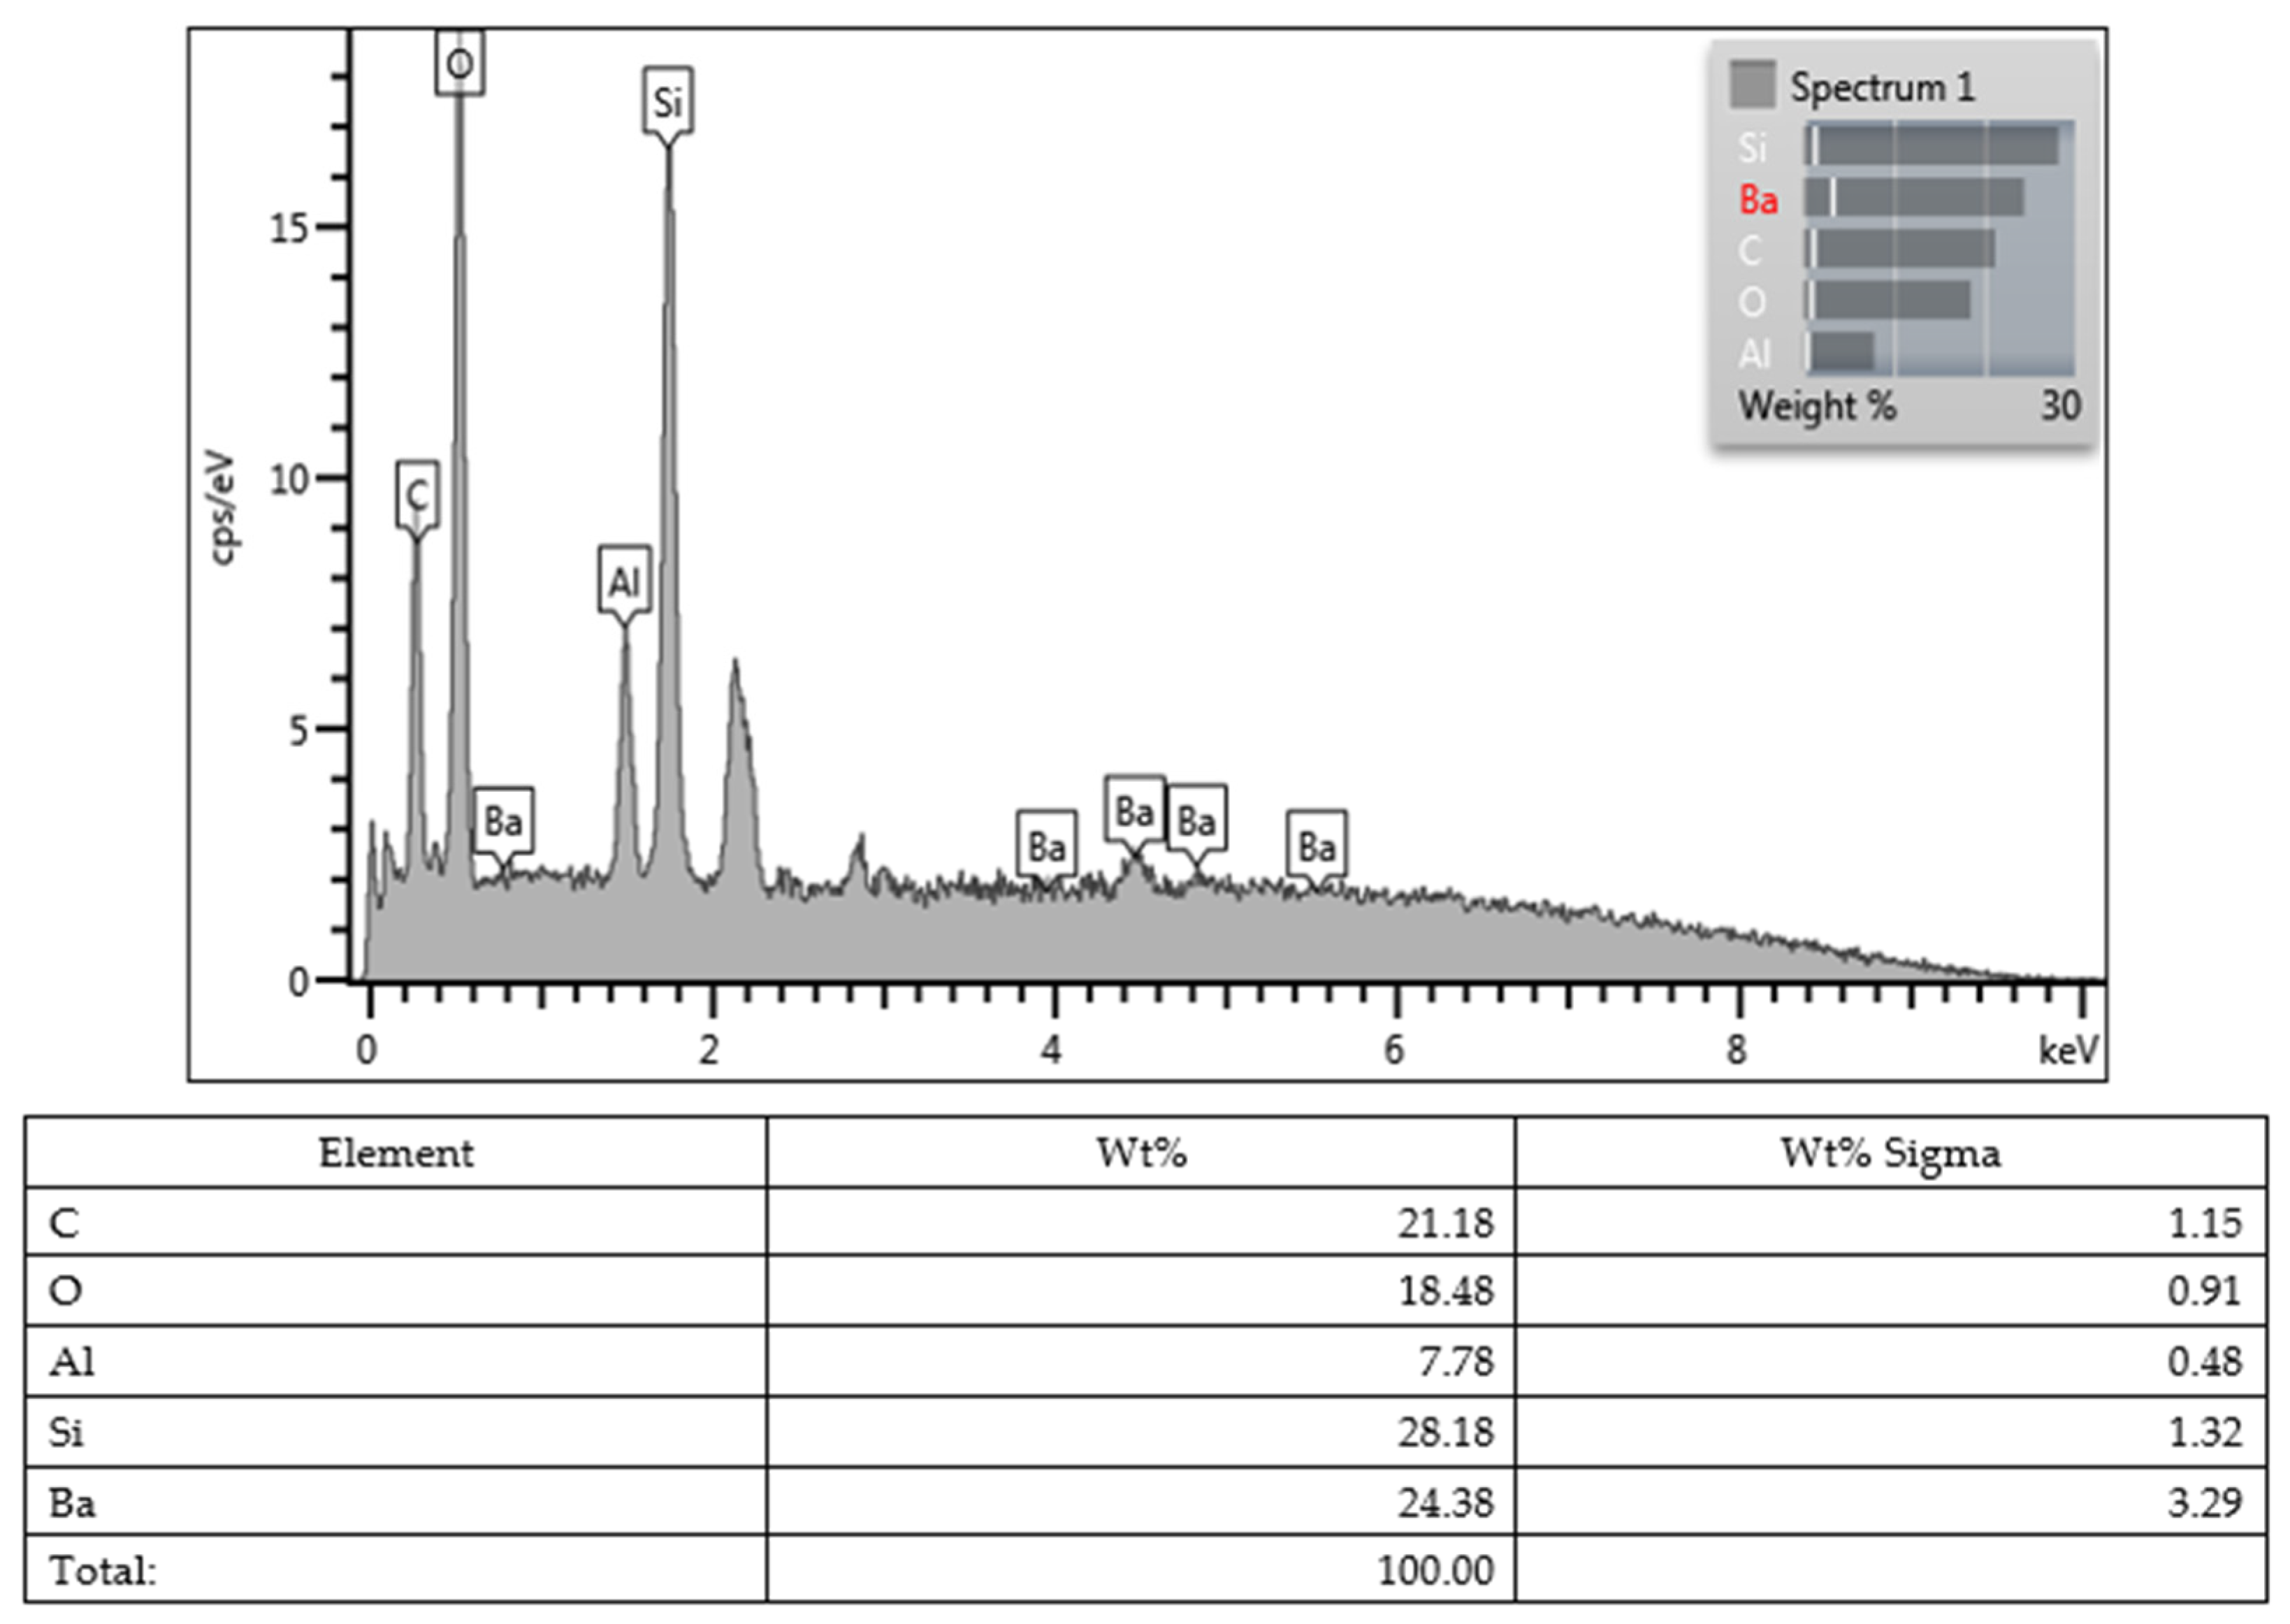
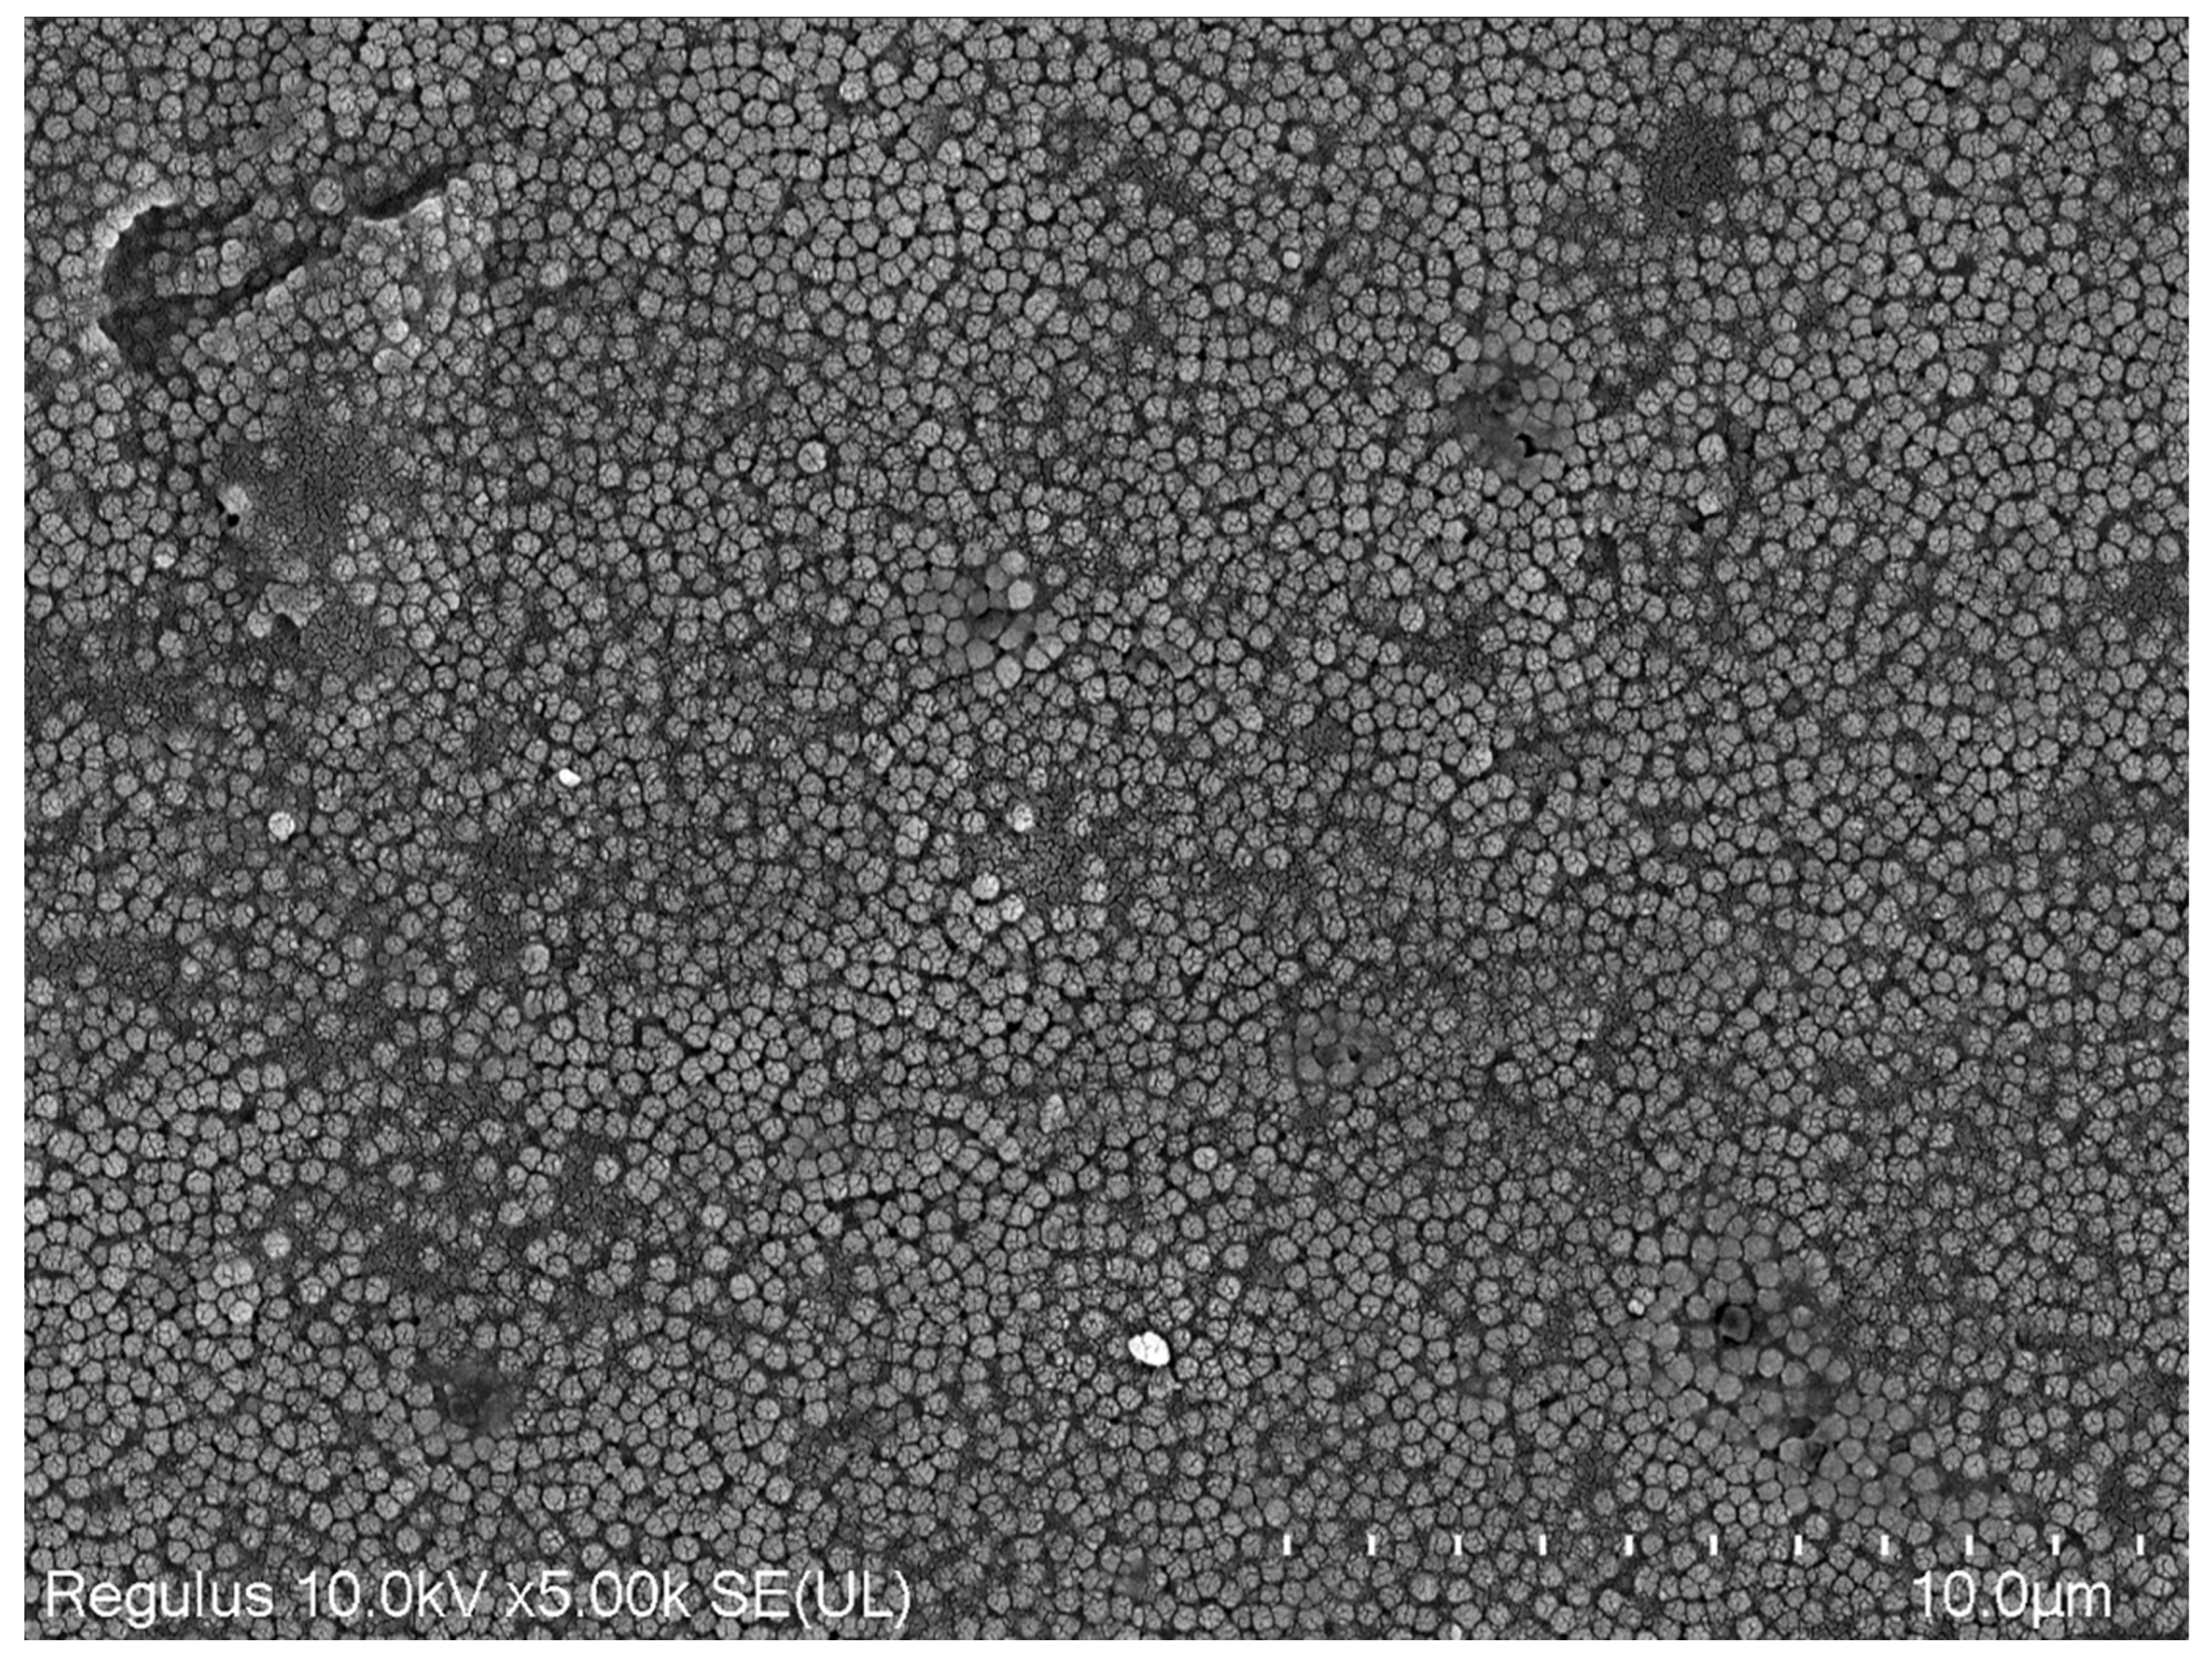
2.5. Scanning Electron Microscope Imaging (SEM) and Energy-Dispersive X-ray (EDX) Analysis

The sample surfaces were first sputter-coated with gold/palladium particles (Leica EM ACE600C, Leica Microsystems Inc., Concord, ON, Canada) to form a film of approximately 6 nm. The surfaces were then examined with an SEM device (Hitachi Regulus 8230 FE-SEM, Ibaraki, Japan) at ×5000 magnification, and images were recorded. The device was operated at 5 kV. Subsequently, the representation of elemental presence in the composites was analyzed using energy-dispersive X-ray spectroscopy (EDX) (X-Max 20, Oxford Instruments, Abingdon, UK).

2.6. Statistical Analysis

The G*Power software package (version 3.1) was utilized for power analysis, and the study’s power, denoted as 1-ß (ß = Type II error probability), was expressed. For a power of 80% at the significance level (α) of 0.05, an acceptable sample error (d) of 1.775075 was adopted, leading to a calculated sample size of at least 5 composite discs in each subgroup (n = 5) [21].
The statistical analysis of the results was performed using GraphPad Prism 5 (GraphPad Software, Boston, MA, USA). The determination of the test to be used for comparing intergroup differences involved checking the appropriateness of the variables’ normal distribution. Since the sample size was less than 50, the Shapiro–Wilk test, along with Q-Q Plots and skewness and kurtosis values, was employed to assess this. The one-way ANOVA test was used to examine differences between means when normal distribution was identified, while the Kruskal–Wallis test was utilized when normal distribution was not observed to assess differences between means. Post hoc comparisons were conducted to identify statistically significant differences between groups. The results were evaluated at a 95% confidence interval, with a significance level of p < 0.05.

3. Results

Statistically significant differences were found among the dental composites in terms of bottom/top surface microhardness values (Table 2). The highest values for top surfaces were observed in Neo Spectra (60.88 ± 3.542), while the lowest value was determined in Myra (54.02 ± 4.323). Regarding the bottom surface, no significant difference was found between Neo Spectra and Omnichroma, while the lowest value was in Myra (50.37 ± 4.607). There were no statistically significant variations in the mean differences of the microhardness values and in the ratio of bottom-to-top surface (Table 2) (p = 0.9368 and p = 0.8354, respectively). Moreover, Neo Spectra emerged as the restorative material with the highest value in terms of the ratio between bottom and top microhardness and the lowest in mean differences. Although the values of the bottom-to-top ratio and mean differences of the other two composite materials were close to those of Neo Spectra and no statistically significant difference was detected, a lower degree of conversion was observed in terms of FT-IR and DSC values (Table 3 and Table 4).
In our study, during polymerization, the degree of conversion of carbon–carbon double bonds (C=C) in monomers to carbon–carbon single bonds (C-C) to form polymer chains is calculated using the FT-IR method. In Figure 1, Figure 2 and Figure 3, FT-IR absorbance values in the range of 1590 to 1640 cm−1 are shown. The monomer absorption band at 1638 cm−1 shows stretching vibration double bonds C=C of aliphatic groups, and an aromatic C=C bond was found at the 1608 cm−1 wavenumber.
According to the FT-IR results, a statistically significant difference was observed among the restorative materials included in the study (Table 3) (p < 0.0001). In terms of conversion rates, the materials were ranked as Neo Spectra > Omnichroma > Myra, with Neo Spectra showing a statistically significant difference compared to the other two restorative materials. However, although the conversion rate of Omnichroma (62.21 ± 4.283) was higher than Myra (54.96 ± 5.729), it did not show a statistically significant difference (p > 0.05). Additionally, the degree of conversion values for each sample obtained through DSC are detailed in Table 4 and Figure 4.
Lastly, all values obtained from the SEM images and EDX character analysis conducted on samples from each group are presented in Figure 5, Figure 6, Figure 7, Figure 8, Figure 9, Figure 10, Figure 11, Figure 12 and Figure 13. The surface characterization analysis of all three composites was conducted separately for the top and bottom surfaces. In the EDX analysis, the weight percentage (wt%) of various elements present on the surface was calculated. When considering the top surfaces, Myra exhibited a total of approximately 52% silicon and barium, with silicon being the most abundant element at around 28.18 wt%. Neo Spectra showed the presence of different elements such as ytterbium and fluorine, with ytterbium being the most predominant at 28.24 wt%. Additionally, aluminum (5.05 wt%), silicon (16.38 wt%), and barium (19.05 wt%) were also detected. In Omnichroma, silicon was found to be the most abundant element at 40.11 wt%. Furthermore, unlike the other two composites, platinum (12.19 wt%) was detected.

4. Discussion

The hypothesis of the study was rejected based on the obtained data. Significant differences were found among all composites statistically in terms of bottom/top microhardness, FT-IR, and DSC values.
The characterization of restorative materials is crucial for their clinical performance and longevity. In this study, the microhardness, degree of conversion (DSC), and Fourier-transform infrared spectroscopy (FT-IR) analyses were conducted to evaluate the properties of Neo Spectra, Omnichroma, and Myra restorative materials.
The term “hardness” denotes the resistance of a material’s surface to penetration and abrasion, as well as its ability to withstand scratches. Various tests, such as Vickers, Knoop, Rockwell, Brinell, or Barcol, are employed to determine the hardness of restorative materials [22]. In the dental literature, the Vickers and Knoop tests are the most commonly used, with the Vickers test being a non-destructive method. In the Vickers test, the area of the shape formed by the diamond indenter on the surface is digitally calculated to measure the materials’ microhardness values. Previous studies have shown that microhardness tests have been conducted using different loads and durations (holding times) [21,23,24]. Following the ISO standard (ISO 4049) established in this field and considering the available literature, microhardness values were measured in the present study using a Vickers test apparatus, with the indenter applying a force of 300 g for 15 s [21,25]. The top and bottom surface microhardness values for Omnichroma and Neo Spectra were higher compared to Myra. It has been reported that Myra may contain nanoparticles in its structure, hence exhibiting slightly better microhardness values compared to its counterparts such as Pergamon and Parion [21]. According to the literature, Neo Spectra has demonstrated average performance compared to other nanohybrids [26]. The presence of spherical pre-polymerized fillers in Neo Spectra and silico-zircon fillers in Omnichroma may have contributed to the better performance of Neo Spectra and Omnichroma compared to Myra, especially in terms of top surface microhardness values. According to the manufacturer, Neo Spectra features a unique patented technology called SphereTEC, which includes a high filler content [27]. Its advanced micro-granular structure has been proven to exhibit superior performance in various physical and mechanical tests [28].
Due to its recent introduction, there are limited publications available in the literature regarding Myra [21]. While it does exhibit statistically significantly lower microhardness values compared to the other two composite materials in this study, it is noteworthy that the values are relatively close.
Microhardness values provide insights into the material’s resistance to indentation and wear, which are critical for its durability in clinical applications. The highest microhardness values observed for Neo Spectra on both top and bottom surfaces suggest its superior mechanical properties compared to Myra. The finding of no significant difference between Neo Spectra and Omnichroma on the bottom surface indicates comparable performance in load-bearing regions.
Resin-based restorative materials can be subjected to material content analysis at various depths and layers, either destructively or non-destructively, using a range of spectroscopic techniques including FT-IR, Raman, ultraviolet light, X-ray, or DSC [29]. Among these methods, FT-IR is commonly favored in the dental literature for assessing DC values. FT-IR analysis allows for the evaluation of the degree of conversion of monomers into polymer chains during polymerization, reflecting the material’s curing efficiency [29,30]. Employing the spectroscopic approach of FT-IR allows for the non-destructive examination of dental materials with minimal material consumption [31]. Through FT-IR, the characteristic vibrations of different groups within a material are identified, and the presence of additional substances is determined by interpreting the peaks in the obtained graph. Each component or bond structure exhibits its specific peak values, revealing interactions between different groups as wavelengths vary. In the realm of dental restorative materials, FT-IR spectra can detect carbon–carbon (C=C)-stretching vibrations both pre- and post-polymerization [29]. Additionally, the microhardness and monomer conversion values of restorative materials may reflect the efficacy of the polymerization process [32]. In addition, by utilizing the thermal properties of polymers, the extent of conversion from monomer to polymer and the amount of unreacted double bonds can be determined. The statistically significant difference among the restorative materials in terms of conversion rates, with Neo Spectra exhibiting the highest conversion, aligns with its superior mechanical performance observed in the microhardness analysis. The presence of aromatic and aliphatic double bonds in the monomers, as indicated by absorption bands at 1608 cm−1 and 1638 cm−1, respectively, underscores the complexity of polymerization reactions in dental composites. DSC analysis complements FT-IR by providing quantitative data on the degree of conversion and polymerization kinetics. Although the conversion rate of Omnichroma was higher than Myra, the absence of a statistically significant difference suggests similar curing efficiencies between these materials. This discrepancy with FT-IR results could be attributed to differences in the sensitivity and resolution of the two techniques, highlighting the importance of using complementary analytical methods for comprehensive material characterization. Moreover, the Tg value identified serves as a crucial parameter for polymer characterization, signifying a region of significant change in the polymer’s physical properties. This value represents the temperature range at which the polymer transitions from a glassy state to a rubber-like material [14,33]. Furthermore, indirect inference regarding monomer conversion can be made by comparing the microhardness measurements of the bottom/top surfaces, thereby establishing a correlation between the two values [34]. The process of ensuring thorough polymerization through irradiation leads to elevated microhardness values on the surfaces of resin materials [35]. This phenomenon arises from the high conversion rate of polymerization in resin-based materials, which is facilitated by a specific energy density [33]. However, the utilization of indirect methods such as microhardness may result in erroneous outcomes, as they do not directly determine the number of unreacted carbon double bonds [36]. Our findings suggest that polymerization appears to be quite effective based on the bottom/top microhardness values of the three dental composites. However, direct output from FT-IR and DSC methods contradicts this observation. Essentially, our findings underscore the importance of not overlooking the potential margin of error in indirect methods. Merely assessing ratios should not be considered indicative of sufficient monomer conversion of resin-based materials.
Each monomer possesses its own unique viscosity and flexibility, directly influencing the degree of conversion for dental composites [37]. While BIS-GMA exhibits a lower conversion rate compared to other monomers, TEGDMA has been found to have the highest conversion rate among monomers. Additionally, UDMA and BIS-EMA demonstrate better degree of conversion compared to BIS-GMA [38,39]. Furthermore, the combination of TEGDMA and BIS-GMA increases the material’s sensitivity to aqueous environments [40]. If a composite contains a nano content, it may affect BIS-GMA, thereby increasing the monomer conversion efficiency [41]. Based on this, although Myra exhibits a statistically significant difference compared to the other two composites, its closer proximity to Omnichroma in terms of degree of conversion could be attributed to this reason. Incomplete monomer conversion in dental composites leads to various disadvantages such as secondary caries, postoperative sensitivity, and the need for root canal treatment [42]. Unreacted monomers pose a threat to oral health and their release can induce cytotoxicity even at very low concentrations. It has been observed that up to 30 min following the completion of composite restoration, residual monomers and other degradation products can be isolated from saliva to peak levels. In addition, degradation products can be released into the oral environment for up to 24 h [43]. Partially polymerized monomers secondarily foster bacterial adhesion on surfaces, consequently promoting the development of dental plaque [44].
The most common strategy employed clinically to maximize the degree of conversion and minimize monomer release involves increasing the light application time to reach the required energy level. Some studies conducted with commercially available composites emphasize that even with high-power LEDs, a minimum of 20 s of light application is necessary to minimize monomer release, with 40 s of light application being considered more ideal [45,46,47]. In the present study, to ensure standardization, the polymerization time was limited to 20 s in accordance with the manufacturer’s instructions.
The imaging of specimen surfaces through the electron microscopy technique, a process resulting from the interaction of electrons with the sample, is accomplished by generating topological images. In this way, making the invisible visible is achieved, and additionally, through energy-dispersive X-ray spectroscopy, X-rays emitted from the specimens are detected, enabling not only imaging, but also character analysis [48]. EDX spectroscopy is involved in the determination of the elemental composition of matter using a scanning electron microscope. EDX can detect elements with higher atomic numbers than boron, and these elements can be detected even at very low concentrations. The applications of EDX include material assessment and identification, contamination detection, and quality control screening [48]. Surface characterization through SEM and EDX analysis provides valuable information about the elemental composition and morphology of the restorative materials. The presence of silicon, barium, and ytterbium in varying proportions reflects the diverse filler compositions and surface chemistries of Neo Spectra, Omnichroma, and Myra. The detection of platinum in Omnichroma suggests the incorporation of novel additives or filler treatments, which may contribute to its unique mechanical and optical properties.
Variations in both the organic and inorganic structures of dental composites give rise to different mechanical properties. The utilization of DSC for the detection of the monomer conversion rate demonstrates consistency with the FT-IR method, thus solidifying the position of DSC among alternative testing techniques. However, the comparison of bottom/top surface microhardness may not always yield accurate findings. In the literature, only a scant number of studies have employed the DSC method for measuring monomer conversion in dental composites [14,49]. Upon analyzing the data, it was observed that the average value obtained from the DSC measurements closely resembled that of the FT-IR.
In conclusion, the comprehensive characterization of Neo Spectra, Omnichroma, and Myra restorative materials revealed significant differences in mechanical properties, curing efficiency, and elemental composition. These findings contribute to the understanding of their performance characteristics and facilitate informed decision-making in dental restoration procedures.

Supplementary Materials

The following supporting information can be downloaded at: https://www.mdpi.com/article/10.3390/app14114406/s1.

Author Contributions

M.K.U.: conceptualization, methodology, software, investigation, data curation, project administration, writing—original draft, and reviewing and editing. O.C.: formal analysis, methodology, investigation, resources, data curation, writing—original draft, and reviewing and editing. E.S.: data curation, methodology, investigation, and resources, writing—original draft. Y.Y.Y.: validation, supervision, resources, and reviewing and editing. B.D.: methodology, investigation, data curation, resources, visualization, writing—original draft, and reviewing and editing. All authors have read and agreed to the published version of the manuscript.

Funding

This research received no external funding.

Institutional Review Board Statement

Not applicable.

Informed Consent Statement

Not applicable.

Data Availability Statement

The raw data and ANOVA tables are provided as Supplementary Materials files.

Conflicts of Interest

The authors declare no conflicts of interest.

References

  1. Ritter, A.V. Direct resin-based composites: Current recommendations for optimal clinical results. Compendium 2006, 26, 369–377. [Google Scholar]
  2. Senawongse, P.; Pongprueksa, P. Surface roughness of nanofill and nanohybrid resin composites after polishing and brushing. J. Esthet. Restor. Dent. 2007, 19, 265–273. [Google Scholar] [CrossRef] [PubMed]
  3. Rawls, H.R.; Esquivel-Upshaw, J.F. Restorative resins. In Phillips’ Science of Dental Materials; Anusavice, K.J., Ed.; Elsevier Health Sciences: Amsterdam, The Netherlands, 2003. [Google Scholar]
  4. Dalli’Magro, E.; Sinhoreti, M.A.C.; Correr, A.B.; Consani, R.L.X.; Sicoli, E.A.; Mendoça, M.J.; Correr-Sobrinho, L. Effect of different modes of light modulation on the bond strength and knoop hardness of a dental composite. Braz. Dent. J. 2008, 19, 334–340. [Google Scholar] [CrossRef] [PubMed]
  5. Ribeiro, B.C.I.; Boaventura, J.M.C.; Brito-Gonçalves, J.D.; Rastelli, A.N.D.S.; Bagnato, V.S.; Saad, J.R.C. Degree of conversion of nanofilled and microhybrid composite resins photo-activated by different generations of LEDs. J. Appl. Oral Sci. 2012, 20, 212–217. [Google Scholar] [CrossRef] [PubMed]
  6. Porto, I. Post-operative sensitivity in direct resin composite restorations: Clinical practice guidelines. IJRD 2012, 1, 1–12. [Google Scholar]
  7. Alla, R.K.; Sanka, G.S.S.J.; Saridena, U.S.N.G.; Av, R.; Makv, R.; Mantena, S.R. Fiber-Reinforced Composites in Dentistry: Enhancing structural integrity and aesthetic appeal. Int. J. Dent. Mater. 2023, 5, 78–85. [Google Scholar] [CrossRef]
  8. Albers, H.F. Tooth-Colored Restoratives: Principles and Techniques; PMPH-USA: Shelton, CT, USA, 2002. [Google Scholar]
  9. Moraschini, V.; Fai, C.K.; Alto, R.M.; Dos Santos, G.O. Amalgam and resin composite longevity of posterior restorations: A systematic review and meta-analysis. J. Dent. 2015, 43, 1043–1050. [Google Scholar] [CrossRef] [PubMed]
  10. Cho, K.; Rajan, G.; Farrar, P.; Prentice, L.; Prusty, B.G. Dental resin composites: A review on materials to product realizations. Compos. Part B Eng. 2022, 230, 109495. [Google Scholar] [CrossRef]
  11. Singh, P.; Kumar, N.; Singh, R.; Kiran, K.; Kumar, S. Overview and recent advances in composite resin: A review. Int. J. Sci. Stud. 2015, 3, 169–172. [Google Scholar]
  12. El-Banna, A.; Sherief, D.; Fawzy, A.S. Resin-based dental composites for tooth filling. In Advanced Dental Biomaterials; Elsevier: Amsterdam, The Netherlands, 2019; pp. 127–173. [Google Scholar]
  13. Moraes, L.G.P.; Rocha, R.S.F.; Menegazzo, L.M.; de Araújo, E.B.; Yukimito, K.; Moraes, J.C.S. Infrared spectroscopy: A tool for determination of the degree of conversion in dental composites. J. Appl. Oral Sci. 2008, 16, 145–149. [Google Scholar] [CrossRef]
  14. Costa, S.X.S.; Galvao, M.R.; Jacomassi, D.P.; Bernardi, M.I.B.; Hernandes, A.C.; de Souza Rastelli, A.N.; Andrade, M.F. Continuous and gradual photo-activation methods: Influence on degree of conversion and crosslink density of composite resins. J. Therm. Anal. Calorim. 2011, 103, 219–227. [Google Scholar] [CrossRef]
  15. Larkin, P. Infrared and Raman Spectroscopy: Principles and Spectral Interpretation; Elsevier: Amsterdam, The Netherlands, 2017. [Google Scholar]
  16. Galvão, M.R.; Caldas, S.G.F.R.; Bagnato, V.S.; de Souza Rastelli, A.N.; de Andrade, M.F. Evaluation of degree of conversion and hardness of dental composites photo-activated with different light guide tips. Eur. J. Dent. 2013, 7, 86. [Google Scholar] [PubMed]
  17. Seredin, P.; Goloshchapov, D.; Ippolitov, Y.; Vongsvivut, J. Engineering of a biomimetic interface between a native dental tissue and restorative composite and its study using synchrotron FTIR microscopic mapping. Int. J. Mol. Sci. 2021, 22, 6510. [Google Scholar] [CrossRef] [PubMed]
  18. Kwaśny, M.; Polkowski, J.; Bombalska, A. A study on the photopolymerization kinetics of selected dental resins using Fourier Infrared Spectroscopy (FTIR). Materials 2022, 15, 5850. [Google Scholar] [CrossRef] [PubMed]
  19. Miyazaki, K.; Horibe, T. Polymerization of multifunctional methacrylates and acrylates. J. Biomed. Mater. Res. 1988, 22, 1011–1022. [Google Scholar] [CrossRef] [PubMed]
  20. Morgan, D.R.; Kalachandra, S.; Shobha, H.K.; Gunduz, N.; Stejskal, E.O. Analysis of a dimethacrylate copolymer (Bis-GMA and TEGDMA) network by DSC and 13C solution and solid-state NMR spectroscopy. Biomaterials 2000, 21, 1897–1903. [Google Scholar] [CrossRef] [PubMed]
  21. Yildirim Ucuncu, M.; Ucuncu, M.K. Comparison of the Mechanical Properties of Various Microhybrid Dental Composites. Eurasian Dent. Res. 2023, 1, 58–64. [Google Scholar]
  22. Sakaguchi, R.; Ferracane, J.; Powers, J. Testing of Dental Materials and Biomechanics. In Craig’s Restorative Dental Materials, 14th ed.; Elsevier: Amsterdam, The Netherlands, 2019; pp. 75–77. [Google Scholar]
  23. Kutuk, Z.B.; Erden, E.; Aksahin, D.L.; Durak, Z.E.; Dulda, A.C. Influence of modeling agents on the surface properties of an esthetic nano-hybrid composite. Restor. Dent. Endod. 2020, 45, e13. [Google Scholar] [CrossRef]
  24. Tuncer, S.; Demirci, M.; Tiryaki, M.; Ünlü, N.; Uysal, Ö. The effect of a modeling resin and thermocycling on the surface hardness, roughness, and color of different resin composites. J. Esthet. Restor. Dent. 2013, 25, 404–419. [Google Scholar] [CrossRef]
  25. ISO B. 4049: 2019; Dentistry—Polymer-Based Restorative Materials. ISO: Geneva, Switzerland, 2019.
  26. Gurgan, S.; Koc Vural, U.; Miletic, I. Comparison of mechanical and optical properties of a newly marketed universal composite resin with contemporary universal composite resins: An in vitro study. Microsc. Res. Tech. 2022, 85, 1171–1179. [Google Scholar] [CrossRef]
  27. Joshi, C.; Patel, D.; Shah, M.; Patel, A.; Khunt, A.; Kanabar, A.K. Comparative Evaluation of The Effects of Different Alcoholic Beverages and Sports/Energy Drinks on the Surface Roughness of a Recently Marketed Universal Nanohybrid with a Nano-Filled Composite Resin. J. Pharm. Negat. Results 2022, 13, 2423–2429. [Google Scholar]
  28. Preethy, N.A.; Jeevanandan, G.; Govindaraju, L.; Subramanian, E.M.G. Comparison of shear bond strength of three commercially available esthetic restorative composite materials: An in vitro study. Int. J. Clin. Pediatr. Dent. 2020, 13, 635. [Google Scholar] [PubMed]
  29. Kaczmarek, K.; Leniart, A.; Lapinska, B.; Skrzypek, S.; Lukomska-Szymanska, M. Selected spectroscopic techniques for surface analysis of dental materials: A narrative review. Materials 2021, 14, 2624. [Google Scholar] [CrossRef]
  30. Acquaviva, P.A.; Cerutti, F.; Adami, G.; Gagliani, M.; Ferrari, M.; Gherlone, E.; Cerutti, A. Degree of conversion of three composite materials employed in the adhesive cementation of indirect restorations: A micro-Raman analysis. J. Dent. 2009, 37, 610–615. [Google Scholar] [CrossRef] [PubMed]
  31. Dutta, A. Fourier transform infrared spectroscopy. In Spectroscopic Methods for Nanomaterials Characterization; Elsevier: Amsterdam, The Netherlands, 2017; pp. 73–93. [Google Scholar]
  32. Moore, B.K.; Platt, J.A.; Borges, G.; Chu, T.M.G.; Katsilieri, I. Depth of cure of dental resin composites: ISO 4049 depth and microhardness of types of materials and shades. Oper. Dent. 2008, 33, 408–412. [Google Scholar] [CrossRef] [PubMed]
  33. Dewaele, M.; Asmussen, E.; Peutzfeldt, A.; Munksgaard, E.C.; Benetti, A.R.; Finné, G.; Devaux, J. Influence of curing protocol on selected properties of light-curing polymers: Degree of conversion, volume contraction, elastic modulus, and glass transition temperature. Dent. Mater. 2009, 25, 1576–1584. [Google Scholar] [CrossRef] [PubMed]
  34. Pollington, S.; Kahakachchi, N.; van Noort, R. The influence of plastic light cure sheaths on the hardness of resin composite. Oper. Dent. 2009, 34, 741–745. [Google Scholar] [CrossRef]
  35. Mazhari, F.; Ajami, B.; Moazzami, S.M.; Baghaee, B.; Hafez, B. Microhardness of composite resin cured through different primary tooth thicknesses with different light intensities and curing times: In vitro study. Eur. J. Dent. 2016, 10, 203–209. [Google Scholar] [CrossRef] [PubMed]
  36. Marovic, D.; Panduric, V.; Tarle, Z.; Ristic, M.; Sariri, K.; Demoli, N.; Prskalo, K. Degree of conversion and microhardness of dental composite resin materials. J. Mol. Struct. 2013, 1044, 299–302. [Google Scholar] [CrossRef]
  37. Dickens, S.H.; Stansbury, J.W.; Choi, K.M.; Floyd, C.J.E. Photopolymerization kinetics of methacrylate dental resins. Macromolecules 2003, 36, 6043–6053. [Google Scholar] [CrossRef]
  38. Sideridou, I.; Tserki, V.; Papanastasiou, G. Effect of chemical structure on degree of conversion in light-cured dimethacrylate-based dental resins. Biomaterials 2002, 23, 1819–1829. [Google Scholar] [CrossRef] [PubMed]
  39. Yıldırım, Z.S.; Eyiler, E.; Kürklü, Z.G.B. Effect of thickness on the degree of conversion, monomer elution, depth of cure and cytotoxicity of bulk-fill composites. J. Oral Sci. 2023, 65, 121–126. [Google Scholar] [CrossRef] [PubMed]
  40. Sandner, B.; Baudach, S.; Davy, K.E.A.; Braden, M.; Clarke, R.L. Synthesis of BISGMA derivatives, properties of their polymers and composites. J. Mater. Sci. Mater. Med. 1997, 8, 39–44. [Google Scholar] [CrossRef]
  41. Kim, K.I.; Kim, D.A.; Patel, K.D.; Shin, U.S.; Kim, H.W.; Lee, J.H.; Lee, H.H. Carbon nanotube incorporation in PMMA to prevent microbial adhesion. Sci. Rep. 2019, 9, 4921. [Google Scholar] [CrossRef] [PubMed]
  42. Opdam, N.J.M.; Bronkhorst, E.M.; Loomans, B.A.C.; Huysmans, M.-C. 12-year survival of composite vs. amalgam restorations. J. Dent. Res. 2010, 89, 1063–1067. [Google Scholar] [CrossRef]
  43. Vervliet, P.; De Nys, S.; Duca, R.C.; Boonen, I.; Godderis, L.; Elskens, M.; Covaci, A. Degradation products of resin-based materials detected in saliva in vivo. Clin. Oral Investig. 2023, 27, 7189–7198. [Google Scholar] [CrossRef]
  44. Brambilla, E.; Gagliani, M.; Ionescu, A.; Fadini, L.; García-Godoy, F. The influence of light-curing time on the bacterial colonization of resin composite surfaces. Dent. Mater. 2009, 25, 1067–1072. [Google Scholar] [CrossRef] [PubMed]
  45. Kopperud, H.M.; Johnsen, G.F.; Lamolle, S.; Kleven, I.S.; Wellendorf, H.; Haugen, H.J. Effect of short LED lamp exposure on wear resistance, residual monomer and degree of conversion for Filtek Z250 and Tetric EvoCeram composites. Dent. Mater. 2013, 29, 824–834. [Google Scholar] [CrossRef]
  46. Polydorou, O.; Trittler, R.; Hellwig, E.; Kümmerer, K. Elution of monomers from two conventional dental composite materials. Dent. Mater. 2007, 23, 1535–1541. [Google Scholar] [CrossRef]
  47. Durner, J.; Obermaier, J.; Draenert, M.; Ilie, N. Correlation of the degree of conversion with the amount of elutable substances in nano-hybrid dental composites. Dent. Mater. 2012, 28, 1146–1153. [Google Scholar] [CrossRef]
  48. Abd Mutalib, M.; Rahman, M.A.; Othman, M.H.D.; Ismail, A.F.; Jaafar, J. Scanning electron microscopy (SEM) and energy-dispersive X-ray (EDX) spectroscopy. In Membrane Characterization; Elsevier: Amsterdam, The Netherlands, 2017; pp. 161–179. [Google Scholar]
  49. Cotti, E.; Scungio, P.; Dettori, C.; Ennas, G. Comparison of the degree of conversion of resin based endodontic sealers using the DSC technique. Eur. J. Dent. 2011, 5, 131–138. [Google Scholar] [CrossRef] [PubMed]
Figure 1. Graphic of absorption spectrum in the FT–IR for Myra.
Applsci 14 04406 g001
Figure 2. Graphic of absorption spectrum in the FT–IR for Neo Spectra ST HV.
Applsci 14 04406 g002
Figure 3. Graphic of absorption spectrum in the FT–IR for Omnichroma.
Applsci 14 04406 g003
Figure 4. DSC curves of the dental composites: Myra (left), Spectra ST HV (middle), Omnichroma (right).
Applsci 14 04406 g004
Figure 5. Myra (top).
Applsci 14 04406 g005
Figure 6. Myra (bottom).
Applsci 14 04406 g006
Figure 7. Neo Spectra ST HV (top).
Applsci 14 04406 g007
Figure 8. Neo Spectra ST HV (bottom).
Applsci 14 04406 g008
Figure 9. Omnichroma (top).
Applsci 14 04406 g009
Figure 10. Omnichroma (bottom).
Applsci 14 04406 g010
Figure 11. SEM image of Myra.
Applsci 14 04406 g011
Figure 12. SEM image of Neo Spectra ST HV.
Applsci 14 04406 g012
Figure 13. SEM image of Omnichroma.
Applsci 14 04406 g013
Table 1. List of contents of the dental composites.
Brand Name of the Dental CompositeManufacturerContains
(Organic/Inorganic)
Recommended Polymerization Technique
Myra (Microhybrid)
(A)
Dentac,
Istanbul,
Turkey
BIS-GMA
BIS-EMA
UDMA
TEGDMA/inorganic filler, silica and quartz
≥800: 20 s
Neo SpectraST HV (Nanohybrid)
(B)
Dentsply,
Charlotte, NC,
USA
Methacrylate modified polysiloxane,
Dimethacrylate resins,
Ethyl-4(dimethylamino) benzoate
Bis-(4-methyl-phenyl)-iodonium hexafluorophosphate/78–80 wt% filler load spherical pre-polymerized fillers, non-agglomerated barium glass and ytterbium fluoride
≥550: 20 s
≥800: 10 s
for 2 mm incremental depth
Omnichroma
(Nanohybrid)
(C)
Tokuyama Corporation
Tokyo,
Japan
1,6-bis(methacryl-ethyloxycarbonylamino) trimethyl hexane (UDMA), Triethylene glycol dimethacrylate (TEGDMA), Mequinol, Dibutyl hydroxyl toluene and UV absorber/79% by weight (68% by volume) of spherical silica-zirconia filler (mean particle size: 0.3 μm, particle size range: 0.2 to 0.4 μm) and composite filler.For both LED and halogen curing lights, there are varying intensities and curing times at different depths
Abbreviations: BIS-GMA: Bisphenol A-glycidyl methacrylate, BIS-EMA: Ethoxylated bisphenol-A-dimethacrylate UDMA: Urethane dimethacrylate, TEGDMA: Triethylene glycol dimethacrylate.
Table 2. Bottom/top microhardness values of dental composites.
Dental CompositeTop Surface
Mean ± SD
(Min-Max)
Bottom Surface
Mean ± SD
(Min-Max)
Mean Differences
Mean ± SD
(Min-Max)
Ratio
(%)
Myra (A)54.02 ± 4.323
(45.60–60.00)
50.37 ± 4.607
(44.30–57.10)
3.653 ± 5.123
(−3.800–11.00)
93.58 ± 9.225
(81.08–107.3)
Neo Spectra (B)60.88 ± 3.542
(56.60–68.00)
57.91 ± 4.310
(50.80–65.00)
2.967 ± 5.753
(−8.400–9.800)
95.45 ± 9.446
(83.83–114.8)
Omnichroma (C)59.38 ± 3.914
(53.30–66.00)
56.09 ± 3.504
(49.50–61.10)
3.287 ± 4.313
(−2.000–15.00)
94.73 ± 6.883
(76.92–103.8)
pA–B: <0.001 *
A–C: 0.0016 *
B–C: >0.05
A–B: <0.001 *
A–C: 0.0015 *
B–C: >0.05
 
0.9368
 
 
0.8354
 
* p < 0.05; One-way ANOVA test (Tukey’s multiple comparisons); Kruskal–Wallis test (Dunnett’s correction).
Table 3. Calculation of FT-IR values for the dental composites as a percentage.
Dental CompositeFT-IR (%)
Mean ± SD
(Min-Max)
p
Myra (A)54.96 ± 5.729
(46.86–60.01)
A–B: <0.0001 *
A–C: >0.05
B–C: <0.0001 *
Neo Spectra (B)95.06 ± 3.355
(91.84–99.85)
Omnichroma (C)62.21 ± 4.283
(55.17–66.76)
* p < 0.05; One-way ANOVA test (Tukey’s multiple comparisons).
Table 4. Degree of conversion for the dental composites via DSC method.
Dental CompositeDSC (%)
Mean
Standard Deviation
Myra67.634.1
Neo Spectra94.442.3
Omnichroma76.114.4
Disclaimer/Publisher’s Note: The statements, opinions and data contained in all publications are solely those of the individual author(s) and contributor(s) and not of MDPI and/or the editor(s). MDPI and/or the editor(s) disclaim responsibility for any injury to people or property resulting from any ideas, methods, instructions or products referred to in the content.

