Article

The Total Phenolic Content and Antioxidant Activity of Nine Monofloral Honey Types

Laboratory of Apiculture-Sericulture, Aristotle University of Thessaloniki, Aristotle Farm, 57001 Thermi, Greece
*
Author to whom correspondence should be addressed.
Appl. Sci. 2024, 14(10), 4329; https://doi.org/10.3390/app14104329
Submission received: 9 April 2024 / Revised: 14 May 2024 / Accepted: 18 May 2024 / Published: 20 May 2024

Abstract

:
Honey is well known for its antioxidant and antimicrobial properties, which significantly contribute to its high demand among consumers. While there is plenty of information available about the antioxidant potential of honey, there is still a lack of research specifically focused on monofloral honeys, as most studies have been based on market samples. To address this issue, in the present study we analyzed the total phenolic content and antioxidant activity of nine monofloral honey types produced in Greece: fir, chestnut, citrus, erica, cotton, Jerusalem thorn, pine, oak and thyme, in comparison with manuka honey. The samples were collected from beekeepers applying the appropriate beekeeping practices. In total, ninety-six representative monofloral honey samples meeting the microscopic, physicochemical, and sensory characteristics were analyzed. Oak honey stood out as the darkest type (L* = 33.67) with the highest total phenolic content (203.75 mg GAE/100 g) and antioxidant activity (106.2 mg AAE/100 g). Chestnut honey closely followed, having also the highest electrical conductivity (1.679 mS/cm). Although manuka honey had a high total phenolic content, its total antioxidant activity was found to be medium-low compared to fir, pine, and erica honeys. Citrus honey, being the lightest in color (L* = 37.2), exhibited the lowest total antioxidant activity (6.36 mg AAE/100 g). Statistical analysis revealed significant positive correlation between total antioxidant activity and electrical conductivity (ra-e = 0.587, pa-e = 0.000), and negative correlation between total antioxidant activity and L* parameter (ra-L = −0.424, pa-L = 0.000). Similar correlations were also observed regarding total phenolic content (rp-e = 0.457, pp-e = 0.000, rp-L = −0.455, pp-L = 0.000). In conclusion, oak and chestnut honeys seem to have a high antioxidant potential, that should be further explored, to highlight their value and help promote them worldwide.

1. Introduction

The use of natural foods in the daily diet has significantly increased in the modern world. These foods contain a variety of antioxidant compounds, including flavonoids and phenolic acids, which have beneficial effects on human health [1]. Honey, a totally natural food, could not be an exception, as it provides dietary antioxidants in a highly palatable form [2,3]. Additionally, honey has been used worldwide in the treatment of diseases, because it has been proved to possess several biological properties, such as antibacterial, anti-inflammatory and anti-cancer effects, as well as stimulation of wound and burn healing [4,5,6,7].
In particular, the antioxidant activity of honey has been evaluated by various authors using different methods and it has been shown to depend on the botanical and geographical origin of honey and its processing [8,9,10,11]. Furthermore, several studies have found a linear correlation between the antioxidant activity of honey and its color, with the darker honeys showing higher antioxidant potent [12,13]. While there are numerous articles that explore the antioxidant properties of honey, there remains a lack of extensive information on monofloral honeys, as most studies rely on samples obtained from the commercial market.
One of the most studied honeys, especially regarding its antibacterial activity, is manuka honey, coming from the New Zealand manuka tree (Leptospermum scoparium), which has been recommended for wound treatment [14,15,16]. Previous studies reported that manuka honey consists of a high amount of phenolic compounds, such as flavonoids [17]. Manuka honey also contains a bioactive ingredient called methylglyoxal that exhibits non-peroxide antibacterial activity [18].
In Greece, there is a great number of plant species giving various monofloral honeys, which are distinguished for their microscopic, sensory and physicochemical characteristics. However, scarce literature exists regarding the biological activities of Greek monofloral honeys, mostly referring to their antimicrobial properties, while even fewer are the references regarding their antioxidant potential [19,20,21].
Considering all of the above, the aim of the present study was to collect fresh and unprocessed Greek honey samples directly from beekeepers, to select representative samples of nine specific monofloral Greek honey types and to analyze their total phenolic content and antioxidant activity. Their antioxidant capacity was also compared with that of Manuka honey. Lastly, the findings were correlated with color and electrical productivity data.

2. Materials and Methods

2.1. Honey Sampling

Honey samples were collected from beekeepers across Greece, applying the appropriate beekeeping practices prior to honey collection. We provided beekeepers with specific instructions, which included moving the bee colonies to the selected plant species once 10% of flowering had begun, harvesting the sealed honey before relocating the colonies, and refraining from providing any artificial feeding to the bees during honey collection (no syrup, paste, or pollen substitutes). Subsequently, the beekeepers collected and sent samples weighing approximately a kilogram to the Laboratory of Apiculture-Sericulture. Out of a total of 195 honey samples, 90 having the required microscopic, sensory, and physicochemical characteristics were chosen as monofloral, representing nine certified types of honey: fir (Abies), chestnut (Castanea sativa), citrus (Citrus), erica (Erica manipuliflora), cotton (Gossypium hirsutum), Jerusalem thorn (Paliurus spina-christi), pine (Pinus), oak (Quercus) and thyme (Thymus capitatus). In addition, six samples of manuka honey (L. scoparium), obtained from European markets whose botanical origin was verified through pollen and sensory analysis, were studied. All samples were stored at −18 °C until their analysis.

2.2. Confirmation of Botanical Origin

In order to determine the botanical source and certify the monofloral honey types, the qualitative pollen analysis was conducted using the method established by the International Commission of Bee Botany [22]. Additionally, to confirm the classification of each floral type in accordance to Greek legislation, the pollen percentage of thyme, erica, chestnut, cotton and citrus honeys had to be over 18%, 45%, 87%, 3%, 3%, respectively.
Moreover, a panel of experts was assembled to evaluate the honey samples and confirm the botanical origin of each type based on their color, taste, odor and aroma. The experts were required to approve or disapprove the monofloral nature of each honey sample provided by the beekeepers by responding with a yes or no [23].

2.3. Determination of Total Phenol Content (TPC)

The Folin-Ciocalteu colorimetric method was applied to determine the TPC of the samples [24]. Specifically, 5 g of each honey sample were diluted to 50 mL of distilled water and then, the solutions were filtered through a qualitative filter. In turn, 500 μL of this solution were mixed with 2.5 mL of 0.2 N Folin–Ciocalteu’s phenol reagent (2 N) (Merck, Darmstadt, Germany) for 5 min and afterwards 2 mL of 75 g/L sodium carbonate (Na2CO3) (≥99.5%, Merck, Germany) were added. After the incubation for 2 h in dark and at room temperature, the absorbance of the reaction mixture was measured at 760 nm against a methanol blank (Genesys 10S UV-Vis, Thermo Scientific, Waltham, MA, USA). The analysis was performed in duplicate. For the quantification of the phenol content, calibration curves were created using standard solutions of gallic acid (≥98.0%, Merck, Germany) (concentrations: 10–400 mg/L). The results were expressed as mg gallic acid equivalents (GAE)/100 g honey.

2.4. Ferric Reducing Power (FRAP) Assay

The total antioxidant activity of the samples was determined according to the Benzie and Strain method, in order to measure the Fe3+/Fe2+ couple reducing ability of a complex matrix [25]. Specifically, the honey samples were diluted with distilled water (1:5) (w/v) and after stirring for 20 min, 3 mL from the FRAP solution were added to the 100 μL of the honey solution. The FRAP working solution comprised of three components: (1) 300 mM CH3COONa (≥99%, Chem-Lab, Zedelgem, Belgium)—CH3COOH (≥99%, Chem-Lab, Belgium) buffer (pH = 3.6), (2) 10 mM TPTZ (2,4,6-tripyridyl-s-triazine) solution (≥98.0%, Merck, Germany) in 40 mM HCl (3 M, Chem-Lab, Belgium), and (3) aquatic solution of 20 mM FeCl3 × 6H2O (>99%, Chem-Lab, Belgium), in a ratio of 10:1:1. After stirring, The samples were transferred to a water bath at 37 °C for 4 min. Absorbance was then measured at 593 nm, using water (100 µL) with 3 mL of FRAP as the reference solution. The analysis was performed in duplicate. For the quantification of the total antioxidant activity, calibration curves were created using standard solutions of ascorbic acid (>99.7%, Chem-Lab, Belgium) (concentrations: 50–2000 μΜ). The results were expressed as mg ascorbic acid equivalents (AAE)/100 g honey

2.5. Determination of Electrical Conductivity and Color

The determination of electrical conductivity was based on the measurement of the electrical resistance of aqueous solution of honey [26], while for the color, the coordinates CIE L* a* b* were measured, using a Konica Minolta colorimeter (CR-410, Tokyo, Japan). The colorimeter was calibrated using a white standard plate with the color coordinates (Υ = 85.8, x = 0.3192, y = 0.3369). Coordinate L* represents the clarity (L* = 0 black and L* = 100 colorless), a* the green/red color component (a* > 0 red, a* < 0 green) and b* the blue/yellow color component (b* > 0 yellow, b* < 0 blue).

2.6. Statistical Analysis

The one-way multivariate analysis of variance (one-way MANOVA) was applied in SPSS 24.0 software (Chicago, IL, USA), combined with Duncan’s range test, in order to examine the group differences across multiple dependent variables simultaneously. The level of significance was set at a = 0.05. The type of honey (botanical origin) was considered as the independent variable, while total phenolic content, antioxidant activity, color and electrical conductivity were considered as the dependent variables. Also, the Pearson (r) test was applied to find possible correlations among the examined parameters.

3. Results and Discussion

3.1. Confirmation of Botanical Origin

The sensory characteristics and the melissopalynological analysis confirmed the floral origin of the honeys that were eventually analyzed. The ranges in pollen percentages of the blossom monofloral honeys are given in Table 1.
The results were within the limits required by the Greek Legislation, and for chestnut and thyme honey types, the percentages were in agreement with the limits set by Persano Oddo et al. (chestnut > 90% thymus > 15%) [27]. Similar percentage findings for thyme honey are also presented in the literature [28,29,30]. In contrast, the pollen percentage in citrus honey was lower than the limit given by Persano Oddo et al. [27], who point out higher limits (>10%). The variation is likely to be caused by the different cultivated Citrus tree varieties, as well as the variability in pollen and nectar offer from the surrounding vegetation.

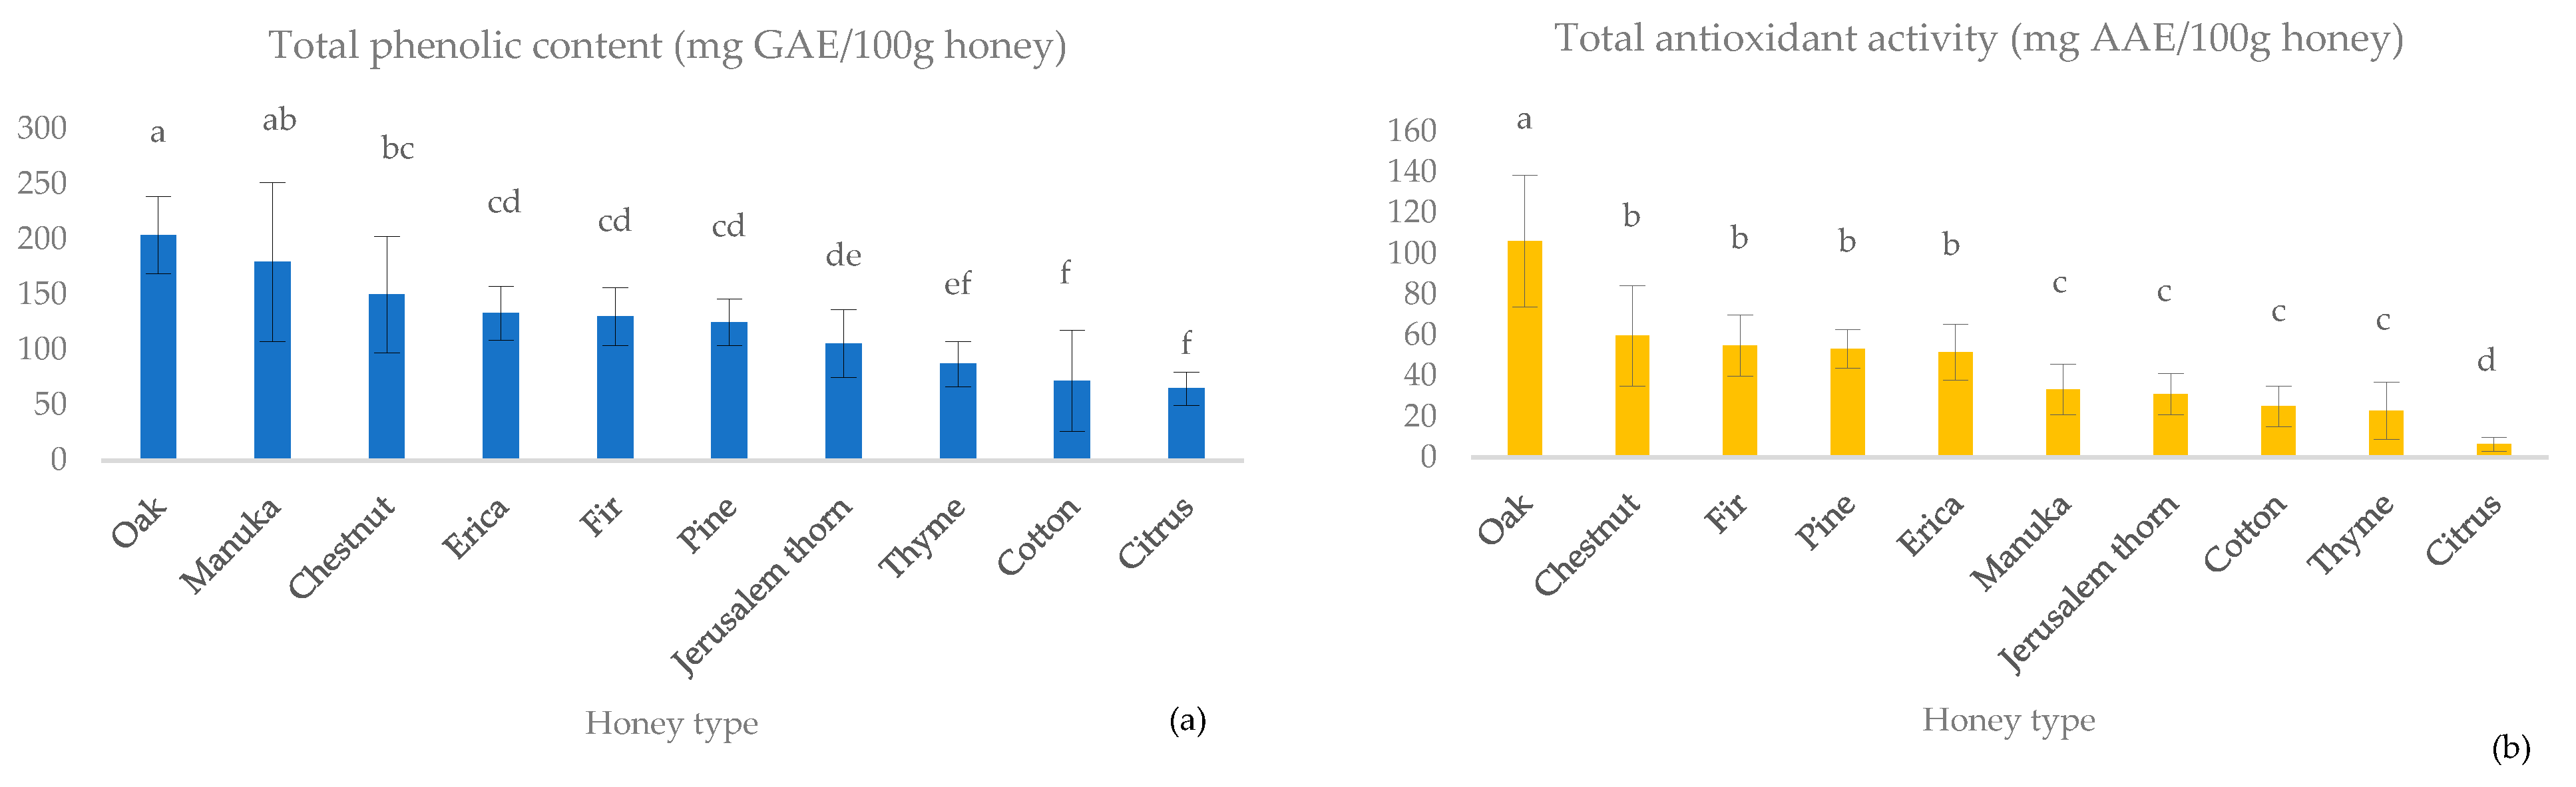
3.2. Determination of TPC and FRAP

Among the examined monofloral honey types, oak honey emerged as the honey type with the significantly highest mean total phenolic content (203.7 ± 34.8 mg GAE/100 g honey) and mean total antioxidant activity (106.2 ± 32.4 mg AAE/100 g honey) (Figure 1).
Regarding the total phenolic content, Manuka and chestnut honeys followed oak honey, with their mean values being 179.5 ± 33.3 mg GAE/100 g honey, and 149.9 ± 34.8 mg GAE/100 g honey, respectively (Figure 1a). Erica, fir, pine and Jerusalem thorn honey demonstrated intermediate average values (133.2 ± 24.4 mg GAE/100 g honey, 130.3 ± 26.3 mg GAE/100 g honey, 125.2 ± 21.3 mg GAE/100 g honey and 105.7 ± 30.6 mg GAE/100 g honey, respectively), while thyme and cotton honey showed low average values (87.3 ± 20.5 mg GAE/100 g honey, 72.1 ± 45.7 mg GAE/100 g honey, respectively).
On the other hand, the manuka honey exhibited significantly lower total antioxidant activity than chestnut (59.8 ± 24.8 mg AAE/100 g honey), fir (54.9 ± 15.0 mg AAE/100 g honey), pine (53.3 ± 9.5 mg AAE/100 g honey) and erica (57.1 ± 13.8 mg AAE/100 g honey) honey types. Indeed, the total antioxidant activity of manuka honey was similar to the mean values found in Jerusalem thorn (31.0 ± 10.3 mg AAE/100 g honey), cotton (25.1 ± 10.0 mg AAE/100 g honey) and thyme (22.8 ± 14.0 mg AAE/100 g honey) honeys. Citrus honeys exhibited both the lowest mean total phenolic content (65.0 ± 15.0 mg GAE/100 g honey) and the lowest mean total antioxidant activity (6.4 ± 3.5 mg AAE/100 g honey).
It is noteworthy that oak honey had approximately three times higher total phenolic content than citrus honey and twice as much as thyme honeys. Additionally, it exhibited about 16 times higher total antioxidant activity than citrus honey and approximately four times more than thyme honeys; two honey types largely preferred by consumers due to their intense aromatic flavor. The predominance of oak honey and chestnut honeys over thyme and citrus honeys was also observed by Tananaki et al. [31].
The high antioxidant properties of oak honey have also been recognized by other authors [9,32,33], although their observed average total phenolic content was lower than the results of our study (120.04 ± 18.56, 130.3 ± 49.3, and 134.8 ± 26.7 mg GAE/100 g honey, respectively). In the case of chestnut honey, the mean value of the total phenolic content we found was slightly higher than the findings of Aker & Nisbet (138.3 ± 19.3 mg GAE/100 g honey) and Akgün et al. (120.0 ± 3.0 mg GAE/100 g honey) [34,35] but lower than the results of Özkök and Silici (261.7 mg GAE/100 g honey) [36]. Regarding pine honey, the average total phenolic content of the present research was slightly lower than the values found by Karabagias et al. (158.3 ± 33.8 mg GAE/100 g honey) [37] who analyzed Greek pine honey samples, and Aker & Nisbet (166.5 ± 5.8 mg GAE/100 g honey) [34] who analyzed Turkish pine honey samples. Similar results regarding thyme and citrus honey are reported by Imtara et al. [38] and Özkök and Silici [36], respectively, while Aker & Nisbet recorded higher values for citrus honey (113.8 ± 19.3 mg GAE/100 g honey) [34]. As for Jerusalem thorn honey, although it is produced in large amounts in Greece, its antioxidant capacity has not been thoroughly investigated. To our knowledge, this is the first analysis of its antioxidant potential. Finally, regarding the total phenolic content of manuka honey, similar results are referred by Portokalakis et al. and Gośliński et al., but much higher values are given by Pentoś et al. [39,40,41]. It is not feasible to make further comparisons with other studies due to variations in methodologies and standard solutions used for quantification. This highlights the necessity for a standardized method to ensure comparable study results.

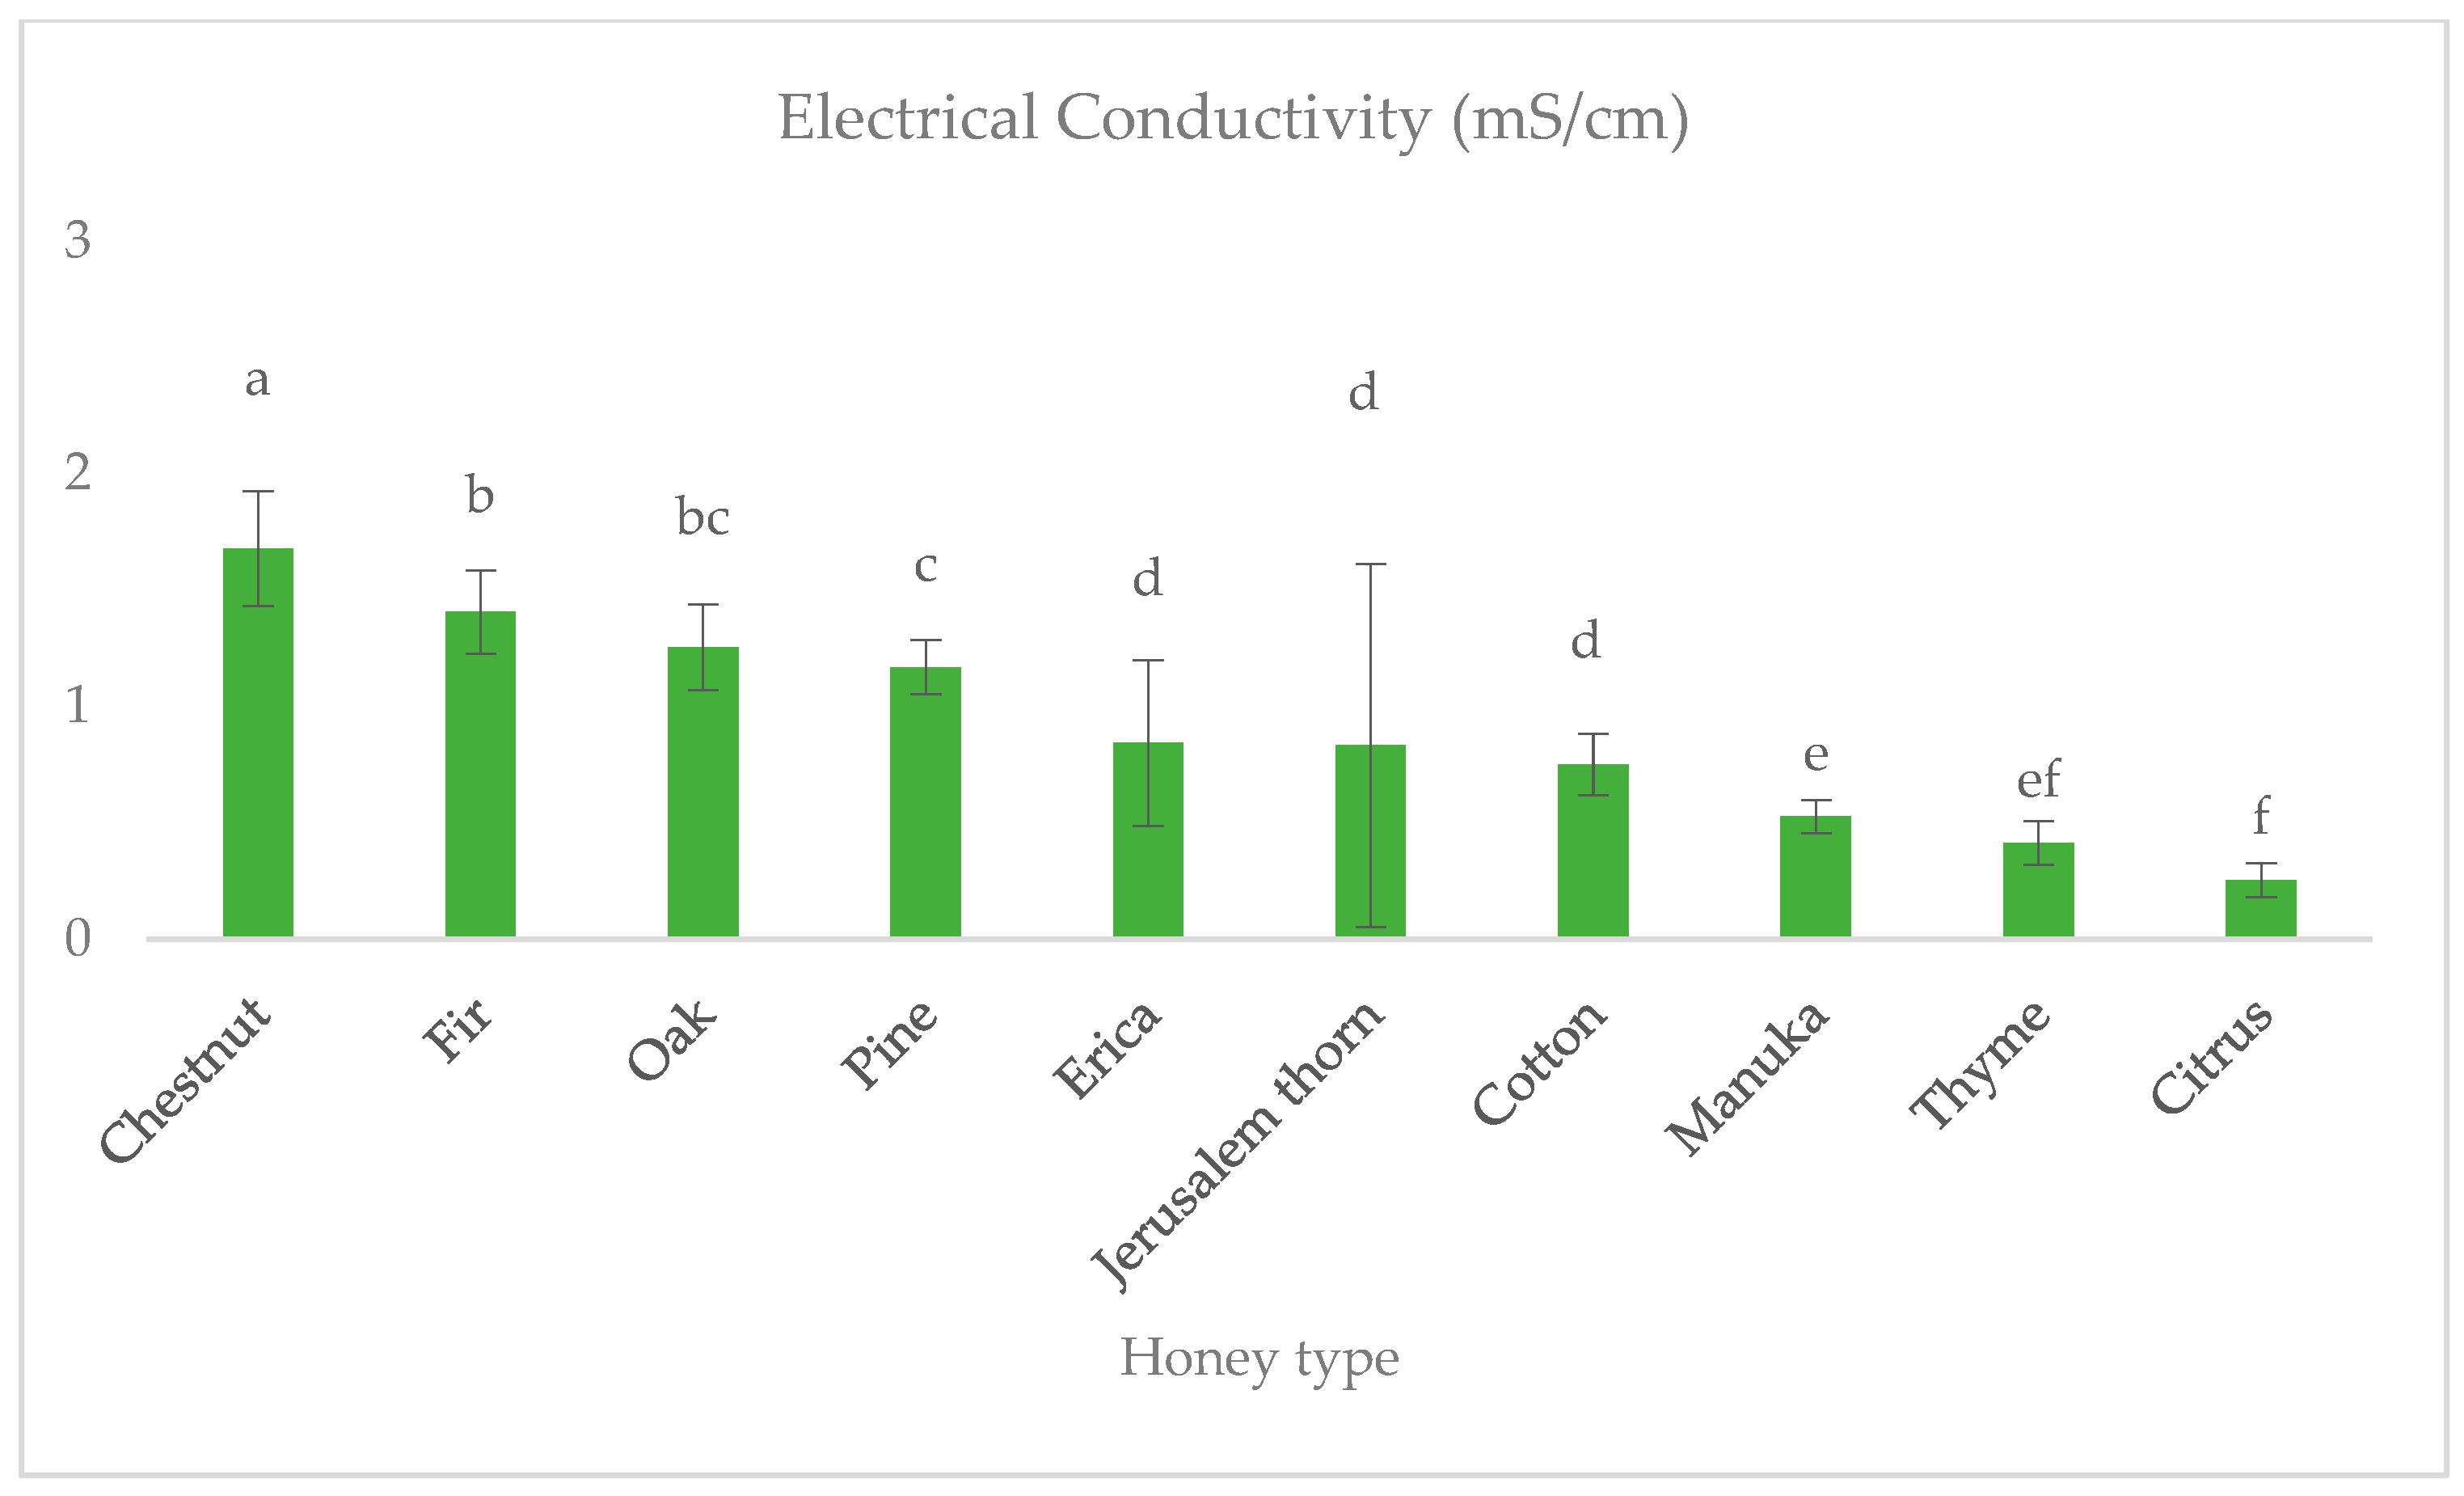
3.3. Determination of Electrical Conductivity and Color

The different values of electrical conductivity and color are related to the botanical origin of honeys. Honeydew honeys had higher values than blossom honeys, with the chestnut honey showing the highest mean electrical conductivity (1.679 ± 0.3 mS/cm), followed by fir (1.407 ± 0.18 mS/cm), oak (1.255 ± 0.18 mS/cm) and pine (1.170 ± 0.12 mS/cm) (Figure 2). Manuka, thyme and citrus honeys showed the lowest mean electrical conductivity (0.538 ± 0.07, 0.415 ± 0.09 and 0.254 ± 0.07 mS/cm, respectively).
Also, honeydew honeys were generally darker than blossom honeys, with oak honey being the darkest, as they had the lowest average L* parameter (L* = 31.67 ± 0.10), followed by chestnut (L* = 33.30 ± 0.45) and pine (L* = 33.30 ± 0.15), while citrus honey was the lightest (L* = 33.30 ± 0.15) (Figure 3).
Manuka honey, though considered as blossom, was darker (L* = 3.34 ± 0.39) than Greek blossom monofloral honeys, and even darker than fir honey (L* = 3.41 ± 0.01). Furthermore, erica and manuka honeys had the highest mean redness value (a* = 3.14 ± 2.33, 2.79 ± 1.69, respectively) and mean yellowness value (b* = 9.59 ± 4.09, 9.07 ± 2.49, respectively) probably due to the presence of red and yellow components (ex. anthocyanins, flavonoids, carotenoids) in their nectar.
Electrical conductivity, along with other physicochemical parameters, is important in the characterization of honey. In our study, most blossom honeys had electrical conductivity values below 0.8 mS/cm, as specified in the Honey Directive (110/2001, EE), while the mean values for honeydew and chestnut honeys were over that limit [42]. However, Jerusalem thorn honey, despite being classified as blossom based on field observations, had an average electrical conductivity higher than 0.8 mS/cm. As a result, this specific type of honey cannot be classified and marketed as blossom honey, even though it exhibits the microscopic and sensory characteristics of such honey. Similar findings have been documented by Rodopoulou et al. [43]. Furthermore, 40% of cotton honey samples had electrical conductivity exceeding 0.8 mS/cm, despite exhibiting the characteristics of blossom honey, making their promotion challenging. Thrasyvoulou et al. [44] have suggested to include these monofloral honey types in the exceptions of Honey Directive (110/2001, EU).
Multiple authors have reported similar average electrical conductivity for the different types of honey they studied [9,28,29,41,44,45,46,47]. However, Akgün et al. [35], Rodríguez-Flores [48] and Ucurum et al. [49] found lower values for chestnut honey (1.13 ± 0.25, 1.1 ± 0.2, and 1.43 ± 0.33 mS/cm, respectively), compared to our findings. Additionally, Seijo et al. [31] and Ucurum et al. [49] noted lower values for oak honey (1.0 ± 0.1, 1.13 ± 0.31 mS/cm, respectively). Lastly, while Rodriguez et al. reported similar electrical conductivity values for citrus honey [50], Karabagias et al. (0.616 ± 0.019 mS/cm) and Makhloufi et al. (0.40 ± 0.20 mS/cm) referred to higher values [51,52].
Furthermore, regarding the CIElab parameters, the findings in the existing literature are different regarding the same honey type, compared to this research [9,53]. These variations could be attributed to the honey’s different geographical origins or to the use of different colorimetric methods (such as transmittance or reflectance, and analysis of fluid or crystallized honeys) [53].

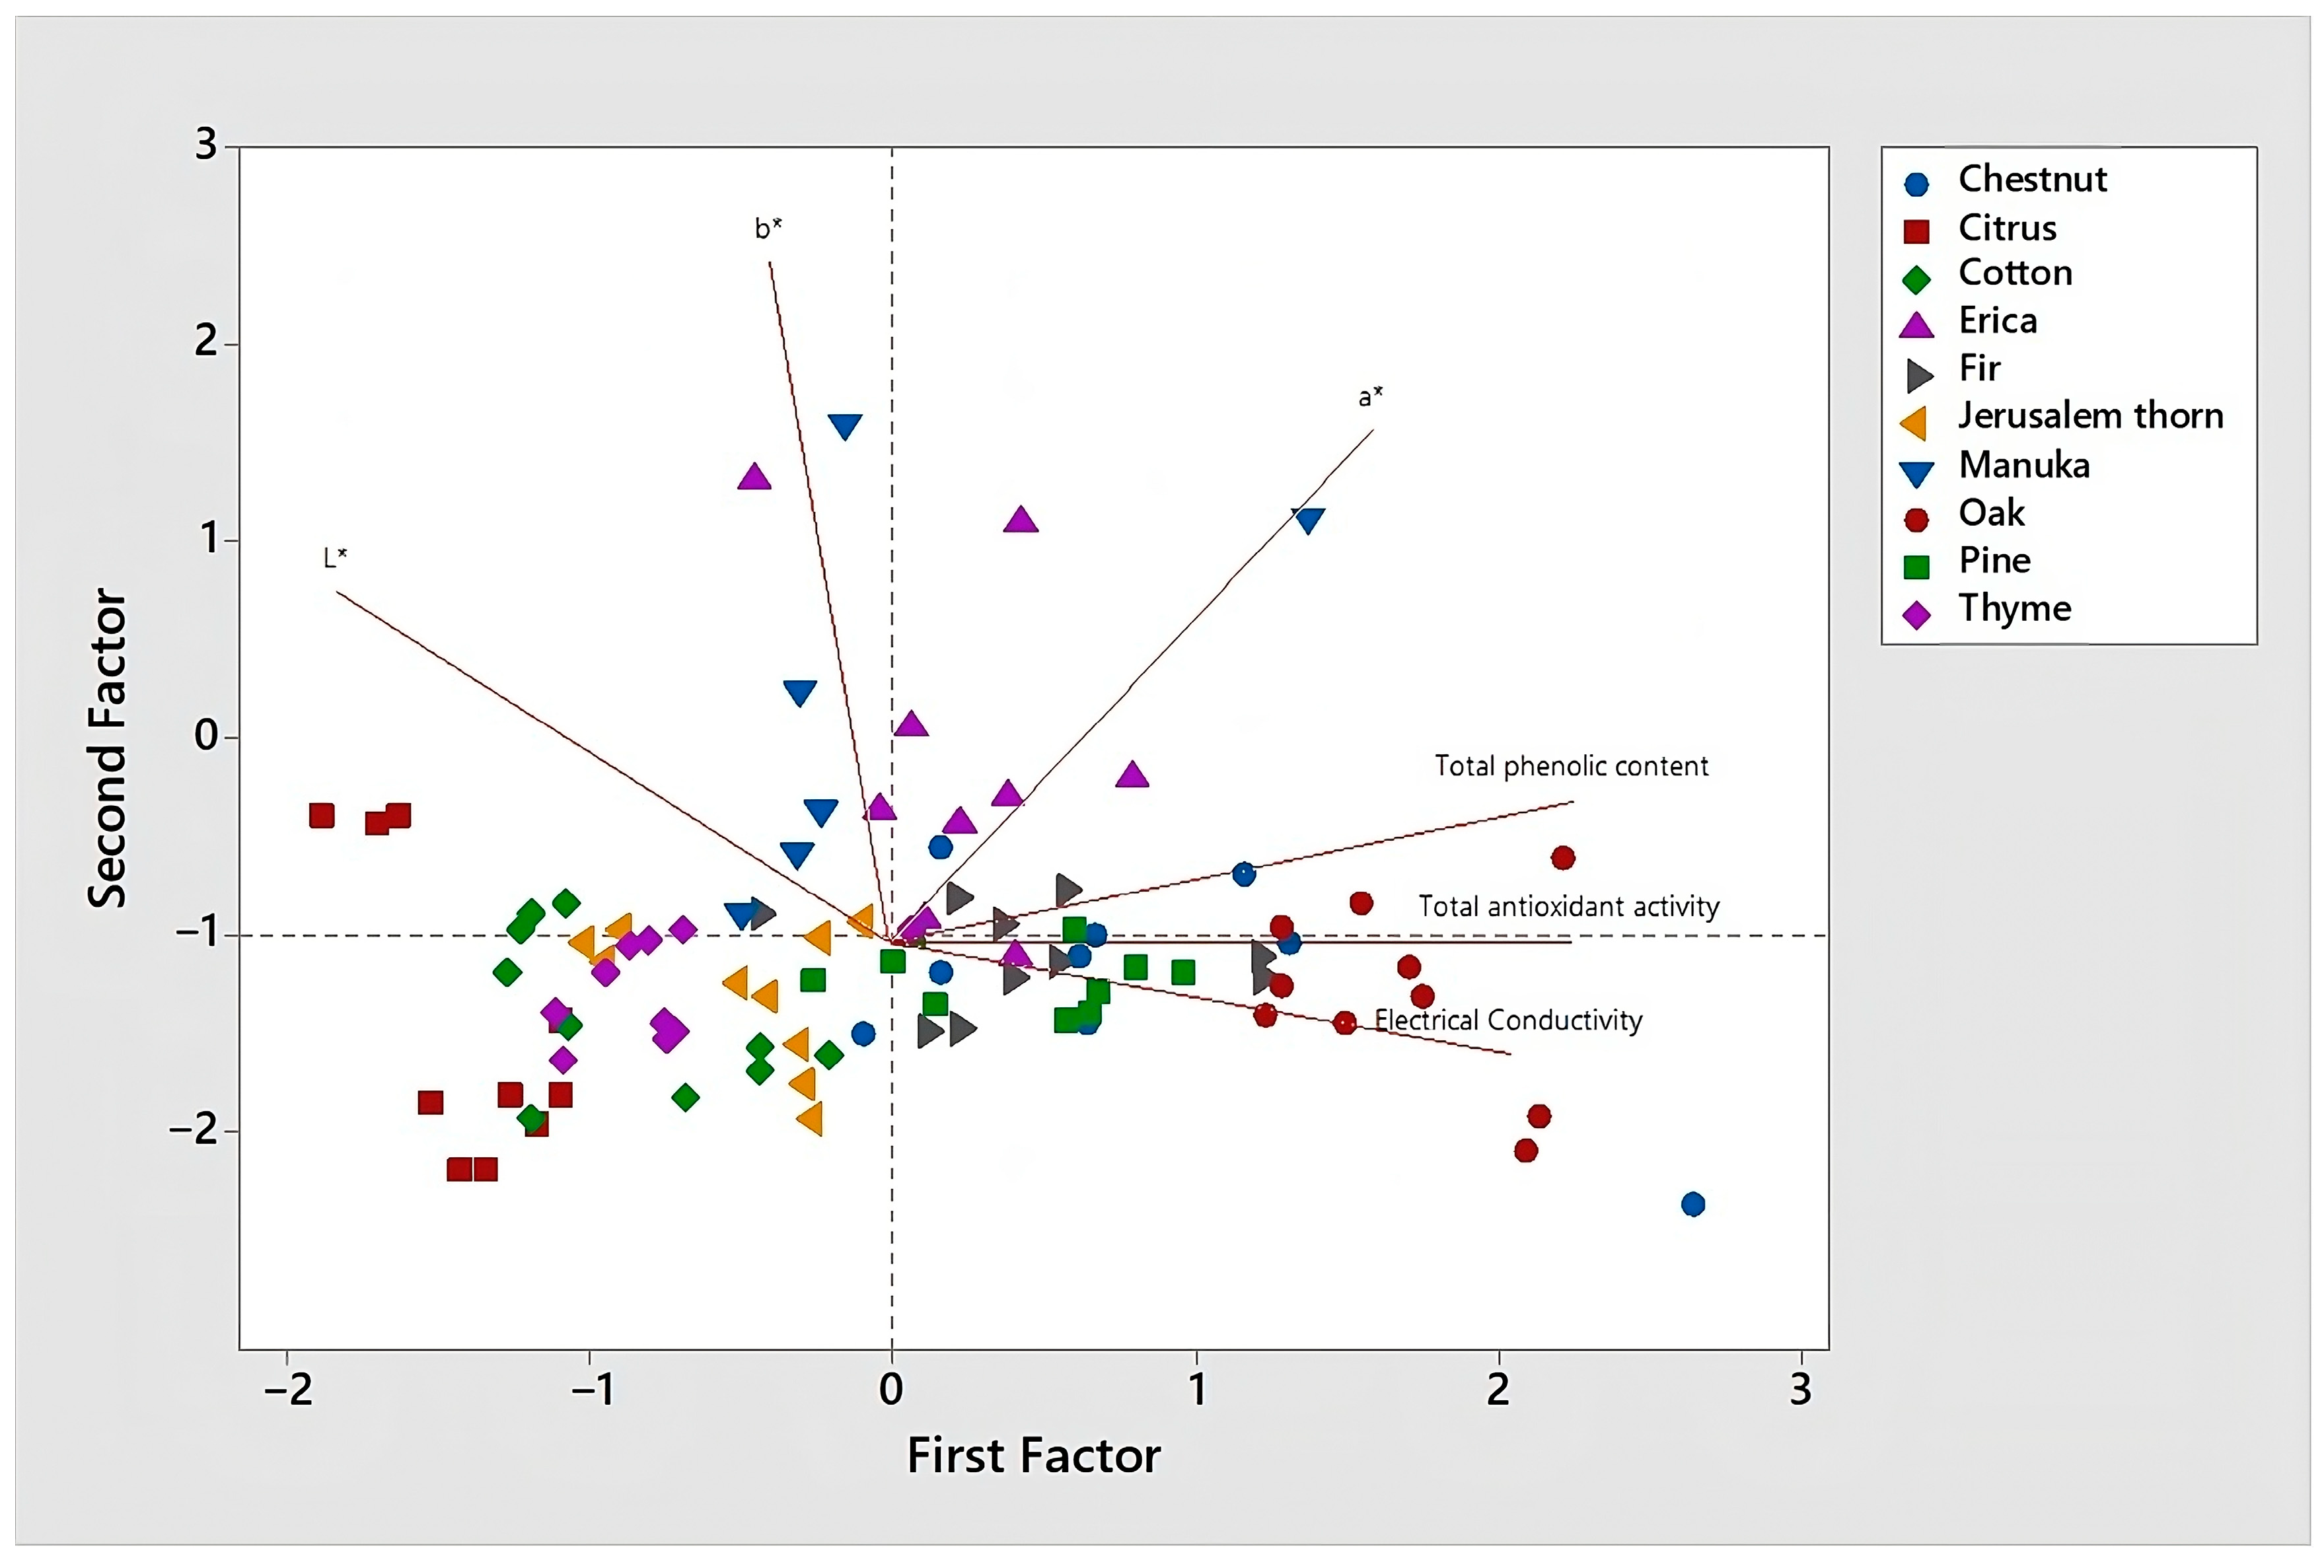
3.4. Correlations of the Analyzed Parameters

A Pearson (r) test was applied to evaluate the possible correlations among the examined parameters (total phenolic content, total antioxidant activity, electrical conductivity, L*, a*, b*). The results of correlation coefficient (r) and level of significance (p) are given in Table 2.
The strong positive correlation found between the total phenolic content and total antioxidant activity (r = 0.669, p = 0.000, <a = 0.05), confirms that phenolics play an important role, along with other factors (non-phenolic compounds), in the antioxidant properties of honey, as supported by the existing literature [8,11]. Additionally, the antioxidant potential of honey seems to be linked to its electrical conductivity, as well as its L* and a* colorimetric parameters. Indeed, statistically significant positive correlation was observed between the antioxidant activity and electrical conductivity (r = 0.587, p = 0.000, <a = 0.05) and total phenolic content and electrical conductivity (r = 0.457, p = 0.000, <a = 0.05). On the other hand, a significant negative correlation was found between the antioxidant activity and L* parameter (r = −0.424, p = 0.000, <a = 0.05), as well as between total phenolic content and L* parameter (r = −0.455, p = 0.000, <a = 0.05). This confirms that darker honeys with higher electrical conductivity are likely to have greater antioxidant potential compared to lighter honeys with lower electrical conductivity.
We also performed Principal Component Analysis (PCA) in order to emphasize the significant correlations between the examined parameters (Figure 4).
A good discrimination of the honey samples was achieved, with the first and second components explaining 84.9% of the total variance. Oak honey samples, which showed the highest total phenolic content and the highest total antioxidant activity are found in the 1st and 2nd quadrants, while citrus honey samples are located in the 3rd and 4th quadrants. Also, most erica honey samples which had the highest values of redness (a*) are found in the 1st quadrant. Finally, all the light-colored blossom honeys (cotton, citrus, Jerusalem thorn, thyme) are found in the 3d and the 4th quadrants.
The color of honey depends on its floral source due to minerals and other minor components and it is closely related to its chemical composition, primarily to the presence of pigments such as chlorophylls, carotenoids, flavonoids and derivatives of tannins and polyphenols [54]. Thus, darker honeys seem to possess higher antioxidant activity which is mostly due to the content and composition of phenolic compounds. Lastly, statistically significant positive correlation was observed between antioxidant activity and the a* parameter (r = 0.497, p = 0.000, <a = 0.05) and between total phenolic content and the a* parameter (r = 0.574, p = 0.000, <a = 0.05), indicating that honeys with higher redness are more likely to exhibit higher antioxidant capacity. According to Frankel et al. [2], the color of honey partly reflects the content of pigments with antioxidant properties. The statistically significant positive correlation of total phenolic content, total antioxidant activity, and color is also referred in other studies [55,56,57].

4. Conclusions

In this study, we collected fresh and unprocessed Greek representative honey samples from nine specific monofloral botanical origins and we analyzed their total phenolic content and antioxidant activity. From the results we can conclude that honeydew honeys have generally stronger antioxidant potential compared to blossom honeys, as is demonstrated by the positive correlation between the antioxidant activity and electrical conductivity. Oak and chestnut honeys emerged among the examined monofloral honey types as the ones with the strongest total antioxidant capacity. Oak honeys showed higher total phenolic content than manuka honey, which also exhibited medium-low total antioxidant activity, following that of fir, pine and erica honeys. Further research should be done, including the analysis of their phenolic profile, aiming at highlighting their value and to help promote them worldwide.

Author Contributions

Conceptualization, C.T. and M.D.; methodology, C.T. and M.D.; investigation, M.-A.R., M.D., D.K. and V.L; writing—original draft preparation, M.-A.R., D.K. and V.L.; writing—review and editing, C.T. and M.D.; supervision, C.T. All authors have read and agreed to the published version of the manuscript.

Funding

This research received no external funding.

Institutional Review Board Statement

Not applicable.

Informed Consent Statement

Not applicable.

Data Availability Statement

Data supporting reported results are stored at the Laboratory of Apiculture-Sericulture, AUTH.

Conflicts of Interest

The authors declare no conflicts of interest.

References

  1. Qi, J.; Tongtong, L.; Yuan, Q.; Donghai, L.; Liping, Y.; Huimin, M.; Fang, M.; Yuyang, W.; Liang, P.; Yongli, Z. Oxidative stress and inflammation in diabetic nephropathy: Role of polyphenols. Front. Immunol. 2023, 14, 1185317. [Google Scholar] [CrossRef]
  2. Frankel, S.; Robinson, G.E.; Berenbaum, M.R. Antioxidant capacity and correlated characteristics of 14 unifloral honeys. J. Apic. Res. 1998, 37, 27–31. [Google Scholar] [CrossRef]
  3. Zheng, S.-L.; Wang, Y.-M.; Chi, C.-F.; Wang, B. Chemical Characterization of Honeysuckle Polyphenols and Their Alleviating Function on Ultraviolet B-Damaged HaCaT Cells by Modulating the Nrf2/NF-κB Signaling Pathways. Antioxidants 2024, 13, 294. [Google Scholar] [CrossRef]
  4. Molan, P.C. Potential of Honey in the Treatment of Wounds and Burns. Am. J. Clin. Dermatol. 2001, 2, 13–19. [Google Scholar] [CrossRef]
  5. Al-Waili, N. Investigating the Antimicrobial Activity of Natural Honey and Its Effects on the Pathogenic Bacterial Infections of Surgical Wounds and Conjunctiva. J. Med. Food 2004, 7, 210–222. [Google Scholar] [CrossRef]
  6. Tsiapara, A.V.; Jaakkola, M.; Chinou, I.; Graikou, K.; Tolonen, T.; Virtanen, V.; Moutsatsou, P. Bioactivity of Greek honey extracts on breast cancer (MCF-7), prostate cancer (PC-3) and endometrial cancer (Ishikawa) cells: Profile analysis of extracts. Food Chem. 2009, 116, 702–708. [Google Scholar] [CrossRef]
  7. Silva, B.; Carina Biluca, F.; Valdemiro Gonzaga, L.; Fett, R.; Monguilhott Dalmarco, E.; Caon, T.; Oliveira Costa, A.C. In vitro anti-inflammatory properties of honey flavonoids: A review. Food Res. Int. 2021, 141, 110086. [Google Scholar] [CrossRef]
  8. Gheldof, N.; Wang, X.-H.; Engeseth, N.J. Identification and Quantification of Antioxidant Components of Honeys from Various Floral Sources. J. Agric. Food Chem. 2002, 50, 5870–5877. [Google Scholar] [CrossRef]
  9. Can, Z.; Yildiz, O.; Sahin, H.; Akyuz Turumtay, E.; Silici, S.; Kolayli, S. An investigation of Turkish honeys: Their physico-chemical properties, antioxidant capacities and phenolic profiles. Food Chem. 2015, 180, 133–141. [Google Scholar] [CrossRef]
  10. Dżugan, M.; Tomczyk, M.; Sowa, P.; Grabek-Lejko, D. Antioxidant Activity as Biomarker of Honey Variety. Molecules 2018, 23, 2069. [Google Scholar] [CrossRef]
  11. Becerril-Sánchez, A.L.; Quintero-Salazar, B.; Dublán-García, O.; Escalona-Buendía, H.B. Phenolic Compounds in Honey and Their Relationship with Antioxidant Activity, Botanical Origin, and Color. Antioxidants 2021, 10, 1700. [Google Scholar] [CrossRef]
  12. Beretta, G.; Granata, P.; Ferrero, M.; Orioli, M.; Maffei Facino, R. Standardization of antioxidant properties of honey by a combination of spectrophotometric/fluorimetric assays and chemometrics. Anal. Chim. Acta 2005, 533, 185–191. [Google Scholar] [CrossRef]
  13. Bodó, A.; Radványi, L.; Kőszegi, T.; Csepregi, R.; Nagy, D.U.; Farkas, Á.; Kocsis, M. Quality Evaluation of Light- and Dark-Colored Hungarian Honeys, Focusing on Botanical Origin, Antioxidant Capacity and Mineral Content. Molecules 2021, 26, 2825. [Google Scholar] [CrossRef]
  14. Molan, P.C. Why honey is effective as a medicine. 1. Its use in modern medicine. Bee World 1999, 80, 80–92. [Google Scholar] [CrossRef]
  15. Alvarez-Suarez, J.M.; Gasparrini, M.; Forbes-Hernández, T.Y.; Mazzoni, L.; Giampieri, F. The Composition and Biological Activity of Honey: A Focus on Manuka Honey. Foods 2014, 3, 420–432. [Google Scholar] [CrossRef]
  16. Abd El-Malek, F.F.; Yousef, A.S.; El-Assar, S.A. Hydrogel film loaded with new formula from manuka honey for treatment of chronic wound infections. J. Glob. Antimicrob. Resist. 2017, 11, 171–176. [Google Scholar] [CrossRef]
  17. Stephens, J.M.; Schlothauer, R.C.; Morris, B.D.; Yang, D.; Fearnley, L.; Greenwood, D.R.; Loomes, K.M. Phenolic compounds and methylglyoxal in some New Zealand manuka and kanuka honeys. Food Chem. 2010, 120, 78–86. [Google Scholar] [CrossRef]
  18. Adams, C.J.; Manley-Harris, M.; Molan, P.C. The origin of methylglyoxal in New Zealand manuka (Leptospermum scoparium) honey. Carbohydr. Res. 2009, 344, 1050–1053. [Google Scholar] [CrossRef]
  19. Melliou, E.; Chinou, I. Chemical constituents of selected unifloral Greek bee-honeys with antimicrobial activity. Food Chem. 2011, 129, 284–290. [Google Scholar] [CrossRef]
  20. Voidarou, C.; Alexopoulos, A.; Plessas, S.; Karapanou, A.; Mantzourani, I.; Stavropoulou, E.; Fotou, K.; Tzora, A.; Skoufos, I.; Bezirtzoglou, E. Antibacterial activity of different honeys against pathogenic bacteria. Anaerobe 2011, 17, 375–379. [Google Scholar] [CrossRef]
  21. Tsavea, E.; Vardaka, F.-P.; Savvidaki, E.; Kellil, A.; Kanelis, D.; Bucekova, M.; Grigorakis, S.; Godocikova, J.; Gotsiou, P.; Dimou, M.; et al. Physicochemical Characterization and Biological Properties of Pine Honey Produced across Greece. Foods 2022, 11, 943. [Google Scholar] [CrossRef]
  22. Von Der Ohe, W.; Persano Oddo, L.; Piana, M.L.; Morlot, M.; Martin, P. Harmonized methods of melissopalynology. Apidologie 2004, 35, 18–25. [Google Scholar] [CrossRef]
  23. Piana, M.L.; Persano Oddo, L.; Bentabol, A.; Bruneau, E.; Bogdanov, S.; Guyot Declerck, C. Sensory analysis applied to honey: State of the art. Apidologie 2004, 35, 26–37. [Google Scholar] [CrossRef]
  24. Meda, A.; Lamien, C.E.; Romito, M.; Millogo, J.; Nacoulma, O.G. Determination of the total phenolic, flavonoid and proline contents in Burkina Fasan honey, as well as their radical scavenging activity. Food Chem. 2005, 91, 571–577. [Google Scholar] [CrossRef]
  25. Benzie, I.F.F.; Strain, J.J. Ferric reducing/antioxidant power assay: Direct measure of total antioxidant activity of biological fluids and modified version for simultaneous measurement of total antioxidant power and ascorbic acid concentration. Methods Enzymol. 1999, 299, 15–27. [Google Scholar] [CrossRef]
  26. Bogdanov, S.; Ruoff, K.; Oddo, L.P. Physico-chemical methods for the characterization of unifloral honey: A review. Apidologie 2004, 35, 275–282. [Google Scholar] [CrossRef]
  27. Oddo, L.P.; Piazza, M.G.; Sabatini, A.G.; Accorti, M. Characterization of unifloral honeys. Apidologie 1995, 26, 453–465. [Google Scholar] [CrossRef]
  28. Thrasyvoulou, A.; Manikis, J. Some physicochemical and microscopic characteristics of Greek unifloral honeys. Apidologie 1995, 26, 441–452. [Google Scholar] [CrossRef]
  29. Tsigouri, A.; Passaloglou-Katrali, M.; Sabatakou, O. Palynological characteristics of different unifloral honeys from Greece. Grana 2004, 43, 122–128. [Google Scholar] [CrossRef]
  30. Karabournioti, S.E.; Tsiripidis, I.; Thrasyvoulou, A.; Eleftheriou, E.P. Melissopalynological attributes of some Greek thyme honeys. J. Apic. Res. 2009, 48, 104–114. [Google Scholar] [CrossRef]
  31. Tananaki, C.; Dimou, M.; Thrasyvoulou, A. Biological activity of Greek honeys and Greek Propolis. In Proceedings of the 1st Panhellenic Conference of Professional Apiculture, Alexandroupoli, Greece, 7–8 November 2015; pp. 100–106. (In Greek). [Google Scholar]
  32. Jara-Palacios, M.J.; Ávila, F.J.; Escudero-Gilete, M.L.; Gómez Pajuelo, A.; Heredia, F.J.; Hernanz, D.; Terrab, A. Physicochemical properties, colour, chemical composition, and antioxidant activity of Spanish Quercus honeydew honeys. Eur. Food Res. Technol. 2019, 245, 2017–2026. [Google Scholar] [CrossRef]
  33. Seijo, M.C.; Escuredo, O.; Rodríguez-Flores, M.S. Physicochemical Properties and Pollen Profile of Oak Honeydew and Evergreen Oak Honeydew Honeys from Spain: A Comparative Study. Foods 2019, 8, 126. [Google Scholar] [CrossRef] [PubMed]
  34. Aker, D.; Nisbet, C. Antioxidant activities, total phenolic and flavonoid contents of honey collected from different botanical origins. Ankara Univ. Vet. Fak. Derg. 2020, 67, 133–136. [Google Scholar] [CrossRef]
  35. Akgün, N.; Çelik, Ö.F.; Kelebekli, L. Physicochemical properties, total phenolic content, and antioxidant activity of chestnut, rhododendron, acacia and multifloral honey. Food Meas. 2021, 15, 3501–3508. [Google Scholar] [CrossRef]
  36. Özkök, D.; Silici, S. Antioxidant activities of honeybee products and their mixtures. Food Sci. Biotechnol. 2017, 26, 201–206. [Google Scholar] [CrossRef] [PubMed]
  37. Karabagias, I.K.; Karabagias, V.K.; Papastephanou, C.; Badeka, A.V. New insights into the typification of Hellenic monofloral honeys using selected physico-chemical and bio-chemical indicators coupled with z score analysis and chemometric models. Eur. Food Res. Technol. 2021, 247, 169–182. [Google Scholar] [CrossRef]
  38. Imtara, H.; Al-Waili, N.; Aboulghazi, A.; Abdellaoui, A.; Al-Waili, T.; Lyoussi, B. Chemical composition and antioxidant content of Thymus vulgaris honey and Origanum vulgare essential oil; their effect on carbon tetrachloride-induced toxicity. Vet World. 2021, 14, 292–301. [Google Scholar] [CrossRef]
  39. Portokalakis, I.; Mohd Yusof, H.I.; Ghanotakis, F.D.; Singh Nigam, P.; Owusu-Apenten, R. Manuka Honey-induced Cytotoxicity against MCF7 Breast Cancer Cells is Correlated to Total Phenol Content and Antioxidant Power. J. Adv. Biol. Biotechnol. 2016, 8, 1–10. [Google Scholar] [CrossRef]
  40. Gośliński, M.; Nowak, D.; Kłębukowska, L. Antioxidant properties and antimicrobial activity of manuka honey versus Polish honeys. J. Food Sci. Technol. 2020, 57, 1269–1277. [Google Scholar] [CrossRef]
  41. Pentoś, K.; Łuczycka, D.; Oszmiański, J.; Lachowicz, S.; Pasternak, G. Polish honey as a source of antioxidants—A comparison with Manuka honey. J. Apic. Res. 2020, 59, 939–945. [Google Scholar] [CrossRef]
  42. European Economic Community (EEC). Council directive of 20 December 2001 relating to honey. Off. J. Eur. Commun. Legis. 2002, 110, 47–50. [Google Scholar]
  43. Rodopoulou, M.-A.; Tananaki, C.; Kanelis, D.; Liolios, V.; Dimou, M.; Thrasyvoulou, A. A chemometric approach for the differentiation of 15 monofloral honeys based on physicochemical parameters. J. Sci. Food Agric. 2022, 102, 139–146. [Google Scholar] [CrossRef]
  44. Thrasyvoulou, A.; Tananaki, C.; Goras, G.; Karazafiris, E.; Dimou, M.; Liolios, V.; Kanelis, D.; Gounari, S. Legislation of honey criteria and standards. J. Apic. Res. 2018, 57, 88–96. [Google Scholar] [CrossRef]
  45. Bertoncelj, J.; Golob, T.; Kropf, U.; Korošec, M. Characterisation of Slovenian honeys on the basis of sensory and physicochemical analysis with a chemometric approach. Int. J. Food Sci. Technol. 2011, 46, 1661–1671. [Google Scholar] [CrossRef]
  46. Terrab, A.; Recamales, A.F.; Hernanz, D.; Heredia, F.J. Characterisation of Spanish thyme honeys by their physicochemical characteristics and mineral contents. Food Chem. 2004, 88, 537–542. [Google Scholar]
  47. Moniruzzaman, M.; Sulaiman, S.A.; Khalil, M.I.; Gan, S. Evaluation of physicochemical and antioxidant properties of sourwood and other Malaysian honeys: A comparison with manuka honey. Chem. Cent. J. 2013, 7, 138. [Google Scholar] [CrossRef]
  48. Rodríguez-Flores, S.; Escuredo, O.; Seijo, M.C. Characterization and antioxidant capacity of sweet chestnut honey produced in North-West Spain. J. Apic. Sci. 2016, 60, 19–30. [Google Scholar] [CrossRef]
  49. Ucurum, O.; Tosunoglu, H.; Takma, Ç.; Birlik, P.M.; Berber, M.; Kolaylı, S. Distinctive properties of the pine, oak, chestnut and multifloral blossom and honeydew honeys. Eur. Food Res. Technol. 2024, 250, 1765–1774. [Google Scholar] [CrossRef]
  50. Rodriguez, I.; Salud, S.; Hortensia, G.; Luis, U.J.; Jodral, M. Characterisation of Sierra Morena citrus blossom honey (Citrus sp). Int. J. Food Sci. Technol. 2010, 45, 2008–2015. [Google Scholar] [CrossRef]
  51. Karabagias, I.K.; Badeka, A.V.; Kontakos, S.; Karabournioti, S.; Kontominas, M.G. Botanical discrimination of Greek unifloral honeys with physico-chemical and chemometric analyses. Food Chem. 2014, 165, 181–190. [Google Scholar] [CrossRef]
  52. Makhloufi, C.; Kerkvliet, J.D.; Ricciardelli D’albore, G.; Choukri, A.; Samar, R. Characterization of Algerian honeys by palynological and physico-chemical methods. Apidologie 2010, 41, 509–521. [Google Scholar] [CrossRef]
  53. Tuberoso, C.I.G.; Jerković, I.; Sarais, G.; Congiu, F.; Marijanović, Z.; Kuś, P.M. Color evaluation of seventeen European unifloral honey types by means of spectrophotometrically determined CIE L C a b h a b chromaticity coordinates. Food Chem. 2014, 145, 284–291. [Google Scholar] [CrossRef] [PubMed]
  54. Kaškonienė, V.; Maruška, A.-S.; Kornyšova, O.; Charczun, N.; Ligor, M.; Buszewski, B. Quantitative and qualitative determination of phenolic compounds in honey. Chem. Technol. 2009, 52, 74–80. [Google Scholar]
  55. Bertoncelj, J.; Doberšek, U.; Jamnik, M.; Golob, T. Evaluation of the phenolic content, antioxidant activity and colour of Slovenian honey. Food Chem. 2007, 105, 822–828. [Google Scholar] [CrossRef]
  56. Otmani, A.; Amessis-Ouchemoukh, N.; Birinci, C.; Yahiaoui, S.; Kolayli, S.; Rodríguez-Flores, M.S.; Escuredo, O.; Carmen Seijo, M.; Ouchemoukh, S. Phenolic compounds and antioxidant and antibacterial activities of Algerian honeys. Food Biosci. 2021, 42, 101070. [Google Scholar] [CrossRef]
  57. Preti, R.; Tarola, A.M. Chemometric evaluation of the antioxidant properties and phenolic compounds in Italian honeys as markers of floral origin. Eur. Food Res. Technol. 2022, 248, 991–1002. [Google Scholar] [CrossRef]
Figure 1. Total phenolic content (mg GAE/100 g honey) (a) and total antioxidant activity (mg AAE/100 g honey) (b) of ten monofloral honey types. Note: Different latin letters in each group show statistically significant differences according to Duncan’s multiple range test, a = 0.05.
Applsci 14 04329 g001
Figure 2. Electrical conductivity (mS/cm) of ten monofloral honey types. Note: Different latin letters in each group show statistically significant differences according to Duncan’s multiple range test, a = 0.05.
Applsci 14 04329 g002
Figure 3. Color parameters L* (10−1), a*, b*, of ten monofloral honey types. Note: Different latin letters in each group show statistically significant differences according to Duncan’s multiple range test, a = 0.05.
Applsci 14 04329 g003
Figure 4. Principal component analysis biplot obtained for the examined parameters total phenolic content, total antioxidant activity, electrical conductivity and color.
Applsci 14 04329 g004
Table 1. Average pollen percentage (%), standard deviation and pollen range (%) of blossom monofloral honey types.
Honey TypeAverage Pollen Percentage (%) ± Standard Deviation (S.D.)Pollen Range (%)
Chestnut97.7 ± 1.296–99
Citrus9.6 ± 10.2 3–33
Cotton6.4 ± 5.23–17
Erica87.8 ± 11.668–99
Jerusalem thorn81.2 ± 11.258–95
Thyme75.6 ± 14.353–93
Manuka79.5 ± 17.955–96
Table 2. Correlation coefficient (r) and level of significance (p) among the examined parameters (total phenolic content, total antioxidant activity, electrical conductivity, L*, a*, b*).
ParametersTotal Phenolic ContentTotal Antioxidant ActivityElectrical ConductivityL*a*b*
Total phenolic
content
r = 1r = 0.669 *r = 0.457 *r = −0.455 *r = 0.574 *r = 0.006
-p = 0.000p = 0.000p = 0.000p = 0.000p = 0.295
Total antioxidant activityr = 0.669 *r = 1r = 0.587 *r = −0.424 *r = 0.497 *r = −0.071
p = 0.000-p = 0.000p = 0.000p = 0.000p = 0.494
Electrical conductivityr = 0.457 *r = 0.587 *r = 1r = −0.431 *r = 0.227 *r = −0.147
p = 0.000p = 0.000-p = 0.000p = 0.026p = 0.152
L*r = −0.455 *r = −0.424 *r = −0.431 *r = 1r = −0.165r = 0.469 *
p = 0.000p = 0.000p = 0.000-p = 0.109p = 0.000
a*r = 0.574 *r = 0.497 *r = 0.227 *r = −0.165r = 1r = 0.473 *
p = 0.000p = 0.000p = 0.026p = 0.109-p = 0.000
b*r = 0.006r = −0.071r = −0.147r = 0.469 *r = 0.473 *r = 1
p = 0.954p = 0.494p = 0.152p = 0.000p = 0.000-
*: Correlation is significant at the 0.05 level.
Disclaimer/Publisher’s Note: The statements, opinions and data contained in all publications are solely those of the individual author(s) and contributor(s) and not of MDPI and/or the editor(s). MDPI and/or the editor(s) disclaim responsibility for any injury to people or property resulting from any ideas, methods, instructions or products referred to in the content.

