Article

Lightweight, Trust-Managing, and Privacy-Preserving Collaborative Intrusion Detection for Internet of Things

by
Aulia Arif Wardana
1,*,†,
Grzegorz Kołaczek
1,† and
Parman Sukarno
2
1
Department of Computer Science and Systems Engineering, Wrocław University of Science and Technology, 50-370 Wrocław, Poland
2
School of Computing, Telkom University, Bandung 40257, Indonesia
*
Author to whom correspondence should be addressed.
These authors contributed equally to this work.
Appl. Sci. 2024, 14(10), 4109; https://doi.org/10.3390/app14104109
Submission received: 16 April 2024 / Revised: 7 May 2024 / Accepted: 8 May 2024 / Published: 12 May 2024

Abstract

:
This research introduces a comprehensive collaborative intrusion detection system (CIDS) framework aimed at bolstering the security of Internet of Things (IoT) environments by synergistically integrating lightweight architecture, trust management, and privacy-preserving mechanisms. The proposed hierarchical architecture spans edge, fog, and cloud layers, ensuring efficient and scalable collaborative intrusion detection. Trustworthiness is established through the incorporation of distributed ledger technology (DLT), leveraging blockchain frameworks to enhance the reliability and transparency of communication among IoT devices. Furthermore, the research adopts federated learning (FL) techniques to address privacy concerns, allowing devices to collaboratively learn from decentralized data sources while preserving individual data privacy. Validation of the proposed approach is conducted using the CICIoT2023 dataset, demonstrating its effectiveness in enhancing the security posture of IoT ecosystems. This research contributes to the advancement of secure and resilient IoT infrastructures, addressing the imperative need for lightweight, trust-managing, and privacy-preserving solutions in the face of evolving cybersecurity challenges. According to our experiments, the proposed model achieved an average accuracy of 97.65%, precision of 97.65%, recall of 100%, and F1-score of 98.81% when detecting various attacks on IoT systems with heterogeneous devices and networks. The system is a lightweight system when compared with traditional intrusion detection that uses centralized learning in terms of network latency and memory consumption. The proposed system shows trust and can keep private data in an IoT environment.

1. Introduction

The widespread use of IoT devices has brought about numerous benefits, making our lives more convenient. However, it has also introduced significant challenges, such as the vulnerability of these devices to cyber threats [1]. The current security measures struggle to protect IoT systems, especially due to the limited resources of these devices [2]. Current CIDSs specifically designed for the unique constraints of IoT systems is lacking in lightweight architecture to improve the efficiency and effectiveness of security protocols [3]. As the number of IoT devices increases, the CIDS must be scalable to handle the growing network size. Scalability challenges may arise in terms of the computational load, communication overhead, and ability to efficiently manage a large number of devices [4]. The other problem is to ensure the trust and privacy of the CIDS in the IoT [5]. IoT systems often collect and process sensitive data. CIDSs require the sharing of information among the network and devices to detect and respond to security threats collectively. Balancing the need for information sharing with privacy concerns is a significant challenge. Ensuring that sensitive data are adequately protected during collaborative efforts is crucial to gaining user and regulatory trust [6]. Establishing trust among IoT systems is also crucial for CIDS. However, building trust in a decentralized and dynamic environment, where devices may join or leave the network frequently, poses challenges. Ensuring the reliability of communication and the integrity of information exchange is essential for effective collaborative security [7].
Given the problems in the current CIDS method, our research tries to find a multiapproach method to overcome the limitations of existing CIDS methods. The lightweight architecture, distributed across the edge, fog, and cloud layers, is intended to optimize resource usage, ensuring that security tasks are carried out efficiently without overburdening the limited capabilities of IoT devices [8]. Trust management is enhanced through the use of blockchain-based DLT, creating a decentralized and transparent trust infrastructure to improve communication reliability among IoT devices [9]. Addressing privacy concerns, this research implements FL, enabling collaborative data learning while maintaining individual information confidentiality [10]. Finding these three methods that can be expected to solve problem within the given problems, our study tries to combine lightweight architecture, trust management, and privacy-preserving techniques. The combination of these methods forms an adaptive feature of a CIDS, expected to effectively counter security threats in the resource-constrained environments typical of the IoT.
Various studies in the IoT domain utilize combined datasets that may not represent real-world conditions accurately [11,12,13]. On the other hand, some research concentrates on creating CIDS solutions for particular scenarios [14]. Additionally, although they utilize real-world IoT data, the data may be outdated, and a new dataset with realistic IoT traffic may be needed [15]. In this research, our solution is validated with the CICIoT2023 dataset, renowned for its realistic representation of IoT network traffic, allowing us to evaluate the system’s performance and adaptability. This dataset, with diverse scenarios and attack vectors, provides a real-world testing ground for our solution, showcasing its efficacy in detecting and mitigating various security threats in complex IoT networks [16].
The implementation of edge–fog–cloud architecture in some research has not yet been undertaken [13,14]. On the other hand, some researchers have implemented edge–fog–cloud architecture, but they focus on trust and privacy preservation rather than accommodating in-depth lightweight analysis [11,12,15]. This research addresses the analysis of lightweight architecture, trust management, and privacy preservation. Lightweight analysis ensures that the computational resources required for processing data remain minimal, which is crucial in resource-constrained environments like the IoT. Addressing lightweight analysis, trust, and privacy preservation in IoT research is crucial for optimizing resource usage, building trust among users, and protecting sensitive.
Our research contributes to addressing the significant challenges facing current CIDSs in IoT environments. Recognizing the vulnerability of IoT devices to cyber threats and the limitations of existing security measures due to resource constraints, our study proposes a multiapproach method to enhance CIDS effectiveness. By implementing a lightweight architecture distributed across edge, fog, and cloud layers, we optimize resource usage, ensuring security tasks are performed efficiently without overburdening IoT devices. Additionally, trust management is bolstered through blockchain-based DLT, fostering decentralized and transparent communication among IoT devices to enhance reliability. Moreover, we address privacy concerns by employing FL, enabling collaborative data learning while safeguarding individual data confidentiality. Combining these methods, our adaptive CIDS is poised to effectively counter security threats in resource-constrained IoT environments. Validated using the realistic CICIoT2023 dataset, renowned for its diverse scenarios and attack vectors, our solution demonstrates efficacy in detecting and mitigating various security threats in complex IoT networks. Unlike previous research, which either lacks implementation of edge–fog–cloud architecture or focuses solely on trust and privacy, our study comprehensively addresses lightweight analysis, trust management, and privacy preservation, crucial aspects for optimizing resource usage, building trust, and protecting sensitive data in IoT environments.

2. Related Works

This research explores the pressing challenges of enhancing security measures in the IoT landscape, which has seen exponential growth and increasing vulnerability to cyber attacks and exploitation. A notable concern is the proliferation of various and distributed attacks, orchestrated by compromised IoT systems, which pose a substantial threat to servers and network services. CIDSs have played a pivotal role in defending against these threats, employing both signature-based and anomaly-based detection methods. Nevertheless, these conventional CIDS solutions have demonstrated limitations that require novel approaches when dealing with various and distributed attacks to detect them quickly and securely.
The study conducted by [11] highlights the significance of securing IoT ecosystems due to their increasing interconnectivity and the sensitive data they manage. It introduces a hierarchical blockchain-based FL (HBFL) framework, stressing the importance of cyber threat intelligence (CTI) sharing among organizations utilizing ML-based IDS in IoT environments. This framework operates in an FL setting, utilizing blockchain-based smart contracts to promote trust and cooperation among organizations. It places a strong emphasis on safeguarding data privacy and demonstrates the practical feasibility of the solution through implementation and assessment using two prevalent IoT datasets, namely, NF-UNSW-NB15-v2 and NF-BoT-IoT-v2.
The study conducted by [12] introduces FIDChain IDS, a federated intrusion detection system customized for blockchain-enabled IoT healthcare applications, utilizing lightweight artificial neural networks (ANNs) within an FL framework. By leveraging machine learning, edge computing, and blockchain technologies, the system provides robust security measures to protect the privacy of medical data. The research demonstrates the superiority of ANN models over eXtreme Gradient Boosting (XGBoost) models in managing diverse IoT device data, especially in healthcare environments, using the BoT-IoT dataset. Through experimentation with various datasets, such as CSE-CIC-IDS2018, Bot Net IoT, and KDD Cup 99, it is observed that the BoT-IoT dataset produces consistent and precise outcomes for assessing IoT applications in healthcare. Additionally, the paper introduces a solution based on private and permissioned blockchain for the FL process, ensuring efficient and secure data sharing and aggregation compared to public blockchains that may exhibit inefficiencies in weight updates.
Research by [13] introduces a collaborative intrusion detection algorithm based on a CGAN (conditional generative adversarial network) with blockchain-enabled distributed FL. The algorithm utilizes FL to allow multiple MEC (mobile edge computing) nodes to collectively train a global intrusion detection model while ensuring decentralized and secure data management. The CGAN framework consists of a generator and a discriminator, where the generator creates synthetic intrusion samples and the discriminator distinguishes between real and synthetic samples. Moreover, blockchain technology is integrated into the algorithm to maintain the integrity and transparency of the training process. The validation of the study is conducted using the CICIDS2017 dataset.
The study by [14] presents a federated deep learning-based intrusion detection framework (FED-IDS) tailored for smart transportation systems, which delegates the learning process to distributed vehicular edge nodes. A context-aware transformer network is integrated into the framework to analyze spatial–temporal patterns of vehicular traffic flows to detect various types of attacks. The methodology employs blockchain-managed federated training to support secure, distributed, and reliable training across multiple edge nodes without a central authority. Miners in the blockchain validate decentralized local updates from participating vehicles to prevent the inclusion of unreliable information in the blockchain. This study’s validation is conducted using the ToN_IoT and Car-Hacking datasets.
Research conducted by [15] presents a blockchain-coordinated edge intelligence (BoEI) framework that integrates decentralized FL (Fed-Trust) for detecting cyber attacks in the Industrial Internet of Things (IIoT) environment. The Fed-Trust approach utilizes a temporal convolutional generative network for semisupervised learning from partially labeled data. This framework incorporates a reputation-based blockchain for decentralized transaction recording and verification, ensuring the security and privacy of data and gradients. Furthermore, fog computing is employed to relocate block-mining activities from the edge, improving the computational and communication efficiency of Fed-Trust. The validation of the study is performed using the ToN_IoT and LITNET-2020 datasets.
Based on the analysis of the previous literature, several key insights emerge. The integration of edge, fog, and cloud computing architectures proves to be a well-suited infrastructure for IoT applications. The utilization of blockchain-based DLT can establish trust in CIDSs for IoT environments. Additionally, FL emerges as a promising approach to safeguard data privacy while facilitating the sharing of CIDS training models across IoT devices and networks. Despite these advancements, there exist notable research gaps that warrant attention.
Certain studies employ combined datasets that may not accurately reflect real-world IoT conditions, as evidenced by research articles such as [11,12,13]. Conversely, other studies focus on developing CIDS solutions for specific use cases, as exemplified by [14]. Furthermore, while research like [15] utilizes real-world datasets from IoT environments, the data may be outdated, highlighting the need for more current and relevant datasets to drive advancements in the field. Moreover, it is observed that research studies like [13,14] do not implement the edge–fog–cloud architecture, whereas research studies such as [11,12,15] have implemented this architecture. However, the analysis of lightweight architecture is lacking in most studies. The primary focus has been on trust and privacy preservation rather than accommodating in-depth lightweight analysis.
Our study aims to fill that gap by employing edge–fog–cloud architecture, blockchain-based DLT, and FL for CIDS with validation using up-to-date datasets based on real-world realistic traffic. This research utilizes the CICIoT2023 dataset to rigorously evaluate our proposed CIDS. The dataset’s realistic scenarios and diverse attack simulations enable a comprehensive assessment of the proposed architecture and techniques in contexts aligned with IoT complexities [17]. Our proposed system is designed for a global scenario of the IoT, not limited to specific domains like those in research [12,13,14]. The cyber attacks analyzed in this research are more diverse, and the devices and networks from the IoT dataset are more heterogeneous. This research focuses not only on trust and privacy-preserving analysis but also on lightweight architecture analysis for the CIDS.
Building upon these prior research efforts, our study adopts a distinctive approach to analyzing diverse attacks from heterogeneous IoT system realistic traffic, combining FL with a deep neural network (DNN), blockchain-based DLT, and edge–fog–cloud architecture. We leverage the Ethereum blockchain and IPFS system as the DLT platform in this research, utilizing the CICIoT2023 dataset that simulates multiple heterogeneous devices and networks with realistic traffic from IoT for comprehensive analysis. The contributions and distinctions of this study in comparison to other research are delineated as follows:
  • This study proposes FL-DNN with a binary classification mode for a collaborative anomaly detection model in CIDS to analyze diverse attacks in heterogeneous devices and networks with realistic traffic from IoT.
  • This research used the combination of the Ethereum blockchain and interplanetary file system (IPFS) for trust management to distribute a training model for real-time traffic analysis in CIDS.
  • The proposed model underwent testing using the CICIoT2023 dataset that simulates multiple heterogeneous devices and networks with realistic traffic from the IoT for comprehensive analysis.
  • The proposed model uses a combination of edge–fog–cloud architecture and FL to create a hierarchical and lightweight architecture for a CIDS in IoT systems.

3. Methodology

To design our proposed CIDS, we initially compare the traditional CIDS architecture with the architecture we are proposing. This comparison aims to provide a comprehensive understanding of the differences between the two architectures. Additionally, we outline the specifics of the FL design employed in this research and how it integrates into our proposed CIDS architecture. We also describe the processing of the CICIoT2023 dataset within this research. Finally, we elaborate on the test scenarios and parameters that will be utilized in our experiments.

3.1. CIDS Architecture

A traditional CIDS has two primary functional units that work together to provide a high-level overview of network security. The first unit is the detection unit (consisting of a sensor and analyzer), which is responsible for monitoring subnetworks. The sensor is responsible for collecting data from the network, while the analyzer analyzes the traffic from the sensor and generates alerts. These detectors generate low-level intrusion alerts, which are then passed on to the second unit. The second unit is the data correlation unit, which takes these alerts from individual detectors and correlates them to provide a comprehensive overview of the security state of the entire network. The traditional CIDS system is shown in Figure 1 [18].
In this research, we developed a CIDS based on collaborative anomaly detection. CIDS effectively correlates evidence from various networks using a detector unit. In the collaborative anomaly detection process, each detector generates a training model. The sensor captures data from network traffic, while the analyzer analyzes the captured traffic and generates a training model. Subsequently, a correlation unit consolidates the classifier models from each detector. The results from this combination of training models in the correlation unit are then updated in the detectors’ unit for traffic analysis. Through this approach, the CIDS offers a more comprehensive strategy for network security, capable of identifying patterns and trends that might signal larger-scale attacks. However, the CIDS faces significant challenges related to the distribution of training models and potential single points of failure.
Inadequate security in model distribution can expose a CIDS to unauthorized access and tampering, potentially enabling attackers to manipulate models to evade detection or launch attacks. Data privacy concerns may also arise if sensitive training data become exposed. Additionally, a single point of failure, such as a critical node or server going down, can disrupt the entire CIDS operation, leading to false positives and negatives, reduced system resilience, and a loss of trust among users and stakeholders [19,20].
DLT offers solutions to the challenges of insecure training-model distribution and single points of failure in CIDSs. It accomplishes this by ensuring the integrity and security of data through immutable and tamper-proof records, making it exceedingly difficult for malicious nodes to manipulate information. DLT’s decentralized nature eliminates the risk of a Single Point of Failure (SPoF) and distributes data across multiple nodes, enhancing system resilience. The consensus mechanisms inherent in DLT provide a safeguard against byzantine failures, allowing the system to reach agreement on accurate data even when some nodes behave maliciously. Additionally, DLT’s transparency and accountability features enable traceability and auditing, crucial for identifying and addressing anomalies. Overall, DLT bolsters CIDSs by safeguarding the training model and eliminating single points of failure [21,22].
Therefore this research used DLT-based CIDS to prevent byzantine failures and single points of failure. The proposed architecture for a DLT-based CIDS can be seen in Figure 2. This research used the combination of Ethereum blockchain and IPFS as a DLT platform. Ethereum blockchain and IPFS are well suited for data sharing and distribution due to their complementary features. Ethereum’s immutable ledger and smart contract functionality provide secure and tamper-proof data storage, along with the ability to automate data sharing agreements and access controls. Meanwhile, IPFS offers a decentralized and highly available content-addressable storage system that ensures data resiliency and efficient retrieval through cryptographic hashes. Together, they create a powerful platform for sharing and distributing data with features like censorship resistance, cost-efficiency, and interoperability, making them ideal for applications where secure and decentralized data sharing is paramount [23].
This research also used edge–fog–cloud architecture for a hierarchical CIDS based on DLT. The architecture is a multitiered infrastructure that leverages the combined strengths of edge, fog, and cloud computing to enhance the security and efficiency of intrusion detection [24,25]. In this architecture, detector units in edge devices capture the network traffic through sensor units. After that, the detector unit analyzes the captured traffic locally through the analyzer unit. Fog computing layers, situated closer to the core network, further refine and aggregate the model from edge devices to build the fog layer training model. The fog computing layer averages the weight from each device training model and another for devices. Finally, the cloud provides aggregate data from fog devices to build the global training model. The cloud layer also provides the integration of DLT for secure model sharing and transaction recording, ensuring data integrity and trustworthiness. The global training model is sent back to the fog layer and edge layer to update the local model in each layer.
This research used FL with hierarchical updates in the edge–fog–cloud architecture. Further details of the proposed model can be seen in Figure 3. The image depicts a detailed flowchart outlining a process for managing a dataset within the realm of hierarchical updates in the FL concept. It showcases the progression from splitting the dataset into training and detection subsets to the final detection result. The dataset is initially divided into a 70% training set and a 30% detection dataset. The process begins with the initialization of a global model on the cloud server, and edge devices and fog nodes are selected to participate. Each round of FL involves selecting edge devices, distributing the global model to them, allowing local training without sharing data, aggregating updated models at the fog node, and sending the consolidated model back to the cloud server. This round-based communication is repeated for multiple rounds to iteratively enhance the global model by incorporating local knowledge from edge devices. Through this iterative process, the global model converges to reflect the collective intelligence of all participating edge devices.
In testing the detection performance in each layer of a produced training model, a series of data tests can be conducted to evaluate the model’s effectiveness at different stages. In the edge layer, data tests are used to assess the model performance in edge devices. Moving to the fog layer, the data tests are carried out to evaluate the model’s performance after aggregation and processing at the fog node. In the cloud layer, the data tests are conducted on the fully trained model to assess its detection performance in a centralized environment.

3.2. FL with DNN

FL is a decentralized machine learning approach where a global model is learned by combining locally trained models from data-generating clients, allowing a wide array of participants, such as smartphones and connected vehicles, to contribute to the learning process. The FedAvg algorithm, short for federated averaging, is a fundamental component of FL that facilitates the aggregation of these locally trained models. The process begins with the initialization of global model parameters, denoted as w 0 , and proceeds iteratively. During each communication round, every client i trains a local model using its data and the current global model parameters, represented as w i t at communication round t. These local models are then shared with the server. The server receives a set of models { w i t } from all clients. The aggregation step occurs at the server, where the received local models are averaged to update the global model. The updated global model parameters are calculated as Formula (1).
w ( t + 1 ) = 1 N i = 1 N w i t
where w ( t + 1 ) represents the updated global model parameters after communication round t + 1 , and N denotes the total number of clients participating in FL. This process repeats for several communication rounds until the model convergence criteria are met. FedAvg harnesses the collaborative power of decentralized data sources while ensuring the privacy of individual clients in the FL framework [26,27].
Furthermore, this research presents a CIDS capable of monitoring heterogeneous setups from an IoT network. The strategy involves combining a DNN with FL. Network data are collected in each edge device. Individual DNN base classifiers, trained on these devices, capture network-specific patterns. The weight of DNN classifiers from each network is averaged using FedAvg in fog devices. The system continuously adapts to changing network dynamics by updating the global DNN classifiers with new weights from each edge and fog device.
A DNN is a type of machine-learning algorithm that takes inspiration from the human brain. It comprises three main components: an input layer, an output layer, and one or more hidden layers. These hidden layers process input data from the input layer to generate output through a series of transformations. Each layer contains perceptrons, which are units that process data using input values ( x i ) and weight values ( w i ). The inputs and weights are combined using summation and bias addition, as shown in Formula (2) for a hidden layer.
z = i = 1 n ( x i · w i ) + b
a = ReLU ( z ) = max ( 0 , z )
y ^ = σ ( z ) = 1 1 + e z
The output of this summation and bias addition undergoes an activation process before being outputted. This study employs rectified linear unit (ReLU) activation in hidden layers and sigmoid activation in the output layer. ReLU aids in capturing intricate data patterns, while sigmoid in the output layer offers a probabilistic view of the model’s predictions, making it suitable for classification tasks. By combining these activation functions, the neural network architecture becomes more robust and efficient. The ReLU activation in the hidden layer is represented by Formula (3), while the sigmoid activation in the output layer is shown in Formula (4).
For training, this research focuses on a binary classification task related to cyber attacks. Stochastic gradient descent (SGD) is utilized as the optimizer during the DNN training process. SGD is an optimization algorithm commonly used in training neural networks. It updates model parameters iteratively based on minibatches of training data. The parameter update step in SGD is expressed in Formula (5), where θ ( t ) represents the parameter vector at iteration t, η is the learning rate, and J ( θ ( t ) ; x ( i ) , y ( i ) ) is the gradient of the loss function J with respect to the parameters θ ( t ) computed using a single training example ( x ( i ) , y ( i ) ) .
θ ( t + 1 ) = θ ( t ) η J ( θ ( t ) ; x ( i ) , y ( i ) )
M S E = 1 N i = 1 N ( y i y ^ i ) 2
Moreover, mean squared error (MSE) is employed as the loss function for training the DNN. MSE is a commonly used loss function in DNNs for regression tasks. It calculates the average squared difference between predicted and actual target values in the training data, as shown in Formula (6). The MSE loss function evaluates the model’s performance by penalizing larger errors more heavily than smaller ones, aiming to minimize the overall error during training [28,29].

3.3. Dataset Preprocessing

The CICIoT2023 dataset is a collection of IoT data. This dataset is designed to support research in the field of IoT security and includes various types of IoT network traffic data for analysis and experimentation. This research use the CICIoT2023 dataset to develop and evaluate the proposed CIDS tailored to IoT environments. It serves as a valuable resource for advancing the understanding of IoT security challenges and developing effective defense mechanisms against potential threats and attacks in IoT systems. The dataset has 47 features including labels from the traffic. The details of the dataset feature can be seen in Table 1.
This research used a labeled CSV version of the CICIoT2023 dataset. However, the dataset is large in size. Therefore, only 30% of the dataset was utilized in this study. Details of the dataset traffic used in this research can be seen in Table 2.
This research used nonidentically distributed (non-IID) data splits across clients [30]. Each client receives a fraction of the data for training its local model, and these local models are then aggregated to update the global model. By distributing the data in this manner, FL enables data training in each edge layer that has a heterogeneous setup. The non-IID data split design of this research can be seen in Algorithm 1. The function initiates by setting a random seed based on the ‘client_id’, ensuring consistent randomization across different clients. Subsequently, it generates an array of indices representing the entirety of the training dataset (‘X_train’) and shuffles these indices to introduce randomness into the data selection process.    
Algorithm 1: Load and Distribute CICIoT2023 Data Train
Input: client_id
Output: X client , y client
            
# Create non-IID splits based on client_id
Set random seed using client_id
Generate array of indices [ 0 , 1 , , len ( X train ) 1 ]
Shuffle the indices
            
# Choose a fraction of the data for this client
Set fraction = 0.04
Calculate client data size = int ( 0.04 × len ( X train ) )
Select client indices from shuffled indices based on client data size
            
X client = X train [client_indices]
y client = y train .iloc[client_indices]
return  X client , y client
    A crucial aspect of FL is the allocation of data fractions to individual clients. Here, the function selects a predetermined fraction of the data (commonly represented as ‘fraction’, set to 0.04 in the provided code) to be assigned to each client. The size of this allocation, termed ‘client_data_size’, is determined based on the specified fraction and the total size of the training data. Client-specific indices are then selected from the shuffled array, corresponding to the subset of data allocated to each client. These indices are used to extract the relevant data (‘X_client’ and ‘y_client’) from the training dataset (‘X_train’ and ‘y_train’). Finally, the function returns the client-specific data (‘X_client’ and ‘y_client’) for training data in each edge device. In FL, the test dataset is typically shared among all clients to evaluate the performance of the global model.

3.4. Performance Parameters

In this study, various parameters were utilized to assess the benchmarking analysis. The algorithms’ accuracy, F1-score, precision, and recall were evaluated within the benchmarking scenarios. These metrics are crucial for evaluating classification tasks as they offer diverse viewpoints on the model’s performance. Each metric provides unique insights into the model’s predictive abilities, aiding in evaluating its efficacy in addressing classification challenges.
Furthermore, this research measured the training model’s size generated by each algorithm and the duration of both training and testing procedures. These metrics are pivotal for the practical implementation and performance of classification models, impacting resource allocation, costs, latency, scalability, and user experience. Striking a balance between model size, training duration, and prediction time is essential to ensure the development of efficient, effective, and feasible solutions for classification tasks in real-world applications.
  • Accuracy (%): The accuracy of an IDS is crucial for effectively identifying and responding to malicious activity while minimizing false positives. High accuracy indicates correct identification of true positives and true negatives. Accuracy is computed as in Formula (7) [31].
    T P + T N T P + F P + T N + F N = A c c u r a c y
    where TP is true positive, TN is true negative, FP is false positive, and FN is false negative.
  • Precision (%): Precision in IDS is the ratio of true-positive predictions to the total positive predictions made by the model, measuring the accuracy of positive predictions. It calculates the proportion of correctly predicted positive instances out of all instances predicted as positive. Precision is computed as in Formula (8) [31].
    T P T P + F P = P r e c i s i o n
  • Recall (%): The recall metric, also known as sensitivity or the true-positive rate, is the ratio of true-positive predictions to the total actual positive instances in the dataset. It gauges the model’s ability to correctly identify positive instances, regardless of some instances being wrongly predicted as negative. Recall is computed as in Formula (9) [31].
    T P T P + F N = R e c a l l
  • F1-Score (%): The F1-score, a widely used metric in machine learning for classification tasks, combines precision and recall into a single value to measure the model’s accuracy. It offers a balanced evaluation of the model’s performance, especially when false positives and false negatives are equally significant. F1 is computed as in Formula (10) [31].
    2 ( P r e c i s i o n R e c a l l ) P r e c i s i o n + R e c a l l = F 1 S c o r e ( F 1 )
  • TPS: Measuring TPS for DLT involves assessing the system’s transaction processing rate within a one-second time frame, serving as a crucial metric for evaluating a DLT’s performance and scalability. TPS is determined by tracking the successful recording and confirmation of transactions on the ledger, reflecting the system’s efficiency and capacity to accommodate a growing number of participants and transactions without compromising speed and reliability. This metric is influenced by factors such as the DLT’s technology, consensus mechanism, network capabilities, and data-handling processes. In terms of hardware resources, TPS is closely tied to both CPU and RAM. The CPU is responsible for processing and validating incoming transactions, while RAM aids in efficient data storage and retrieval. An effective combination of CPU and RAM resources is vital for achieving and sustaining high TPS rates in a DLT system, as they contribute to accelerated transaction processing and reduced latency. The formula for calculating TPS can be expressed as Formula (11) [32].
    T P S = T o t a l T r a n s a c t i o n s T i m e P e r i o d
    where T P S is the transactions per second, T o t a l T r a n s a c t i o n s represents the total number of transactions processed during the chosen time period, and T i m e P e r i o d is the duration over which the transactions are measured in seconds.
  • Latency (s): Measuring latency in an edge–fog–cloud architecture involves assessing the time it takes for data or a computational task to travel through the various layers of the architecture. Latency in this context refers to the delay introduced at different stages of processing, from the edge devices to the fog nodes and ultimately to the cloud servers. For network latency measurement, this research uses the following Formula (12) [33]:
    Latency = Data Size Transmission Speed
    where L a t e n c y is the round-trip time it takes for data to travel from the source to the destination and back. It is measured in seconds. D a t a S i z e is the size of the data being transmitted, expressed in kilobytes (KB). The measurement ensures that the size is consistent with the units used for network transmission speed. T r a n s m i s s i o n S p e e d represents the capacity of the network to transmit data and is typically measured in kilobits per second (Kbps) [34].
  • CPU and memory (%): Measuring the average CPU and memory usage during a learning process is crucial for assessing the computational demands of a machine learning model. This research utilizes system monitoring tools like ‘psutil’ in Python to provide real-time insights into CPU and memory usage [35].

3.5. Benchmarking Scenario

This research encompasses four categories of benchmarking scenarios. Details for each scenario are provided below:
  • Detection performance: The first scenario involves benchmarking the performance of the FL-DNN model to test it using testing data from all devices. The parameters analyzed in this measurement are accuracy, precision, recall, and F1-score.
  • Transaction performance: The second scenario aims to evaluate the performance of the DLT when handling transactions in the proposed CIDS model. The parameter analyzed in this measurement is transactions per second (TPS).
  • Network latency performance: The third scenario is calculating network latency in an edge–fog–cloud architecture. This scenario involves assessing the time it takes for data to traverse the communication layers within the system. Beginning with edge latency, the duration for data to move from edge devices to local processing units is measured, considering local network dynamics. Moving to fog latency, the time taken for data processing at fog nodes, which offer additional computational capabilities closer to the edge, is evaluated. Cloud latency assessment follows, considering the round-trip time for data to travel from the edge and fog layers to centralized cloud servers and back. End-to-end latency encapsulates the total time for data or tasks to traverse the entire architecture, encompassing edge, fog, and cloud layers. Network latency, an essential component, examines the delays introduced during data transmission between these layers.
  • Resource consumption performance: The fourth testing scenario involves measuring resource consumption. The performance of resource consumption focuses on CPU and memory consumption during the training process. In this research, we compare the learning process between centralized learning and federated learning when distributed in edge computing. We monitor the CPU and memory consumption every second during the learning process, then average all the captured values from CPU and memory consumption to calculate the CPU and memory consumption in a single learning process. In FL based on edge–fog–cloud architecture, we monitor the learning process in 5 rounds.

4. Results

This section assesses the proposed system using a benchmarking scenario and performance metrics described in the previous section. It also explains the environment setup for simulating the proposed system.

4.1. Experiment Environment and Configuration

In this research, a server with specific hardware specifications was employed for conducting the experiments. The server was equipped with a 2.3 GHz 16-core Intel(R) Xeon(R) CPU E5-2650 v3 and 128 GB of memory. The operating system utilized was Ubuntu 22.04.2 LTS. Machine learning experiments were conducted using Python version 3.10.6 and Keras version 2.12 as the machine learning library. The presentation of experiment results was facilitated through Jupyter Notebook version 6.5.3. Additionally, this research used Truffle 5.11.5 for smart contracts and blockchain simulators, and a connection to Truffle was established using the web3 library from Python. This research used IPFS Kubo 0.23.0 to create a private IPFS server. Detailed configurations of the DNN hyperparameters used in this research can be found in Table 3 and Table 4.
IPFS enables data to be stored across a network of nodes, ensuring redundancy and accessibility. Smart contracts, running on blockchain platforms like Ethereum, can reference IPFS file addresses, making it feasible to store large data or sensitive information off-chain while retaining a reference to it on the blockchain. The smart contract design of this research can be seen in Algorithm 2.
This approach mitigates the limitations of blockchains in terms of data storage and costs. Smart contracts can trigger actions based on the content stored on IPFS, automating processes like content delivery, identity verification, or secure data exchange. This combination provides a decentralized and tamper-resistant solution for applications that require secure, auditable, and efficient handling of data while reducing the burden on the blockchain itself.
Algorithm 2: Transaction in FL-DNN based on DLT
Applsci 14 04109 i001

4.2. Centralized Learning vs. FL Based on Edge–Fog–Cloud Architecture

In this section, an analysis of the classification performance is conducted, comparing a traditional IDS with centralized learning and a CIDS with FL based on edge–fog–cloud for IoT. The performance evaluation encompasses metrics such as accuracy, precision, recall, and F1-score. Additionally, the loss parameter is examined to quantify the disparity between predicted values of the model and the actual ground-truth values in the dataset. Furthermore, parameters including training time, average CPU, and memory usage are analyzed for comparison in a lightweight analysis. This study delves into these parameters at each layer, starting from the edge layer, progressing to the fog layer, and culminating at the cloud layer where the global model is aggregated. It compares the proposed system with a centralized learning mode using the same dataset and DNN machine learning algorithm in terms of detection performance.

4.2.1. Centralized Learning Performance

The results of centralized learning are presented in Table 5. The loss value indicates the error of the model’s predictions compared to the true labels. In this case, the loss value is 0.0045648, which suggests that the model’s predictions are relatively close to the true labels, indicating good performance. Accuracy measures the proportion of correctly classified samples out of the total number of samples. With an accuracy of 99.36%, the model correctly classifies a high percentage of the samples. Precision measures the proportion of true-positive predictions out of all positive predictions made by the model. With a precision of 99.55%, the model has a high precision, indicating that when it predicts a positive class, it is usually correct. Recall measures the proportion of true-positive predictions out of all actual positive samples in the dataset. With a recall of 99.79%, the model effectively captures a high percentage of the positive samples. The F1-score is the harmonic mean of precision and recall, providing a balance between the two metrics. With an F1-score of 99.67%, the model achieves a high balance between precision and recall, indicating robust performance. Additionally, the training time for the model was substantial, totaling 4041.07 s, suggesting comprehensive training and optimization processes. Despite the extensive training duration, the model’s resource utilization remained modest, with an average CPU usage of 4.7% and memory consumption of 40.78 GB.

4.2.2. FL on Edge Layer Performance

Now, we analyze the results from FL within the edge–fog–cloud architecture. In this analysis, each graph illustrates the progression of devices over multiple rounds (on the x axis), during which they compute the loss function value (on the y axis) associated with their segment of the model training. The initial analysis focuses on assessing the performance of the loss parameter. The performance outcomes of the loss parameter at the edge layer are depicted in Figure 4. The graph comprises five line graphs labeled from A to E, each representing the ‘loss trend’ for a different ‘fog device’ (from Device 1 to Device 5) across several rounds of an FL process within an edge–fog–cloud architecture. Each ‘fog device’ oversees five ‘edge devices’ involved in the learning process, with the colors in the curves corresponding to different edge devices contributing to the learning process.
The loss function serves as a metric for evaluating the model’s predictive accuracy against the actual data, with lower values indicating superior performance. The graphs illustrate fluctuations in loss values across rounds, reflecting the iterative process towards improved performance. Among the fog devices, variations in average loss across their respective edge devices are observed. Notably, for Fog Device 1, Edge Device 1 stands out with the lowest average loss of 0.0067, indicating effective learning, while Edge Device 4 exhibits the highest average loss of 0.0102, suggesting potential challenges in model training or data quality. Fog Device 2 generally demonstrates lower average losses, with Edge Device 1 displaying the lowest average loss at 0.0064, though Edge Device 4 shows a slightly higher average loss of 0.0087, indicating varying levels of learning effectiveness. Fog Device 3 consistently maintains efficient learning across its edge devices, all exhibiting low average losses, with Edge Device 5 showcasing the lowest average loss of 0.0063, suggesting slightly better performance. On the other hand, Fog Device 4 displays significant variance in average loss among its edge devices, with Edge Device 2 recording the highest average loss of 0.0118, possibly indicating specific learning challenges or data processing issues, while Edge Device 3 demonstrates a notably lower average loss of 0.0066, implying more effective learning. Lastly, Fog Device 5 and Fog Device 3 demonstrate consistent performance with low average losses across edge devices, with Edge Device 4 leading with the lowest average loss of 0.0061, indicating superior learning efficiency.
This analysis indicates that while most edge devices perform consistently with low average losses, certain devices (e.g., Edge Device 4 from Fog Device 1 and Edge Device 2 from Fog Device 4) exhibit higher losses, which may highlight areas for potential improvement or investigation into the training data or model parameters. Overall, the FL system appears to perform well, with most devices demonstrating efficient learning capabilities.
The subsequent analysis focuses on the accuracy of the proposed system. The performance outcomes concerning the accuracy parameter at the edge layer are depicted in Figure 5.
Among the edge devices under each fog device, variations in average accuracy are observed. In Fog Device 1, the edge devices display closely grouped average accuracy values, with Edge Device 1 achieving the highest average accuracy of 99.07%, while Edge Device 4 exhibits the lowest at 98.76%, indicating marginal performance differences. Similarly, Fog Device 2 demonstrates closely aligned performance across its edge devices, with Edge Device 1 leading slightly with an average accuracy of 99.09%, and Edge Device 4 recording the lowest at 98.88%. Notably, Fog Device 3 stands out for its exceptional and consistent performance across edge devices, with Edge Device 4 attaining the highest average accuracy of 99.12%, showcasing effective coordination. Conversely, Fog Device 4 presents a broader range of average accuracies among its edge devices, with Edge Device 3 performing well at 99.06%, while Edge Device 2 lags behind at 98.60%, indicating significant performance variance. Lastly, Fog Device 5 demonstrates robust and consistent accuracy across its edge devices, with Edge Device 4 leading with an average accuracy of 99.12%, reflecting effective learning and model optimization strategies. These insights suggest that while most edge devices across the fog devices perform consistently well, there are notable exceptions (e.g., Edge Device 4 from Fog Device 1 and Edge Device 2 from Fog Device 4) that highlight areas for potential improvement. Overall, the FL system shows a promising capacity for maintaining high accuracy levels across a diverse set of edge devices.
The subsequent analysis pertains to the precision of the proposed system. The performance outcomes related to the precision parameter at the edge layer are illustrated in Figure 6.
Precision levels across edge devices under each fog device vary in their predictive accuracy. In Fog Device 1, the edge devices demonstrate high precision, with Edge Device 1 leading with an average precision of 99.68%, while Edge Device 4 exhibits the lowest average precision at 99.29%, still indicating a high level of predictive accuracy. Fog Device 2 maintains consistent high precision across its edge devices, with Edge Device 5 standing out with the highest average precision of 99.73%, showcasing exceptional performance in predicting positive classes. Similarly, Fog Device 3 also exhibits high precision across all edge devices, with Edge Device 5 slightly leading with an average precision of 99.72%, indicating very accurate model predictions. In contrast, Fog Device 4 shows more variance in precision among its edge devices, with Edge Device 2 having the lowest average precision of 98.98%, suggesting room for improvement, while Edge Device 3 displays a strong average precision of 99.67%. Fog Device 5, like the other fog devices, demonstrates high precision across its edge devices, with Edge Device 4 achieving the highest average precision of 99.68%, indicating very accurate identification of positive cases.
Overall, the FL system under study showcases impressive precision across most edge devices and fog devices, indicating a strong ability to accurately predict positive outcomes. The slight variances observed suggest targeted opportunities for model optimization, especially for the devices with relatively lower precision scores. This analysis underscores the system’s effectiveness in precision-oriented tasks, with specific areas identified for further enhancement.
The subsequent analysis pertains to the recall of the proposed system. The performance outcomes related to the recall parameter at the edge layer are depicted in Figure 7.
The performance of edge devices under each fog device in terms of recall varies in their ability to identify true positives accurately. Fog Device 1 showcases high recall rates, with Edge Device 4 leading with the highest average recall of 99.45%. The differences among the devices are minimal, indicating consistent performance in detecting true positives. Fog Device 2 follows a similar trend with high recall rates across its edge devices. Edge Device 3 exhibits a slightly higher average recall of 99.43%, while Edge Device 5 shows the lowest at 99.24%, suggesting a small variance in minimizing false negatives. Fog Device 3 demonstrates a uniform performance in recall across its edge devices, with Edge Device 4 leading with an average recall of 99.39%, indicating a balanced detection rate of positive instances. Fog Device 4 presents a notable trend, with Edge Device 2 achieving the highest average recall of 99.60% and Edge Device 3 slightly lower at 99.36%, highlighting a robust ability to capture true positives, especially in Edge Device 2. Fog Device 5 maintains strong recall rates, with Edge Device 1 displaying the highest average recall of 99.50%. The performance across edge devices is closely matched, reflecting the effective identification of positive instances.
These insights suggest that the FL system, across most edge devices and fog devices, achieves a commendable level of recall, efficiently identifying true positives. The minor variances observed among some devices provide focal points for further optimization to enhance the system’s overall sensitivity. This analysis confirms the system’s effectiveness in scenarios where missing a positive detection is critical.
The next analysis regards the F1-score of the proposed system. The performance results of the F1-score parameter in the edge layer can be seen in Figure 8.
The F1-scores of the edge devices under each fog device reflect their ability to strike a balance between precision and recall in model performance. Fog Device 1 demonstrates high and consistent F1-scores across its edge devices, with Edge Device 1 leading slightly with an average F1-score of 99.52%. The variance among the devices is minimal, indicating a stable performance in achieving the desired balance. Similarly, Fog Device 2 exhibits strong and consistent F1-scores, with Edge Device 1 having the highest average F1-score of 99.53% and Edge Device 4 showing the lowest at 99.43%, suggesting slight differences in model optimization. Fog Device 3 showcases exceptional balance, with Edge Device 4 achieving the highest average F1-score of 99.55% and all edge devices performing consistently well. In contrast, Fog Device 4 displays a wider range of average F1-scores, with Edge Device 3 scoring high at 99.52% and Edge Device 2 the lowest at 99.29%, indicating variability in balancing precision and recall effectively. Fog Device 5 maintains strong performance across its edge devices, with Edge Device 4 leading with the highest average F1-score of 99.55%. The performance consistency among the devices suggests a uniformly effective approach to minimizing both false positives and false negatives.
These findings suggest that the FL system, on average, achieves a commendable balance between precision and recall across most edge devices and fog devices. The slight variances observed among some devices provide opportunities for targeted improvements to further enhance the models’ effectiveness. Overall, the system demonstrates a strong capability in achieving high F1-scores, which is indicative of well-balanced and effective model performance.

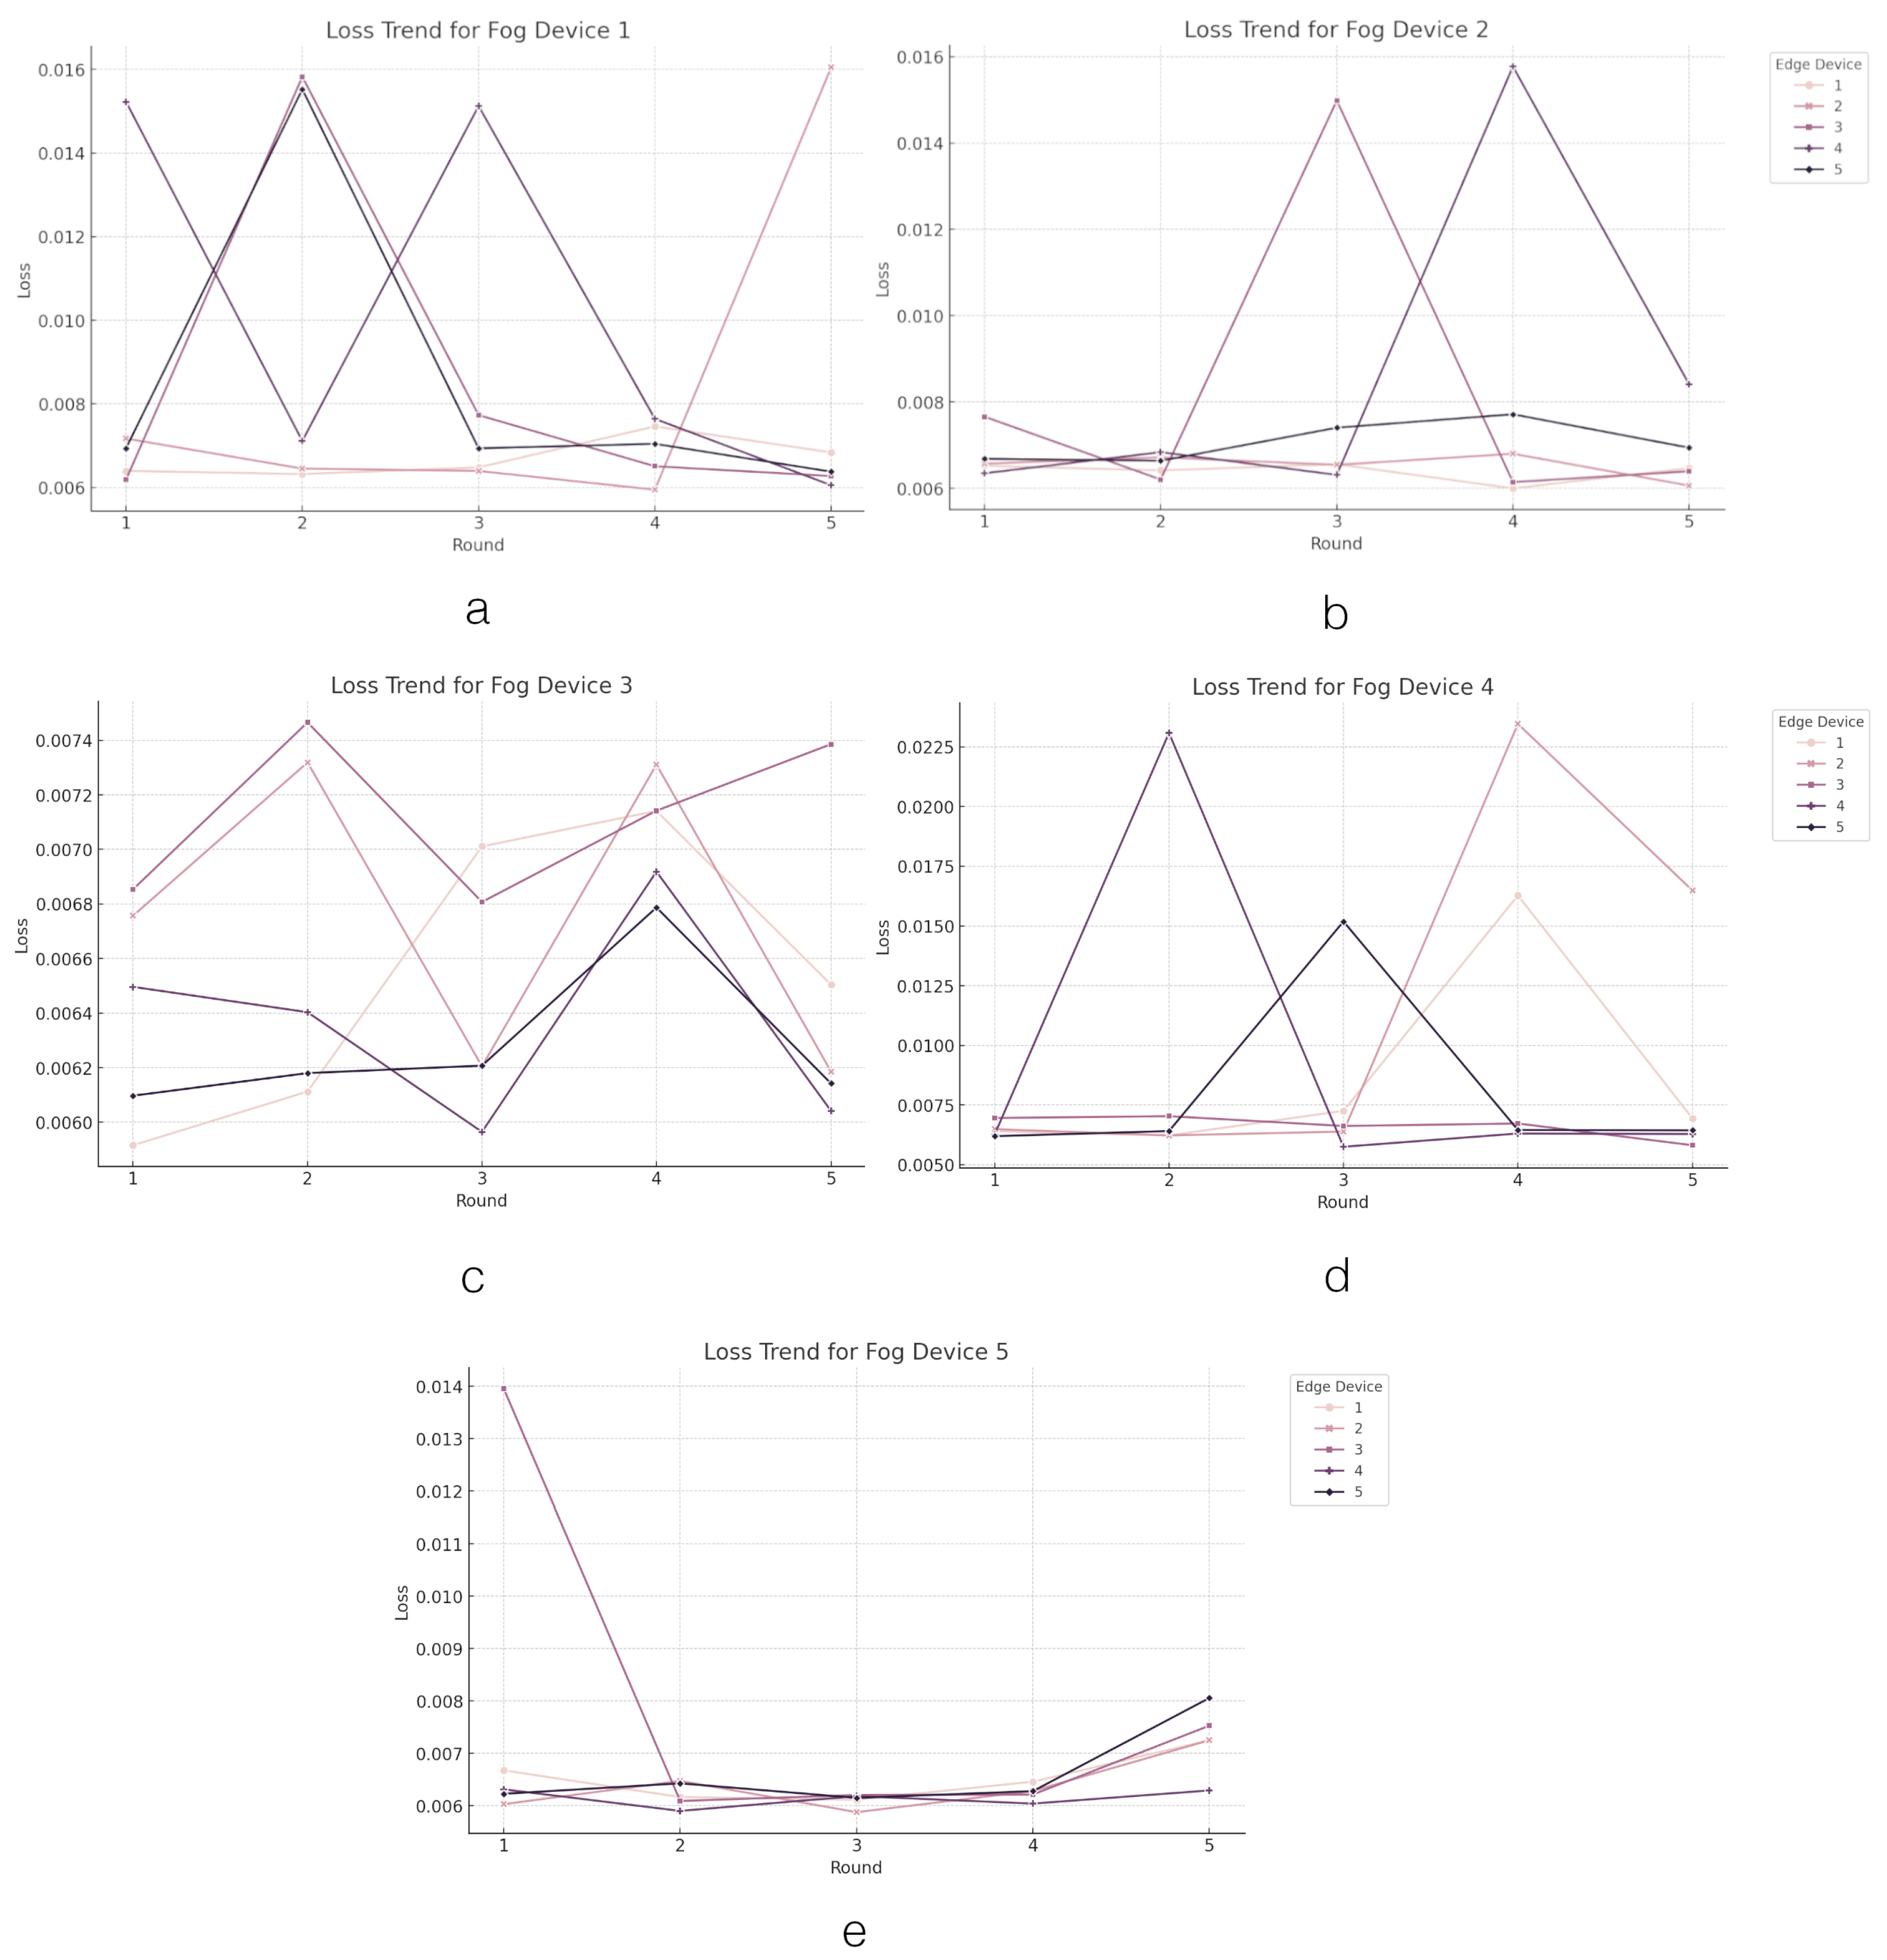
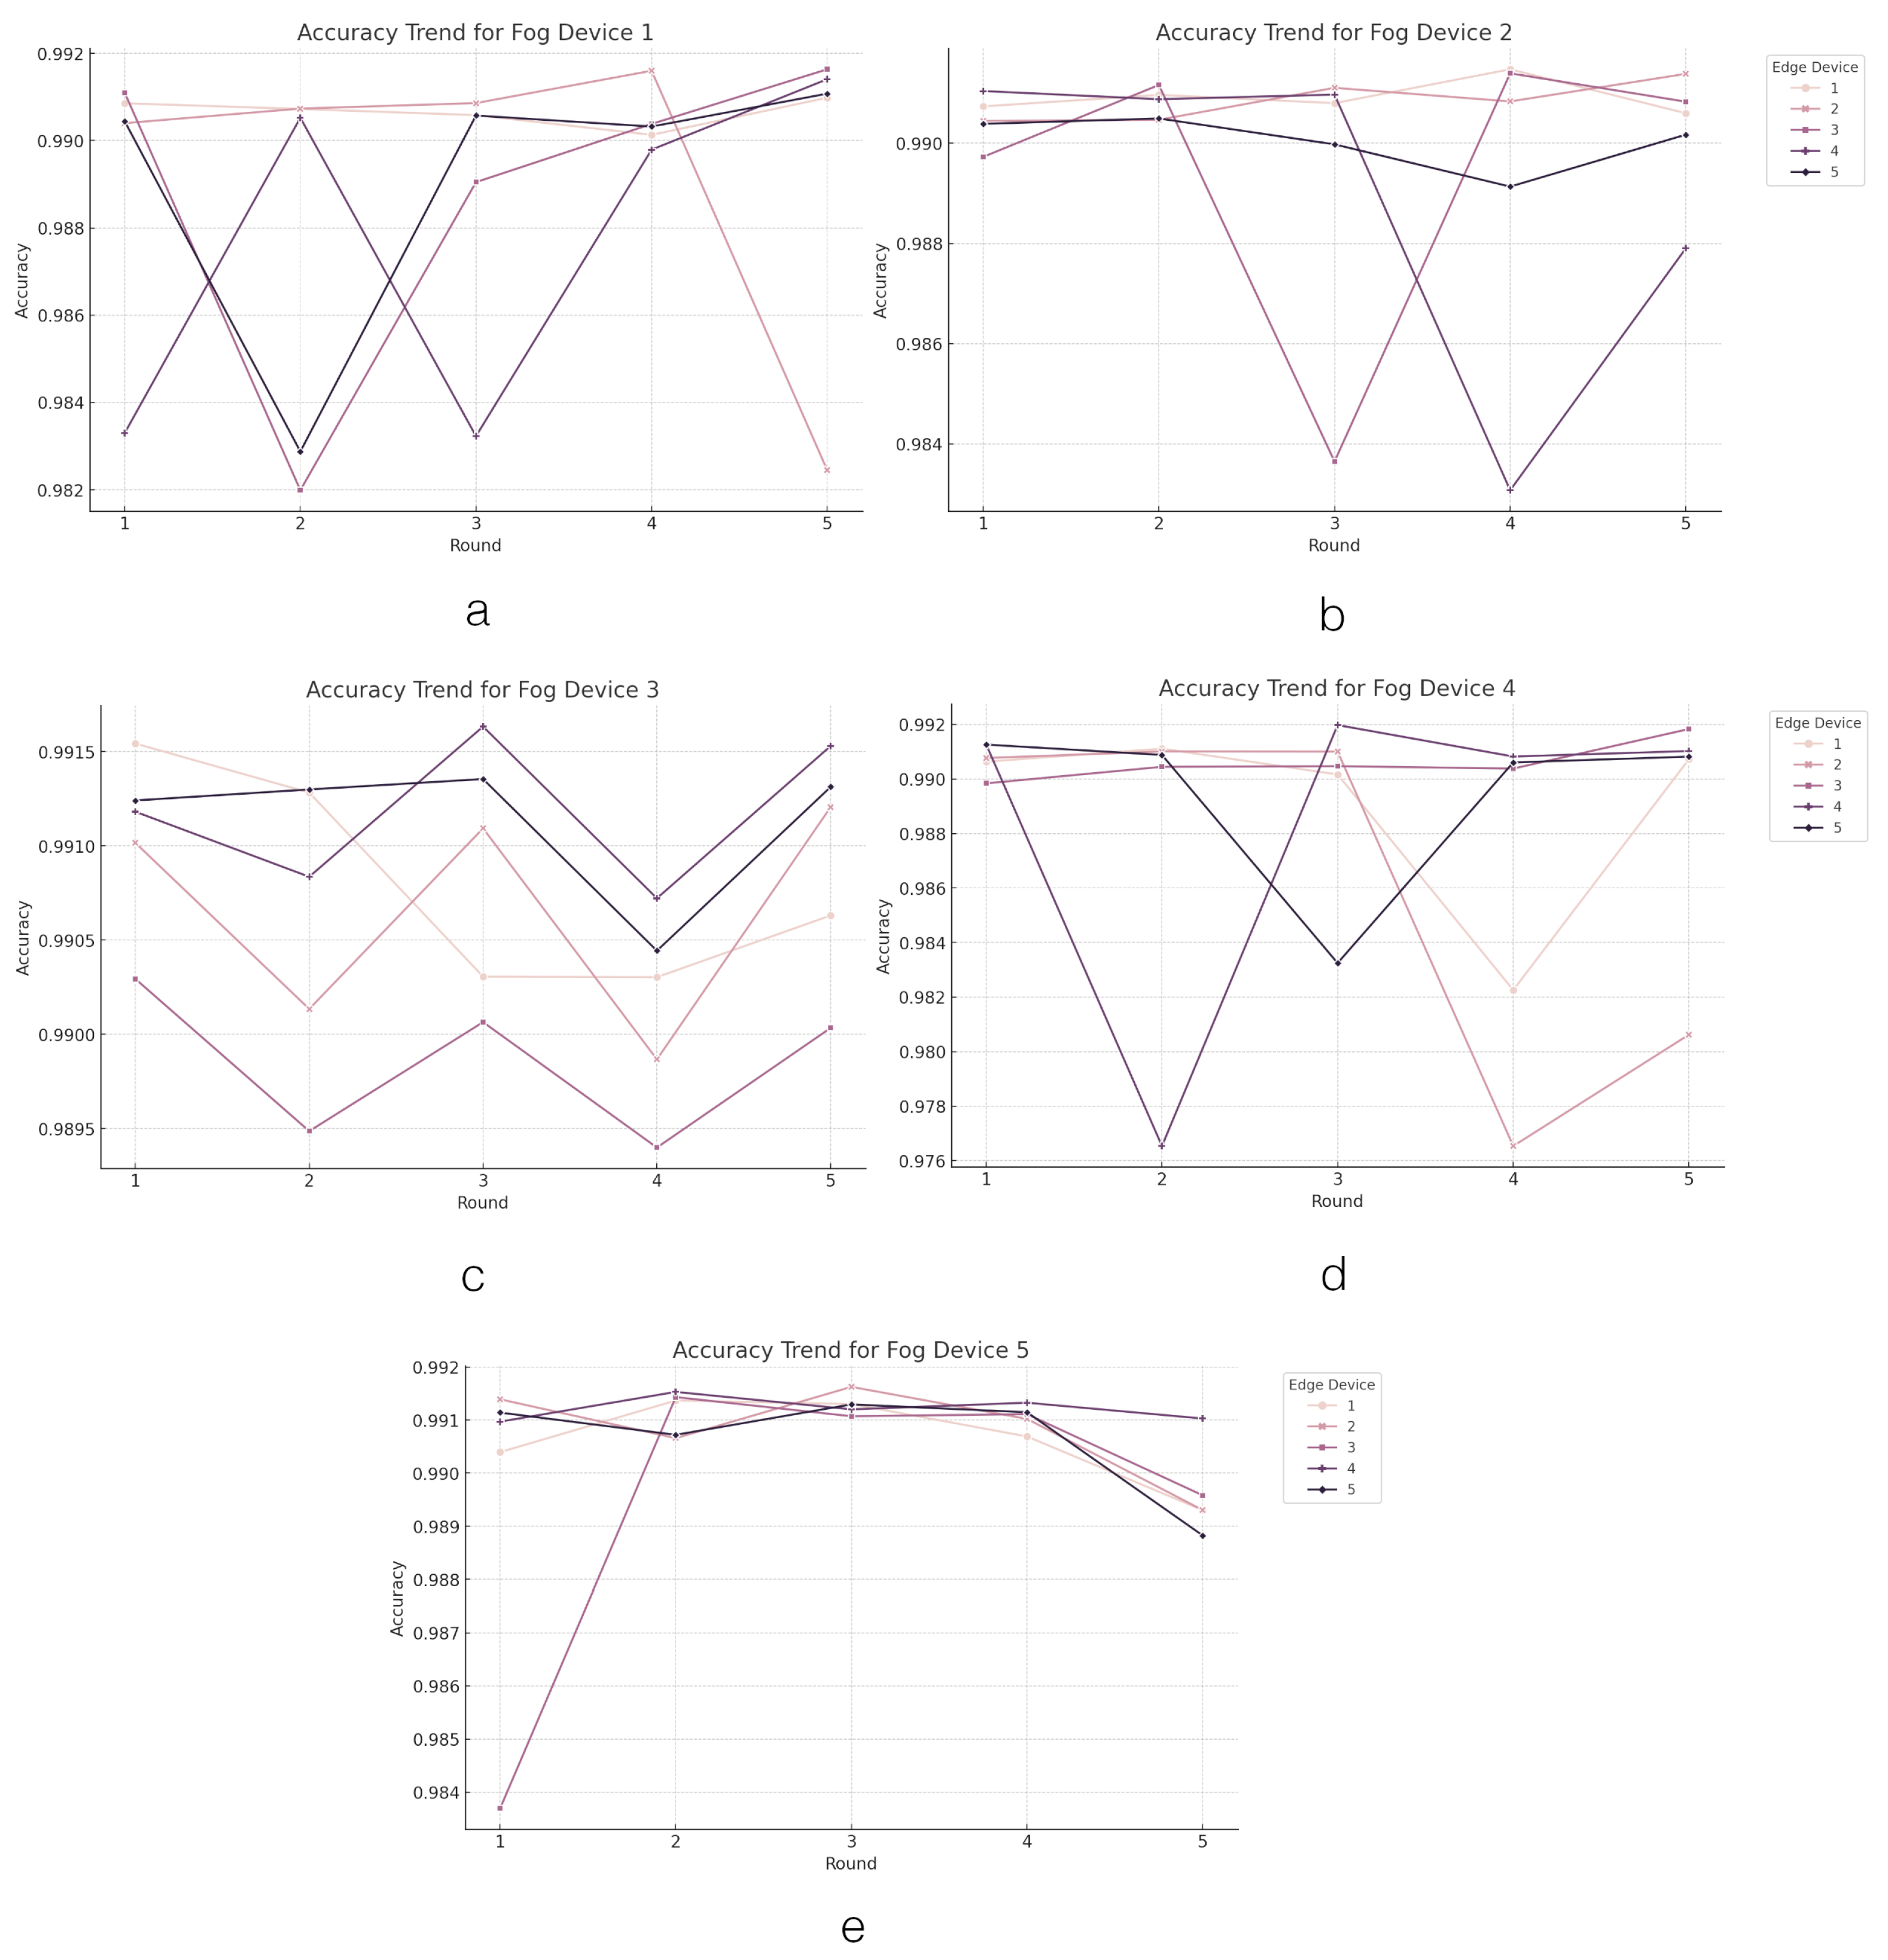
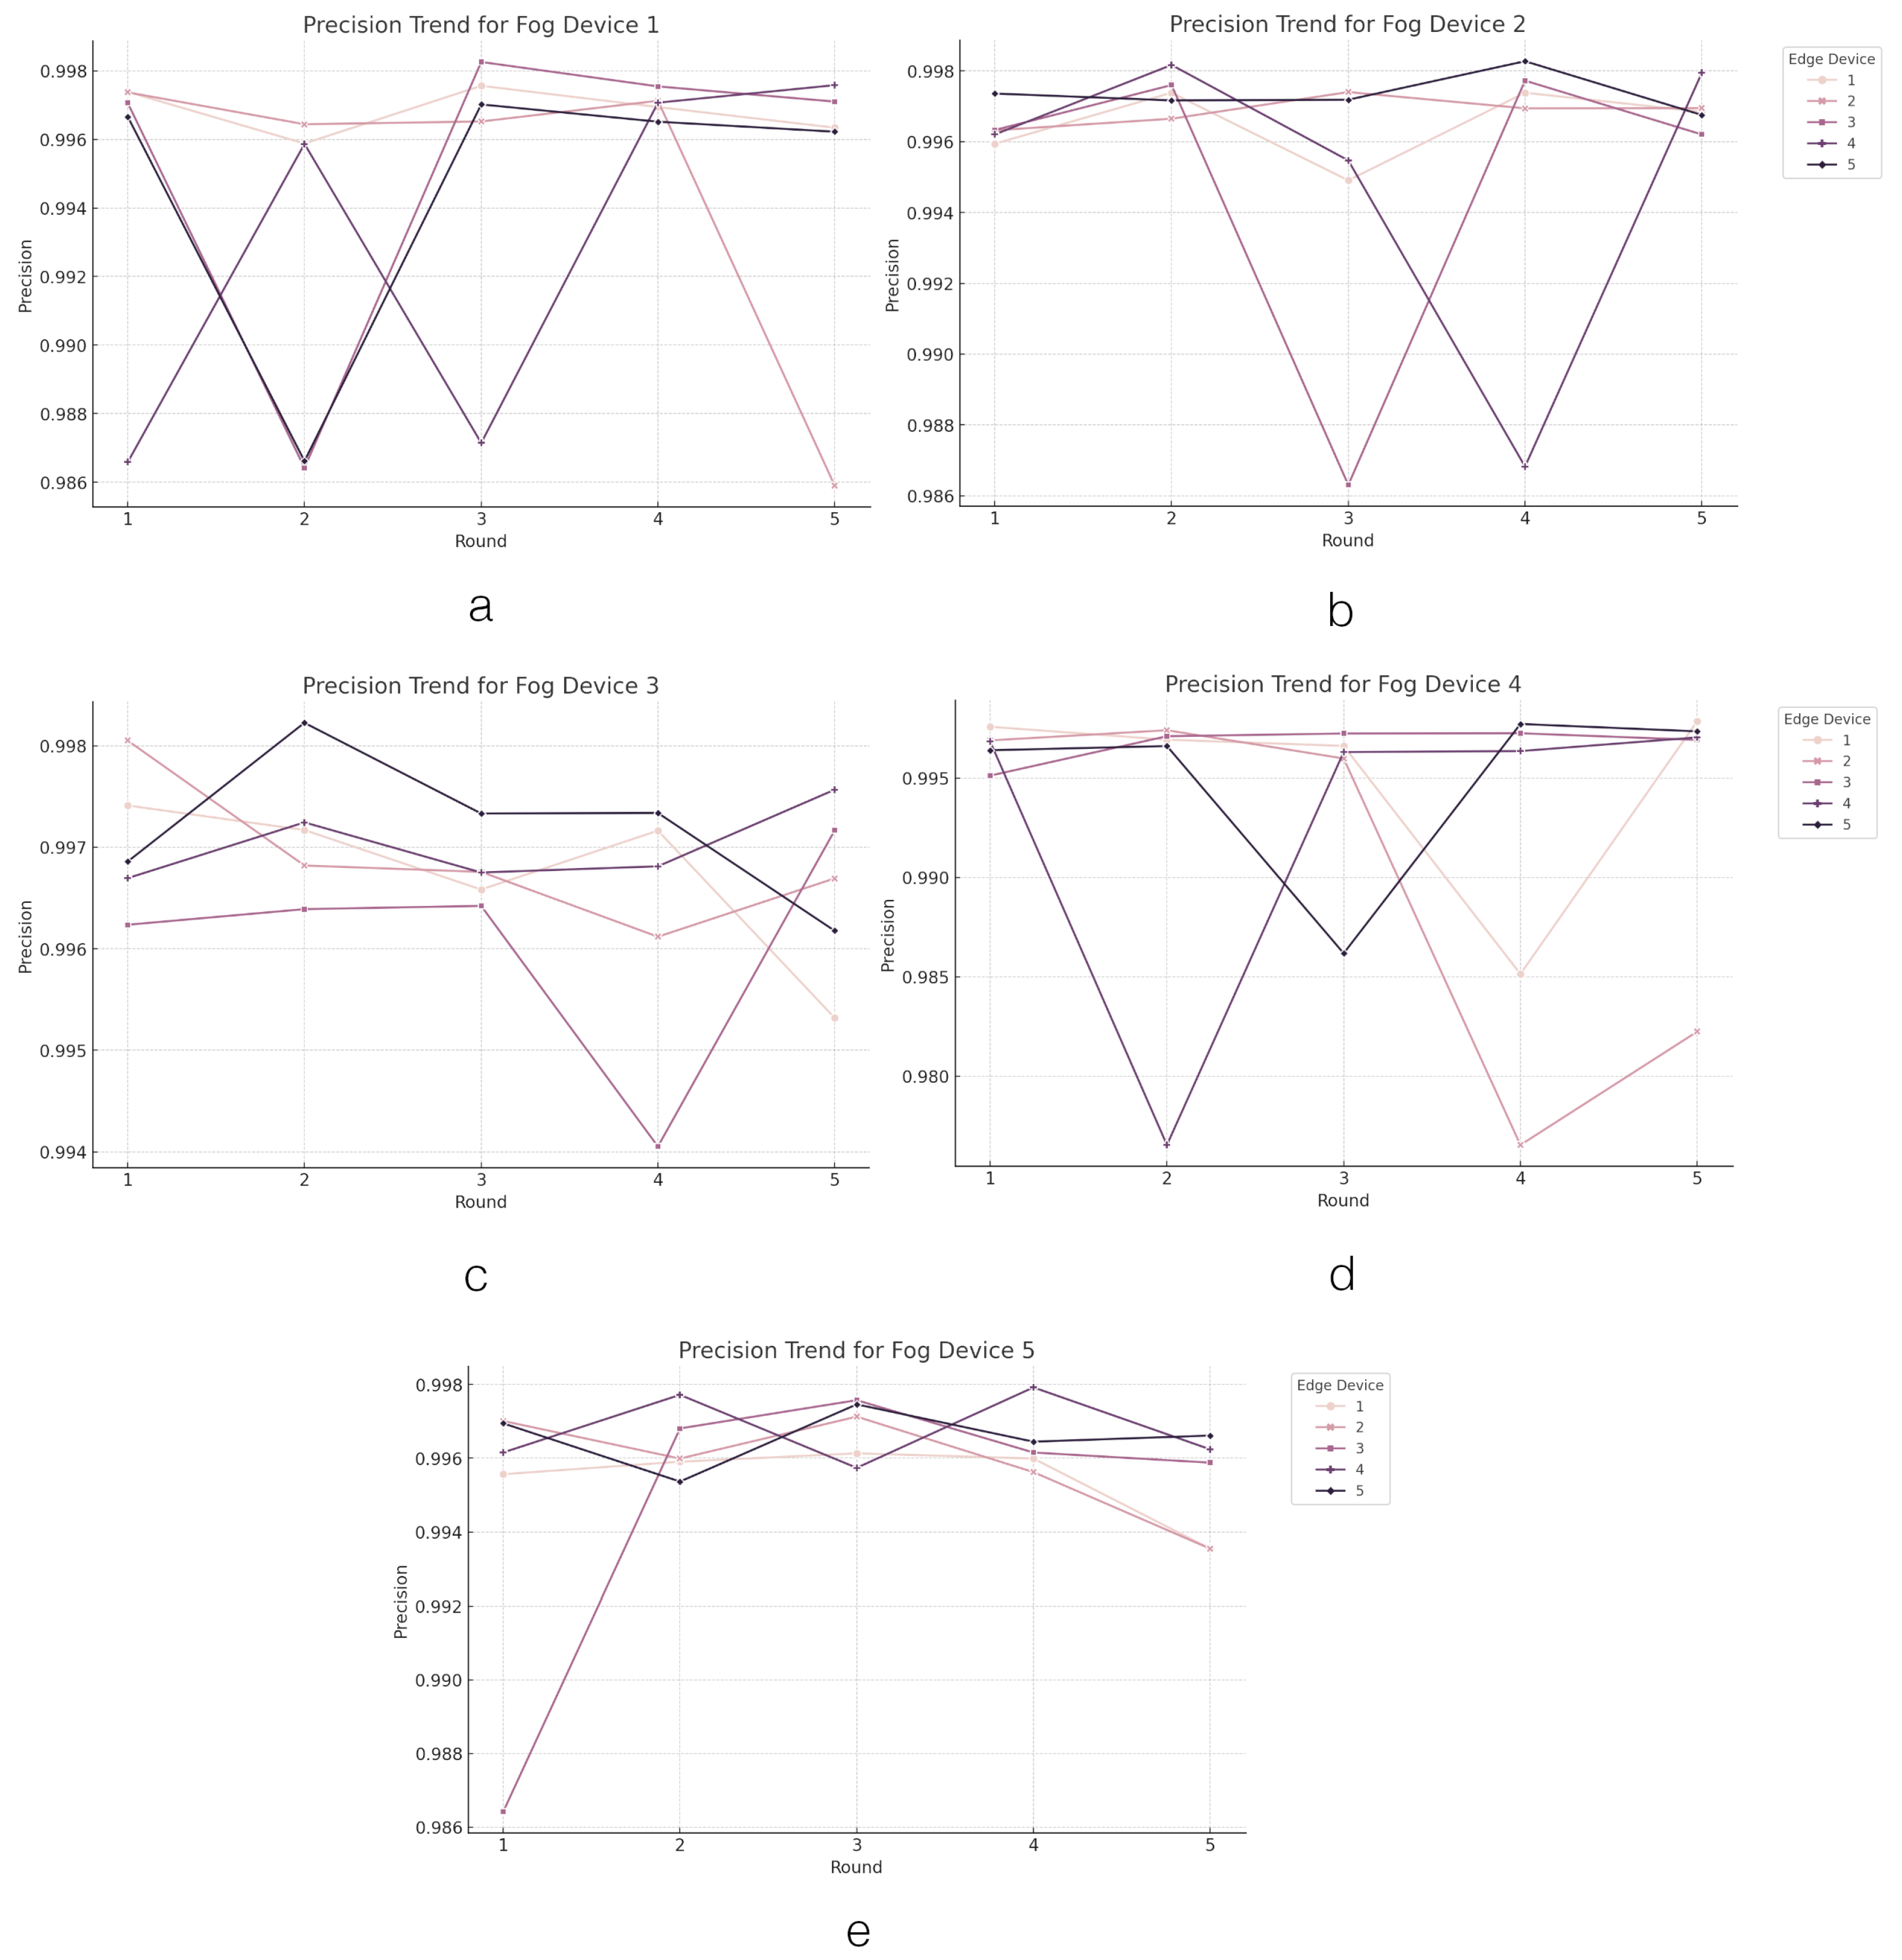
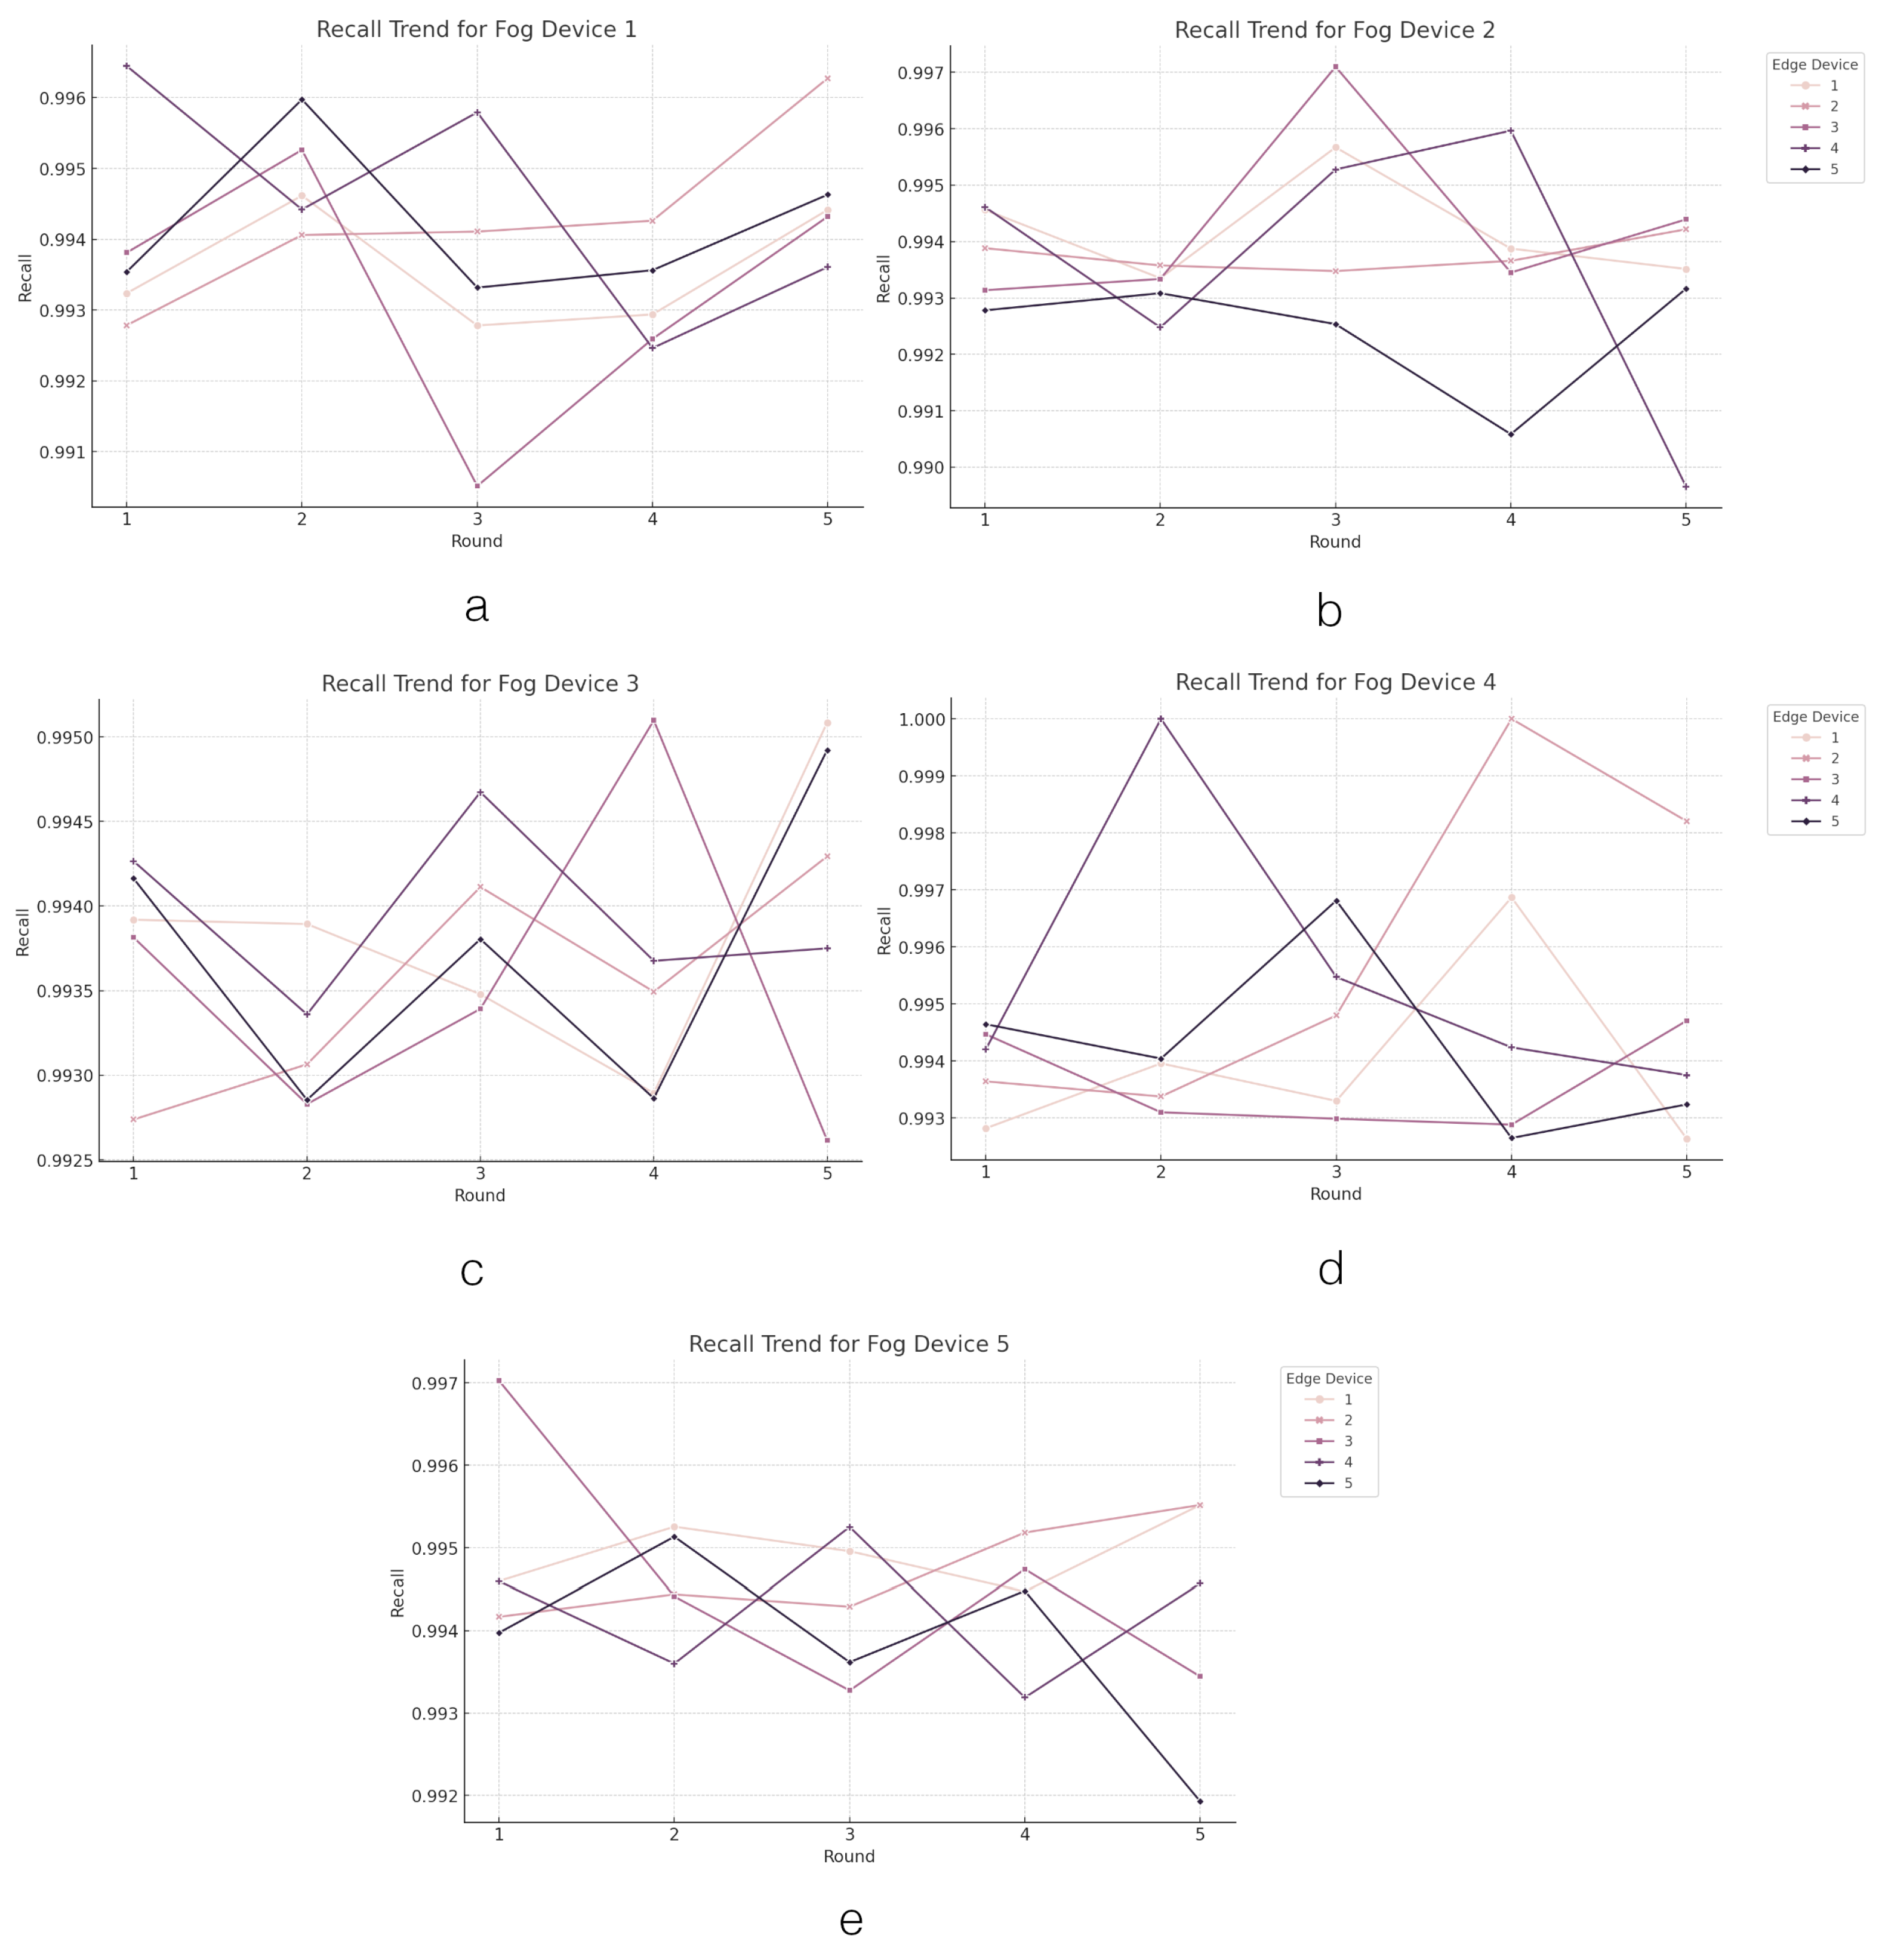
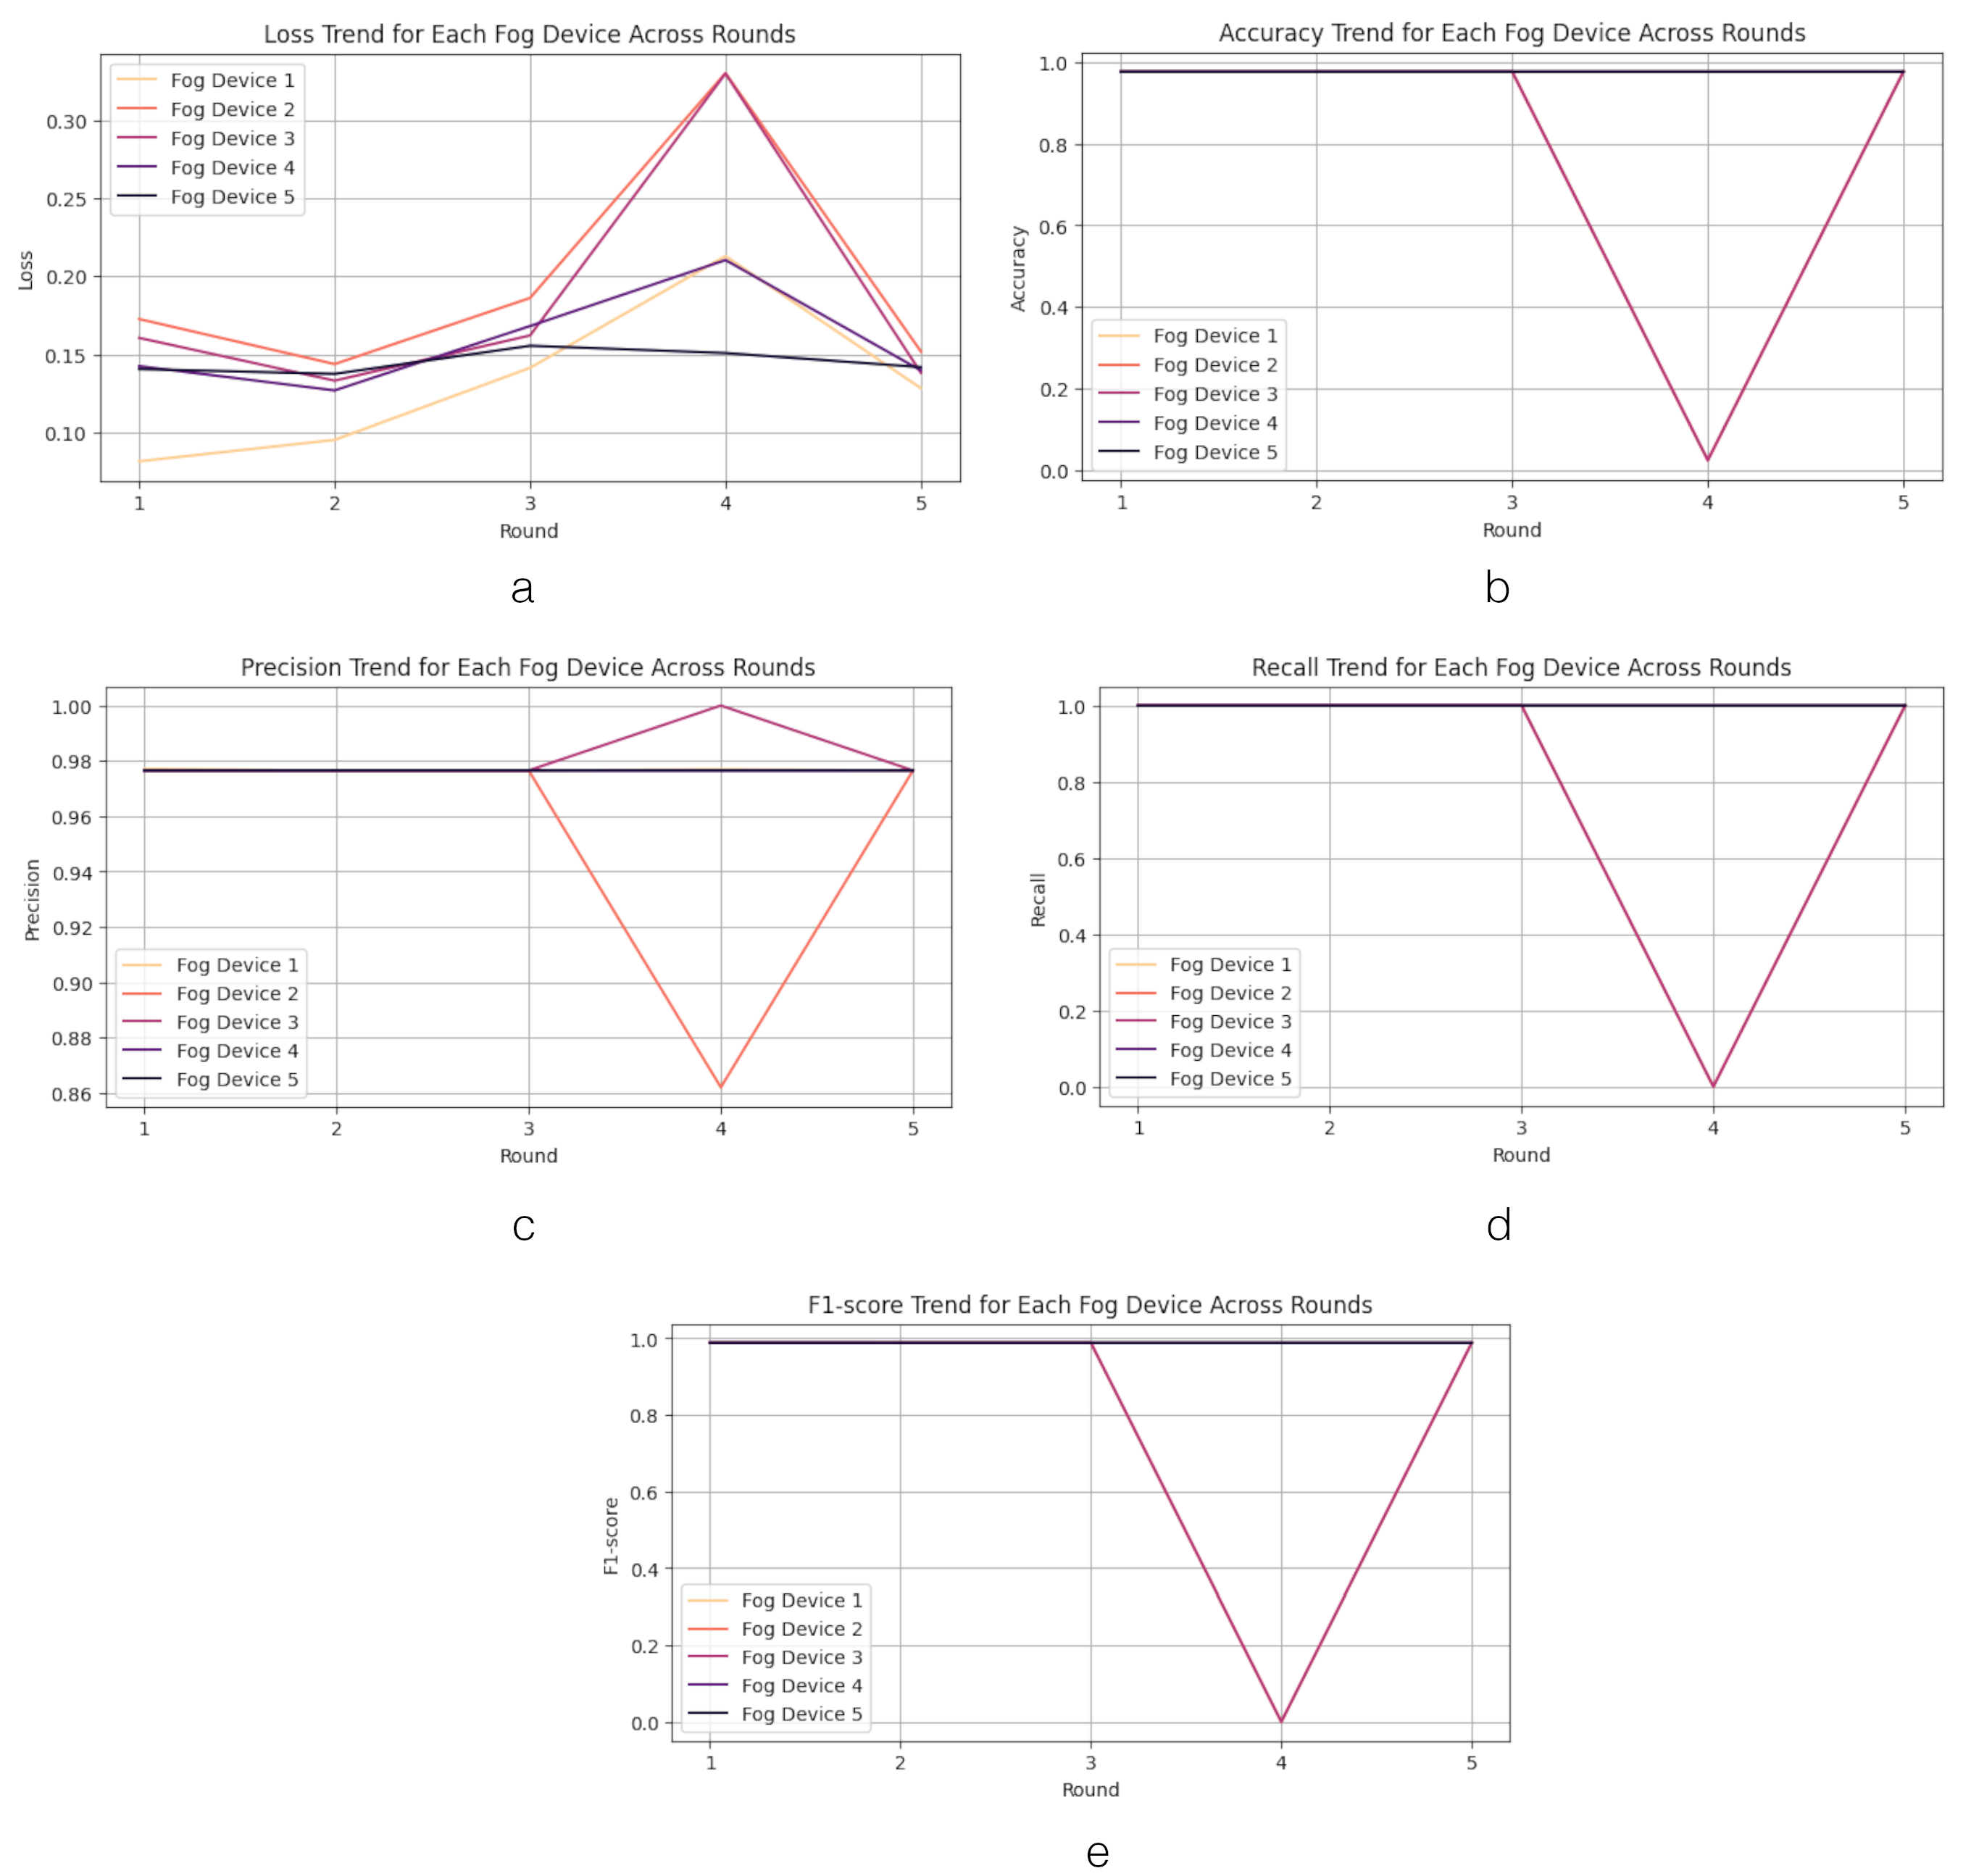
4.2.3. FL on Fog Layer Performance

After analyzing the detection performance at the edge layer, we proceed to examine the detection performance at the fog layer. The results of the detection performance at the fog layer are illustrated in Figure 9.
We begin by observing the loss values in the fog layers, which exhibit significant variations across fog devices, indicating a heterogeneous performance landscape. Subsequently, we delve into the analysis of accuracy performance in the proposed system. The analysis of fog devices’ performance across rounds unveils intriguing trends regarding accuracy. Initially, in the first round, each device demonstrates stable starting accuracies exceeding 90%. Fog Device 2 displays a unique pattern, commencing and concluding with high accuracy but encountering a notable drop to nearly 0% accuracy in round 4. This sharp decline suggests a potential failure or misconfiguration that was subsequently rectified, leading to a swift recovery in accuracy. The rapid rebound of Device 2 hints at a robust error correction or recalibration process employed to efficiently restore its performance levels. Similar patterns are observed in precision, recall, and F1-score metrics. Notably, there is a slight deviation in the precision pattern when Fog Device 3 achieves a recall value of 1.0 in round 4.

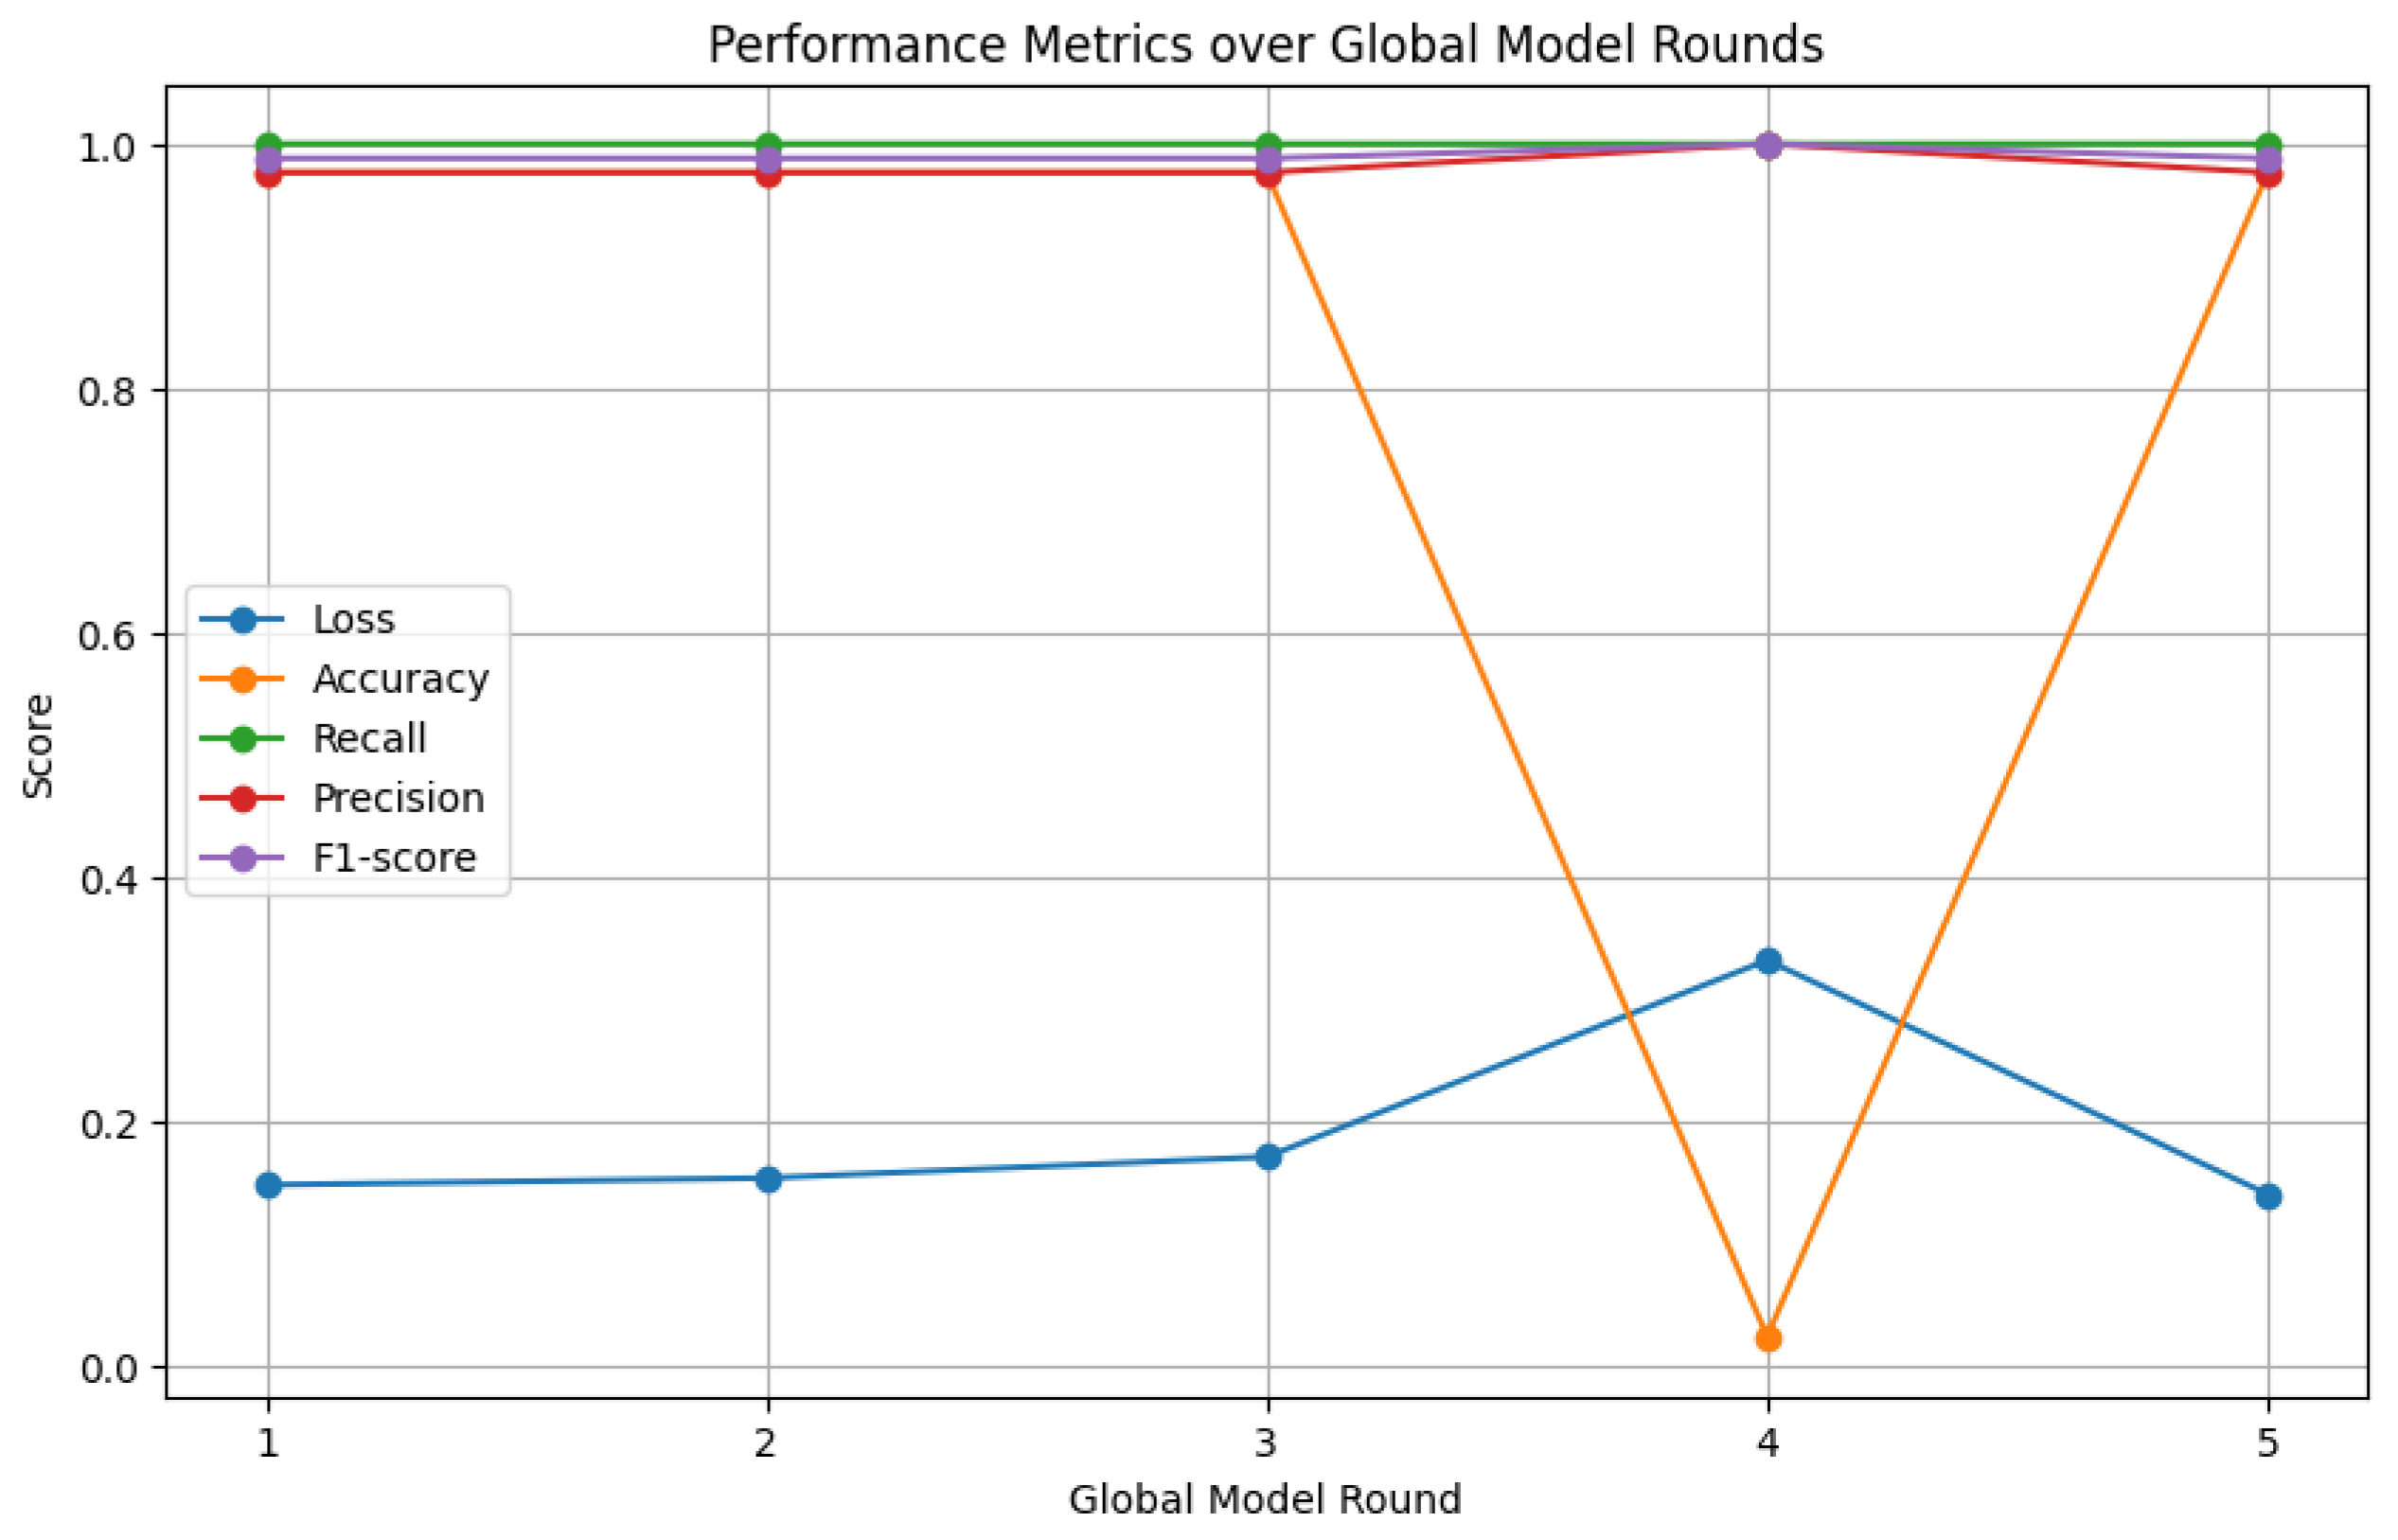
4.2.4. FL on Cloud Layer Performance

After analyzing the detection performance in the fog layer, we proceed to examine the detection performance in the cloud layer or global model. The results of the detection performance in the cloud layer or global model are illustrated in Figure 10. The aggregation of the model in the cloud is also influenced by conditions in the fog layer. Notably, the accuracy of the global model drops to near 0% in round 4, while the other parameters remain relatively stable at over 90% in each round. After five rounds of training, the final results for accuracy, precision, recall, and F1-score consistently stand at 97.65%, 97.65%, 100%, and 98.81%, respectively.

4.2.5. FL Based on Edge–Fog–Cloud Architecture (Training Time)

This next analysis focuses on the length of training times across the FL system, as depicted in Figure 11. Upon examining the training times across the fog and edge devices, notable variations and patterns emerge. Fog Device 1 exhibits a range in training times, with Edge Device 4 recording the highest average training time (159.00 s) and Edge Device 1 the lowest (150.22 s), suggesting efficiency discrepancies in the learning process. Fog Device 2, conversely, demonstrates relatively consistent training times, with Edge Device 5 exhibiting slightly lower averages (151.67 s), indicating a well-distributed computational load. Fog Device 3 showcases consistent training times among its devices, with Edge Device 4 having a marginally higher average (155.84 s), suggesting minor variations in processing efficiency. In contrast, Fog Device 4 highlights Edge Device 1 as having the highest average training time (158.64 s), potentially indicating more intricate computations or data processing requirements. Fog Device 5 illustrates closely aligned training times, with Edge Device 5 recording the highest average (157.03 s), reflecting a balanced workload distribution among the devices.
The analysis of training times across the fog and edge devices reveals intriguing insights into the efficiency and workload distribution within the system. While Fog Device 1 shows variability in training times, suggesting differing efficiencies in the learning process among its edge devices, Fog Device 2 demonstrates a more uniform distribution of computational load. Fog Device 3 maintains consistency in training times with minor variations, indicating stable processing efficiency. In contrast, Fog Device 4 exhibits disparities, with Edge Device 1 requiring more time, potentially due to complex computations. Fog Device 5 showcases balanced training times, implying an even workload distribution. These findings underscore the importance of optimizing computational resources and workload allocation to enhance overall system performance and efficiency.

4.2.6. FL Based on Edge–Fog–Cloud Architecture (Resource Consumption)

The next analysis is on CPU and memory consumption. Each fog devices coordinate five edge devices to undertake the learning process. The learning process is undertaken in five rounds in each edge device. The analysis explains the result by averaging CPU and memory consumption values in five rounds of the learning process from each edge device.
The CPU usage of the learning process in the FL process can be seen in Figure 12. Examining the CPU usage of the learning process in edge devices provides valuable insights into the computational demands and workload distribution within the system. Fog Device 1 demonstrates relatively consistent CPU usage levels, with Edge Device 1 exhibiting slightly higher usage (4.87%). In contrast, Fog Device 2 presents a uniform CPU usage profile, with Edge Device 3 recording the highest average (4.88%). Fog Device 3 shows minimal variance in CPU usage. On the other hand, Fog Device 4 displays a range in CPU usage, with Edge Device 1 having the lowest usage (4.68%). Lastly, Fog Device 5 maintains relatively uniform CPU usage, with minor fluctuations implying a balanced utilization of computational resources across the devices. These observations emphasize the importance of optimizing CPU usage and workload distribution to enhance system performance and efficiency.
The analysis of CPU usage across fog and edge devices unveils crucial patterns regarding computational demands and workload distribution within the system. While Fog Device 1 and Fog Device 2 show consistent and uniform CPU usage profiles, respectively, indicating potential correlations with training efficiency and balanced computational demands, Fog Device 3 demonstrates an even distribution of computational workload. In contrast, the varying CPU usage in Fog Device 4 and the balanced usage in Fog Device 5 reflect potential implications on training times and resource utilization. These findings underscore the significance of optimizing CPU usage and workload allocation to maximize system performance and efficiency while ensuring a balanced distribution of computational resources across devices.
The next analysis highlights the memory usage across the FL system, as illustrated in Figure 13. The examination of the memory usage of the FL process in each edge device reveals intriguing insights into memory utilization and workload distribution within the system. Across the edge devices coordinated by Fog Device 1, memory usage ranges from 29.706 GB (Edge Device 2) to 30.692 GB (Edge Device 1). For Fog Device 2, memory usage shows a broader range, from 31.668 GB (Edge Device 1) to 33.584 GB (Edge Device 4). Similarly, for Fog Device 3, memory usage is varied, with 30.878 GB (Edge Device 4) being the lowest and 32.708 GB (Edge Device 2) being the highest. Moving to Fog Device 4, memory usage increases progressively from 31.112 GB (Edge Device 1) to 33.600 GB (Edge Device 5). Lastly, Fog Device 5 exhibits the highest memory usage, with Edge Device 2 reaching up to 35.254 GB, indicating a significant memory load. The analysis of memory usage across the edge devices coordinated by different fog devices offers valuable insights into memory utilization patterns and workload distribution within the system. Interestingly, the examination reveals varying degrees of memory usage among the edge devices, with each fog device overseeing a distinct range of memory consumption. The variation in memory usage across fog devices shows the importance of efficient workload distribution and resource allocation strategies to optimize system performance and ensure balanced resource utilization. Additionally, the observed variations in memory usage highlight the complexity of managing resources in distributed computing environments and emphasize the need for tailored optimization techniques to enhance system scalability and efficiency.
Overall, while most fog devices demonstrate a balanced approach to memory utilization, certain edge devices exhibit higher average memory usage, indicating potential areas for optimization. Ensuring that memory usage is managed efficiently across all devices is crucial for maintaining the performance and scalability of the FL system, especially in resource-constrained environments. These findings may guide targeted improvements to memory management practices within the system.

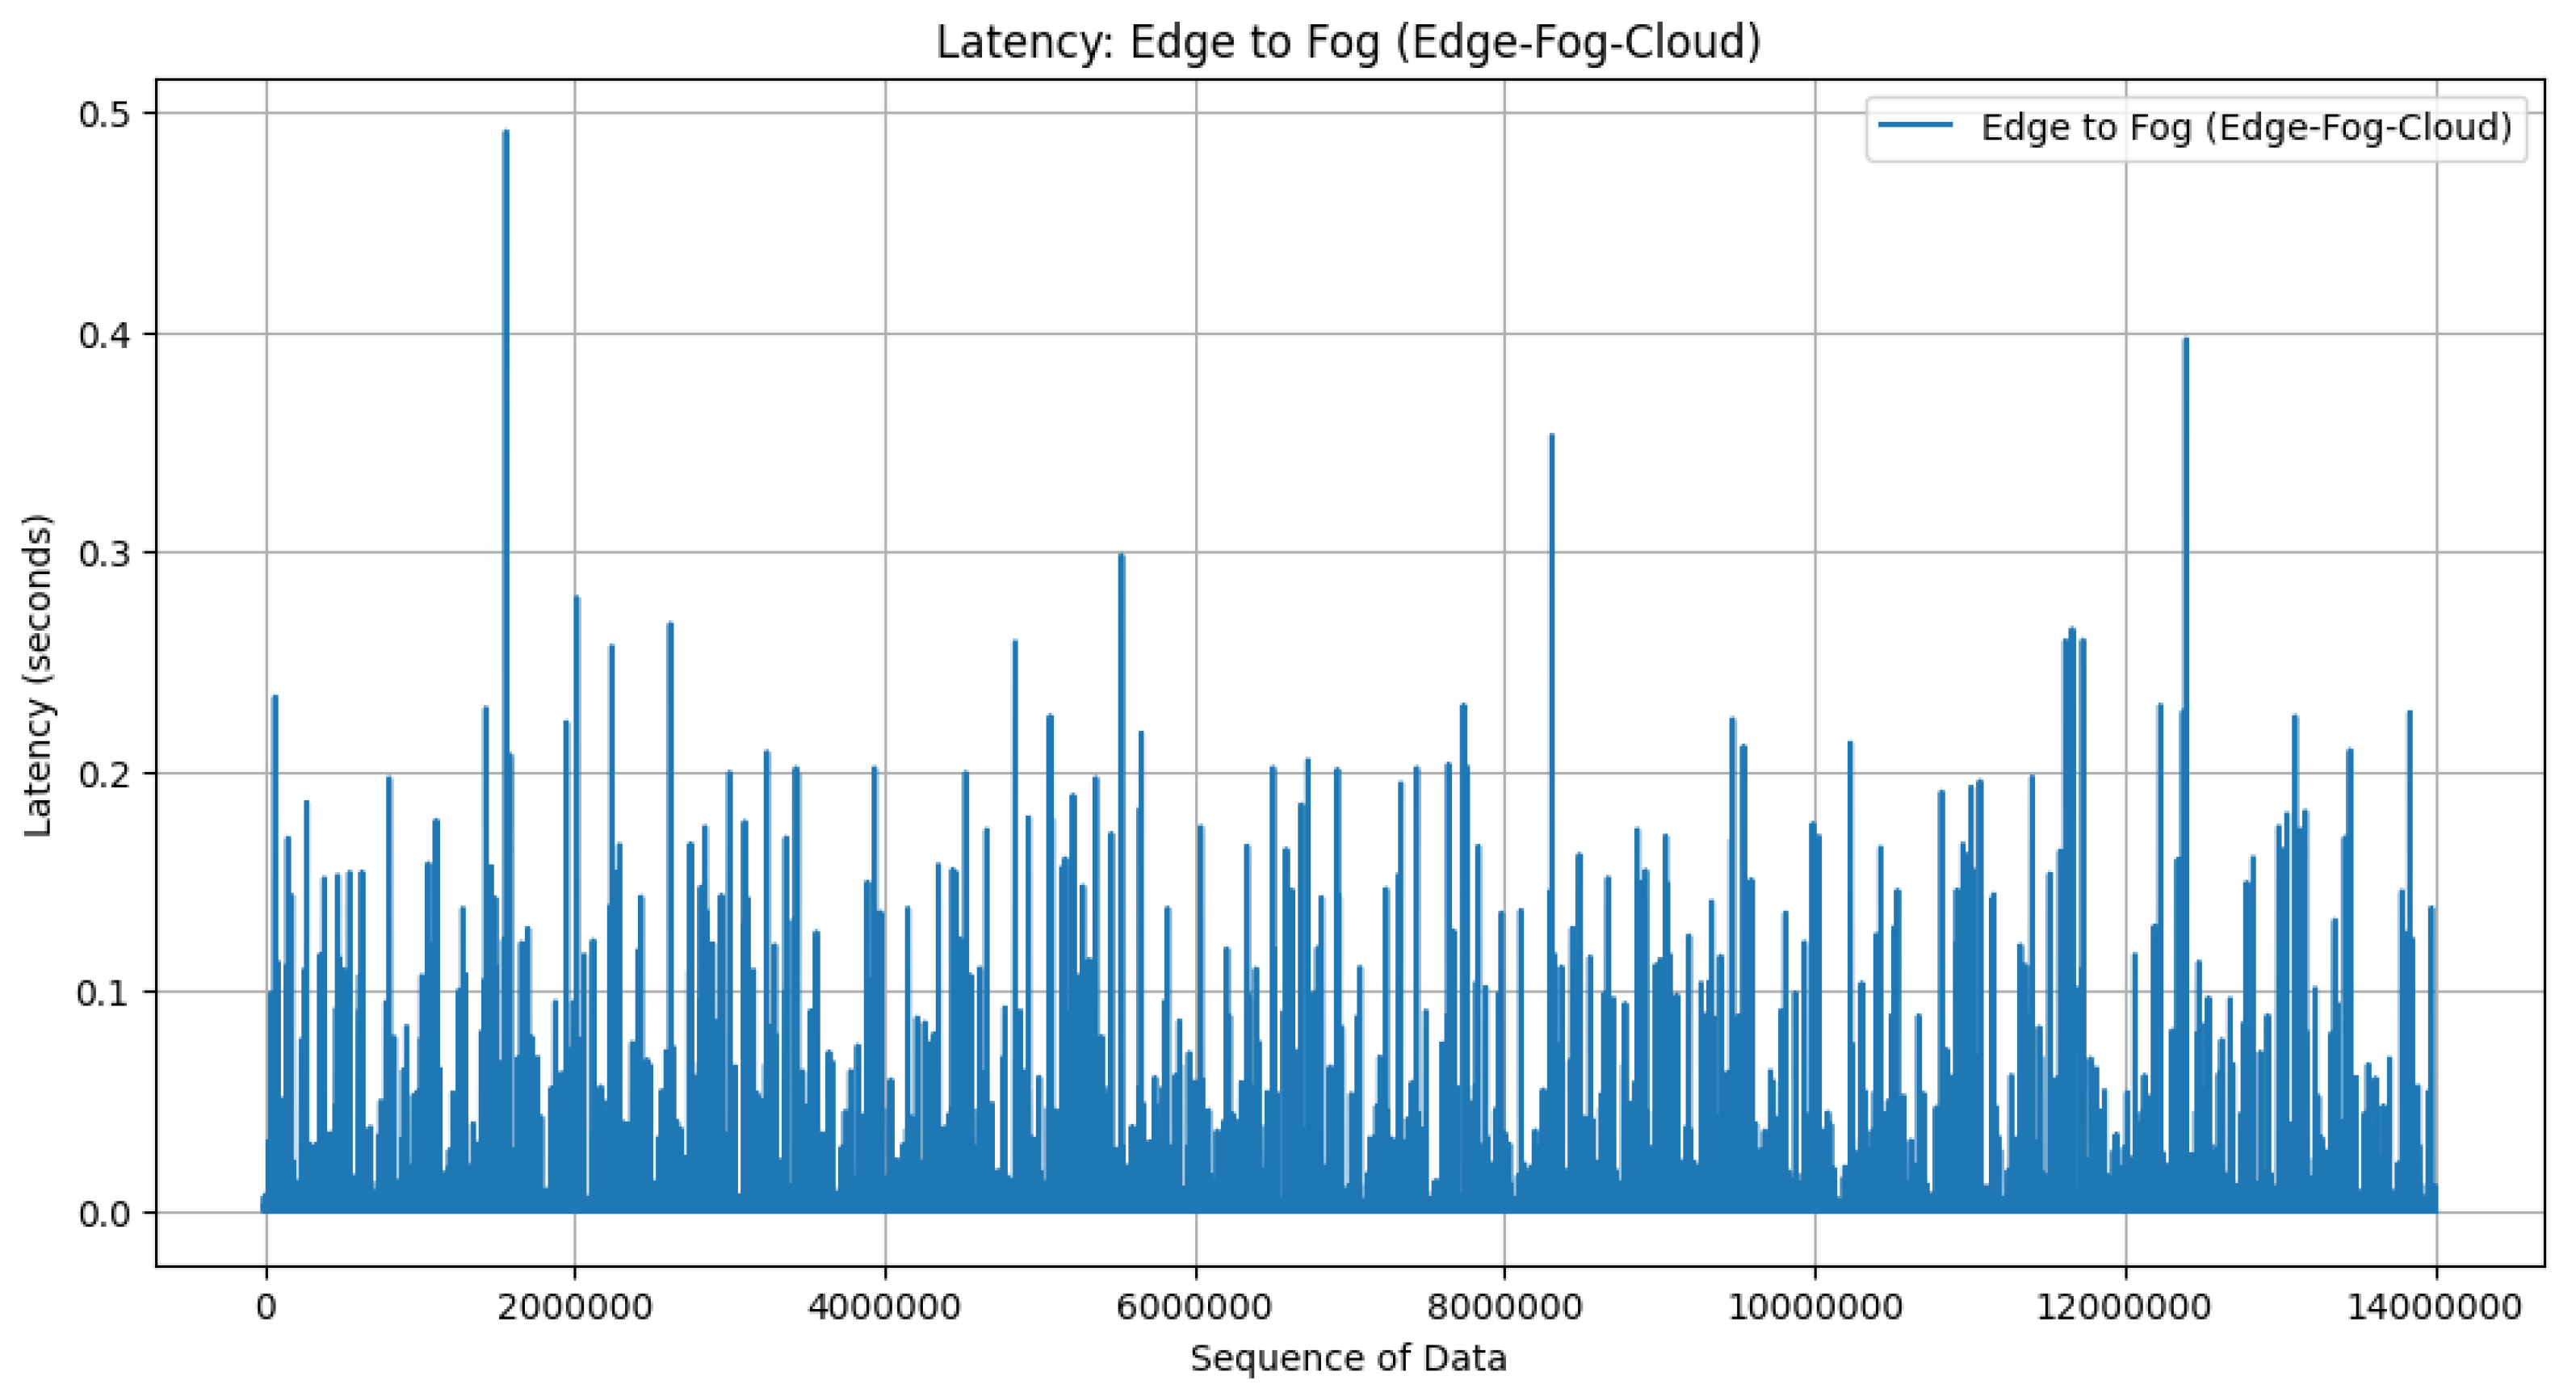
4.2.7. Latency Performance

The next analysis compares network latency between edge–fog–cloud architecture and cloud-centric architecture. This comparison helps assess the performance of FL in both architectures. The data size of the training model in FL matches that of centralized learning, at 46 Kb, due to identical DNN architecture. However, the data size variable is not enough to estimate latency; we need to make some assumptions about the network’s transmission speed. Therefore, once the model data size is determined, simulating network transmission speed becomes necessary.
In networking, transmission speed refers to the rate at which data are transferred from one location to another. Transmission speed helps in understanding the consistency and stability of the network’s performance by indicating how long the network sustains a certain level of the actual rate at which data are being transmitted. Transmission speed is a metric used in networking to describe the duration for which a certain amount of the data transmission rate is available or utilized within a given time frame. It measures how long a particular data transmission rate level is sustained or maintained over a period of time. Understanding transmission speed is important for network administrators and engineers to ensure that network performance meets the requirements of applications and users. Transmission speed is also important to identify any issues or bottlenecks that may affect network performance over time  [36,37]. This research used Formula (13) to calculate transmission speed.
Transmission Speed = Total size Flow duration
where Total size is the total size of packets in the flow and Flow duration is the duration of the flow of packets. This formula calculates the transmission speed using the flow duration as the time frame over which the total size of packets is transmitted. This equation gives the result of the average transmission speed for each flow [38,39].
In this study, the training model was executed over five rounds of training, providing a preliminary insight into FL dynamics. However, in practical scenarios, FL operates in a continuous fashion as edge devices, such as smartphones and IoT devices, perpetually generate new data. This continuous training process aligns with the dynamic nature of data production at the edge. To capture the realism of this ongoing learning paradigm, this study utilized transmission speed data derived from actual network traffic to simulate latency. By integrating traffic data from a comprehensive dataset comprising 140 million samples, this research aimed to extend the analysis beyond the initial five training rounds. The endeavor sought to meticulously model the training model data latency within the edge–fog–cloud architecture across the extensive dataset, ensuring a comprehensive exploration of FL dynamics under realistic conditions.
In this study, transmission speed measurement is conducted using data from the CICIoT2023 dataset. The dataset includes features such as ‘flow_duration’, which represents the duration of the packet’s flow, and ‘Tot size’, which represents the packet’s length. By utilizing these two features, this research calculates the transmission speed simulation using Formula (13) for each traffic scenario. The simulation results of the transmission speed measurement using the CICIoT2023 dataset are illustrated in Figure 14. The scenario compares communication latency among edge, fog, and cloud architectures with cloud-centric architectures, starting by taking the data from Figure 14 and processing them in the simulation. This research sets the data size of the model at 46 kilobytes, likely representing the data size of the model to be transmitted. The simulation uses Formula (10) to simulate latency for each instance of traffic in the CICIoT2023 dataset. The latency simulation scenario in this research can be seen in Algorithm 3.
Algorithm 3: Latency Simulation
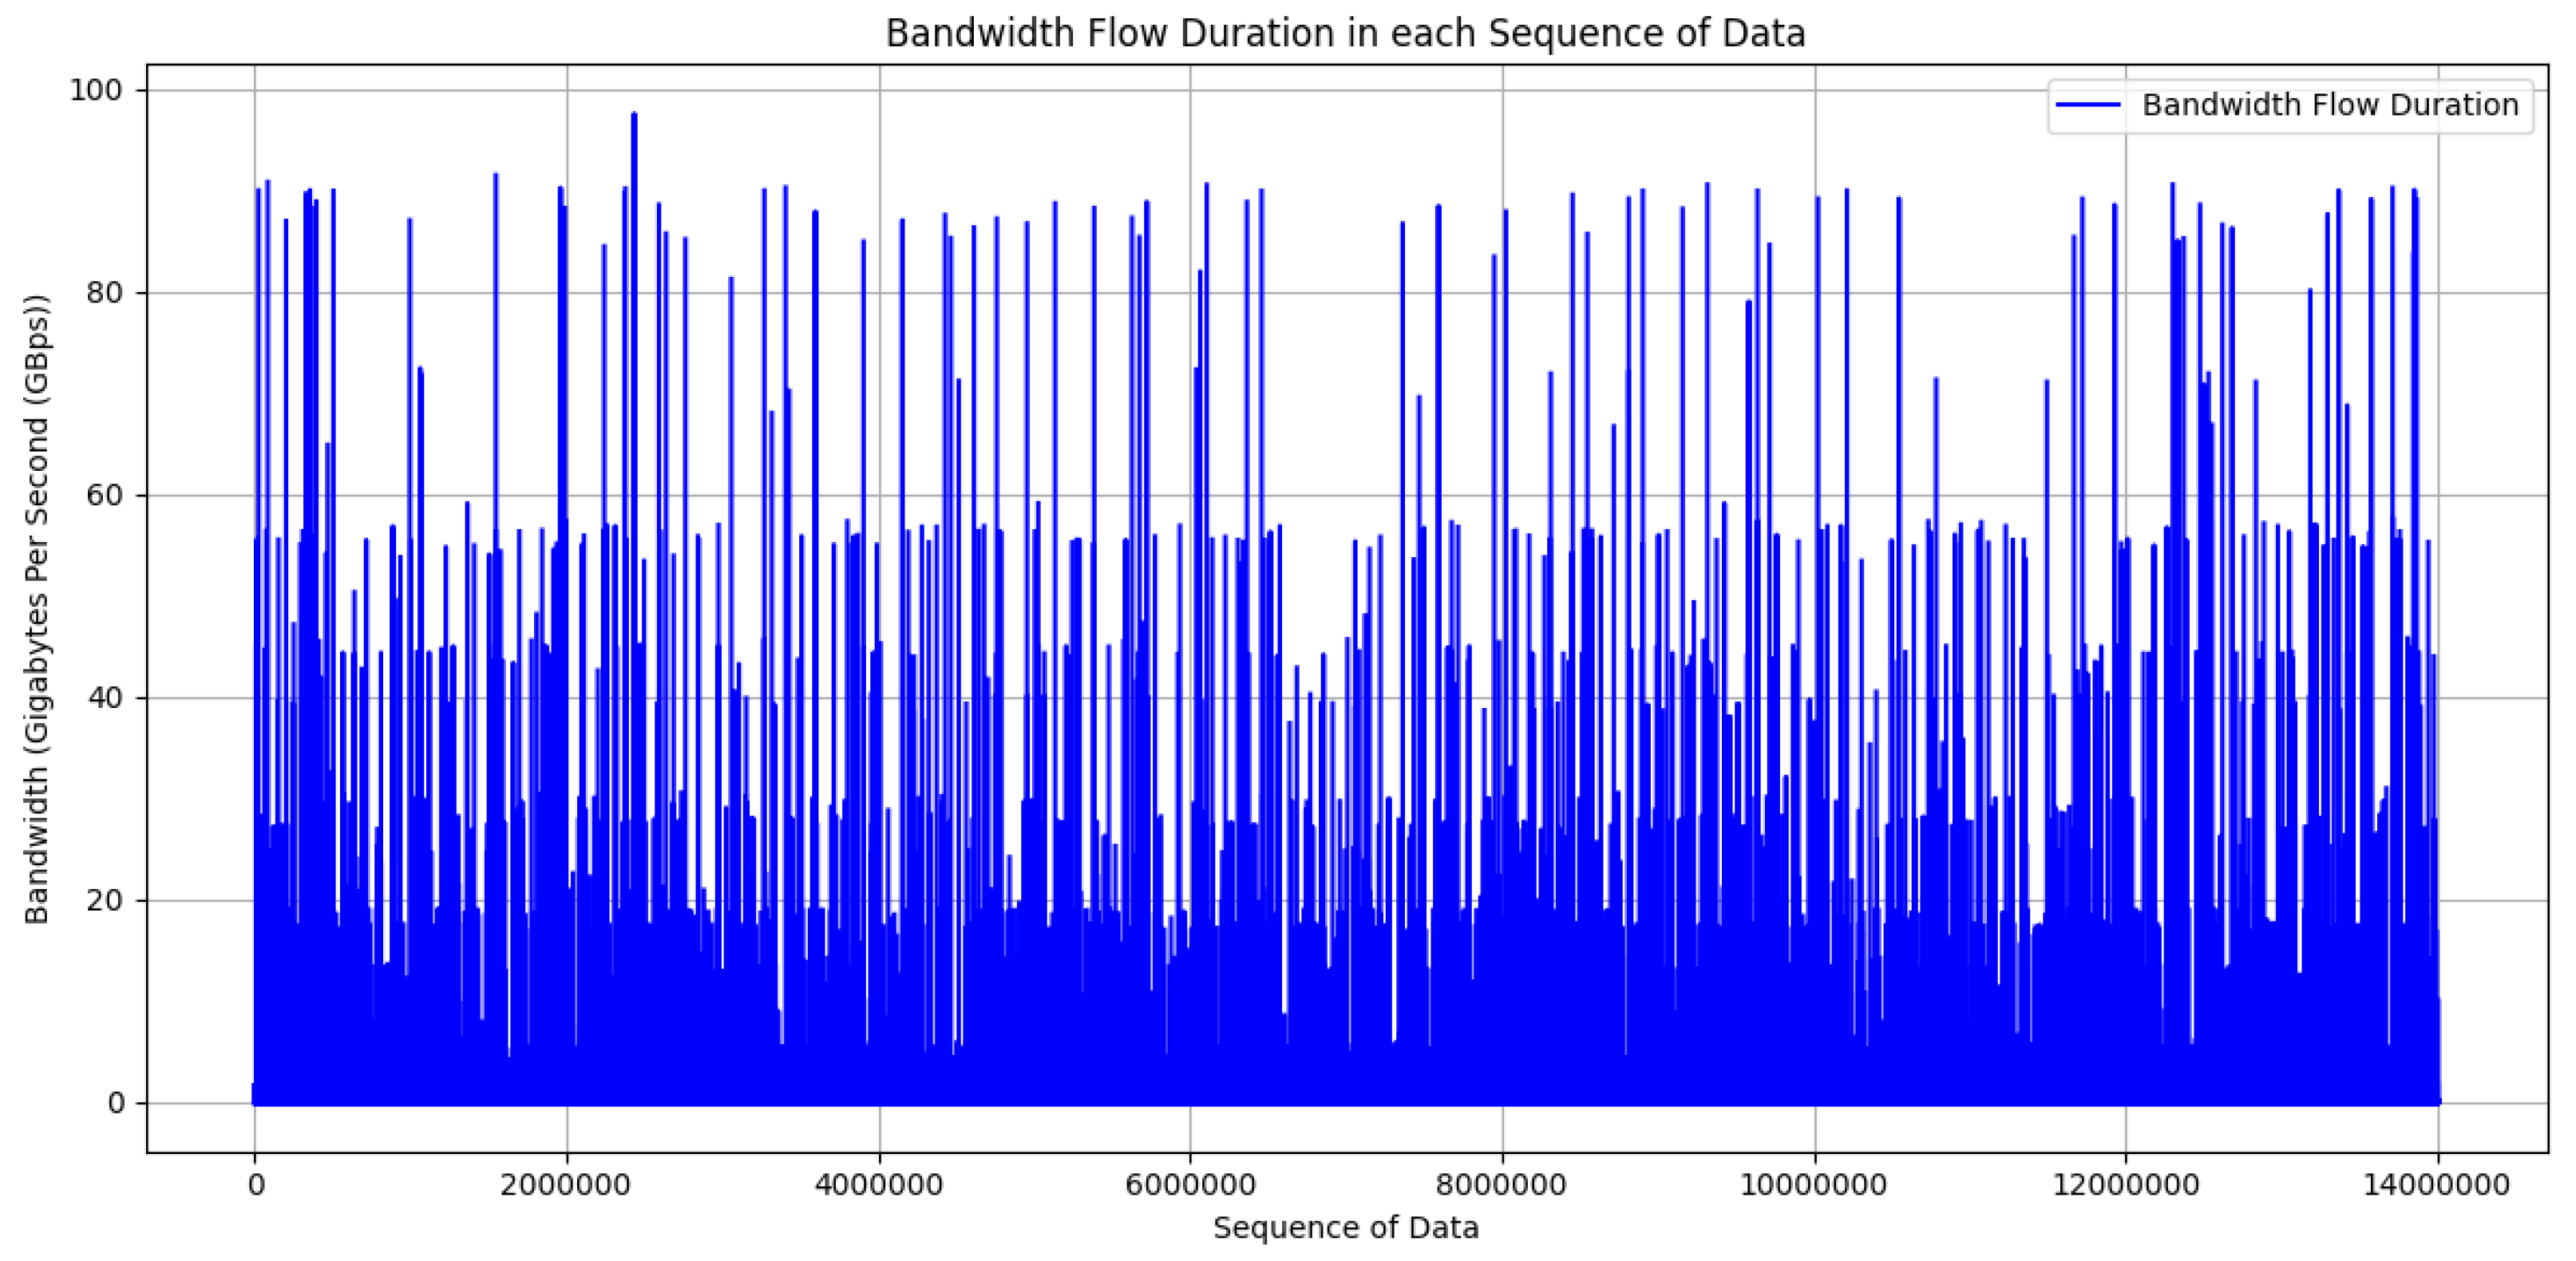
Data: CSV CICIoT2023 dataset
Result: latency_edge_to_fog, latency_fog_to_cloud, and latency_edge_to_cloud
            
Load the CSV dataset
            
Calculate the average speed of data transfer for each task
BFD ← df[’Tot size’] / df[’flow_duration’]
            
Determine the size of a model
model_size ← 46 KB
            
Divide the devices into different groups
num_edge_devices ← 5
num_fog_devices ← 5
num_total_edge_devices_cloud_centric ← 25
            
Assign data transfer speed to each group
trnsSPD_edge_to_fog ← BFD / num_edge_devices
trnsSPD_fog_to_cloud ← BFD / num_fog_devices
trnsSPD_edge_to_cloud ← BFD / num_total_edge_devices_cloud_centric
            
Calculate the time taken for data transfer between different groups
latency_edge_to_fog ← model_size / trnsSPD_edge_to_fog
latency_fog_to_cloud ← model_size / trnsSPD_fog_to_cloud
latency_edge_to_cloud ← model_size / trnsSPD_edge_to_cloud
The algorithm is designed to model the latency, or delay, involved in communication within an IoT system. It starts by ingesting a dataset named CSV CICIoT2023, likely containing information about IoT devices and their communication patterns. The goal of the algorithm is to calculate and provide three types of latencies: latency from edge to fog, latency from fog to cloud, and latency from edge to cloud (cloud-centric). To begin the process, the algorithm loads the dataset from the CSV file. It then calculates the average data transfer speed for each task, a crucial metric for understanding the speed at which data move between devices. This is achieved by dividing the total size of data transferred by the duration of the flow.
Next, the algorithm determines the size of a model, set at 46 Kb. This model size likely represents the amount of data processed or transferred by the IoT devices. The devices are categorized into different groups based on their roles or locations, with parameters indicating the number of edge devices, fog devices, and total edge devices in a cloud-centric architecture. Once the groups are established, the algorithm assigns data transfer speeds to each group. It computes the transmission speed for data transfer from edge devices to fog devices, from fog devices to the cloud, and from edge devices directly to the cloud, using previously calculated values and the number of devices in each group. Finally, the algorithm calculates the latency for data transfer between these groups. It determines the time taken for data transfer from edge devices to fog devices, from fog devices to the cloud, and from edge devices directly to the cloud using the model size and the transmission speed values for each group.
With the available transmission speed, the simulation proceeds to distribute it among the devices in the architecture. It calculates the transmission speed allocated for communication links from edge to fog, fog to cloud, and edge to cloud. Subsequently, the simulation computes the time taken for communication between different layers of the architecture. These calculations are based on the model size and the allocated transmission speed for each communication link. The plots visualize the communication latency for communication from edge to fog, fog to cloud, and edge to cloud, as seen in Figure 15, Figure 16, and Figure 17, respectively.
The result from the cloud-centric architecture in Figure 17 has bigger latency than edge to fog in Figure 15 and fog to cloud in Figure 16. The latency can be reduced by more than 50% when the fog–edge–cloud architecture is employed in the CIDS architecture. In edge–fog–cloud architecture, model updates are processed and aggregated locally at fog devices before being sent to the cloud server. Latency reduction is achieved by minimizing the distance data need to travel for processing and aggregation. Local aggregation at fog devices can reduce the latency associated with transmitting data to a centralized cloud server. In cloud-centric architecture, all model updates are sent directly to the centralized cloud server for aggregation. Latency is determined by the network speed between edge devices and the cloud server, as well as the processing time for model aggregation at the cloud server. Latency can be higher in cloud-centric architecture compared to edge–fog–cloud architecture due to the longer distance data need to travel to reach the cloud server and the potential network congestion.
In FL, a process utilized in distributed machine learning systems, we implement an averaging training model approach. This method is particularly relevant in the context of the edge–fog–cloud architecture, where computational resources are distributed across various tiers. Specifically, within this architecture, there exist 5 edge devices linked to each fog device, while 5 fog devices are connected to the cloud server, amounting to a total of 5 fog devices and 25 edge devices. Upon completion of the training process on each edge device, a training model with a data size of 46 Kb is generated. Subsequently, these trained models are transmitted to the fog devices. Here, an averaging process takes place, wherein the training models received from the edge devices are combined to produce a unified training model, still maintaining a data size of 46 Kb. This averaging mechanism significantly reduces the amount of data that needs to be transmitted to the cloud. With the presence of fog devices, only 46 Kb of data needs to be sent to the cloud from five fog devices. However, in the absence of fog devices, all 25 edge devices would have to directly transmit their training models to the cloud server. This illustrates the efficiency gained by utilizing fog devices as intermediate computational processors in the edge–fog–cloud architecture, as it minimizes the burden on the cloud server by reducing the amount of data transmission required directly to it.

4.2.8. Performance Comparison

Based on the analysis conducted for FL and centralized learning, a comparative examination provides valuable insights across various parameters. Regarding loss, the FL approach displays fluctuations in loss values across rounds and devices, indicating an iterative process toward enhancing model performance. In contrast, the centralized learning model consistently maintains low loss values, suggesting robust predictive capabilities. Across fog devices and their respective edge devices, accuracy, precision, recall, and F1-score metrics demonstrate consistent and efficient learning, albeit with slight variations among devices. Meanwhile, in centralized learning, these metrics notably remain high, all surpassing 99%, indicating a strong and uniform detection performance across the entire dataset.
The accuracy, precision, recall, and F1-score parameters measured in percentages reflect high-performance levels in centralized learning. Specifically, accuracy, precision, recall, and F1-score values reach 99.36%, 99.55%, 99.79%, and 99.67%, respectively. In contrast, the parameters obtained from FL, utilizing an edge–fog–cloud architecture after five rounds of training, exhibit slightly lower performance levels compared to centralized learning. These include accuracy, precision, recall, and F1-score values at 97.65%, 97.65%, 100%, and 98.81%, respectively.
In centralized learning, training time tends to be higher, averaging 4041.07 s, as data processing occurs sequentially on a single server. This sequential processing may result in longer training times, especially with large datasets. However, in FL, the average training time across edge devices is significantly lower at 155 s. This reduction is attributed to distributed learning across edge devices, allowing for parallel processing capabilities. Simultaneous model training on multiple devices leads to faster convergence and ultimately reduces the overall training time.
The average CPU usage across edge devices in both FL and centralized learning remains consistent, with an average value of 4.7%. However, a notable difference emerges in memory consumption between the two approaches. In centralized learning, the average memory usage is notably higher, at 40.78 GB, compared to the FL scenario, where the average memory usage across edge devices is 32.15 GB. FL demonstrates efficient CPU usage, distributing computational demands across edge devices, thereby optimizing CPU resources and enhancing system performance. Conversely, centralized learning may experience CPU spikes due to the sequential processing of data on a single server, potentially leading to performance bottlenecks. Additionally, FL typically incurs lower memory consumption compared to centralized learning. The distributed data storage across edge devices ensures efficient memory utilization, with each device only requiring resources for processing its local data portion. In contrast, centralized learning’s centralized data storage necessitates larger memory capacity on the server, resulting in higher memory consumption compared to FL.
The edge–fog–cloud architecture proved to reduce latency compared to cloud-centric architecture by performing local aggregation at fog devices. High volumes of data being transmitted to and from the cloud server can lead to network bottlenecks in cloud-centric architecture, increasing latency and potentially affecting the overall training process. Therefore, this research proposed model aggregation performed at the fog nodes to reduce the need to send data to a centralized cloud server. By aggregating models in the fog layer, latency is further reduced compared to cloud-centric architectures. The proximity of edge and fog nodes to the devices minimizes the distance data need to travel, resulting in lower latency for model aggregation and updating.

4.3. DLT Performance

This section analyzes the transaction time process in the DLT system. The first analysis is related to the DLT transaction process, which can be seen in Table 6. The transaction performance from Table 6 demonstrates that the system consistently maintains a TPS of approximately 166.67 except when processing 4000 transactions, where the TPS slightly drops to 160. Despite variations in transaction volume, the TPS remains relatively stable. In contrast, the latency exhibits a gradual increase as the number of transactions grows, going from 6 milliseconds for 1000 transactions to 62 milliseconds for 10,000 transactions. This implies that as the system handles more transactions, it experiences a modest increase in latency.
The average TPS of 164.53 suggests that the system exhibits consistent performance in terms of transaction processing speed. Additionally, the system effectively manages CPU and memory resources. An interesting finding is the stability of the TPS, indicating that the system can handle transaction volumes ranging from 1000 to 10,000 with relatively little impact on TPS. However, the gradual increase in latency with a higher number of transactions is noteworthy and should be considered when optimizing the system for lower latency requirements. Overall, the system demonstrates robust and efficient performance, which is crucial for applications requiring predictable and stable TPS.
The next analysis measures the resource cost of the DLT system and the training process in the proposed system. The first analysis is related to resource costs from the DLT system. The results in Table 7 and Table 8 show CPU and memory consumption from Truffle and IPFS.
The result reveals that both Truffle and IPFS consume CPU resources efficiently. CPU utilization for Truffle remains below 4% throughout the experiments, suggesting that the system efficiently handles transaction processing without significant strain on the CPU. The memory consumption for Truffle remains consistently around 217 MB, indicating stable memory usage. In the case of IPFS, the CPU consumption is higher, reaching approximately 19% when processing 10,000 transactions. This could be attributed to the resource-intensive nature of IPFS. Memory consumption for IPFS hovers around 145 MB, showcasing relatively stable memory usage throughout the experiments.

4.4. CIDS Trust and Privacy-Preserving Analysis

In the CIDS, implemented within an edge–fog–cloud architecture and utilizing blockchain with a proof-of-work (PoW) consensus mechanism, preventing Sybil attacks is crucial for maintaining network integrity and trustworthiness. Each participating edge device and fog node maintains a copy of the blockchain ledger, serving as a decentralized and immutable record of all transactions, including model updates and node interactions. The PoW consensus mechanism ensures that transactions are validated and added to the blockchain through computationally intensive mining processes, making it challenging for malicious entities to tamper with the ledger.
To model the prevention of Sybil attacks mathematically, we denote variables such as the total number of nodes (N), total number of miners (M), total computational power of miners (P), target difficulty for PoW mining (T), current blockchain height (H), block reward (B), and cost of performing a Sybil attack (C). The probability of a Sybil attack succeeding ( P Sybil ) can be represented as C P . To prevent Sybil attacks, the computational power of legitimate nodes participating in PoW mining ( P legitimate ) must exceed the computational power of potential attackers (C). Thus, by ensuring that P exceeds C, the CIDS network mitigates the risk of Sybil attacks, safeguarding its trust and privacy-preserving capabilities.
By integrating blockchain with a PoW consensus mechanism into the CIDS network, the system ensures that Sybil attacks are economically infeasible for potential attackers. The computational resources required to perform a successful Sybil attack would surpass the computational power of honest nodes participating in PoW mining, thereby safeguarding the integrity and trustworthiness of the CIDS network.
In the CIDS, FL plays a pivotal role in preserving privacy by ensuring decentralized storage of sensitive data, while blockchain technology is utilized to uphold trust and transparency within the system. This combination of mechanisms is well suited to prevent data breaches and uphold privacy standards. In the CIDS ecosystem, each edge device trains its local intrusion detection model using locally collected sensitive network traffic data. These data remain decentralized and are never shared with other devices or the central server. Let N represent the total number of participating edge devices in FL, M denote the total number of fog nodes, and T represent the total number of transactions recorded on the blockchain. Furthermore, Data i signifies the sensitive data stored on edge device i, Model i denotes the local model trained on edge device i, and Update i j represents the model update transmitted from edge device i to fog node j.
After local training, edge devices transmit only model updates (not raw data) to the fog nodes for aggregation. This transmission process employs privacy-preserving techniques such as secure aggregation or differential privacy to maintain the confidentiality of individual contributions. These methods ensure that the aggregated model update Agg j does not divulge any sensitive information regarding the individual data of edge devices.
After the model updates are aggregated at the fog nodes, denoted as Transaction t = { Agg j } j = 1 M , they are bundled into a transaction and subsequently recorded on the blockchain. Acting as a decentralized ledger, the blockchain meticulously records all transactions pertaining to model updates and interactions between edge devices and fog nodes. This blockchain-based architecture ensures transparency and immutability, empowering all participants to verify the integrity of the recorded transactions. Through the fusion of FL for privacy-preserving model training and blockchain for transparent transaction recording, the CIDS adeptly averts data breaches and upholds trust within the system.
The CIDS leverages a sophisticated blend of FL and blockchain technology within an edge–fog–cloud architecture to fortify its trustworthiness and preserve user privacy. FL ensures that sensitive data remain decentralized, as each edge device trains its local intrusion detection model without sharing raw data. Model updates are aggregated at fog nodes using privacy-preserving techniques such as secure aggregation or differential privacy, safeguarding individual contributions. These aggregated updates are then recorded on the blockchain, serving as a transparent and immutable ledger that meticulously records all interactions and transactions within the system. This innovative fusion of FL and blockchain technology not only prevents data breaches but also instills confidence in the integrity and transparency of the CIDS ecosystem, fostering trust among its participants.

5. Discussion and Future Works

In the context of our study, FL with an edge–fog–cloud architecture emerges as a more lightweight alternative compared to centralized learning. This conclusion is drawn from several key observations across various parameters. Firstly, while both approaches demonstrate high performance levels, centralized learning consistently yields superior accuracy, precision, recall, and F1-score values, with percentages reaching 99.36%, 99.55%, 99.79%, and 99.67%, respectively. However, FL operating within an edge–fog–cloud framework exhibits slightly lower performance levels after five rounds of training, with accuracy, precision, recall, and F1-score values recorded at 97.65%, 97.65%, 100%, and 98.81%, respectively.
Moreover, in terms of training time, FL showcases a significant advantage over centralized learning. Centralized learning often entails longer training times, averaging 4041.07 s, attributable to the sequential processing of data on a single server. Conversely, FL achieves a notably lower average training time of 155 s across edge devices, owing to the distributed learning paradigm that enables parallel processing capabilities. This parallelization of model training on multiple devices results in faster convergence and reduces the overall training time significantly.
Furthermore, an analysis of CPU usage reveals consistent average values across edge devices in both federated and centralized learning, with an average of 4.7%. However, a stark contrast emerges in memory consumption between the two approaches. Centralized learning exhibits notably higher average memory usage, reaching 40.78 GB, compared to FL, where the average memory usage across edge devices is substantially lower at 32.15 GB. FL optimizes CPU resources by distributing computational demands across edge devices, enhancing system performance. In contrast, centralized learning may experience CPU spikes due to sequential data processing, potentially leading to performance bottlenecks. Additionally, FL typically incurs lower memory consumption due to the distributed data storage across edge devices, which efficiently utilizes memory resources compared to centralized learning’s centralized data storage, necessitating larger memory capacity on the server. Thus, the FL approach with an edge–fog–cloud architecture emerges as a more lightweight solution, offering efficient utilization of resources and enhanced system scalability.
The implementation of FL in edge–fog–cloud brings opportunities in terms of latency compared to implementation in cloud-centric architectures; while cloud-centric architectures offer scalability and flexibility, they may suffer from higher latency due to the centralized nature of processing and storage. Edge–fog–cloud architecture addresses latency concerns by distributing resources closer to the data source or end-users, thereby reducing the round-trip time for data and improving the responsiveness of applications.
The CIDS trust and privacy-preserving analysis underscores the robustness and reliability of our proposed CIDS in maintaining trust and preserving user privacy. Through the integration of FL and blockchain technology within an edge–fog–cloud architecture, our system ensures that sensitive data remain decentralized and secure. FL enables model training on local datasets without the need for centralized data aggregation, thus minimizing the risk of data breaches and ensuring user privacy. Moreover, the utilization of blockchain technology with a PoW consensus mechanism further enhances trust by establishing a transparent and immutable ledger for recording all transactions and interactions within the system. This combination of FL and blockchain not only fortifies the integrity of the CIDS but also instills confidence in its ability to uphold user privacy.
By employing FL, our system adopts a privacy-preserving approach to model training, ensuring that sensitive data remain confidential and decentralized. Model updates are aggregated at fog nodes using secure techniques such as secure aggregation or differential privacy, guaranteeing the confidentiality of individual contributions. Subsequently, these aggregated updates are recorded on the blockchain, providing a transparent and tamper-proof record of all transactions and interactions within the network. This innovative integration of FL and blockchain technology not only mitigates the risk of data breaches but also reinforces the trustworthiness of the CIDS ecosystem. Through its commitment to privacy-preserving practices and transparent transaction recording, our proposed system stands as a testament to its dedication to maintaining trust and safeguarding user privacy in the realm of intrusion detection.
In future works, our CIDS will continue to evolve to address emerging threats such as data poisoning, model inversion attacks, and model inversion attacks. To mitigate the risk of data poisoning, where adversaries inject malicious data into the training process to compromise model integrity, our system will incorporate advanced anomaly detection techniques and robust data validation mechanisms. Additionally, to counter model inversion attacks, which exploit vulnerabilities in machine learning models to infer sensitive data from model outputs, we will implement enhanced privacy-preserving techniques such as secure enclaves and differential privacy to protect against information leakage.
Moreover, to innovate new consensus mechanisms that enhance the existing PoW algorithm, our future research will explore novel approaches such as proof of stake (PoS) or proof of authority (PoA) to improve scalability, energy efficiency, and overall system security. These enhanced consensus mechanisms will not only bolster the resilience of our system against adversarial attacks but also optimize resource utilization and facilitate seamless network operation. Through these future works, our CIDS aims to stay at the forefront of intrusion detection technology, ensuring robust security and privacy protection in dynamic and evolving threat landscapes.

6. Conclusions

In conclusion, our study demonstrates that FL within an edge–fog–cloud architecture offers a compelling lightweight alternative to centralized learning methodologies. While centralized learning exhibits superior performance metrics such as accuracy, precision, recall, and F1-score, with percentages reaching as high as 99.36%, FL within an edge–fog–cloud framework maintains commendable performance levels, with accuracy, precision, recall, and F1-score values recorded at 97.65%, 97.65%, 100%, and 98.81%, respectively, after five rounds of training. Furthermore, FL demonstrates a significant advantage in terms of training time, with an average training time of 155 s across edge devices compared to the much longer average of 4041.07 s for centralized learning. This advantage is attributed to FL’s distributed learning paradigm, enabling parallel processing capabilities and faster convergence. Additionally, FL optimizes CPU and memory resources by distributing computational demands and data storage across edge devices, leading to efficient resource utilization and enhanced system scalability. Moreover, the implementation of FL within an edge–fog–cloud architecture addresses latency concerns by distributing resources closer to the data source or end-users, thereby reducing round-trip time and improving application responsiveness. This architecture ensures efficient resource utilization while mitigating the risk of data breaches and preserving user privacy through the integration of FL and blockchain technology. By adopting privacy-preserving techniques such as secure aggregation and differential privacy, our proposed system upholds the confidentiality and decentralization of sensitive data, while the utilization of blockchain technology enhances transparency and trustworthiness through a tamper-proof record of all transactions and interactions. In essence, our study showcases the effectiveness of FL within an edge–fog–cloud architecture as a lightweight, efficient, and trustworthy solution for CIDSs in IoT environments, poised to make significant contributions to the security and integrity of IoT systems.

Author Contributions

Conceptualization, A.A.W. and G.K.; methodology, A.A.W. and G.K.; software, A.A.W.; validation, A.A.W., G.K. and P.S.; formal analysis, A.A.W.; investigation, A.A.W.; resources, A.A.W.; data curation, A.A.W.; writing—original draft preparation, A.A.W.; writing—review and editing, G.K. and P.S.; visualization, A.A.W.; supervision, G.K.; project administration, A.A.W.; funding acquisition, G.K. All authors have read and agreed to the published version of the manuscript.

Funding

This research received no external funding.

Institutional Review Board Statement

Not applicable.

Informed Consent Statement

Not applicable.

Data Availability Statement

This research used a public dataset download from https://www.unb.ca/cic/datasets/iotdataset-2023.html (accessed on 1 December 2023).

Acknowledgments

The work was supported by the project Minigrants for doctoral students of the Wroclaw University of Science and Technology.

Conflicts of Interest

The authors declare no conflicts of interest.

References

  1. Sarker, I.H.; Khan, A.I.; Abushark, Y.B.; Alsolami, F. Internet of Things (IoT) Security Intelligence: A Comprehensive Overview, Machine Learning Solutions and Research Directions. Mob. Netw. Appl. 2023, 28, 296–312. [Google Scholar] [CrossRef]
  2. Wardana, A.A.; Kołaczek, G.; Warzyński, A.; Sukarno, P. Ensemble averaging deep neural network for botnet detection in heterogeneous Internet of Things devices. Sci. Rep. 2024, 14, 3878. [Google Scholar] [CrossRef]
  3. Li, W.; Au, M.H.; Wang, Y. A fog-based collaborative intrusion detection framework for smart grid. Int. J. Netw. Manag. 2021, 31, e2107. [Google Scholar] [CrossRef]
  4. de Souza, C.A.; Westphall, C.B.; Machado, R.B.; Loffi, L.; Westphall, C.M.; Geronimo, G.A. Intrusion detection and prevention in fog based IoT environments: A systematic literature review. Comput. Netw. 2022, 214, 109154. [Google Scholar] [CrossRef]
  5. Wardana, A.A.; Kołaczek, G.; Sukarno, P. Collaborative Intrusion Detection System for Internet of Things Using Distributed Ledger Technology: A Survey on Challenges and Opportunities. In Intelligent Information and Database Systems; Springer: Cham, Switzerland, 2022; pp. 339–350. [Google Scholar]
  6. Awan, K.A.; Din, I.U.; Almogren, A.; Rodrigues, J.J.P.C. AutoTrust: A privacy-enhanced trust-based intrusion detection approach for internet of smart things. Future Gener. Comput. Syst. 2022, 137, 288–301. [Google Scholar] [CrossRef]
  7. Li, W.; Meng, W.; Kwok, L.F. Surveying Trust-Based Collaborative Intrusion Detection: State-of-the-Art, Challenges and Future Directions. IEEE Commun. Surv. Tutorials 2022, 24, 280–305. [Google Scholar] [CrossRef]
  8. Alli, A.A.; Alam, M.M. The fog cloud of things: A survey on concepts, architecture, standards, tools, and applications. Internet Things 2020, 9, 100177. [Google Scholar] [CrossRef]
  9. Gkogkos, G.; Patsonakis, C.; Drosou, A.; Tzovaras, D. A DLT-based framework for secure IoT infrastructure in smart communities. Technol. Soc. 2023, 74, 102329. [Google Scholar] [CrossRef]
  10. Imteaj, A.; Thakker, U.; Wang, S.; Li, J.; Amini, M.H. A survey on federated learning for resource-constrained IoT devices. IEEE Internet Things J. 2021, 9, 1–24. [Google Scholar] [CrossRef]
  11. Sarhan, M.; Lo, W.W.; Layeghy, S.; Portmann, M. HBFL: A hierarchical blockchain-based federated learning framework for collaborative IoT intrusion detection. Comput. Electr. Eng. 2022, 103, 108379. [Google Scholar] [CrossRef]
  12. Ashraf, E.; Areed, N.F.F.; Salem, H.; Abdelhay, E.H.; Farouk, A. FIDChain: Federated Intrusion Detection System for Blockchain-Enabled IoT Healthcare Applications. Healthcare 2022, 10, 1110. [Google Scholar] [CrossRef] [PubMed]
  13. He, X.; Chen, Q.; Tang, L.; Wang, W.; Liu, T. CGAN-Based Collaborative Intrusion Detection for UAV Networks: A Blockchain-Empowered Distributed Federated Learning Approach. IEEE Internet Things J. 2023, 10, 120–132. [Google Scholar] [CrossRef]
  14. Abdel-Basset, M.; Moustafa, N.; Hawash, H.; Razzak, I.; Sallam, K.M.; Elkomy, O.M. Federated Intrusion Detection in Blockchain-Based Smart Transportation Systems. IEEE Trans. Intell. Transp. Syst. 2022, 23, 2523–2537. [Google Scholar] [CrossRef]
  15. Abdel-Basset, M.; Moustafa, N.; Hawash, H. Privacy-Preserved Cyberattack Detection in Industrial Edge of Things (IEoT): A Blockchain-Orchestrated Federated Learning Approach. IEEE Trans. Ind. Inform. 2022, 18, 7920–7934. [Google Scholar] [CrossRef]
  16. Neto, E.C.P.; Dadkhah, S.; Ferreira, R.; Zohourian, A.; Lu, R.; Ghorbani, A.A. CICIoT2023: A Real-Time Dataset and Benchmark for Large-Scale Attacks in IoT Environment. Sensors 2023, 23, 5941. [Google Scholar] [CrossRef] [PubMed]
  17. Le, T.-T.-H.; Wardhani, R.W.; Putranto, D.S.C.; Jo, U.; Kim, H. Toward Enhanced Attack Detection and Explanation in Intrusion Detection System-Based IoT Environment Data. IEEE Access 2023, 11, 131661–131676. [Google Scholar] [CrossRef]
  18. Zhou, C.V.; Leckie, C.; Karunasekera, S. A survey of coordinated attacks and collaborative intrusion detection. Comput. Secur. 2010, 29, 124–140. [Google Scholar] [CrossRef]
  19. Marchetti, M.; Messori, M.; Colajanni, M. Peer-to-peer architecture for collaborative intrusion and malware detection on a large scale. In Information Security, Proceedings of the 12th International Conference, ISC 2009, Pisa, Italy, 7–9 September 2009; Springer: Berlin/Heidelberg, Germany, 2009. [Google Scholar]
  20. Liang, W.; Xiao, L.; Zhang, K.; Tang, M.; He, D.; Li, K.C. Data fusion approach for collaborative anomaly intrusion detection in blockchain-based systems. IEEE Internet Things J. 2021, 9, 14741–14751. [Google Scholar] [CrossRef]
  21. Shetty, T.; Negi, S.; Kulshrestha, A.; Choudhary, S.; Ramani, S.; Karuppiah, M. Blockchain for intrusion detection systems. In Blockchain Technology for Emerging Applications; Academic Press: Cambridge, MA, USA, 2022; pp. 107–136. [Google Scholar]
  22. Alevizos, L.; Eiza, M.H.; Ta, V.T.; Shi, Q.; Read, J. Blockchain-Enabled Intrusion Detection and Prevention System of APTs within Zero Trust Architecture. IEEE Access 2022, 10, 89270–89288. [Google Scholar] [CrossRef]
  23. Subathra, G.; Antonidoss, A.; Singh, B.K. Decentralized Consensus Blockchain and IPFS-Based Data Aggregation for Efficient Data Storage Scheme. Secur. Commun. Netw. 2022, 2022, 3167958. [Google Scholar] [CrossRef]
  24. Munir, A.; Kansakar, P.; Khan, S.U. IFCIoT: Integrated Fog Cloud IoT: A novel architectural paradigm for the future Internet of Things. IEEE Consum. Electron. Mag. 2017, 6, 74–82. [Google Scholar] [CrossRef]
  25. Roy, S.; Li, J.; Bai, Y. A Two-layer Fog-Cloud Intrusion Detection Model for IoT Networks. Internet Things 2022, 19, 100557. [Google Scholar] [CrossRef]
  26. Nilsson, A.; Smith, S.; Ulm, G.; Gustavsson, E.; Jirstrand, M. A Performance Evaluation of Federated Learning Algorithms. In Proceedings of the Second Workshop on Distributed Infrastructures for Deep Learning, Rennes, France, 10 December 2018; pp. 1–8. [Google Scholar] [CrossRef]
  27. Li, T.; Sahu, A.K.; Talwalkar, A.; Smith, V. Federated Learning: Challenges, Methods, and Future Directions. IEEE Signal Process. Mag. 2020, 37, 50–60. [Google Scholar] [CrossRef]
  28. Lecun, Y.; Bengio, Y.; Hinton, G. Deep learning. Nature 2015, 521, 436–444. [Google Scholar] [CrossRef] [PubMed]
  29. Aggarwal, C.C. Neural Networks and Deep Learning; Springer: Cham, Switzerland, 2018; Volume 10, pp. 973–978. [Google Scholar]
  30. Zhu, H.; Xu, J.; Liu, S.; Jin, Y. Federated learning on non-IID data: A survey. Neurocomputing 2021, 465, 371–390. [Google Scholar] [CrossRef]
  31. Alkasassbeh, M.; Baddar, S.A. Intrusion Detection Systems: A State-of-the-Art Taxonomy and Survey. Arab. J. Sci. Eng. 2023, 48, 10021–10064. [Google Scholar] [CrossRef]
  32. Ren, K.; Ho, N.M.; Loghin, D.; Nguyen, T.T.; Ooi, B.C.; Ta, Q.T.; Zhu, F. Interoperability in Blockchain: A Survey. IEEE Trans. Knowl. Data Eng. 2023, 35, 12750–12769. [Google Scholar] [CrossRef]
  33. Hazra, A.; Rana, P.; Adhikari, M.; Amgoth, T. Fog computing for next-generation Internet of Things: Fundamental, state-of-the-art and research challenges. Comput. Sci. Rev. 2023, 48, 100549. [Google Scholar] [CrossRef]
  34. Zhang, D.G.; Wu, H.; Zhao, P.Z.; Liu, X.H.; Cui, Y.Y.; Chen, L.; Zhang, T. New approach of multi-path reliable transmission for marginal wireless sensor network. Wirel. Netw. 2020, 26, 1503–1517. [Google Scholar] [CrossRef]
  35. da Silva, L.G.F.; Sadok, D.F.H.; Endo, P.T. Resource optimizing federated learning for use with IoT: A systematic review. J. Parallel Distrib. Comput. 2023, 175, 92–108. [Google Scholar] [CrossRef]
  36. Lan, K.; Heidemann, J. A measurement study of correlations of Internet flow characteristics. Comput. Netw. 2006, 50, 46–62. [Google Scholar] [CrossRef]
  37. Sathish, K.; Hamdi, M.; Chinthaginjala, R.; Pau, G.; Ksibi, A.; Anbazhagan, R.; Abbas, M.; Usman, M. Reliable Data Transmission in Underwater Wireless Sensor Networks Using a Cluster-Based Routing Protocol Endorsed by Member Nodes. Electronics 2023, 12, 1287. [Google Scholar] [CrossRef]
  38. Lee, J.Y.; Lee, W.; Kim, H.; Kim, H. Adaptive TCP Transmission Adjustment for UAV Network Infrastructure. Appl. Sci. 2020, 10, 1161. [Google Scholar] [CrossRef]
  39. Park, J.-S.; Lee, J.-Y.; Lee, S.-B. Internet traffic measurement and analysis in a high speed network environment: Workload and flow characteristics. J. Commun. Netw. 2000, 2, 287–296. [Google Scholar] [CrossRef]
Figure 1. Traditional CIDS architecture.
Applsci 14 04109 g001
Figure 2. Our view on this research about edge–fog–cloud DLT-based CIDS architecture in IoT system.
Applsci 14 04109 g002
Figure 3. Collaborative anomaly detection process in CIDS based on FL-DNN and DLT.
Applsci 14 04109 g003
Figure 4. The loss value trend across the edge layer. Figures (ae) present the trend of loss values in edge devices grouped by fog devices.
Applsci 14 04109 g004
Figure 5. The accuracy value trend across the edge layer. Figures (ae) present the trend of accuracy values in edge devices grouped by fog devices.
Applsci 14 04109 g005
Figure 6. The precision value trend across the edge layer. Figures (ae) present the trend of precision values in edge devices grouped by fog devices.
Applsci 14 04109 g006
Figure 7. The recall value trend across the edge layer. Figures (ae) present the trend of recall values in edge devices grouped by fog devices.
Applsci 14 04109 g007
Figure 8. The F1-score value trend across the edge layer. Figures (ae) present the trend of F1-score values in edge devices grouped by fog devices.
Applsci 14 04109 g008
Figure 9. Loss, accuracy, precision, recall, and F1-score across fog layer; Figure (a) represents the trend of loss value in Fog Devices 1–5; Figure (b) represents the trend of accuracy value in Fog Devices 1–5; Figure (c) represents the trend of precision value in Fog Devices 1–5; Figure (d) represents the trend of recall value in Fog Devices 1–5; Figure (e) represents the trend of F1-score value in Fog Devices 1–5.
Applsci 14 04109 g009
Figure 10. Loss, accuracy, precision, recall, and F1-score across cloud layer or global model.
Applsci 14 04109 g010
Figure 11. The training time result across the edge layer. Figures (ae) present the trend of training time results in edge devices grouped by fog devices.
Applsci 14 04109 g011
Figure 12. The CPU usage from the training process across the edge layer. Figures (ae) present the trend of CPU usage from the training process in edge devices grouped by fog devices.
Applsci 14 04109 g012
Figure 13. The memory usage from the training process across the edge layer. Figures (ae) present the trend of memory usage from the training process in edge devices grouped by fog devices.
Applsci 14 04109 g013
Figure 14. Transmission speed in the CICIoT2023 dataset.
Applsci 14 04109 g014
Figure 15. Latency in edge–fog architecture.
Applsci 14 04109 g015
Figure 16. Latency in fog–cloud architecture.
Applsci 14 04109 g016
Figure 17. Latency in cloud-centric architecture.
Applsci 14 04109 g017
Table 1. CICIoT2023 features.
Feature
flow_durationHeader_LengthProtocol TypeDurationRate
SrateDratefin_flag_numbersyn_flag_numberrst_flag_number
psh_flag_numberack_flag_numberece_flag_numbercwr_flag_numberack_count
syn_countfin_counturg_countrst_countHTTP
HTTPSDNSTelnetSMTPSSH
IRCTCPUDPDHCPARP
ICMPIPvLLCTot sumMin
MaxAVGStdTot sizeIAT
NumberMagnitueRadiusCovarianceVariance
WeightLabel
Source: https://www.unb.ca/cic/datasets/iotdataset-2023.html (accessed on 1 December 2023).
Table 2. 30% of CICIoT2023 Traffic.
NoTraffic TypeNumber
1DDoS10,197,039
2DoS2,426,635
3Mirai790,305
4Benign328,597
5Spoofing145,999
6Recon105,957
7Web7462
8BruteForce3980
Source: https://www.unb.ca/cic/datasets/iotdataset-2023.html (accessed on 1 December 2023).
Table 3. DNN hyperparameters.
HyperparameterDetails
Hidden layer4
Input dimension46
Optimization algorithmSGD
Output dimension1 (binary)
Batch size1000
Output layer activation functionSigmoid
Epochs10
MetricsAccuracy, precision, and recall
Loss functionMean squared error
Table 4. Hidden layer details.
Hidden LayerNumber of NodeActivation Function
121ReLU
213ReLU
37ReLU
45ReLU
Table 5. Centralized learning detection performance.
NoParameterResult
1Loss0.0045648
2Accuracy (%)0.9936
3Precision (%)0.9955
4Recall (%)0.9979
5F1-score (%)0.9967
6Training time (s)4041.07
7Average CPU (%)4.7
8Average memory (GB)40.78
9Model size (Kb)46
Table 6. Latency and TPS from DLT.
Number of TransactionsLatency (s)Transactions per Second
10006166.67
200012166.67
300018166.67
400025160
500030166.67
600036166.67
700042166.67
800049163.26
900056160.71
10,00062161.29
Average33.6164.52
Table 7. CPU and memory from Truffle.
Number of TransactionsCPU (%)RAM (Mb)
10003.26217.39
20003.42217.42
30002.98217.39
40002.84217.37
50002.82217.36
60003.75217.71
70002.9217.38
80002.85217.4
90003.43217.57
10,0002.85217.18
Average3.11217.41
Table 8. CPU and memory from IPFS.
Number of TransactionsCPU (%)RAM (Mb)
100015.42138.17
200017.55140.27
300015.13144.24
400015.34144.52
500015.48144.62
600015.64144.09
700017.36144.39
800017.1144.66
900017.86145.11
10,00019.223147.43
Average16.61143.75
Disclaimer/Publisher’s Note: The statements, opinions and data contained in all publications are solely those of the individual author(s) and contributor(s) and not of MDPI and/or the editor(s). MDPI and/or the editor(s) disclaim responsibility for any injury to people or property resulting from any ideas, methods, instructions or products referred to in the content.

