Abstract
Recent advancements in high dynamic range (HDR) display technology have significantly enhanced the contrast ratios and peak brightness of modern displays. In the coming years, it is expected that HDR televisions capable of delivering significantly higher brightness and, therefore, contrast levels than today’s models will become increasingly accessible and affordable to consumers. While HDR technology has gained prominence over the past few years, low dynamic range (LDR) content is still consumed due to a substantial volume of historical multimedia content being recorded and preserved in LDR. Although the amount of HDR content will continue to increase as HDR becomes more prevalent, a large portion of multimedia content currently remains in LDR. In addition, it is worth noting that although the HDR standard supports multimedia content with luminance levels up to 10,000 cd/m2 (a standard measure of brightness), most HDR content is typically limited to a maximum brightness of around 1000 cd/m2. This limitation aligns with the current capabilities of consumer HDR TVs but is a factor approximately five times brighter than current LDR TVs. To accurately present LDR content on a HDR display, it is processed through a dynamic range expansion process known as inverse tone mapping (iTM). This LDR to HDR conversion faces many challenges, including the inducement of noise artifacts, false contours, loss of details, desaturated colors, and temporal inconsistencies. This paper introduces complete inverse tone mapping, artifact suppression, and a highlight enhancement pipeline for video sequences designed to address these challenges. Our LDR-to-HDR technique is capable of adapting to the peak brightness of different displays, creating HDR video sequences with a peak luminance of up to 6000 cd/m2. Furthermore, this paper presents the results of comprehensive objective and subjective experiments to evaluate the effectiveness of the proposed pipeline, focusing on two primary aspects: real-time operation capability and the quality of the HDR video output. Our findings indicate that our pipeline enables real-time processing of Full HD (FHD) video (1920 × 1080 pixels), even on hardware that has not been optimized for this task. Furthermore, we found that when applied to existing HDR content, typically capped at a brightness of 1000 cd/m2, our pipeline notably enhances its perceived quality when displayed on a screen that can reach higher peak luminances.
1. Introduction
High dynamic range (HDR) imaging is a technology that has revolutionized how we capture, display, and perceive visual content. Unlike conventional imaging techniques, which struggle to faithfully reproduce the full range of brightness levels present in the real world, HDR technology empowers us to capture and showcase the incredible diversity of luminance values, from the deepest shadows to the most brilliant highlights.
Luminance, a measure of emitted light intensity, is quantified in candelas per square meter (cd/m2), often referred to as “nits”. One nit equals a luminance value of 1 cd/m2. In the real world, scenes can vary widely in brightness, ranging from extremely bright, such as sunlight that exceeds 10,000 cd/m2, to very dark shadows with near-zero luminance.
The contrast ratio, a key aspect of display performance, is the ratio of the brightest and darkest luminances a display can reach. Contrast ratio, also known as “dynamic range”, is measured in exposure value (ev) differences, also known as “stops”, which is the logarithm base-2 of the contrast ratio. Therefore, one unit increase in one ev, or one-stop, means that the screen’s brightness has doubled [1].
While conventional display technology typically achieves brightness levels ranging from 1 cd/m2 to 300 cd/m2 and encompasses a limited dynamic range of up to eight stops, it pales in comparison to the luminance variations encountered in real-world scenes. This stark contrast becomes even more pronounced when considering that the human eye discerns a dynamic range of up to 14 stops within a single visual field. Evidently, conventional display technology falls short in faithfully reproducing the nuanced luminance realism inherent to our visual experiences.
Recent advancements in display technology have ushered in a new era of HDR displays, offering a remarkable boost in dynamic range and brightness. HDR prototype displays utilizing arrays of independent high-power light emission diodes (LEDs) as backlight units have achieved extraordinary milestones, boasting a peak brightness of 10,000 cd/m2 and an impressive 17 stops of dynamic range [2,3]. Similarly, organic light-emitting diode (OLED) technology has started taking a significant market share in the production of HDR consumer televisions.
Figure 1 illustrates the fundamental differences between LED and OLED display technologies. As illustrated, LED displays utilize high-power LED backlights to illuminate liquid crystal pixels. In contrast, the LEDs in OLED technology independently emit light without the need for a backlight, thereby dramatically improving contrast ratio and energy efficiency [4]. Recently, at the Consumer Electronics Show (CES) in 2023, the company LG presented its new OLED META technology. This technology incorporates two major components into LG’s current OLED platform: a MLA (micro lens array), which significantly enhances the light emission efficiency of OLED displays, and a META booster, which is an advanced algorithm that dynamically analyzes and adjusts scene brightness in real-time. This innovation allows for improved brightness, contrast, and energy efficiency of OLED displays, allowing them to achieve a peak brightness of 2100 cd/m2.

Figure 1.
Comparison between LED and OLED display technology.
Emerging technologies such as mini-LEDs (mLEDs) and micro-LEDs (μLEDs) are also making significant contributions to enhancing the dynamic range in modern displays [5,6]. It is expected that, in the coming years, HDR displays for the consumer market will reach higher peak brightness than today’s standards, enhancing their ability to mimic the luminance of real-world scenes more accurately.
HDR content, associated with cutting-edge HDR display technologies, features media with dynamic ranges surpassing 14 stops [7]. This capability allows HDR content to showcase a much wider spectrum of luminance and colors compared to traditional low dynamic range (LDR) content, also known as standard dynamic range (SDR). While LDR is a general term for media with limited dynamic range, SDR specifically refers to conventional broadcast standards. The terms LDR and SDR are often used interchangeably, which can lead to confusion. However, for the purposes of this article, they are synonymous and refer to content characterized by a lower dynamic range.
While HDR content is gaining popularity, it remains a relatively recent advancement in both video acquisition and display technology. Therefore, not only is historical media content only available in LDR, a large amount of legacy LDR content is still consumed. As HDR becomes more prevalent, the proportion of HDR content will increase, but for now, the vast bulk of media archives worldwide remain in LDR.
To display LDR content accurately on HDR screens, it must undergo a process known as inverse tone mapping (iTM), which converts LDR content to HDR (up-conversion) [1]. Traditionally, iTM methods have been designed to create HDR images with the best subjective quality when viewed on HDR screens. These methods vary in complexity and approach, ranging from simple techniques that retain key attributes of the LDR content such as contrast and color [8,9,10,11,12,13,14], to more complex machine learning-based techniques [15,16,17,18,19,20,21]. In addition, other LDR-to-HDR conversion methods, known as single-image HDR reconstruction (SI-HDR) methods, have recently emerged. Unlike conventional inverse tone mapping methods, SI-HDR methods work on estimating physical light quantities and reconstructing missing details in overexposed or saturated regions [22,23,24,25,26,27,28,29,30]. Despite advancements, LDR-to-HDR conversion encounters the following challenges:
- Noise artifact boosting: Noise artifacts are ubiquitous in almost all LDR content. However, due to the low contrast and luminance levels of LDR displays, these are often imperceptible to the human eye. However, when this content is expanded to the HDR domain and displayed on an HDR screen, these artifacts can become noticeable.
- False contouring: This issue refers to the creation or emphasis of artifacts known as false contours. In HDR images, these contours emerge due to the coarse quantization of smooth regions into finite codewords, where a significant number of codewords are required to achieve a gradual color transition in the HDR domain [31].
- Lack of detail in under/overexposed regions: When a scene is captured in LDR, it may not fully represent areas with extremely bright or dark elements, leading to a loss of intricate detail. This issue can stem from two distinct causes: the technological limitations of the camera sensor in capturing the full spectrum of luminance values and intentional artistic grading choices that aim to suppress certain parts of the dynamic range for aesthetic purposes. For instance, in a high-contrast scene, details in very bright regions (overexposed) or very dark regions (underexposed) might not be fully captured due to the sensor’s dynamic range limitation. Simultaneously, during the grading process, deliberate enhancement or reduction of these details occurs, aligning with the artistic vision within the constraints of a limited dynamic range. The challenge for inverse tone mapping methods lies in reconstructing the lost details in these regions, details such as subtle textures, shadow gradients, or highlights not captured in the original LDR image.
- Desaturated color appearance: Saturation in images refers to the intensity or purity of colors. Highly saturated colors appear vivid and intense, while desaturated colors appear muted and dull. In the context of inverse tone mapping, the problem arises when the color intensity of certain elements in the resulting inverse tone mapped HDR image appears less vibrant or vivid compared to the original LDR content. It has been observed that desaturation not only depends on the expansion function used in inverse tone mapping methods but also on the colorfulness of the input LDR content [12].
- Temporal artifacts: This problem refers to visual inconsistencies or irregularities that occur over time when applying inverse tone mapping methods to video sequences. These issues stem from the fact that each frame is processed independently, without any reference to the previous frame’s state. This can lead to noticeable disruptions in the appearance of the video. Common examples of temporal artifacts include flickering, object incoherence, and brightness incoherence.
In this paper, we present comprehensive inverse tone mapping, artifact suppression, and a highlight enhancement pipeline for video sequences designed to address the challenges described above. This work significantly advances our earlier contributions, strategically extending our inverse tone mapping approach for LDR images, initially introduced in [13,32], and seamlessly integrating it with our decontouring algorithm detailed in [31] to formulate a comprehensive LDR-to-HDR conversion pipeline optimized for video content. Furthermore, we introduce new steps for artifact suppression and a novel step for highlight enhancement, with the explicit aim of elevating the quality of the resultant HDR video sequence. Furthermore, we introduce an innovative application of our pipeline that increases the brightness of existing HDR content in a careful way. Typically, HDR content is limited to a peak brightness of around 1000 cd/m2. Our approach enables an increase in peak brightness up to 6000 cd/m2, markedly improving its visual quality.
The main contributions of our research are as follows:
- We developed a comprehensive LDR-to-HDR conversion pipeline for video sequences capable of adapting to the peak brightness of different displays. Our pipeline can create HDR video sequences that significantly exceed the peak brightness capabilities of current state-of-the-art iTM techniques. This capability is particularly significant given that future television technologies are expected to support even greater brightness levels than those currently available.
- We propose a novel method to detect and enhance highlights in HDR content. Our method is designed to identify and boost highlights while staying within the technical limits of the display device. This simultaneously maximizes the dynamic range and enhances the visual impact of the HDR video.
- We present an innovative application of our pipeline to significantly increase the overall brightness of existing HDR content acquired at lower luminance levels. This results in HDR video sequences with peak brightness exceeding current HDR standards, thereby delivering a considerable improvement in visual quality.
- We present the results of comprehensive objective and subjective experiments evaluating the effectiveness of our proposed LDR-to-HDR conversion pipeline. We focused on two primary aspects: real-time operation capability and the quality of the HDR video output. HDR video quality was assessed via three experiments: (1) objective evaluation of LDR-to-HDR converted videos obtained from our pipeline and two state-of-the-art methods, (2) subjective evaluation of LDR to HDR converted videos obtained from our pipeline versus original LDR content, and (3) subjective evaluation of HDR to xHDR converted videos using an alternative application of our pipeline.
The structure of this paper is organized as follows: Section 2 provides an overview of prior works in the field. In Section 3, we delve into the details of our proposed LDR-to-HDR pipeline. The experimental setup and outcomes are presented in Section 4, including an evaluation of our pipeline for enhancing the perceived quality of existing HDR content. Finally, Section 5 presents our concluding remarks and future research directions.
2. Related Work
While several methods for inverse tone mapping have been developed, many are optimized for images. Extending these techniques to video sequences introduces distinct challenges, often resulting in troublesome temporal artifacts. In particular, learning-based methods have been found to produce noticeable artifacts, especially in overexposed areas. Moreover, the appearance of these artifacts varies significantly between consecutive frames within a video sequence [23]. In this section, we explore more recent LDR-to-HDR approaches specifically tailored to video sequences.
In [11], one of the first inverse tone mapping methods for video sequences is presented. This approach is oriented to managing situations where input images contain extensive overexposed regions, allowing for the creation of high-quality HDR images and videos across various exposure conditions. The method involves the computation of an “expand map” derived from the input LDR image. This map identifies areas where image information may have been lost. These regions are meticulously filled using a smooth function to avoid the creation of artifacts. Notably, the authors propose a cross-bilateral filtering technique as a smooth function; the results demonstrate its ability to generate smooth gradients while preserving intricate details from the original image.
In [15], an inverse tone mapping method based on deep convolutional networks (CNN) known as deep SR-ITM (super-resolution inverse tone mapping) is introduced. Unlike other CNN-based methods [22,23], what sets this method apart is its ability to restore lost details across the entire image, not just within overexposed regions. Significantly, deep SR-ITM is trained using 4K-PQ-encoded videos in the Rec.2020 (BT.2020) color space. This training allows it to produce HDR video frames directly encoded in PQ-OETF, making this method practical for HDR TV applications. Moreover, deep SR-ITM can upscale the resolution of an input LDR image to 4K-UHD ( pixels resolution) while concurrently expanding its dynamic range. This method uses a so-called “Joint Convolutional Neural Network” designed to both enhance the dynamic range (through inverse tone mapping) and retrieve lost fine details (via super-resolution).
In [16], JSI-GAN, a method based on generative adversarial networks (GAN), is presented. Similar to SR-ITM, it can increase the resolution of the LDR input image/frame during the inverse tone mapping operation. JSI-GAN is trained on the same data as deep SR-ITM, and it also produces HDR images/frames directly encoded in PQ-OETF in the Rec.2020 color space. JSI-GAN comprises three task-specific sub-nets, each serving a unique purpose: (i) a detail restoration sub-net, (ii) a local contrast enhancement sub-net, and (iii) an image reconstruction sub-net.
HDRTVNet, a pipeline to create HDR content from LDR content for TV, is presented in [17]. This three-step pipeline solution includes adaptive global color mapping, local enhancement, and highlight generation. The adaptive global color mapping converts the input LDR content into the HDR domain. Local enhancement acts as a refining process, increasing the local contrast of the resulting HDR image using local information. Highlight generation focuses on the overexposed areas of the image to restore any information that may have been lost. Each step in the pipeline is performed using CNNs, and as in previous methods, the resulting HDR image is encoded with PQ-OETF in the Rec.2020 color space. A refined iteration, HDRTVNet++, is presented in [33], offering enhanced restoration accuracy.
In [20], a novel approach for converting LDR to HDR conversion is presented by introducing the frequency-aware modulation network (FMNet). Traditional CNN techniques often face challenges with artifacts appearing in low-frequency regions. FMNet addresses this limitation by including a frequency-aware modulation block (FMBlock). Instead of treating all features equally, the FMBlock smartly modulates features by discerning their frequency-domain characteristics. To achieve this, it harnesses the power of the discrete cosine transform (DCT), a tool known to capture frequency-based details. FMNet is trained on the same dataset used to train the previously described HDRTVNet, creating HDR images directly encoded with PQ-OETF and in the Rec.2020 color space.
In [34], a CNN-based joint SR-ITM (super-resolution and inverse tone mapping) framework is presented. As with [20], this method focuses on avoiding color discrepancy and preserving long-range structural similarity in the image. This method proposes using a global priors-guided modulation network (GPGMNet). The main components of this network are the joint modulated residual modules (JMRMs), the global priors extraction module (GPEM), and the upsampling module. The GPEM extracts color conformity and structural similarity priors that are equally beneficial for SDRTV-to-HDRTV and SR tasks. The JMRM includes a spatial pyramid convolution block (SPCB) and a global priors-guided spatial-wise modulation block (GSMB). The SPCB provides multi-scale spatial features to the GSMB, which then modulates these using global priors and spatial information. Using a simplified global priors vector and consolidated spatial feature map, GPGMNet achieves effective feature modulation with fewer computational needs than other methods. The final 4K HDR (PQ/BT.2020) image is created by adding the residual from the predicted image to an up-scaled image.
In a recent study presented in [35], the authors introduce an SDR-to-HDRTV up-conversion technique. While most methods yield dim and desaturated outputs, this approach aims to produce HDR images that are not only accurate in reconstruction but also perceptually vibrant, enhancing the viewer’s experience. To achieve this, the authors created a unique training set and new evaluation criteria grounded in perceptual quality estimation. The new dataset is used to train a luminance-segmented network (LSN) consisting of a global mapping trunk and two transformer branches on bright and dark luminance ranges.
These works share a common goal with our research: to increase the dynamic range of LDR video sequences. However, because they often focus on individual frame processing, these techniques may induce temporal artifacts when the frames are stitched together into a video sequence. Additionally, they tend to introduce artifacts in oversaturated regions. Furthermore, they are generally limited to producing HDR content with peak brightness levels that match current HDR screens, typically around 1000 cd/m2.
Our study extends the existing research on inverse tone mapping of video sequences by introducing a complete LDR-to-HDR conversion pipeline specifically designed for this context. Our pipeline addresses the key limitations observed in previous works: it prevents the occurrence of artifacts using a simple expansion global operator, minimizes temporal artifacts by incorporating mechanisms for improved frame-to-frame stability, and supports peak brightness of up to 6000 cd/m2, exceeding the typical 1000 cd/m2 peak brightness of most approaches. In addition, its streamlined design facilitates real-time processing, a critical requirement for many practical applications.
3. Materials and Methods: A Pipeline for Dynamic Range Expansion of Video Sequences
In the previous section, we explored various methods to convert LDR video sequences into HDR. These methods can produce high-quality HDR content characterized by sharp contrasts and luminous highlights, and have the capacity to restore missing details in overexposed regions. However, these methods also exhibit several of the limitations commonly present in LDR-to-HDR conversion methods. These include, but are not limited to, the manifestation of temporal and spatial artifacts. Furthermore, these methods are constrained to producing HDR content with lower peak luminance levels, which becomes an important drawback as television technology evolves to support higher brightness levels. Moreover, the complexity inherent to some of these techniques and their resource-intensive nature makes them less viable for practical implementations. This includes scenarios like real-time LDR to HDR conversion and integration into devices with limited computational capabilities, thus restricting their applicability in everyday technologies such as smart TVs and decoders.
Given these factors, our research has produced a novel pipeline designed for efficient conversion of LDR video sequences into HDR. The primary aim of our method extends beyond the simple reversal of existing tone mapping, comprising both artistic nuances and technological constraints inherent to LDR content. Instead, our approach is designed to execute a comprehensive LDR-to-HDR conversion process. This meticulously crafted process seamlessly converts the original LDR footage into HDR, ensuring alignment with the enhanced artistic vision often associated with HDR imagery. Such a vision encompasses the achievement of deeper blacks, more luminous highlights, and vivid colors, all while preserving the scene’s inherent naturalism.
The focus on video sequences in LDR-to-HDR conversion is important for several reasons. Video sequences represent a significant portion of content production, from television and film to online streaming and gaming. In addition, with a vast amount of existing LDR content and the expectation that HDR screens will become standard in the near future, there is a growing demand for innovative techniques to convert LDR video sequences to HDR and, therefore, to take advantage of the enhanced contrast and brightness of upcoming HDR displays. Furthermore, new optimized algorithms capable of real-time processing on display devices will be essential to meet this demand. These algorithms must be designed to work efficiently within the limited resources typical of consumer displays while ensuring frame-to-frame consistency to maintain visual coherence and prevent temporal artifacts. Such consistency is particularly important in video sequences, where even minor discrepancies between frames can negatively affect the viewing experience.
Our proposed pipeline extends the dynamic range of an LDR video sequence to be suitable for reproduction on an HDR display with highlights that can reach a maximum peak luminance of 6000 cd/m2, far surpassing most existing techniques. Our pipeline enables a nuanced enhancement of the visual experience, faithfully reflecting the creators’ artistic intentions within the technological framework of HDR display capabilities. The flowchart in Figure 2 illustrates our proposed pipeline, consisting of five key stages:
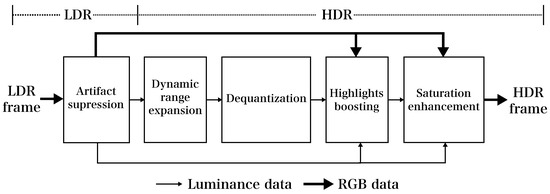
Figure 2.
Flowchart of the proposed pipeline for inverse tone mapping. The dynamic range of an 8-bit LDR frame is expanded into a 16-bit HDR frame with a peak luminance of 6000 cd/m2.
- Artifact suppression: Prior to dynamic range expansion, artifacts (e.g., arising from compression) and noise in the LDR input image are effectively reduced.
- Dynamic range expansion: The luminance from the filtered LDR image undergoes dynamic range expansion into HDR using a global operator. In this step, the maximum luminance intensity is expanded to 4000 cd/m2, while the remaining 2000 cd/m2 are allocated for additional highlight boosting.
- Dequantization: This stage addresses false contours that might emerge in areas with smooth gradients following dynamic range expansion, effectively suppressing these artifacts.
- Highlight boosting: By analyzing the luminance of the LDR image, overexposed/saturated regions are identified. This information guides the boosting of highlights in the expanded HDR luminance, increasing them to 6000 cd/m2 for enhanced visual impact.
- Saturation enhancement: The final HDR image is computed, and saturation is augmented at the pixel level without compromising the overall luminance. This adjustment compensates for the potential loss of colorfulness in the output. Each color channel of the resulting HDR image is stored in a 16-bit floating-point format to ensure accurate representation.
- Temporal consistency: We integrate a simple temporal coherence technique into our pipeline to minimize temporal artifacts.
3.1. Artifact Suppression
LDR content inherently contains noise and artifacts, a characteristic often subtly masked when displayed on devices with limited brightness and dynamic range [36,37]. However, it is important to note that the presence of such artifacts, especially those originating from compression, is by design. Compression algorithms are optimized for efficiency, trading off imperceptible artifacts at lower dynamic ranges for reduced data sizes. Before expanding the dynamic range, it is crucial to filter the LDR input to reduce the visibility of these artifacts and noise, regardless of whether they stem from compression techniques or the camera sensor. This pre-emptive measure prevents the exacerbation of artifacts during the dynamic range enhancement process. To achieve this, we employ a time-efficient implementation of the guided filter, specifically the “fast guided-filter” [38]. The guided filter, renowned for its edge-aware image filtering capabilities, has demonstrated good performance across various computer vision applications, including image denoising [39,40]. It is able to remove/reduce noise and artifacts while preserving fine details and textures within the image [41,42]. The fast-guided filter, an accelerated version of the original, maintains nearly identical performance while significantly enhancing processing speed, outpacing its predecessor by over ten times.
We utilize the fast-guided filter’s edge-preserving smoothing function to quickly and effectively remove artifacts from an input LDR frame. For this, the filter uses the same LDR input frame as the guidance image. The fast-guided filter has three parameters for artifact denoising control and processing speed. These parameters are as follows: the local window radius (r), the regularization parameter () to manage the degree of smoothness, and the subsampling ratio (s), which allows us to speed up the filtering process. The careful adjustment of the first two parameters enables precise management of the filter’s intensity, tailoring the final appearance of the processed frame to our desired specifications.
An outcome of this artifact denoising step is depicted in Figure 3, showcasing the results obtained from an input frame measuring pixels using the following parameters: , , and . This figure visually demonstrates the performance of the fast-guided filter, effectively eliminating noticeable artifacts while preserving fine details and textures within the image.
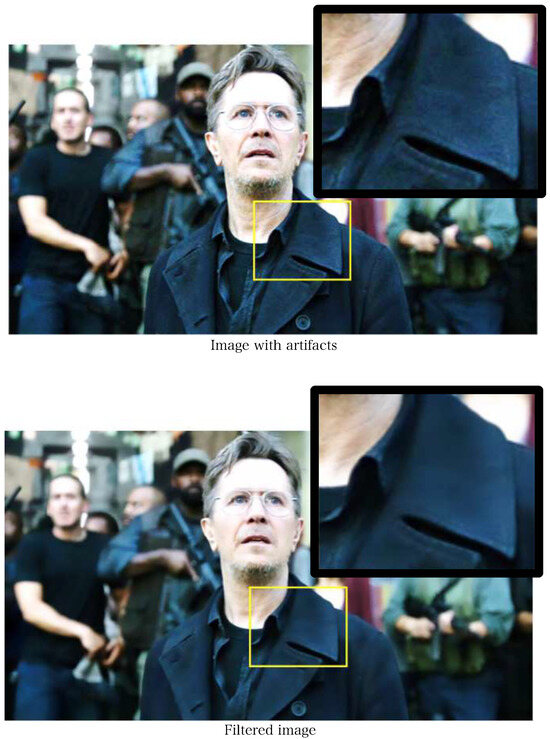
Figure 3.
Example of artifact suppression using the fast-guided filter on an image with visible artifacts. The parameters used were , , and . In the zoomed region, artifacts in the lapel are suppressed while fine details such as seams and wrinkles in the actor’s face are largely preserved. (Image from the movie trailer “Dawn of the Planet of the Apes”: WETA/Twentieth Century Fox Film Corporation).
3.2. Dynamic Range Expansion
The core of our proposed inverse tone mapping pipeline is the dynamic range expansion step. For this, we use our fully automatic inverse tone mapping method based on the dynamic mid-level tone mapping proposed in [13,32].
Our dynamic range expansion method employs a global function initially devised for adjusting game display settings and optimizing tone-mapping for HDR content. This function, proposed in the context of enhancing gaming visuals, effectively maintains peak brightness while adjusting middle-gray value in-game luminance, the overall perceived brightness, to comfortable levels [43]. The middle-gray value, often referred to simply as “middle gray”, represents a tone that sits perceptually midway between the extremes of black and white on a lightness scale. The expansion function based on middle-gray mapping is expressed as follows:
where and represent the luminance of the filtered input LDR frame and the corresponding luminance in the HDR output, respectively, at a given pixel (x, y). , where is the maximum luminance in . This maximum luminance value is determined based on either the desired peak brightness for the output HDR video sequences or the peak brightness capability of the HDR display screen.
The shape of the curve is controlled by parameters a and d, which allow for contrast adjustment and highlight expansion, respectively. If we define the following two conditions: (i) for any value , and (ii) , and substitute the specific values provided by the conditions into the expansion function defined in Equation (1), parameters b and c that satisfy both conditions simultaneously can be computed by solving the following equations:
where the solutions for parameters b and c are as follows:
Figure 4 illustrates the shape of our proposed expansion function. Parameter a determines the lower end of the curve, influencing the output’s contrast. On the other hand, parameter d defines the curve’s upper shape, influencing the expansion of highlights. Typically, a d value greater than 1 is necessary in inverse tone mapping to adequately stretch the highlights. Similarly, a a value close to 1 maintains the shadows, while a significantly larger a () compresses them in the output. We recommend a slightly higher value of a to strike a balance between enhancing and preserving the shadows from the input LDR frame in the resulting HDR output. Parameters (mid-level in) and (mid-level out) define the anchor point of the expansion curve and represent the middle-gray value defined for L and the expected middle-gray value in the output , respectively.
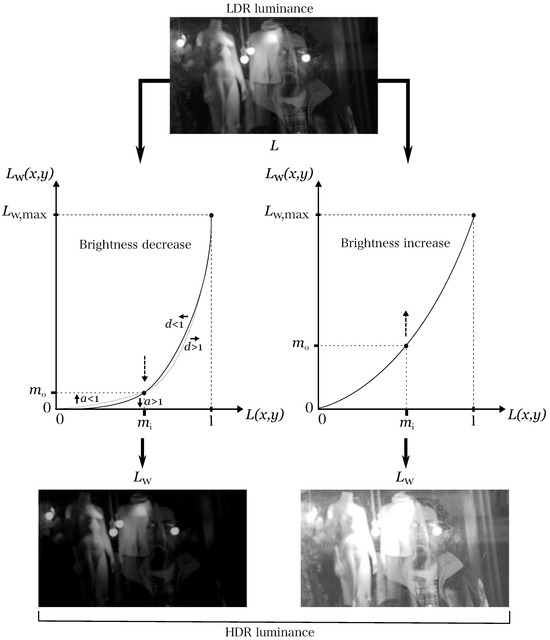
Figure 4.
Dynamic range expansion based on mid-level tone mapping. The overall perception of brightness of the expanded luminance () can be modified by fixing the mid-level in parameter () and varying the mid-level out (). Higher values of (right side of the image) will make brighter, and lower values (left part of the image) will make it darker. Parameters d and a can be used to fine-tune the results, increasing the overall contrast and appearance of the highlights, respectively.
In our approach, parameter is set to the middle-gray value for the specific LDR content under processing. For instance, a value of 0.214 is assigned for an LDR content encoded in the sRGB linear color space. Meanwhile, parameter determines the middle-gray value intended for the resulting HDR frame, which essentially governs its overall brightness.
The mid-level output value is computed using basic features derived from the filtered LDR input frame. In our previous research described in [13,32], we conducted a subjective experiment where a group of LDR images were expanded into HDR using our proposed expansion operator. For each image, the participants were asked to set the value of the middle-gray output that generated an HDR image closer to the corresponding HDR ground truth, i.e., an HDR image with similar overall brightness. In this experiment, we collected data on the middle-gray levels in the output used for inverse tone mapping a wide variety of scenes. We then applied a multi-linear regression approach to model the relationship between the middle-gray value in the output (as the dependent variable) and various first-order statistical features (as independent variables).
From this analysis, our resulting regression model revealed that the estimation of could be achieved by employing simple image statistics extracted from the LDR input as follows:
where is the geometric mean, C is the contrast, and is the percentage of over-exposed pixels in the filtered LDR input frame. These parameters are computed as follows:
where is the average luminance value, is the minimum, and is the maximum luminance value in the filtered LDR input frame. N is the total number of pixels, is a small constant to avoid undefined values (here ), and is the total number of overexposed pixels. The overexposed pixels refer to those pixels with at least one color channel greater than or equal to . These values are computed after excluding 5% of the pixels on the dark and bright sides, considered outliers.
As described in our previous research detailed in [32], and as reflected in Equation (4), the geometric mean (), which is the parameter that represents the perceptual overall brightness of the input image, had the highest positive relation with the middle-gray value in the output. This finding underscores the influence of perceived brightness on the middle-gray adjustment in dynamic range expansion processes.
To prevent the resulting inverse tone-mapped HDR video sequences from flickering as a result of abrupt changes between frames in the estimated mid-level values, the mid-level output value used to expand the dynamic range of the current frame () is adjusted using a weighted average as follows:
where denotes the mid-level out value used to expand the dynamic range of the previous frame, is the mid-level out value determined using Equation (4), and p is the weight value.
In Equation (5), parameter p serves as a “damping” factor. A larger p dampens abrupt changes in the mid-level output, thus preventing flickering artifacts in the resulting HDR video sequence. However, an increased p also introduces a “delay” in the expansion operator’s responsiveness to subtle scene shifts, which might be perceptible to an observer. For 24 fps video sequences, we determined an optimal p value range between 0.1 and 0.3, effectively mitigating flickering artifacts without introducing noticeable delays.
3.3. Dequantization
This step focuses on removing “false contours” or “banding artifacts”, commonly observed in smooth transition areas within an LDR frame. To achieve this, we employ our fast iterative false-contour removal method, which we previously introduced in [31]. Our proposed “decontouring” method is specifically tailored to mitigate the emergence of false contours arising from the dynamic range expansion process. It considers the false-contour removal operation as a signal reconstruction problem that can be solved using an iterative projection onto convex sets (POCS)-based minimization algorithm.
The decontouring method operates jointly with the dynamic range expansion function. That is, both false-contour removal and dynamic range expansion are performed simultaneously in an iterative manner until converging to an acceptable solution, i.e., an inverse tone-mapped LDR frame without visible false contours. An illustrative example of this iterative convergence using cascaded projection operators is shown in Figure 5. In this example, the pixel value in is filtered using a low-pass filter (first operator), and the resulting value is clamped (second operator) to keep it between the quantization boundaries. The low-pass filter is a two-dimensional average filter with a radius equal to b.
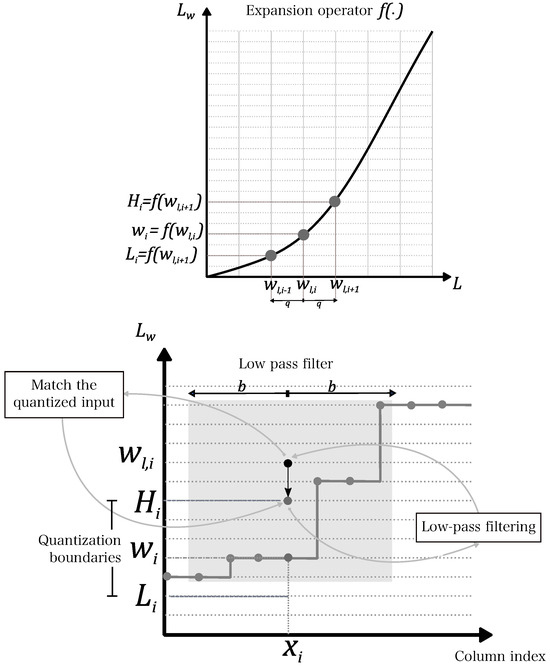
Figure 5.
False-contour removal method based on iterative projection onto convex sets (POCS). In this example, the pixel value in is filtered using a low-pass filter (first projection operator) and clamped between the quantization boundaries (second projection operator) iteratively.
As presented in [31], our decontouring method is characterized by three key parameters: the difference between two consecutive pixels within a smooth region (q), the radius of the average filter (b), and the number of iterations (i). The difference between two consecutive pixels in an image to be perceived as a smooth transition depends on multiple factors. For a standard 8-bit LDR image, a typical difference threshold ranges from 1 to 5 units. However, this is merely a general guideline. The optimal threshold can vary based on specific contexts and applications. Within our specific context, we determined that a range between 3 and 11 units effectively filters out the majority of false contours.
3.4. Highlight Boosting
The main goal of the highlight boosting step is to restore high-brightness areas to a substantially higher output brightness (relative to the mid-level point) within the display system’s capabilities, e.g., 6000 cd/m2 for the SIM2 HDR display used in our experiments.
In the dynamic range expansion operation, we initially constrained the maximum luminance intensity of the expanded luminance () to 4000 cd/m2. Considering the capabilities of the SIM2 HDR display, this leaves a margin of 2000 cd/m2 for additional highlight boosting. This approach ensures that highlights are enhanced in a way that maximizes the dynamic range and visual impact of the resulting HDR content, staying within the technical limits of the display device.
The highlight boosting step specifically targets the identification and enhancement of highlights, aiming to intensify them up to a luminance of 6000 cd/m2. To accomplish this, we proposed a novel method to identify and boost highlights. Our method utilizes an “expansion map”, which identifies the positions of highlights in the current LDR frame under consideration and specifies the extent of boosting required at each pixel.
The process begins by analyzing the artifact-free LDR input frame and its luminance channel to detect highlights and generate the expansion map. Initially, a “binary map” is created by selecting pixels from the artifact-free LDR input frame that are identified as highlights. In this binary map, a pixel value is set to 1 if it is determined to be a highlight and set to 0 if it is not. Given that the maximum pixel value for an LDR frame is 255, the decision to label a pixel as a highlight is guided by the following criteria:
- Pixels with a luminance value greater than 222. This threshold, as proposed in [44], is used to detect clipped areas considered highlights, which result from the constrained dynamic range of LDR content. Such clipped regions indicate areas where the detail might be lost due to brightness levels exceeding the display’s capability.
- Pixels in which any of the RGB channels exceed a value of 230. This criterion aids in pinpointing highlights characterized by color saturation. The utilization of this threshold, as suggested in the works detailed in [11,44,45], facilitates the identification of pixels associated with specular highlights and light sources demonstrating color saturation. This method leverages the presence of high intensity in at least one color channel to delineate highlights, a technique previously explored for highlight enhancement [46,47].
To compute the expansion map, we take advantage of the structure-transferring filtering property of the fast-guided filter, i.e., its capability to transfer structure information from the guidance image to the target image [38,48]. In our method, the binary map, which indicates the highlights, is filtered using the LDR luminance extracted from the artifact-free input LDR frame as the guidance image. This step ensures that the fine details and subtle gradients present in the original LDR luminance are effectively incorporated into the binary map, enhancing its accuracy and detail.
It is important to note that transferring details using the fast-guided filter requires different parameter settings compared to its use for denoising purposes. Through experimentation, we determined the optimal ranges for these parameters, specifically for frames with a resolution of pixels. Our results indicate that a local window radius (r) ranging between 100 and 200, combined with a regularization parameter () between and , produces expansion maps that successfully balance smoothness with detail retention. This balance is crucial for achieving a natural and visually pleasing enhancement of the highlights in the resulting HDR content.
The resulting expansion map yields values within the range of 0 to 1. A value of 0 indicates that the expanded luminance () at the current pixel location will remain unchanged, whereas a value of 1 indicates that it will be boosted up to 6000 cd/m2. Examples of binary maps and their corresponding expansion maps derived from two distinct LDR frames can be seen in Figure 6. As observed, fine details and smooth gradients in highlights found in the original image have been incorporated into the expansion map. Finally, the expansion map (M) is used to enhance the highlights present on the expanded luminance as follows:
where is the value of the HDR expanded luminance with “enhanced” highlights at , is the value in expansion map at , r is the peak luminance value added to the highlights (2000 cd/m2), and is a parameter to control how highlights will be boosted. An value greater than one () will make strong highlights more pronounced in the output, while values smaller than one () will make diffuse highlights more pronounced. The w and h values are the width and the height of .
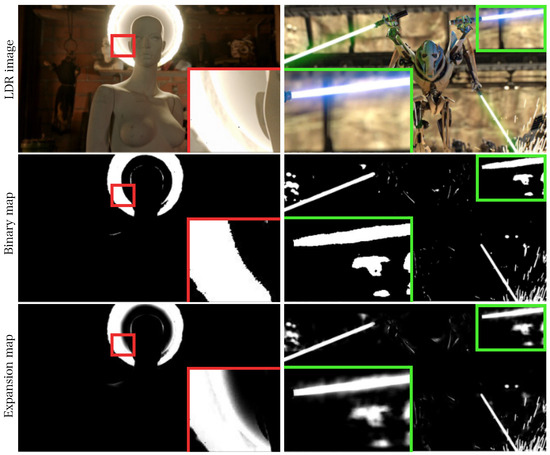
Figure 6.
Binary and expansion maps obtained from two different LDR images. The expansion map is used to enhance the highlights of the HDR expanded luminance (). (The image on the right was obtained from the movie “Star Wars: Episode III Revenge of the Sith”, property of Lucasfilm).
Figure 7 shows the results of highlight boosting. False-color images in a logarithmic scale have been included to facilitate the visualization of the results. We found that an value around 2.0 () is a good trade-off between giving more priority to boosting the strong highlights and suppressing the enhancement of diffuse lights.
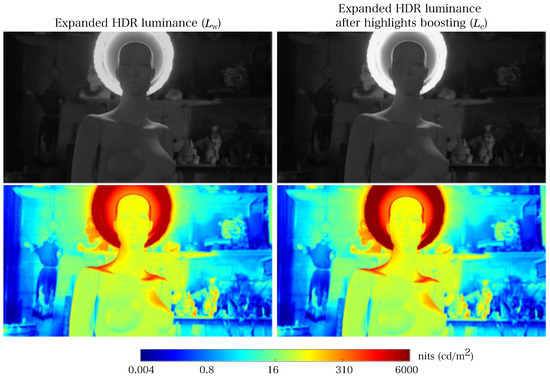
Figure 7.
Example of how highlights from the expanded luminance have been enhanced using expansion maps. False-color images are shown below each image for better visualization of the results.
3.5. Saturation Enhancement
The last step in our LDR-to-HDR conversion pipeline corresponds to the computation of the output HDR frame in color (tristimulus HDR RGB frame). For this purpose, Mantiuk’s formulation, as proposed in [49], was used as follows:
where and are the HDR expanded luminance with enhanced highlights obtained from the highlight boosting step and the luminance of the filtered LDR input frame at , respectively; is the color component of the filtered LDR input frame at and is the color component of the output HDR frame; r, g, and b are the red, green, and blue channels, respectively. Parameter s, the color saturation enhancement parameter, should be set to a value greater than 1 to increase color saturation in the output HDR frame.
The choice of Mantiuk’s formulation to compute the HDR RGB frame offers distinct benefits over alternatives like YUV color space-based approaches. It provides a robust method for adjusting the luminance of an image/frame in a manner that preserves the original color’s hue and saturation, which is critical for maintaining visual consistency in HDR imaging. Moreover, Mantiuk’s formulation incorporates a color saturation enhancement parameter, s, which offers additional control over the final image’s vibrancy, mitigating the common issue of desaturated colors that occurs when the luminance of an image is increased.
Following the methodology presented in [12], we conducted a subjective study to obtain the best subjective value for s across various scenes, each possessing distinct contrast and color characteristics. We aimed to investigate the correlation between the mid-level out parameter () used for the dynamic range expansion, considered as the scene-adaptive parameter, and the optimal saturation enhancement parameter (s).
We employed a dataset of 178 LDR images. The dynamic range of each LDR image was expanded using our proposed dynamic range expansion function, and the subsequent HDR color images were derived from Mantiuk’s formulation. In the experiment, a domain expert was tasked with identifying the optimal value for the saturation enhancement parameter s that generates an HDR color image that most faithfully captures the color characteristics of the original LDR image. The results of this experiment are summarized in Figure 8.
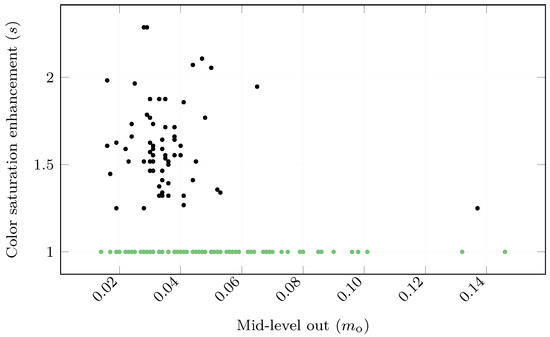
Figure 8.
Results of the experiment to investigate the most adequate color saturation enhancement parameter value (s) used in Mantiuk’s formulation. Each dot represents a particular scene. The horizontal axis shows the mid-level out parameter () decided by our proposed dynamic range expansion function for that scene. The vertical axis shows the color saturation value (s) an expert user selected as most desirable. Green dots indicate scenes where the expert deemed it unnecessary to increase saturation, while black dots are those where the expert preferred increased saturation.
Results revealed a weak correlation between the scene-specific mid-level out parameter (essentially, the nature of the scene) and the expert-chosen optimal value for s. Further statistical analysis and hands-on experimentation were conducted to corroborate this finding. Notably, in numerous instances, the expert deemed it unnecessary to increase the saturation (indicated by green dots in Figure 8). Conversely, in scenarios where the expert considers increasing the saturation (indicated by black dots), values between 1.2 and 2.3 were typically used. These results differ from that reported in [12], where the authors found that saturation values between 1.2 and 1.8 are commonly used. This can be explained mainly because our resulting HDR images have a peak brightness much higher (6000 cd/m2) than those in their experiments (1000 cd/m2). As a result, our HDR images tend to appear more desaturated, necessitating a higher increase in saturation to achieve a similar perceptual impact.
Our analysis determined that while the value of parameter s varies based on the nature of the input image, it cannot be reliably estimated using the mid-level out parameter. Thus, within our framework, a value ranging from 1.25 to 2.3 yielded satisfactory outcomes for most images across the datasets we evaluated.
4. Results and Evaluation
In this section, we evaluate the pipeline in terms of real-time operation capability and the quality of the HDR video output. First, we explain the implementation details of the pipeline and discuss the results from our real-time performance assessment. Then, we discuss the three experiments conducted to assess HDR video quality: (1) objective evaluation of LDR-to-HDR converted videos obtained from our pipeline and two state-of-the-art methods, (2) subjective evaluation of LDR-to-HDR converted videos obtained from our pipeline versus original LDR content, and (3) subjective evaluation of HDR-to-xHDR converted videos using an alternative application of our pipeline.
We implemented our entire pipeline in Quasar, a development environment designed to facilitate heterogeneous programming across both CPUs and GPUs [50,51]. Utilizing this environment enabled us to harness the GPU’s inherent parallel processing capabilities, resulting in a substantial acceleration of our processing speed, optimizing performance, and demonstrating the real-time capabilities of our approach.
We meticulously chose parameter values to optimize the time efficiency of our pipeline. Each pipeline step was fine-tuned with a dual objective in mind: achieving high-quality results while ensuring time efficiency. For instance, rather than processing the entire frame, we computed the image features used to estimate the middle-gray tone value for the dynamic range expansion operation () from a smaller region of interest (ROI). This approach not only sped up our pipeline but also avoided complications that might arise from video sequences containing vertical/horizontal stripes, advertisements, or captions. Likewise, we limited the number of iterations in the dequantization step to five and set the sub-sampling ratio for the fast-guided filters to four. The specific parameter values used in the experiments are detailed in Table 1.

Table 1.
Parameters values used in our testing.
4.1. Real-Time Capabilities
We conducted a series of experiments designed to assess the performance of our newly developed pipeline, specifically its ability to process video sequences in real-time. These evaluations were carried out on a desktop computer; its specifications are provided in Table 2. We analyzed three video sequences for this purpose, each with a duration of approximately 15 s, a resolution of pixels, and a frame rate of 25 fps. The focus of our investigation was on the processing times associated with various stages of our pipeline (EO: expansion operation, AS: artifact suppression, DQ: dequantization, and HB: highlight boosting), examining the impact of both activating and deactivating certain steps. Throughout these experiments, a total of 1175 frames were processed, and the timing outcomes are presented in Table 3. It is worth noting that these results do not account for the time taken to retrieve individual frames from the video file because this aspect is heavily influenced by I/O operations, storage medium speed, and other system-specific variables. These factors can vary significantly depending on the system setup and are not directly related to the performance of our processing pipeline. Therefore, to provide a clearer and more focused assessment of our pipeline’s efficiency, we isolated the computation time required by our algorithm from the overall I/O retrieval time. With an average processing time of 15.93 ms per frame, our approach theoretically has the capability to process video sequences with a resolution of pixels at a rate of up to 60 frames per second.

Table 2.
Specifications of the computer used for testing.

Table 3.
Frame timings of the different steps in our proposed processing pipeline.
4.2. LDR-to-HDR Conversion: Objective Evaluation
In our previous research presented in [13,31,32], we individually evaluated the two major components of our proposed pipeline: (i) the dynamic expansion method based on mid-level mapping and (ii) the false-contour removal method based on POCS. These assessments were conducted on static images. In this section, we shift our focus from static images to evaluating our inverse tone mapping pipeline on video sequences.
For this objective evaluation, we used video content from our in-house dataset called the “xDR Dataset”, which includes video sequences professionally captured and graded in HDR and LDR by the National Public-Service Broadcaster for the Flemish Region and Community of Belgium (VRT-Vlaamse Radio-en Televisieomroeporganisatie).
The xDR Dataset includes ten video sequences with a resolution of 1920 × 1080 at 25 frames per second. All sequences are color-graded in LDR and HDR. In particular, the HDR video sequences were natively color-graded using the SIM2 HDR47ES6MB display, which has a dynamic range of 17.5 stops and can reach a peak brightness of 6000 cd/m2. HDR video sequences were stored in absolute luminance format with peak values reaching up to 6000 cd/m2, making this dataset ideal for testing our pipeline. Figure 9 shows a preview of the video sequences in our test dataset, illustrating the variety of lighting conditions and contrast, ranging from deep shadows to extremely bright scenes. The xDR Dataset is publicly available at http://telin.ugent.be/~gluzardo/hdr-sdr-dataset/ (accessed on 19 April 2024).
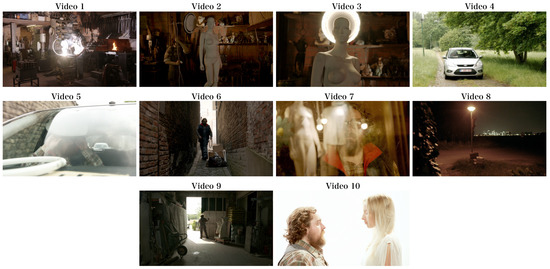
Figure 9.
A preview of video sequences utilized in the objective evaluation, obtained from the xDR Dataset.
The LDR sequences in the test dataset were used as input to compute the HDR video sequences. We compared the HDR videos obtained from our proposed pipeline against the HDR videos obtained from deep SR-ITM (joint learning of super-resolution and inverse tone-mapping for 4K UHD HDR applications) [15] and FMNet (frequency-aware modulation network for SDR-to-HDR translation) [20].
To assess the quality of the HDR videos produced by each method, we employed the high dynamic range video quality metric (HDRVQM) [52], which estimates the quality of an input video sequence from 0 to 1, with higher values indicating better quality. One score is generated per sequence based on a video sequence used as reference. HDRVQM involves spatio-temporal analysis, which looks at both the spatial (how things appear in each frame) and temporal (how things change over time) aspects of a video. HDRVQM also considers the human eye’s fixation behavior, considering where and how people tend to focus when watching videos and allowing this metric to better align with actual human perception.
We used HDRVQM to compare the HDR videos generated by each method (the “distorted” videos) against the ground truth HDR videos provided in the test dataset (the “reference” videos). HDRVQM was configured to match the format of the HDR files we were testing. Display parameters were set according to the specifications of the SIM2 HDR HDR47ES6MB display. Figure 10 shows the results from our objective assessment.
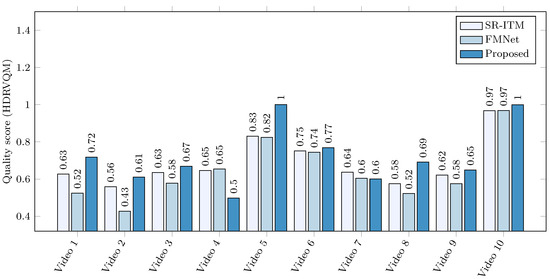
Figure 10.
Objective quality scores for HDR video sequences produced by our proposed pipeline and two state-of-the-art methods. Quality scores were obtained from the dynamic range video quality metric (HDRVQM) using the HDR ground truth from the test dataset as a reference. HDRVQM computes one quality score for the entire sequence. Higher values indicate better quality.
The results from the objective assessment indicate that our proposed pipeline generally outperforms other methods, with the exception of Video 4 and Video 7. In several cases, the performance of the other methods was comparable to our pipeline; we conducted a detailed analysis of Video 9 and Video 10 to better understand these two exceptions. Figure 11 illustrates a sample frame from these video sequences. We observed that the SR-ITM and FMNet methods tended to produce artifacts in highly saturated areas, reducing the overall quality of the video sequences. These artifacts became more pronounced when displayed on an HDR screen. However, as shown in the objective results, these issues are not reflected in the quality scores estimated by HDRVQM.
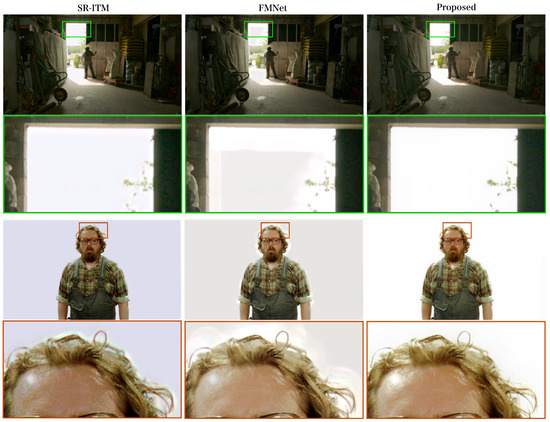
Figure 11.
Sample frames illustrating artifacts in highly saturated regions, with visible distortions generated by the SR-ITM and FMNet methods. These artifacts become more noticeable when the video sequences are displayed on the SIM2 HDR screen. Images have been tone-mapped for presentation.
4.3. LDR-to-HDR Conversion: Subjective Evaluation
As described in Section 2, many of the existing techniques in the literature for LDR-to-HDR conversion of video sequences do not reach the peak luminance reached by our pipeline. Moreover, as observed in our objective evaluation, these techniques often introduce temporal artifacts that affect the quality of their results, which is not accurately reflected in the objective quality score estimated by HDRVQM.
Therefore, we determined that an objective comparison of our proposed LDR-to-HDR pipeline against other inverse tone mapping techniques for video sequences would not yield accurate results. In addition, given that most other techniques do not produce HDR video sequences with the same peak brightness as ours, a side-by-side subjective evaluation may be biased and provide inconclusive results. Considering the subjectivity of brightness preferences, it is expected that an average observer would favor an artifact-free and high-contrast HDR video in a pairwise comparison experiment [53]. This assumption was supported by a preliminary experiment we conducted using the HDR images produced by SR-ITM and FMNet. Therefore, we decided to conduct a subjective evaluation study aimed at discerning whether our inverse tone mapping pipeline can enhance HDR video sequences beyond the quality of their LDR inputs.
In our previous work, as detailed in [54], we explored the benefits of employing inverse tone mapping versus a straightforward linear expansion of the dynamic range of LDR content when displayed on an HDR display. In this present study, we shift our focus to comparing the perceived quality of HDR video sequences generated from our proposed LDR-to-HDR pipeline to original LDR video sequences, which are also used as input to the LDR-to-HDR pipeline. Our primary objective was to evaluate whether there exists a clear improvement in quality when expanding the dynamic range of LDR content into HDR using our proposed LDR-to-HDR pipeline. To assess this, we employed a pairwise comparison method (PWC) in a subjective experiment to discern user preferences. In this evaluation approach, we simultaneously presented the original LDR video sequence alongside the HDR version produced by our pipeline, enabling observers to directly compare and select the one that most closely resembled a natural scene while exhibiting the least distortions, thereby indicating superior quality. This direct comparison methodology minimizes subjective variances among participants by simplifying the evaluation process. The evaluation task is simple and intuitive, making it more suitable for participants unfamiliar with image quality assessment tasks (non-expert observers) [55,56].
The experiment setup is shown in Figure 12. The experiment was conducted in a dimly lit room, maintaining ambient lighting of around 40 lux and viewing conditions according to the ITU-R BT.500-14 recommendation [57]. Both the LDR video sequence and its inverse tone-mapped HDR version were simultaneously presented side by side on the SIM2 HDR47ES6MB display. This 47-inch resolution display supports a peak luminance of up to 6000 cd/m2 and 17.5 stops of dynamic range. Due to the display’s resolution constraints, videos were cropped to fit half of the display, i.e., pixels, ensuring that salient objects remained centrally positioned. Furthermore, for enhanced visual separation of the two videos, a 30-pixel wide gray line was inserted between them.
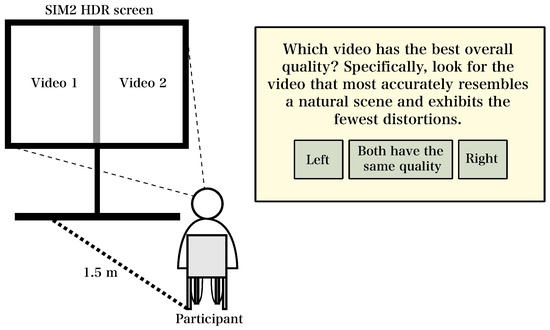
Figure 12.
The setup used for the evaluation of the proposed pipeline. The LDR and inverse tone-mapped HDR video sequences were randomly placed on the left (video 1) and on the right (video 2) on the HDR screen in each trial. LDR video sequences were linearized and adjusted to simulate the same appearance when it is displayed on an LDR screen with a limited peak brightness of 250 cd/m2.
The LDR video sequences were linearized and adjusted to emulate how they would appear on an LDR screen with peak brightness restricted to 250 cd/m2. For each trial in our experiment, participants were shown a pair of video sequences side by side: one representing the original LDR version and the other its HDR counterpart computed by our pipeline. These pairs were randomly arranged on the left half and right half of the screen.
Participants, seated 1.5 m away from the screen, were assigned the task of judging which video, left (Video 1) or right (Video 2), showed superior quality. The criteria for “superior quality” were defined by how closely the video resembled a natural scene and the minimal presence of artifacts. Participants could also indicate if they perceived both videos to have equal quality. This setup was intended to ensure an unbiased evaluation as the participants were not informed which video was the LDR version and which was the HDR version obtained using our pipeline.
Twenty-four short video sequences, each approximately 10 s in duration with a wide range of contrast and lighting conditions, were used in our subject study. These video sequences were obtained from publicly available video documentaries and trailers in LDR with a resolution of pixels and at 24 fps. We converted all the video sequences to HDR offline to prevent any delay when displaying the video sequences: delays could affect the quality of the video; therefore, the reliability of the experiment will be altered. The HDR frames were encoded and stored in a format that SIM2 uses to display linear HDR content. Figure 13 shows a preview of some of the video sequences used in our experiments.

Figure 13.
Preview of some video sequences employed in our LDR-to-HDR conversion evaluation experiment sourced from publicly accessible video documentaries and trailers. All video sequences have a resolution of pixels and 24 fps. (The original producers of the video sequences retain all rights pertaining to the frames shown in this figure).
Eight non-expert participants, aged between 17 and 42 with normal or corrected vision, took part in our subjective experiment. None had significant experience in professional video editing or color grading, ensuring the focus was on a general viewer’s perspective rather than a technical one. This age range was chosen to encompass a broad spectrum of perspectives, from younger participants who might be more tech-savvy to older participants with more traditional viewing habits.
Aware of the potential biases introduced by participant characteristics and experimental setup, measures were taken to mitigate these effects. The age range of participants was aimed at encompassing diverse preferences, and the inclusion of non-experts was aimed at capturing perspectives representative of a wider audience. The experiment enforced standardized viewing conditions in a dimly lit room for consistent visual environments. Stimuli were randomized among participants, and scenes were diversified in source and context. To prevent fatigue, the experiment was divided into two sessions.
The results of our subjective assessment, as illustrated in Figure 14, reveal a noteworthy trend in participants’ evaluations. Evidently, the HDR video sequences generated with our pipeline consistently garnered higher quality judgments compared to their corresponding LDR counterparts. This preference was particularly pronounced in scenes characterized by vibrant and high-contrast visuals featuring striking bright highlights. Participants consistently leaned towards HDR content in these scenarios, highlighting a preference for its enhanced visual richness and dynamic range.
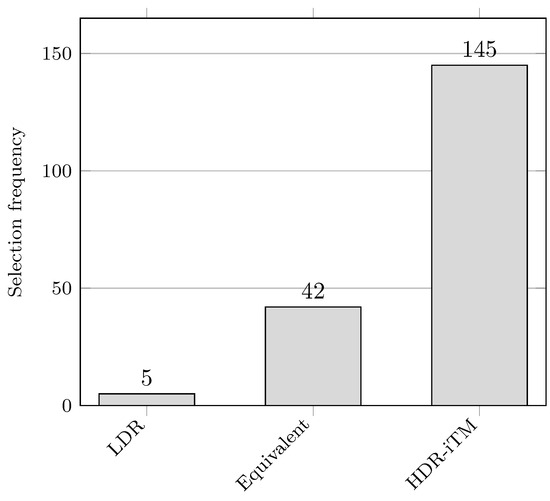
Figure 14.
Results of our subjective experiment, comparing user preferences for HDR images generated through our proposed pipeline against the LDR input video sequences. The vertical bars indicate the frequency of participants’ preferences, showing whether they favored one type of video sequence over the other or found both sequences to be of equal quality.
Conversely, our findings also suggest that participants tended to perceive both HDR and LDR video sequences as exhibiting similar quality when assessing scenes with lower light levels and reduced contrast, e.g., instances where dim lighting and a lack of distinct highlights prevailed. We also noticed that, in a few cases, participants selected the LDR version as the one with better quality. This observation underscores the idea that the advantages of HDR technology, such as a large luminance variation, were less apparent or less impactful in scenarios with limited visual dynamics. These results provide valuable insights into viewer preferences, showcasing a preference for HDR’s visual enhancements in specific contexts while highlighting the nuances of quality perception in specific lighting and contrast conditions.
4.4. HDR-to-xHDR Conversion
Our LDR-to-HDR pipeline distinguishes itself from other methods through its innovative capability to achieve higher peak brightness levels. This forward-thinking feature ensures that our pipeline remains adaptable to future HDR displays that may surpass current brightness standards. Leveraging our pipeline presents an opportunity to increase the brightness and, consequently, the dynamic range of current HDR content, typically restricted to a peak luminance of around 1000 cd/m2. This process, which effectively enhances standard HDR content to achieve significantly higher peak brightness, is what we refer to as “HDR to xHDR conversion” (xHDR: extended high dynamic range). This up-conversion process is a key technical novelty, enabling standard HDR content to reach substantially higher peak brightness levels, making it even more visually compelling and vibrant.
Figure 15 presents our proposed pipeline for the conversion of HDR video sequences into xHDR. This “modified” pipeline, in contrast to its predecessor, reduces the conversion process to three steps: dynamic range expansion, highlight boosting, and saturation enhancement. Given that HDR content generally exhibits fewer noise and artifacts compared to LDR content, we have deemed the denoising/artifact suppression step unnecessary for our purposes. Similarly, in a pilot test, we found that false contours were not an issue during our conversion. Therefore, we consider removing the false contours step, which, like denoising, appeared to be non-essential in HDR-to-xHDR conversion. By eliminating these unnecessary stages, we can significantly accelerate the processing speed of our pipeline without reducing the visual quality of the up-converted HDR content.
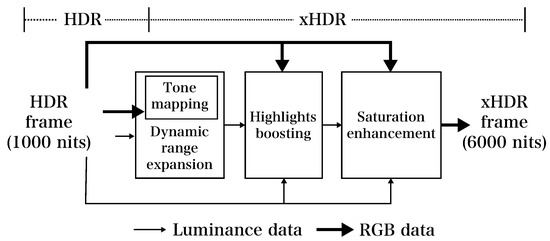
Figure 15.
Flowchart of the proposed pipeline for HDR-to-xHDR conversion. A 1000 cd/m2 HDR image is up-converted to extended high dynamic range (xHDR) with a peak luminance up to 6000 cd/m2.
A key aspect of our pipeline is the dynamic range expansion operation based on mid-level mapping, initially developed for LDR input frames, that involves two key steps: (i) fixing the mid-level in value () and (ii) estimating the mid-level out value () using image features.
In the pipeline’s initial design, was derived using image features extracted from the LDR input frame. However, as illustrated in Figure 15, our revised HDR-to-xHDR conversion method uses a different approach. We now use a tone-mapped version of the HDR input to compute these image features rather than computing them directly from the HDR input. This approach allows us to apply the same estimation formula outlined in Equation (4), developed through a multi-linear regression method, without requiring additional experimentation and training.
On the other hand, when setting for HDR-to-xHDR conversion, a seemingly obvious method might be to use the mid-level value typical for the HDR domain. Considering a maximum range of approximately 1000 cd/m2, this value typically lies between 100 and 200 cd/m2. However, applying a value between this range directly can lead to HDR images that look too bright. This problem occurs because our expansion operator, originally intended to increase brightness levels from approximately 250 cd/m2 to 4000 cd/m2, a significant increase, is now being used in a scenario where a much smaller increase in brightness is required. Consequently, using the same expansion ratio results in an overly intense increase in brightness.
To effectively tackle the issue of excessive brightness during the HDR-to-xHDR conversion, we refined our method for calculating . Our goal was to establish an equivalence for that is more aligned with the specific requirements of the HDR context. This adjustment ensures a more controlled and fitting increase in brightness during the conversion process. Therefore, we propose to compute the value of for HDR-to-xHDR conversion through the following formula:
where denotes the maximum luminance in an LDR video sequence, and represents the peak luminance value used in mastering the HDR video sequence being processed.
Since the highlight regions of HDR content are primarily located near the highest brightness levels [58,59], most of them are expanded to the highest luminance levels during the dynamic range expansion operation. Due to the limitations of peak brightness, some highlights have been compressed to the boundaries of the peak brightness, nearing saturation. Consequently, when converting HDR to xHDR, the highlight detection thresholds in the boosting step should differ from the original values used in LDR-to-HDR conversion. Specifically, they should be set closer to the maximum luminance value. This adjustment ensures the preservation of the original artistic intent regarding highlights, selectively enhancing the brightness only in those highlights presumed to be compressed due to peak brightness constraints in the original HDR content. Consequently, the highlight boosting step was modified in such a way that pixels are considered as highlights if their luminance value exceeds or any of their RGB channels has a value higher than , where represents the luminance level used in the HDR mastering obtained from the video metadata. Figure 16 shows examples of HDR frames alongside their corresponding expansion maps computed using this approach.
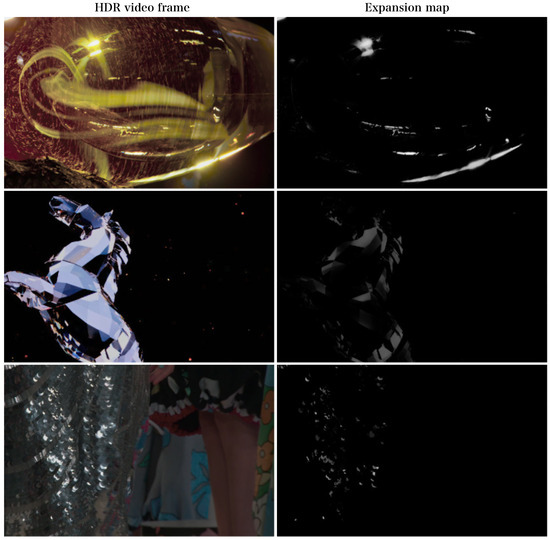
Figure 16.
HDR-to-xHDR conversion: Frames obtained from our test HDR video sequences and the expansion maps computed (on the right). The HDR images were tone-mapped for presentation.
4.5. HDR-to-xHDR Conversion: Subjective Evaluation
We conducted a subjective experiment to evaluate the effectiveness of our proposed HDR-to-xHDR pipeline. For this, we created a test dataset comprising 65 HDR videos. Each video has a resolution of pixels and a duration of approximately 10 s, featuring several frame rates ranging from 24 to 120 fps and peak luminance values used in mastering, spanning 1000 to 1400 cd/m2. Figure 17 provides previews of some of these short test video sequences utilized in our subjective evaluation.
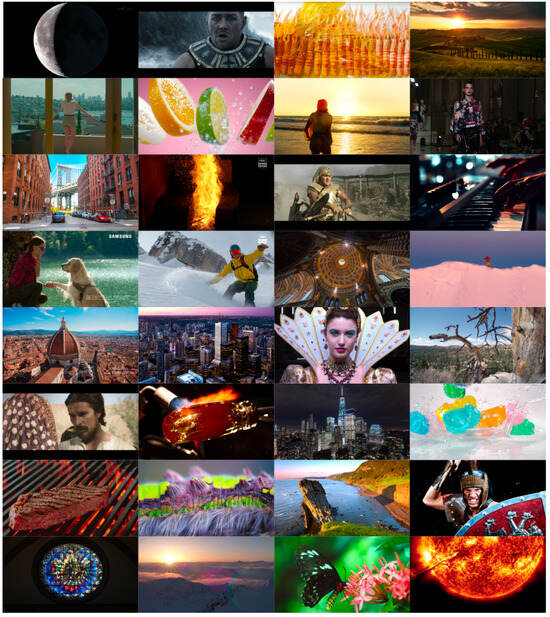
Figure 17.
Preview of some HDR video sequences employed in our HDR-to-xHDR conversion evaluation experiment, sourced from publicly available HDR video content. All video sequences were down-scaled to to fit the resolution of the HDR display used in our experiments. (The original producers of the video sequences retain all rights pertaining to the frames shown in this figure).
We extracted the frames from test video sequences and converted them into linear values within the Rec709 color space. This step ensured compatibility with the color space specifications of the SIM2 HDR display used in our experiments. Subsequently, we processed the HDR frames using our HDR-to-xHDR conversion pipeline.
In the dynamic range expansion step, the value was determined using Equation (4). The values of , C, and (image statistics) were computed using a tone-mapped version of the input HDR frame. For this, we employed the tone-mapping technique outlined in [60], specifically the photographic tone reproduction method for digital images. The value was set using Equation (7). We derived the value from the metadata in the HDR video sequence, noting that this value can vary across different HDR files. Regarding , typically, 100 cd/m2 is the maximum luminance value used in LDR video sequences. However, our expansion operator was trained on a dataset graded in LDR using a Grade 1 display designed specifically for the broadcast and cinema industries. These types of displays usually operate within a luminance range of 300 to 500 cd/m2, matching the specific requirements of the production environment and industry standards. Our experiments led us to the conclusion that setting the (maximum LDR luminance) values within this range in Equation (7) yielded the best results. Specifically, for our subjective experiment, we set the to 300 cd/m2. Table 4 outlines the parameters we used for processing the video sequences in our subjective experiment.

Table 4.
Parameter values used for HDR-to-xHDR conversion.
We replicated the setup and methodology employed in Section 4.3. The HDR and xHDR video sequences were cropped to pixels, keeping the main objects in the center, and presented side by side on the SIM2 HDR47ES6MB display. To ensure unbiased assessment, the placement of the video sequences was randomized for each trial. Each video was alternately positioned on the left half or right half of the screen. This strategy was employed to eliminate any bias that might arise from consistently positioning either the HDR or xHDR version in the same location. Additionally, a 30-pixel wide gray line was introduced between the two videos to provide a clear visual separation, aiding in the comparative analysis of the sequences.
Participants, seated 1.5 m from the screen, were asked to assess the quality of the video sequences. They were instructed to determine which one of the two, left or right, exhibited superior quality or to indicate if they appeared to be of equal quality. The criteria for superior quality were consistent with our previous subjective experiment presented in Section 4.3: a video was considered superior if it more closely resembled a natural scene and exhibited fewer artifacts.
Ten non-expert participants, aged between 21 and 65, were involved in our subjective experiment. The experiment was conducted in a dimly lit room, adhering to ITU-BT.500-14 recommendations. To minimize participant fatigue, we divided the experiment into three separate sessions. Figure 18 shows the results of our subjective experiment. To clarify the data representation in the graph, we assigned numerical values to each possible user selection: 0 for HDR, 1 for both (indicating no preference), and 2 for xHDR. This numerical representation was chosen to provide a clearer visualization of user preferences and their variability across different video sequences. The bars in the graph indicate the interquartile range to filter outliers in responses, while the diamond symbol (⋄) marks the average preference for each video sequence. Figure 19 displays the total selections, reflecting the participants’ overall preference for a video sequence type or their perception of equal quality in both sequences.
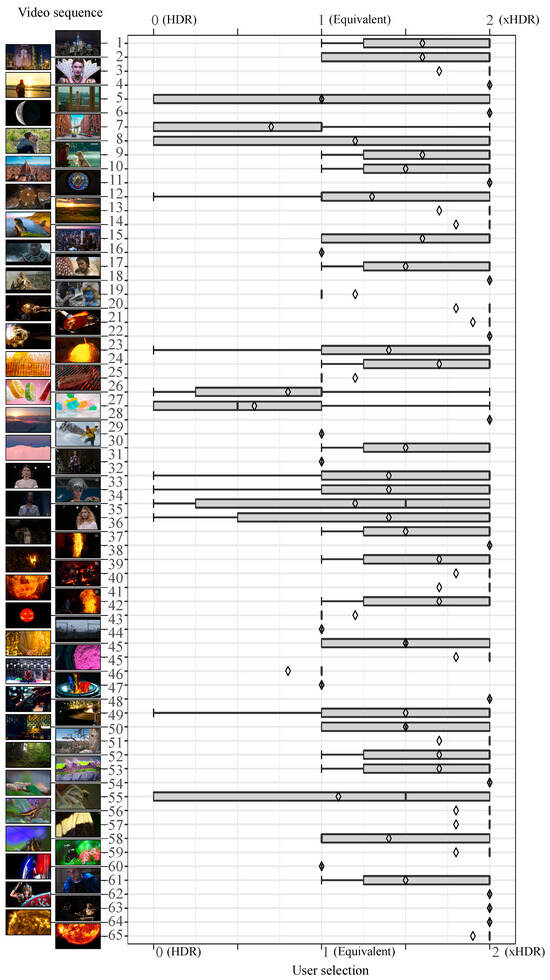
Figure 18.
Results of our subjective experiment with numerical data representation for clarity. User preferences are indicated as 0 for HDR, 1 for equivalent (no preference), and 2 for xHDR, facilitating an easier understanding of variability across video sequences. The graph’s bars depict the interquartile range employed to exclude potential outliers in user responses.
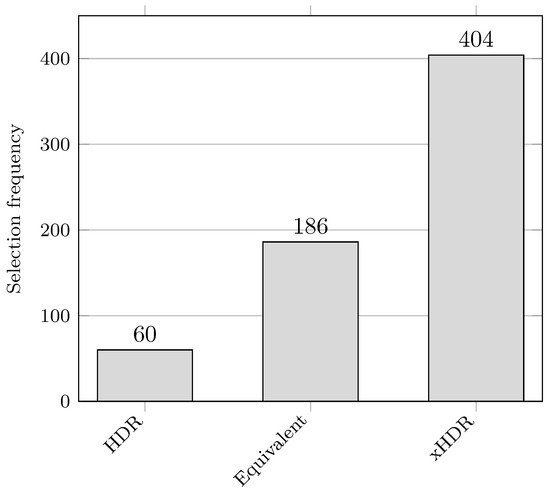
Figure 19.
Results of our subjective experiment, comparing user preferences for xHDR images generated through our proposed HDR to xHDR pipeline against the original HDR video sequences. The vertical bars indicate the frequency of participants’ preferences, showing whether they favored one type of video sequence over the other or found both sequences to be of equal quality.
The subjective assessment results highlight a distinct preference among users for xHDR video sequences generated through our HDR-to-xHDR conversion pipeline. Our key findings include the following:
- Among various video sequences tested, participants predominantly favored only four of the original HDR video sequences over our up-converted xHDR version, as demonstrated in Figure 18.
- A closer investigation into specific sequences where the HDR version was preferred revealed that the xHDR versions suffered from temporal artifacts. These artifacts primarily arose from the highlights boosting step, where the generation of unstable expansion masks over time led to inconsistent brightness levels in certain frames. This inconsistency resulted in a flickering effect in the final xHDR video sequences.
- Similar to previous findings (LDR-to-HDR conversion pipeline), we noted that users perceive similar quality between HDR and xHDR in certain video sequences. Specifically, in six video sequences, all participants unanimously agreed on the similar quality of both types of video sequences, i.e., the HDR and its xHDR version.
- Our previous findings contrast with our LDR-to-HDR pipeline, where similar quality perceptions were mostly confined to dark, low-contrast sequences. However, in the current assessment, not all sequences perceived as equal in quality were characterized by being dark and low contrast. In fact, we found that some dark sequences with high contrast were transformed into xHDR videos of comparable quality to their HDR counterparts. This outcome is likely due to the expansion operation’s dependence on features derived from a tone-mapped version of the HDR input, which can be a darker and lower-contrast version of the original image. Consequently, this results in an xHDR image with less brightness and contrast than expected, closely resembling the original HDR input.
5. Conclusions and Future Work
We have presented a comprehensive LDR-to-HDR pipeline for video sequences that incorporates several steps that effectively address common challenges in this field. Our proposed LDR-to-HDR pipeline can create HDR video sequences with 6000 cd/m2 of peak brightness. It incorporates inverse tone mapping, artifact suppression, and highlight enhancement while adapting to the peak brightness of different displays. The experimental results show the real-time capability of our proposed pipeline. In addition, results show its ability to consistently generate HDR video sequences of superior quality compared to the original LDR inputs.
Furthermore, our pipeline has the potential to significantly enhance the perceived quality of existing HDR content when increasing its peak brightness, especially relevant given that consumer-grade HDR content typically peaks at 1000 cd/m2. This makes our pipeline a valuable tool for elevating the quality of HDR content beyond the displays it was originally intended for, enabling the content to be enjoyed on displays capable of higher brightness levels.
While our pipeline usually results in video sequences perceived as higher quality than their inputs, further research is required. Future work will focus on refining the expansion mask estimation and ensuring its temporal stability to avoid temporal artifacts. Relative to other state-of-the-art methods, our pipeline demonstrates a promising capacity for brightness enhancement but requires refinement to effectively mitigate temporal artifacts produced during brightness enhancement.
In our HDR-to-xHDR pipeline, we aimed to explore how different tone-mapping operators impact output quality and to investigate methods to bypass the use of a tone-mapped image, directly working with the HDR input by recalibrating the middle-output value estimation. These questions will be the focus of our ongoing research efforts. In addition, further comparative studies with existing state-of-the-art methods will be essential to benchmark our pipeline’s performance, especially in terms of artifact presence and overall user satisfaction.
Author Contributions
This research was mainly conducted by G.L., A.K., J.A. and H.L. The research was supervised by W.P. and D.O. All authors have read and agreed to the published version of the manuscript.
Funding
The work of G. Luzardo was supported by Secretaría de Educación Superior, Ciencia, Tecnología e Innovación (SENESCYT) and Escuela Superior Politécnica del Litoral (ESPOL) under Ph.D. studies 2016. This work was supported by imec as part of the imec.ICON HD2R project.
Institutional Review Board Statement
Not applicable.
Informed Consent Statement
Not applicable.
Data Availability Statement
The xDR dataset used in this study is publicly available at http://telin.ugent.be/~gluzardo/hdr-sdr-dataset/ (accessed on 19 April 2024).
Acknowledgments
We would like to thank the National Public-Service Broadcaster for the Flemish Region and Community of Belgium (VRT), especially Sven Roseaux, for the support provided to create the video content that was used in training the dynamic range expansion operator within our pipeline.
Conflicts of Interest
The authors declare no conflicts of interest.
References
- Reinhard, E.; Heidrich, W.; Debevec, P.; Pattanaik, S.; Ward, G.; Myszkowski, K. High Dynamic Range Imaging: Acquisition, Display, and Image-Based Lighting; Morgan Kaufmann: San Francisco, CA, USA, 2010. [Google Scholar]
- Hatchett, J.; Toffoli, D.; Melo, M.; Bessa, M.; Debattista, K.; Chalmers, A. Displaying detail in bright environments: A 10,000 nit display and its evaluation. Signal Process. Image Commun. 2019, 76, 125–134. [Google Scholar] [CrossRef]
- Duan, L.; Debattista, K.; Yue, G.; Marnerides, D.; Chalmers, A. A genetic algorithm for backlight dimming for HDR displays. Vis. Comput. 2022, 39, 5437–5450. [Google Scholar] [CrossRef]
- Bender, V.C.; Marchesan, T.B.; Alonso, J.M. Solid-state lighting: A concise review of the state of the art on LED and OLED modeling. IEEE Ind. Electron. Mag. 2015, 9, 6–16. [Google Scholar] [CrossRef]
- Huang, Y.; Hsiang, E.L.; Deng, M.Y.; Wu, S.T. Mini-LED, Micro-LED and OLED displays: Present status and future perspectives. Light Sci. Appl. 2020, 9, 105. [Google Scholar] [CrossRef] [PubMed]
- Shin, H.J.; Choi, S.H.; Hong, S.H.; Lee, C.H.; Oh, D.H.; Bae, S.J.; Kim, T.S.; Song, H.S.; Kim, H.S.; Oh, C.H. 52-1: Invited Paper: Technical Progress of OLED Displays for Premium TVs. SID Symp. Dig. Tech. Pap. 2022, 53, 673–676. [Google Scholar] [CrossRef]
- Clark, C. Understanding High Dynamic Range (HDR) Imaging—A Cinematographer Perspective. 2018. Available online: https://cms-assets.theasc.com/curtis-clark-white-paper-on-hdr-asc.pdf?mtime=20180205102737 (accessed on 19 August 2021).
- Huo, Y.; Yang, F.; Dong, L.; Brost, V. Physiological inverse tone mapping based on retina response. Vis. Comput. 2014, 30, 507–517. [Google Scholar] [CrossRef]
- Wang, T.H.; Chiu, C.W.; Wu, W.C.; Wang, J.W.; Lin, C.Y.; Chiu, C.T.; Liou, J.J. Pseudo-multiple-exposure-based tone fusion with local region adjustment. IEEE Trans. Multimed. 2015, 17, 470–484. [Google Scholar] [CrossRef]
- Masia, B.; Serrano, A.; Gutierrez, D. Dynamic range expansion based on image statistics. Multimed. Tools Appl. 2017, 76, 631–648. [Google Scholar] [CrossRef]
- Kovaleski, R.P.; Oliveira, M.M. High-Quality Reverse Tone Mapping for a Wide Range of Exposures. In Proceedings of the 2014 27th SIBGRAPI Conference on Graphics, Patterns and Images, New York, NY, USA, 26–30 August 2014; pp. 49–56. [Google Scholar]
- Bist, C.; Cozot, R.; Madec, G.; Ducloux, X. Tone expansion using lighting style aesthetics. Comput. Graph. 2017, 62, 77–86. [Google Scholar] [CrossRef]
- Luzardo, G.; Aelterman, J.; Luong, H.; Rousseaux, S.; Ochoa, D.; Philips, W. Fully-automatic inverse tone mapping algorithm based on dynamic mid-level tone mapping. APSIPA Trans. Signal Inf. Process. 2020, 9, 1–15. [Google Scholar] [CrossRef]
- Mohammadi, P.; Pourazad, M.T.; Nasiopoulos, P. A Fully Automatic Content Adaptive Inverse Tone Mapping Operator with Improved Color Accuracy. IEEE Trans. Circuits Syst. Video Technol. 2020, 31, 4198–4213. [Google Scholar] [CrossRef]
- Kim, S.Y.; Oh, J.; Kim, M. Deep SR-ITM: Joint Learning of Super-resolution and Inverse Tone-Mapping for 4K UHD HDR Applications. In Proceedings of the IEEE International Conference on Computer Vision, New York, NY, USA, 15–17 June 2019; pp. 3116–3125. [Google Scholar]
- Kim, S.Y.; Oh, J.; Kim, M. Jsi-gan: Gan-based joint super-resolution and inverse tone-mapping with pixel-wise task-specific filters for uhd hdr video. In Proceedings of the AAAI Conference on Artificial Intelligence, Palo Alto, CA, USA, 7–12 February 2020; Volume 34, pp. 11287–11295. [Google Scholar]
- Chen, X.; Zhang, Z.; Ren, J.S.; Tian, L.; Qiao, Y.; Dong, C. A New Journey From SDRTV to HDRTV. In Proceedings of the IEEE/CVF International Conference on Computer Vision, New York, NY, USA, 11–17 October 2021; pp. 4500–4509. [Google Scholar]
- He, G.; Xu, K.; Xu, L.; Wu, C.; Sun, M.; Wen, X.; Tai, Y.W. SDRTV-to-HDRTV via hierarchical dynamic context feature mapping. In Proceedings of the 30th ACM International Conference on Multimedia, Lisboa, Portugal, 10–14 October 2022; pp. 2890–2898. [Google Scholar]
- Xu, K.; Xu, L.; He, G.; Wu, C.; Ma, Z.; Sun, M.; Tai, Y.W. SDRTV-to-HDRTV Conversion via Spatial-Temporal Feature Fusion. arXiv 2022, arXiv:2211.02297. [Google Scholar]
- Xu, G.; Hou, Q.; Zhang, L.; Cheng, M.M. FMNet: Frequency-Aware Modulation Network for SDR-to-HDR Translation. In Proceedings of the 30th ACM International Conference on Multimedia, MM’22, Lisboa, Portugal, 10–14 October 2022; pp. 6425–6435. [Google Scholar] [CrossRef]
- Yao, M.; He, D.; Li, X.; Pan, Z.; Xiong, Z. Bidirectional Translation Between UHD-HDR and HD-SDR Videos. IEEE Trans. Multimed. 2023, 1, 1–15. [Google Scholar] [CrossRef]
- Endo, Y.; Kanamori, Y.; Mitani, J. Deep Reverse Tone Mapping. ACM Trans. Graph. 2017, 36, 1–10. [Google Scholar] [CrossRef]
- Eilertsen, G.; Kronander, J.; Denes, G.; Mantiuk, R.K.; Unger, J. HDR image reconstruction from a single exposure using deep CNNs. ACM Trans. Graph. (TOG) 2017, 36, 178. [Google Scholar] [CrossRef]
- Marnerides, D.; Bashford-Rogers, T.; Hatchett, J.; Debattista, K. Expandnet: A deep convolutional neural network for high dynamic range expansion from low dynamic range content. Comput. Graph. Forum 2018, 37, 37–49. [Google Scholar] [CrossRef]
- Lee, S.; An, G.H.; Kang, S.J. Deep recursive hdri: Inverse tone mapping using generative adversarial networks. In Proceedings of the European Conference on Computer Vision (ECCV), New York, NY, USA, 8–14 September 2018; pp. 596–611. [Google Scholar]
- Liu, Y.L.; Lai, W.S.; Chen, Y.S.; Kao, Y.L.; Yang, M.H.; Chuang, Y.Y.; Huang, J.B. Single-image HDR reconstruction by learning to reverse the camera pipeline. In Proceedings of the IEEE/CVF Conference on Computer Vision and Pattern Recognition, Seattle, WA, USA, 13–19 June 2020; pp. 1651–1660. [Google Scholar]
- Santos, M.S.; Ren, T.I.; Kalantari, N.K. Single image HDR reconstruction using a CNN with masked features and perceptual loss. ACM Trans. Graph. (TOG) 2020, 39, 80:1–80:10. [Google Scholar] [CrossRef]
- Marnerides, D.; Bashford-Rogers, T.; Debattista, K. Deep HDR Hallucination for Inverse Tone Mapping. Sensors 2021, 21, 4032. [Google Scholar] [CrossRef] [PubMed]
- Guo, C.; Jiang, X. LHDR: HDR Reconstruction for Legacy Content using a Lightweight DNN. In Proceedings of the Asian Conference on Computer Vision, Macao, China, 4–8 December 2022; pp. 3155–3171. [Google Scholar]
- Lee, M.J.; Rhee, C.h.; Lee, C.H. HSVNet: Reconstructing HDR Image from a Single Exposure LDR Image with CNN. Appl. Sci. 2022, 12, 2370. [Google Scholar] [CrossRef]
- Luzardo, G.; Aelterman, J.; Luong, H.; Philips, W.; Ochoa, D. Real-Time False-Contours Removal for Inverse Tone Mapped HDR Content. In Proceedings of the 2017 ACM on Multimedia Conference, MM’17, Mountain View, CA, USA, 23–27 October 2017; pp. 1472–1479. [Google Scholar] [CrossRef]
- Luzardo, G.; Aelterman, J.; Luong, H.; Philips, W.; Ochoa, D.; Rousseaux, S. Fully-Automatic Inverse Tone Mapping Preserving the Content Creator’s Artistic Intentions. In Proceedings of the 2018 Picture Coding Symposium (PCS), San Francisco, CA, USA, 24–27 June 2018; IEEE: Piscataway, NJ, USA, 2018; pp. 199–203. [Google Scholar]
- Chen, X.; Li, Z.; Zhang, Z.; Ren, J.S.; Liu, Y.; He, J.; Qiao, Y.; Zhou, J.; Dong, C. Towards Efficient SDRTV-to-HDRTV by Learning from Image Formation. arXiv 2023, arXiv:2309.04084. [Google Scholar]
- He, G.; Long, S.; Xu, L.; Wu, C.; Yu, W.; Zhou, J. Global priors guided modulation network for joint super-resolution and SDRTV-to-HDRTV. Neurocomputing 2023, 554, 126590. [Google Scholar] [CrossRef]
- Guo, C.; Fan, L.; Xue, Z.; Jiang, X. Learning a Practical SDR-to-HDRTV Up-conversion using New Dataset and Degradation Models. In Proceedings of the IEEE/CVF Conference on Computer Vision and Pattern Recognition, Vancouver, BC, Canada, 17–24 June 2023; pp. 22231–22241. [Google Scholar]
- Goyal, B.; Dogra, A.; Agrawal, S.; Sohi, B.S.; Sharma, A. Image denoising review: From classical to state-of-the-art approaches. Inf. Fusion 2020, 55, 220–244. [Google Scholar] [CrossRef]
- Sun, M.; He, X.; Xiong, S.; Ren, C.; Li, X. Reduction of JPEG compression artifacts based on DCT coefficients prediction. Neurocomputing 2020, 384, 335–345. [Google Scholar] [CrossRef]
- He, K.; Sun, J. Fast guided filter. arXiv 2015, arXiv:1505.00996. [Google Scholar]
- He, K.; Sun, J.; Tang, X. Guided image filtering. In Proceedings of the European Conference on Computer Vision, Heraklion, Greece, 5–11 September 2010; Springer: Berlin/Heidelberg, Germany, 2010; pp. 1–14. [Google Scholar]
- Bukreeva, I.; Ingacheva, A.; Fratini, M.; Cedola, A.; Junemann, O.; Longo, E.; Wilde, F.; Moosmann, J.; Buzmakov, A.; Krivonosov, Y.; et al. Artifacts suppression in biomedical images using a guided filter. In Proceedings of the Thirteenth International Conference on Machine Vision, Shenzhen, China, 26 February–1 March 2021; Osten, W., Nikolaev, D.P., Zhou, J., Eds.; International Society for Optics and Photonics, SPIE: Bellingham, WA, USA, 2021; Volume 11605, pp. 216–223. [Google Scholar] [CrossRef]
- Hao, H.; Liu, M.; Xiong, P.; Du, H.; Zhang, H.; Lin, F.; Hou, Z.; Liu, X. Multi-lead model-based ECG signal denoising by guided filter. Eng. Appl. Artif. Intell. 2019, 79, 34–44. [Google Scholar] [CrossRef]
- Majeeth, S.S.; Babu, C.N.K. Gaussian noise removal in an image using fast guided filter and its method noise thresholding in medical healthcare application. J. Med. Syst. 2019, 43, 280. [Google Scholar] [CrossRef] [PubMed]
- Lottes, T. Advanced Techniques and Optimization of HDR Color Pipelines. In Proceedings of the Game Developer Conference 2016, San Francisco, CA, USA, 14–18 March 2016. [Google Scholar]
- Didyk, P.; Mantiuk, R.; Hein, M.; Seidel, H.P. Enhancement of bright video features for HDR displays. Comput. Graph. Forum 2008, 27, 1265–1274. [Google Scholar] [CrossRef]
- Rempel, A.G.; Trentacoste, M.; Seetzen, H.; Young, H.D.; Heidrich, W.; Whitehead, L.; Ward, G. Ldr2hdr: On-the-fly reverse tone mapping of legacy video and photographs. ACM Trans. Graph. (TOG) 2007, 26, 39–es. [Google Scholar] [CrossRef]
- Youseph, S.N.; Cherian, R.R. Pixel and edge based illuminant color estimation for image forgery detection. Procedia Comput. Sci. 2015, 46, 1635–1642. [Google Scholar] [CrossRef][Green Version]
- Stojkovic, A.; Aelterman, J.; Luong, H.; Van Parys, H.; Philips, W. Highlights Analysis System (HAnS) for Low Dynamic Range to High Dynamic Range Conversion of Cinematic Low Dynamic Range Content. IEEE Access 2021, 9, 43938–43969. [Google Scholar] [CrossRef]
- He, K.; Sun, J.; Tang, X. Guided image filtering. IEEE Trans. Pattern Anal. Mach. Intell. 2012, 35, 1397–1409. [Google Scholar] [CrossRef] [PubMed]
- Mantiuk, R.; Tomaszewska, A.; Heidrich, W. Color correction for tone mapping. Comput. Graph. Forum 2009, 28, 193–202. [Google Scholar] [CrossRef]
- Goossens, B.; De Vylder, J.; Philips, W. Quasar—A new heterogeneous programming framework for image and video processing algorithms on CPU and GPU. In Proceedings of the 2014 IEEE International Conference on Image Processing (ICIP), Paris, France, 27–30 October 2014; IEEE: Piscataway, NJ, USA, 2014; pp. 2183–2185. [Google Scholar]
- Goossens, B.; Luong, H.; Aelterman, J.; Philips, W. Quasar, a high-level programming language and development environment for designing smart vision systems on embedded platforms. In Proceedings of the 2018 Design, Automation & Test in Europe Conference & Exhibition (DATE), Dresden, Germany, 19–23 March 2018; IEEE: Piscataway, NJ, USA, 2018; pp. 1310–1315. [Google Scholar]
- Narwaria, M.; Da Silva, M.P.; Le Callet, P. HDR-VQM: An objective quality measure for high dynamic range video. Signal Process. Image Commun. 2015, 35, 46–60. [Google Scholar] [CrossRef]
- Bist, C.; Cozot, R.; Madec, G.; Ducloux, X. QoE-based brightness control for HDR displays. In Proceedings of the 2017 Ninth International Conference on Quality of Multimedia Experience (QoMEX), Erfurt, Germany, 31 May–2 June 2017; IEEE: Piscataway, NJ, USA, 2017; pp. 1–6. [Google Scholar]
- Luzardo, G.; Vyvey, T.; Aelterman, J.; Paridaens, T.; Van Wallendael, G.; Lambert, P.; Rousseaux, S.; Luong, H.; Durnez, W.; Van Looy, J.; et al. An Experimental Study on the Perceived Quality of Natively Graded versus Inverse Tone Mapped High Dynamic Range Video Content on Televisios. Multimed. Tools Appl. 2020, 80, 5559–5576. [Google Scholar] [CrossRef]
- Pérez-Ortiz, M.; Mantiuk, R.K. A practical guide and software for analysing pairwise comparison experiments. arXiv 2017, arXiv:1712.03686. [Google Scholar]
- Zerman, E.; Hulusic, V.; Valenzise, G.; Mantiuk, R.K.; Dufaux, F. The relation between MOS and pairwise comparisons and the importance of cross-content comparisons. Electron. Imaging 2018, 2018, 1–6. [Google Scholar] [CrossRef]
- ITU. Methodology for the Subjective Assessment of the Quality of Television Images—ITU-R BT.500-14. 2019. Available online: https://www.itu.int/rec/R-REC-BT.500-14-201910-S (accessed on 29 July 2022).
- Wolff, L.B. Relative brightness of specular and diffuse reflection. Opt. Eng. 1994, 33, 285–293. [Google Scholar] [CrossRef]
- ITU. High Dynamic Range Television for Production and International Programme Exchange—Report ITU-R BT.2390-11. 2023. Available online: https://www.itu.int/dms_pub/itu-r/opb/rep/R-REP-BT.2390-11-2023-PDF-E.pdf (accessed on 18 November 2023).
- Reinhard, E.; Stark, M.; Shirley, P.; Ferwerda, J. Photographic tone reproduction for digital images. Semin. Graph. Pap. Push. Boundaries 2023, 2, 661–670. [Google Scholar]
Disclaimer/Publisher’s Note: The statements, opinions and data contained in all publications are solely those of the individual author(s) and contributor(s) and not of MDPI and/or the editor(s). MDPI and/or the editor(s) disclaim responsibility for any injury to people or property resulting from any ideas, methods, instructions or products referred to in the content. |
© 2024 by the authors. Licensee MDPI, Basel, Switzerland. This article is an open access article distributed under the terms and conditions of the Creative Commons Attribution (CC BY) license (https://creativecommons.org/licenses/by/4.0/).