Article

Determination of the Probabilistic Properties of the Critical Fracture Energy of Concrete Integrating Scale Effect Aspects

by
Mariane Rodrigues Rita
,
Pierre Rossi
*,
Eduardo de Moraes Rego Fairbairn
and
Fernando Luiz Bastos Ribeiro
Civil Engineering Program, Universidade Federal do Rio de Janeiro (UFRJ), Av. Horácio Macedo, 2030, Cidade Universitária, Rio de Janeiro 21941-598, Brazil
*
Author to whom correspondence should be addressed.
Appl. Sci. 2024, 14(1), 462; https://doi.org/10.3390/app14010462
Submission received: 4 December 2023 / Revised: 23 December 2023 / Accepted: 28 December 2023 / Published: 4 January 2024
(This article belongs to the Special Issue Advanced Finite Element Method and Its Applications)

Abstract

:
This paper presents an extension of the validation domain of a previously validated three-dimensional probabilistic semi-explicit cracking numerical model, which was initially validated for a specific concrete mix design. This model is implemented in a finite element code. The primary objective of this study is to propose a function that enables the estimation of the critical fracture energy parameter utilized in the model and validate its effectiveness for various concrete mix designs. The model focuses on macrocrack propagation and introduces significant aspects such as employing volume elements for simulating macrocrack propagation and incorporating two key factors in governing its behavior. Firstly, macrocrack initiation is linked to the uniaxial tensile strength ( f t ) . Secondly, macrocrack propagation is influenced by a post-cracking dissipation energy in tension. This energy is taken equal to the mode I critical fracture energy ( G I C ) based on the linear elastic fracture mechanics theory. Importantly, both f t and G I C are probabilistic properties influenced by the volume of concrete under consideration. Consequently, in the numerical model, they are dependent on the volume of the finite elements employed. To achieve this objective, numerical simulations of fracture mechanical tests are conducted on a large double cantilever beam specimen. Through these simulations, we validate the proposed function, which is a crucial step towards expanding the model’s applicability to all concrete mix designs.

1. Introduction

Concrete, commonly treated as homogeneous in macroscopic numerical models for simplicity, is inherently heterogeneous. Inner defects arise from cement paste hydration and restrained shrinkages, causing cracks even before external loads are applied. Given the inherent formation of cracks, modeling their initiation and propagation presents a critical challenge in predicting concrete behavior. The importance of crack formation has instigated a variety of studies, resulting in diverse constitutive models. Techniques for simulating the cracking process in concrete structures fall into two broad approaches, implicitly or explicitly addressing kinematic discontinuity, resulting in continuum or discrete models.
In continuum models, cracks are implicitly represented, and the failure process is considered by the degradation of material stiffness, altering its constitutive equation. Some models in this field are damaged models [1,2], the smeared crack model [3,4], and the plasticity model [5]. Conversely, in discrete cracking models, cracks are explicitly treated as geometrical entities, manifesting as discontinuities of displacement at interfaces between finite elements or integrated into the finite element formulation. Some discrete models are the cohesive crack model or fictitious crack model [6,7], extended finite element method (XFEM) [8], embedded finite element method (EFEM) [9] and lattice models [10].
Additionally, probabilistic models address the significant scale effect in concrete structure cracking by employing random distribution functions of material properties to explicitly consider concrete heterogeneity. In this work, a semi-explicit probabilistic cracking numerical model, based on the finite element approach, developed and validated in previous studies [11,12], is employed. This model specifically focuses on the macrocrack propagation problem, incorporating several crucial characteristics.
One significant feature of the model is its representation of macrocrack propagation using volume elements, which offers a realistic portrayal of the phenomenon. The model employs two criteria governing macrocrack propagation, as follows: (1) macrocrack initiation is linked to the uniaxial tensile strength, f t and (2) macrocrack propagation is influenced by post-cracking dissipation energy in tension. The complete propagation of the macrocrack occurs when all post-cracking dissipation energy has been consumed.
The evolution of post-cracking dissipation is governed by a simple damage approach. A distinctive aspect of the model’s damage approach is that the post-cracking dissipation energy is derived from linear elastic fracture mechanics (LEFM), specifically utilizing the mode I critical fracture energy, referred to as G I C . Both f t and G I C are probabilistic mechanical characteristics that depend on the size of the mesh elements. While the mean value of G I C is considered an intrinsic characteristic of concrete independent of the mesh element size, its standard deviation is influenced by the size effects.
This probabilistic semi-explicit cracking model differs significantly from classical smeared crack or damage models [1,2,4,13,14,15,16,17,18,19,20]. Indeed, physically speaking, these diffused crack models, which are deterministic, consider that, for each loading level, an equivalence exists between a microcracking evolution (represented by a certain dissipation of energy) and a localized crack creation.
Previous experimental and numerical studies [21,22,23,24] have successfully determined and validated the probabilistic properties of f t (mean and standard deviation values) for concretes with a compressive strength of up to 130 MPa, depending on the size of the mesh elements. However, acquiring equivalent information regarding G I C has proven to be a challenge. This critical parameter, which is directly linked to concrete’s crack resistance [25], poses complexity in accurate estimation within brittle heterogeneous materials due to their nonlinear behavior. This complexity is evident due to the substantial fracture process zone, whose size is considerably large compared with the specimen’s dimensions and resulting in the manifestation of the size effect [26]. Consequently, deriving an accurate value of G I C , for concrete, unaffected by these factors is demanding. Typically defined as the energy consumption during crack propagation in an infinite specimen, obtaining a size-independent assessment necessitates tests on specimens substantially larger than the fracture process zone size [27,28].
Therefore, the primary objective of this paper is to determine the probabilistic properties of G I C based on the size of the mesh elements. By addressing this knowledge gap, this research aims to contribute to a comprehensive understanding of the probabilistic properties of G I C in relation to macrocrack propagation in concrete. The findings obtained from this study provide a substantial contribution to the field of concrete structure modeling.

2. Determination of the Probabilistic Properties of G IC

In previous research [12], the standard deviation of G I C was determined using an inverse analysis for a specific concrete mix design, where the mean value of G I C was known. To further investigate the probabilistic properties of G I C , an analytical relation was proposed to establish a connection between the standard deviation, σ , of G I C , and the degree of heterogeneity of the mesh element. In this work, the degree of heterogeneity, r e , is defined as follows:
r e = V e / V a ,
where V a is the volume of the largest aggregate size present in the concrete, and V e denotes the volume of the mesh element. The analytical relation proposed to establish this connection between σ and r e is as follows:
σ ( G I C ) = ( A ln ( r e ) + B ) × μ ( G I C ) ,
where A = 8.538 ; B = 70.88 and μ ( G I C ) is the mean value of G I C .
The relation described in Equation (2) has been proposed specifically for G I C = 1.25 × 10 4 MN/m and for the size of the largest aggregate equal to 12 mm (in terms of diameter). These concrete parameters were derived from experimental research, which enabled the determination of the intrinsic value of G I C [29,30]. It is crucial to note that in the model, the volume of finite elements must exceed the largest aggregate volume.
Based on Equation (2), it is natural to propose the following relation for the coefficient of variation of G I C :
σ ( G I C ) μ ( G I C ) = ( A ln ( r e ) + B ) ,
It is crucial to note that the use of Equation (2) does not lead to the determination of intrinsic values of σ ( G I C ) . These values are inherently linked to the specific mechanical model proposed and the chosen type of finite elements, such as linear elements in the present case. Consequently, Equation (2) cannot be indistinctively applied within the framework of other mechanical models.
From Equation (3), it can be observed that the coefficient of variation of G I C becomes negligible when the degree of heterogeneity ( r e ) reaches a value of 4000. Notably, it is important to reiterate that as G I C is an intrinsic material property and, being size-effect independent, it is not dependent on the r e in terms of its mean value.
In previous research [29], focusing on the probabilistic properties of f t , which is dependent of the material heterogeneity degree and, therefore, can be expressed as f t ( r e ) ; Equations (4) and (6) were proposed to evaluate the mean value, μ ( f t ( r e ) ) , and coefficient of variation, σ μ ( f t ( r e ) ) , respectively.
μ ( f t ( r e ) ) = a ( r e ) y ,
in Equation (4), a = 6.5 MPa and y is provided by Equation (5), where f c represents the concrete compressive strength in MPa and α = 1 MPa.
y = 0.25 3.6 × 10 3 f c α + 1.3 × 10 5 f c α 2 ,
σ μ ( f t ( r e ) ) = c ( r e ) d ,
in Equation (6), c = 0.35 and d are provided by Equation (7), as follows:
d = 4.5 × 10 2 + 4.5 × 10 3 f c α 1.8 × 10 5 f c α 2 ,
The validity of Equations (4)–(7) has been confirmed for concrete with a compressive strength of f c 130 MPa and a maximum aggregate size of 10 mm or larger. Consequently, by establishing a correlation between Equations (3) and (7) and Equations (4)–(7), it is feasible to estimate the coefficient of variation of G I C as a function of r e for concrete that satisfy the aforementioned criteria.
This estimation can be accomplished by establishing an expression through algebraic manipulation using Equations (3)–(7). Based on this procedure, considering the same heterogeneity degree associated with the coefficient of variation of tensile strength and critical fracture energy, Equation (8) is proposed. The deduction of this equation is presented as a Supplementary Material.
σ μ ( G I C ( r e ) ) = A 1 d ln c μ ( f t ( r e ) σ ( f t ( r e ) + B A ,

3. Validation

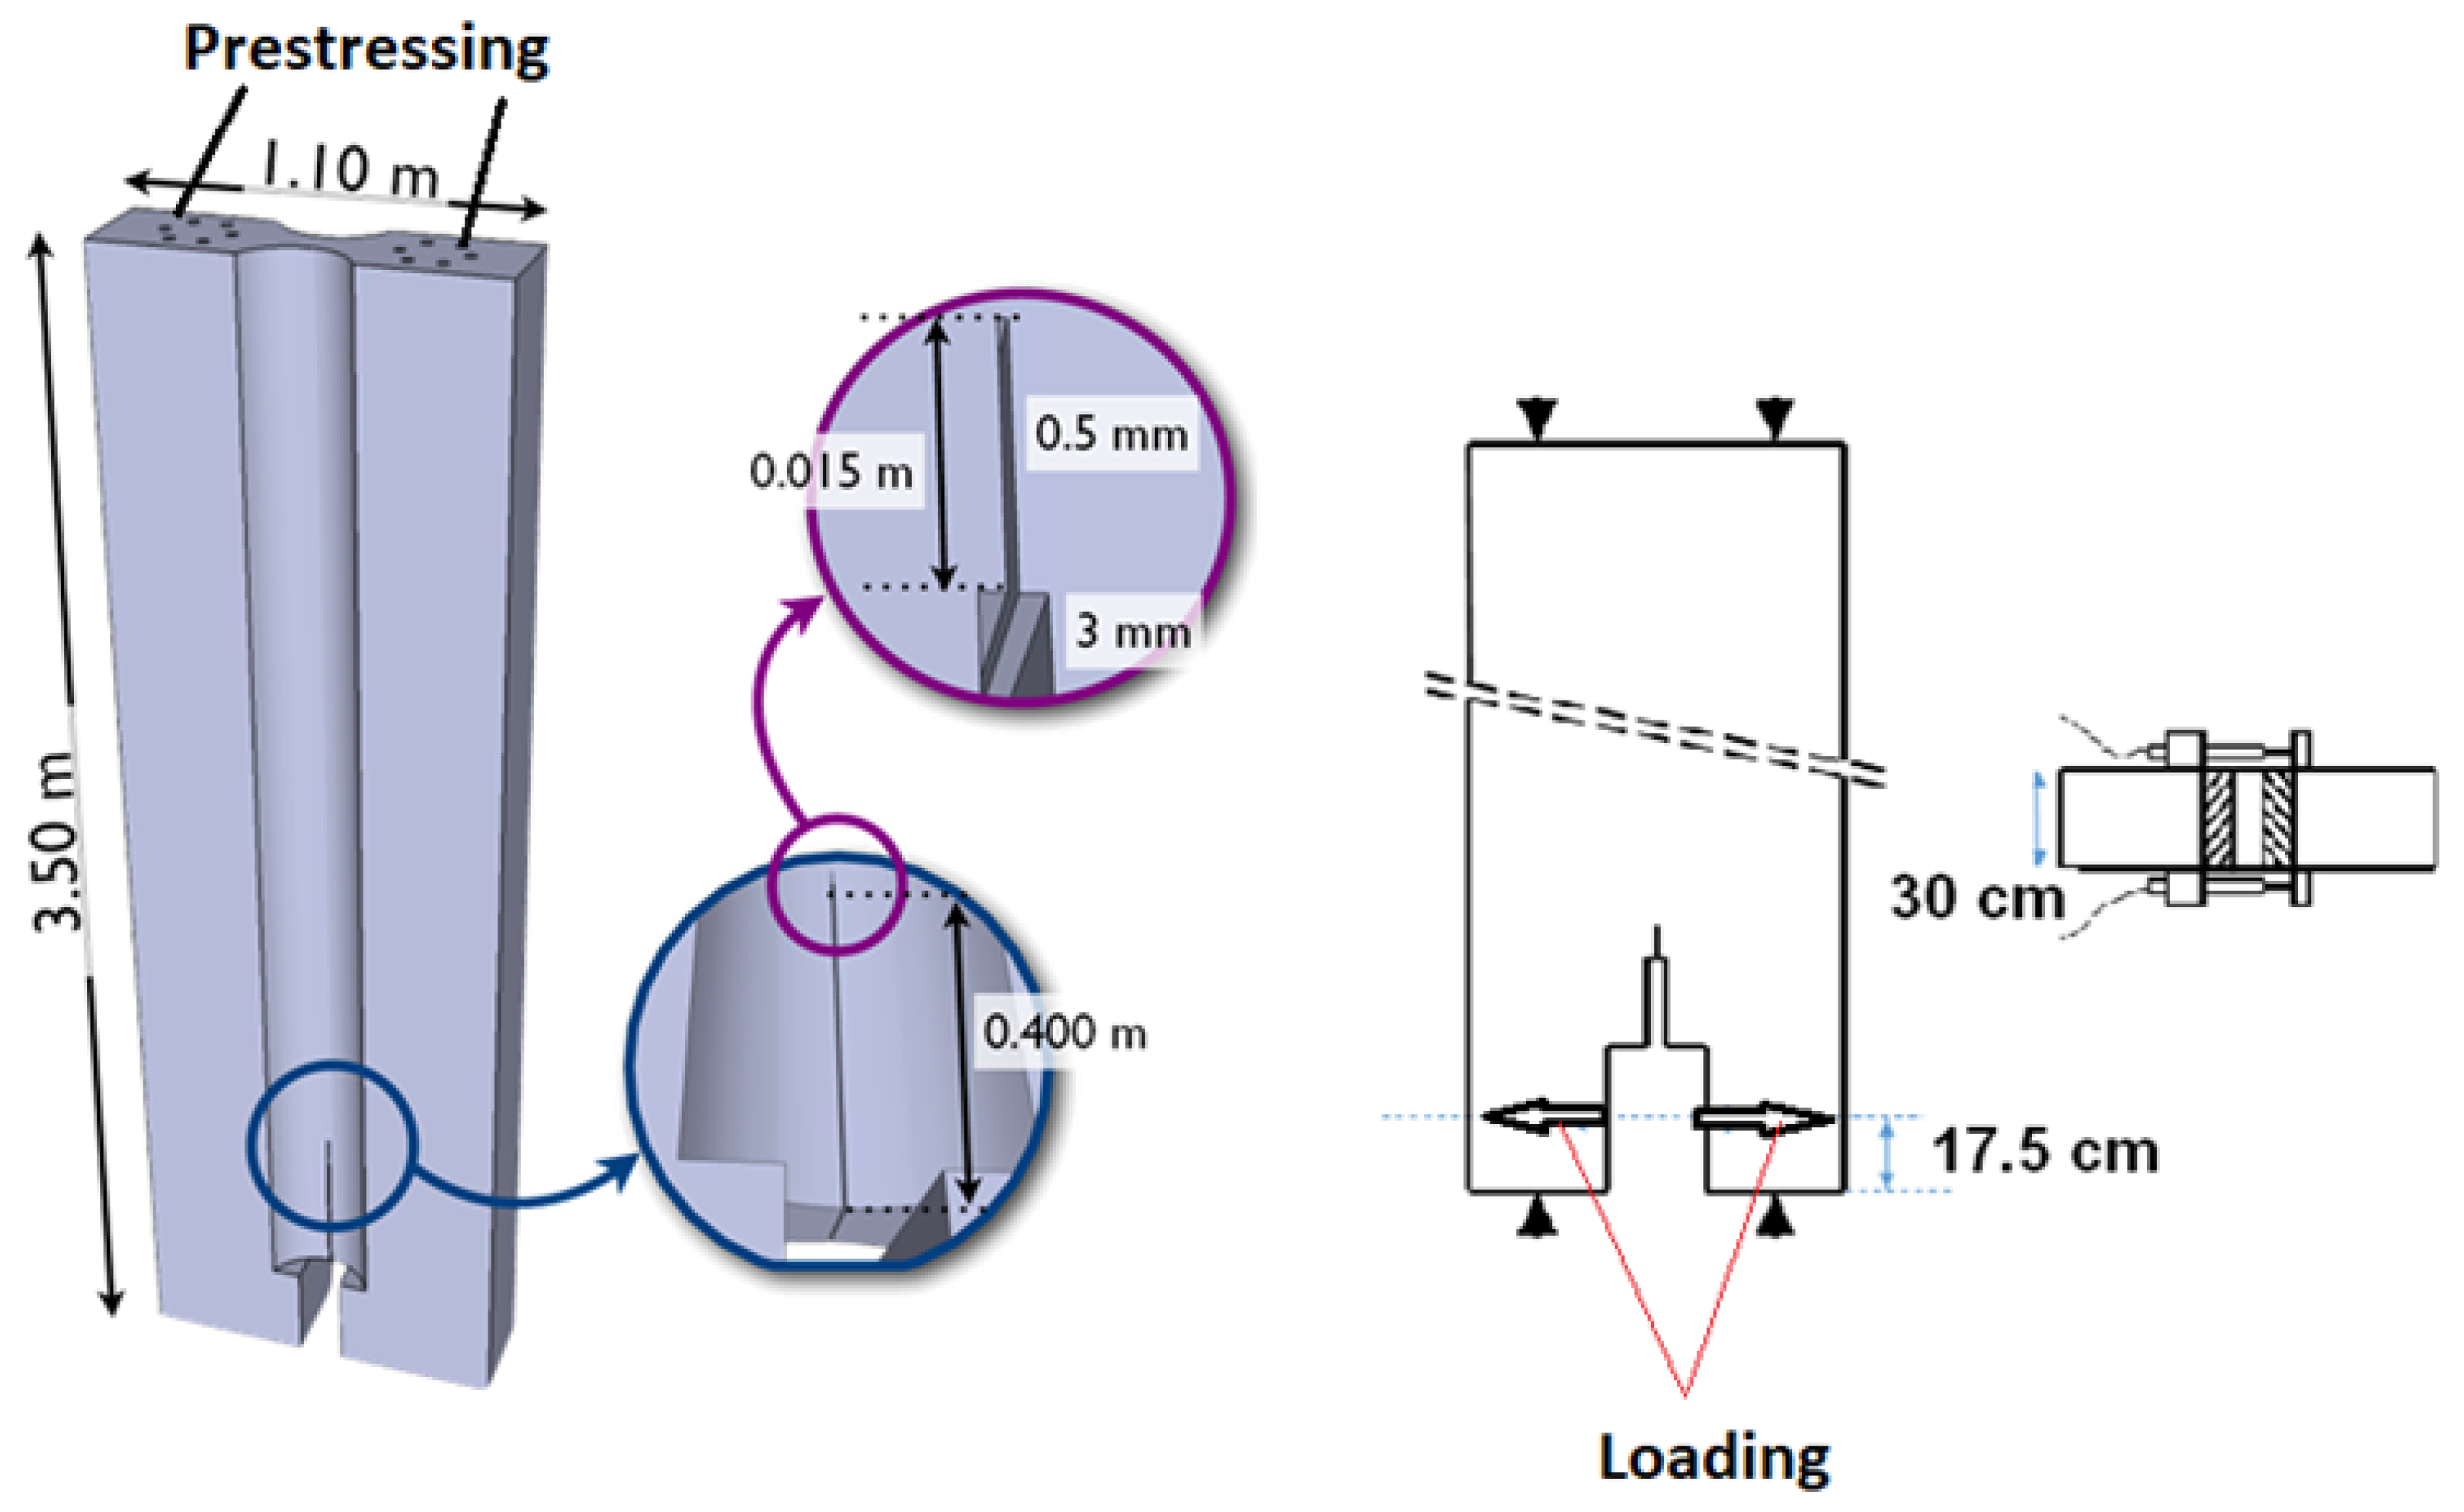
3.1. Experimental Test Chosen for the Validation

To validate the proposed strategy for estimating the coefficient of variation of G I C , a structural problem that has been previously studied by the author [29,30] was selected to be simulated. This specific experiment was previously used to determine Equation (2) for a regular concrete mix design [12,21], defined as Concrete 1. However, for this validation process, a high-strength concrete mix design was employed, defined as Concrete 2. Details regarding the compositions of both concrete mixtures can be found in Table 1, while the properties of Concrete 2 are outlined in Section 3.3. The test entails inducing a macrocrack propagation in a large double cantilever beam (DCB) concrete specimen. Widely acknowledged as a method to measure Mode I fracture toughness in unidirectional composites under both static and cyclic loading conditions [31,32], it involves applying a tensile load normal to the specimen’s notch surface.
In the field of LEFM, one of the major challenges lies in experimentally determining the critical fracture energy ( G I C ) of concrete. It has been widely acknowledged that such tests need to be conducted on large concrete specimens to obtain accurate results [6,29,30,33,34,35,36,37,38,39,40]. This is primarily due to the higher degree of homogeneity achieved in concrete with larger aggregate sizes. Consequently, the process zone at the tip of the propagating macrocrack, which is crucial for determining G I C , extends to approximately 30 cm [30].
The distinguishing feature of this double cantilever beam (DCB) specimen lies in its considerable dimensions: 3.5 m length, 1.1 m width, and 0.3 m thickness, rendering it suitable for simulation purposes. The specimen’s geometric details and applied loading conditions are depicted in Figure 1. During the test, crack propagation occurred from the bottom to the top. The load application point (P) was positioned 0.175 m from the beam’s lower side, where the crack opening measurements were taken. Initially, section thinning was employed to guide the crack and maintain it in the median plane. However, this method was found to be inadequate, leading to the introduction of longitudinal prestressing through post-tension using multiple cables. The value of the applied prestressing force was 1230 kN.
An interesting aspect of the experimental study developed by [30] was the evaluation of the process zone using acoustic emission techniques. This assessment revealed that the process zone had dimensions of approximately 30 cm in length and 12 cm in width, estimating the volume of the process zone ( V p z ) at around 3600 cm3. The size of this process zone was associated with a maximum aggregate size of 12 mm, resulting in a maximum aggregate volume ( V a ) of 1.13 cm3. Furthermore, the determination of G I C in [30] provided a mean value of μ ( G I C ) = 1.25 × 10 4 MN/m and a standard deviation of σ ( G I C ) = 0.073 × 10 4 MN/m. Remarkably, these experimental findings aligned with the theoretical values discussed in Section 2, specifically indicating a standard deviation of G I C reaching zero for a r e approximately equal to 4000.

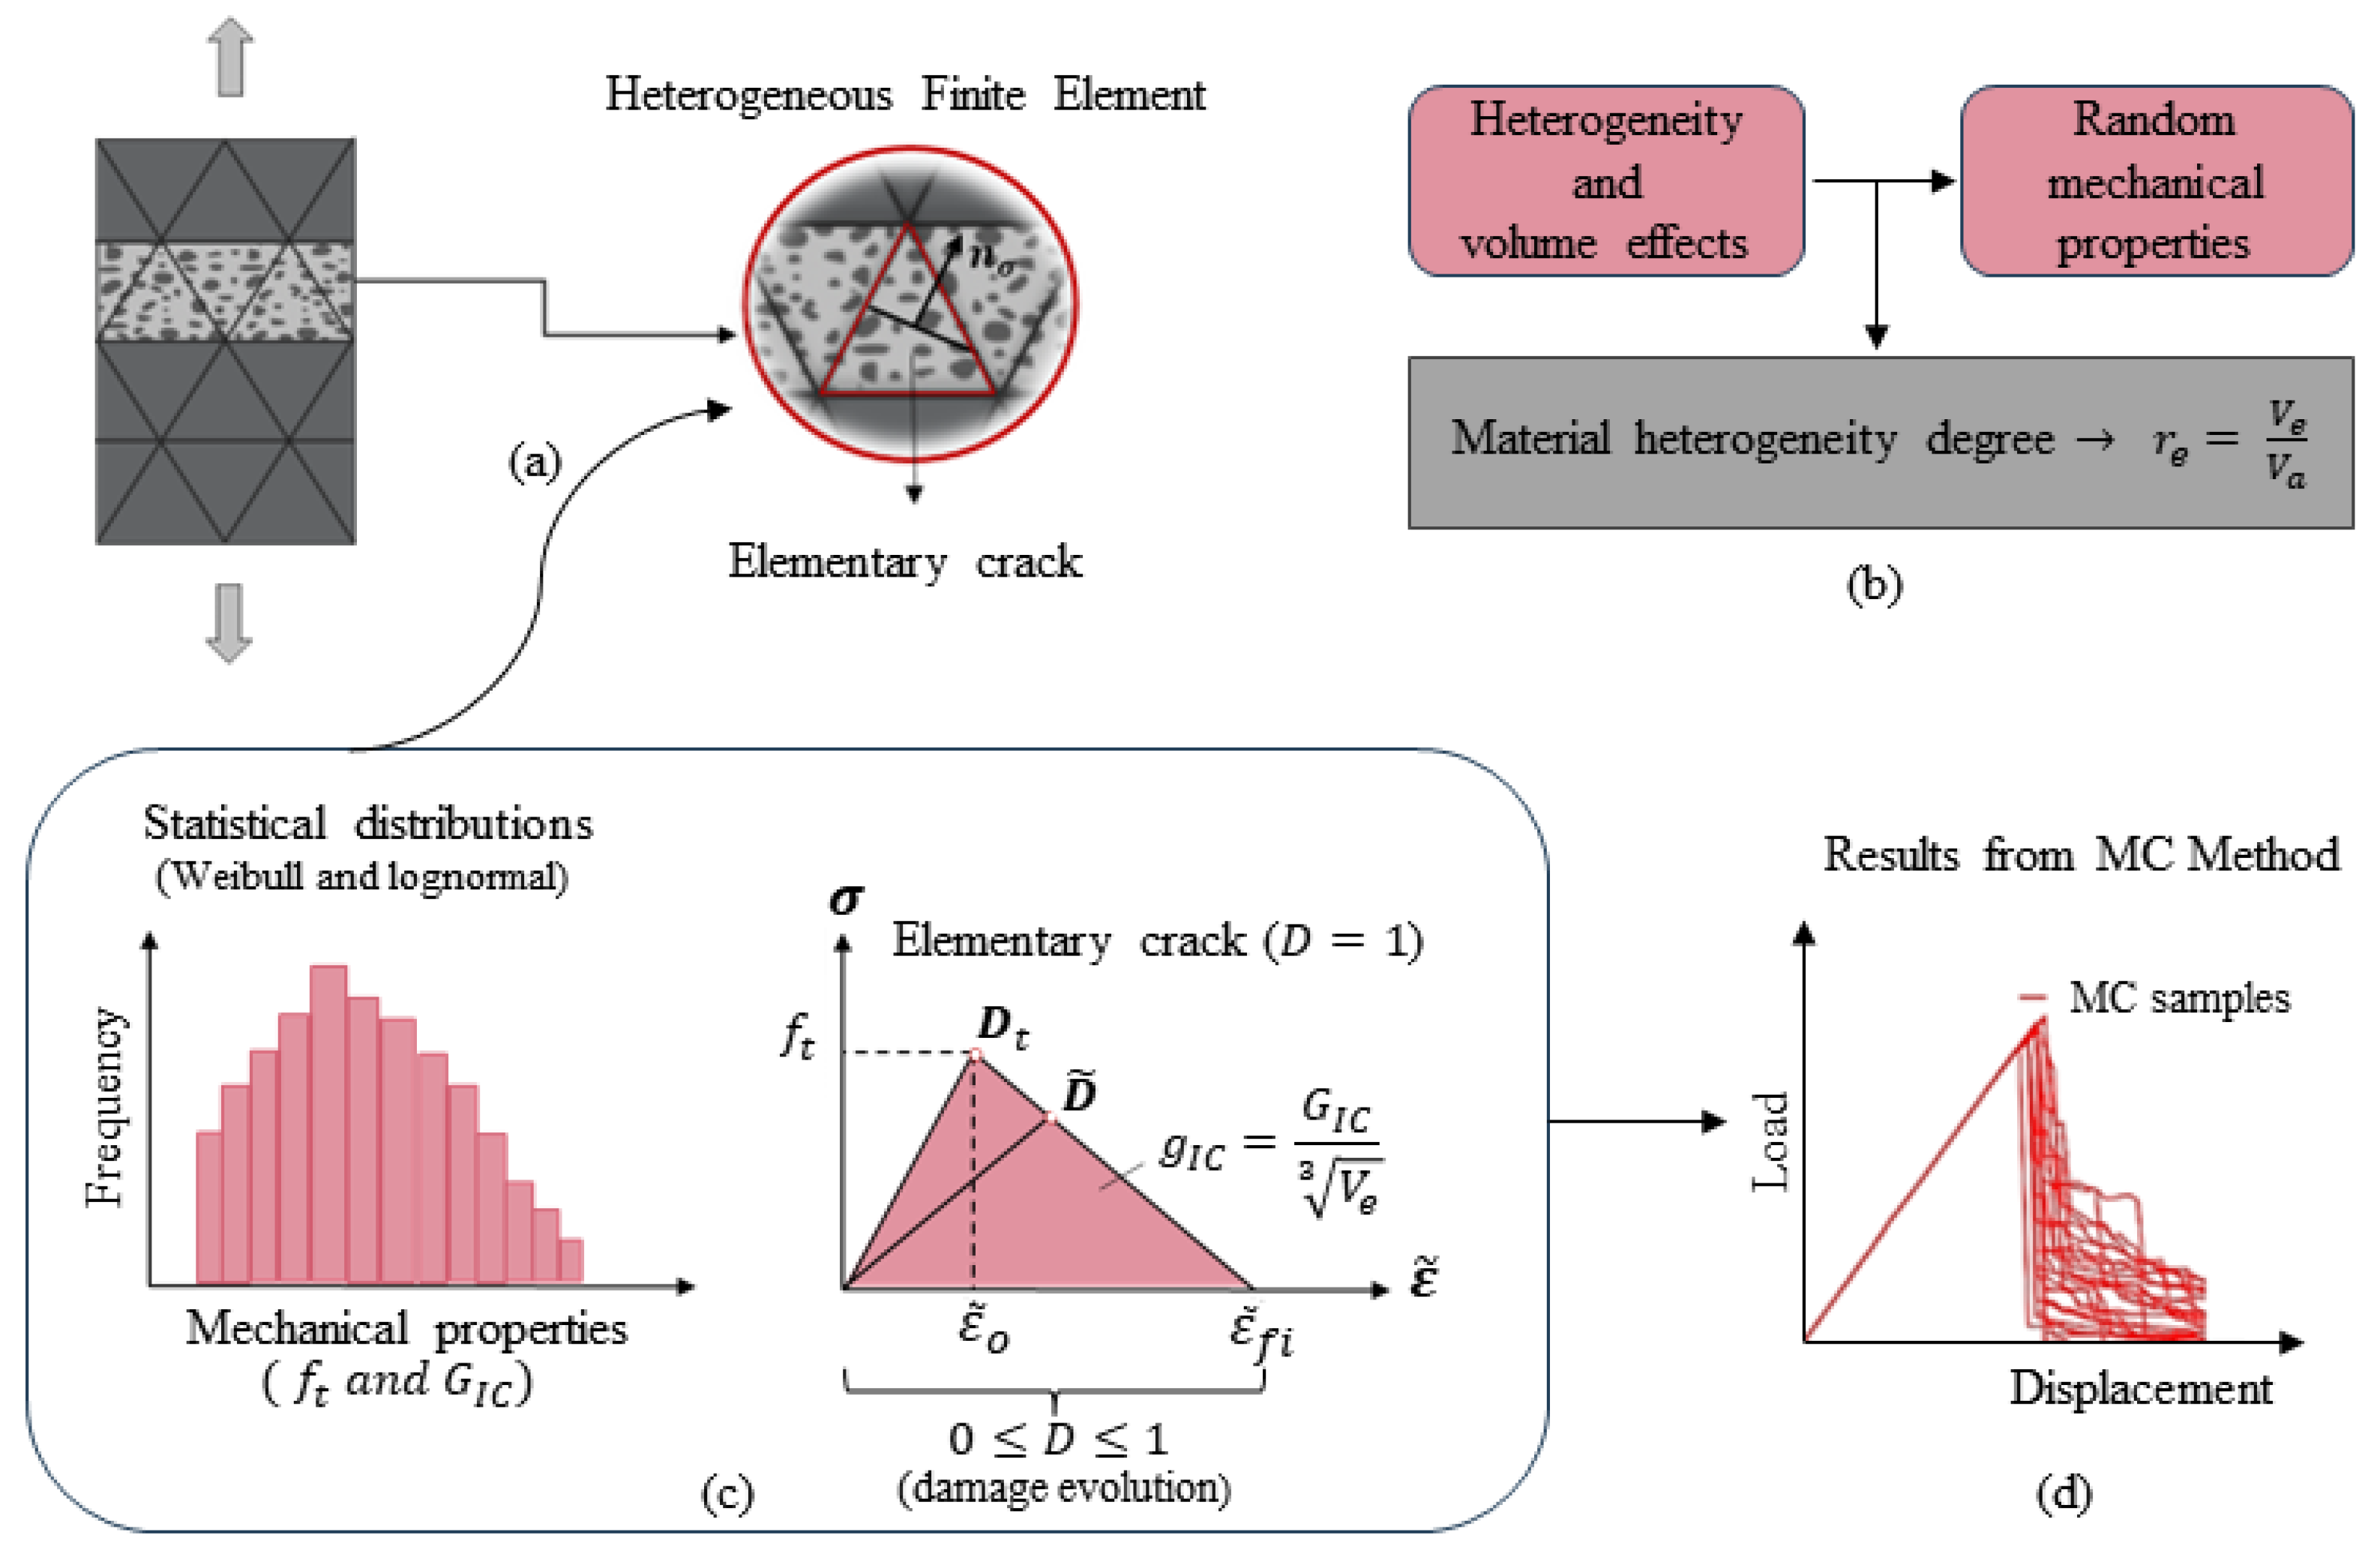
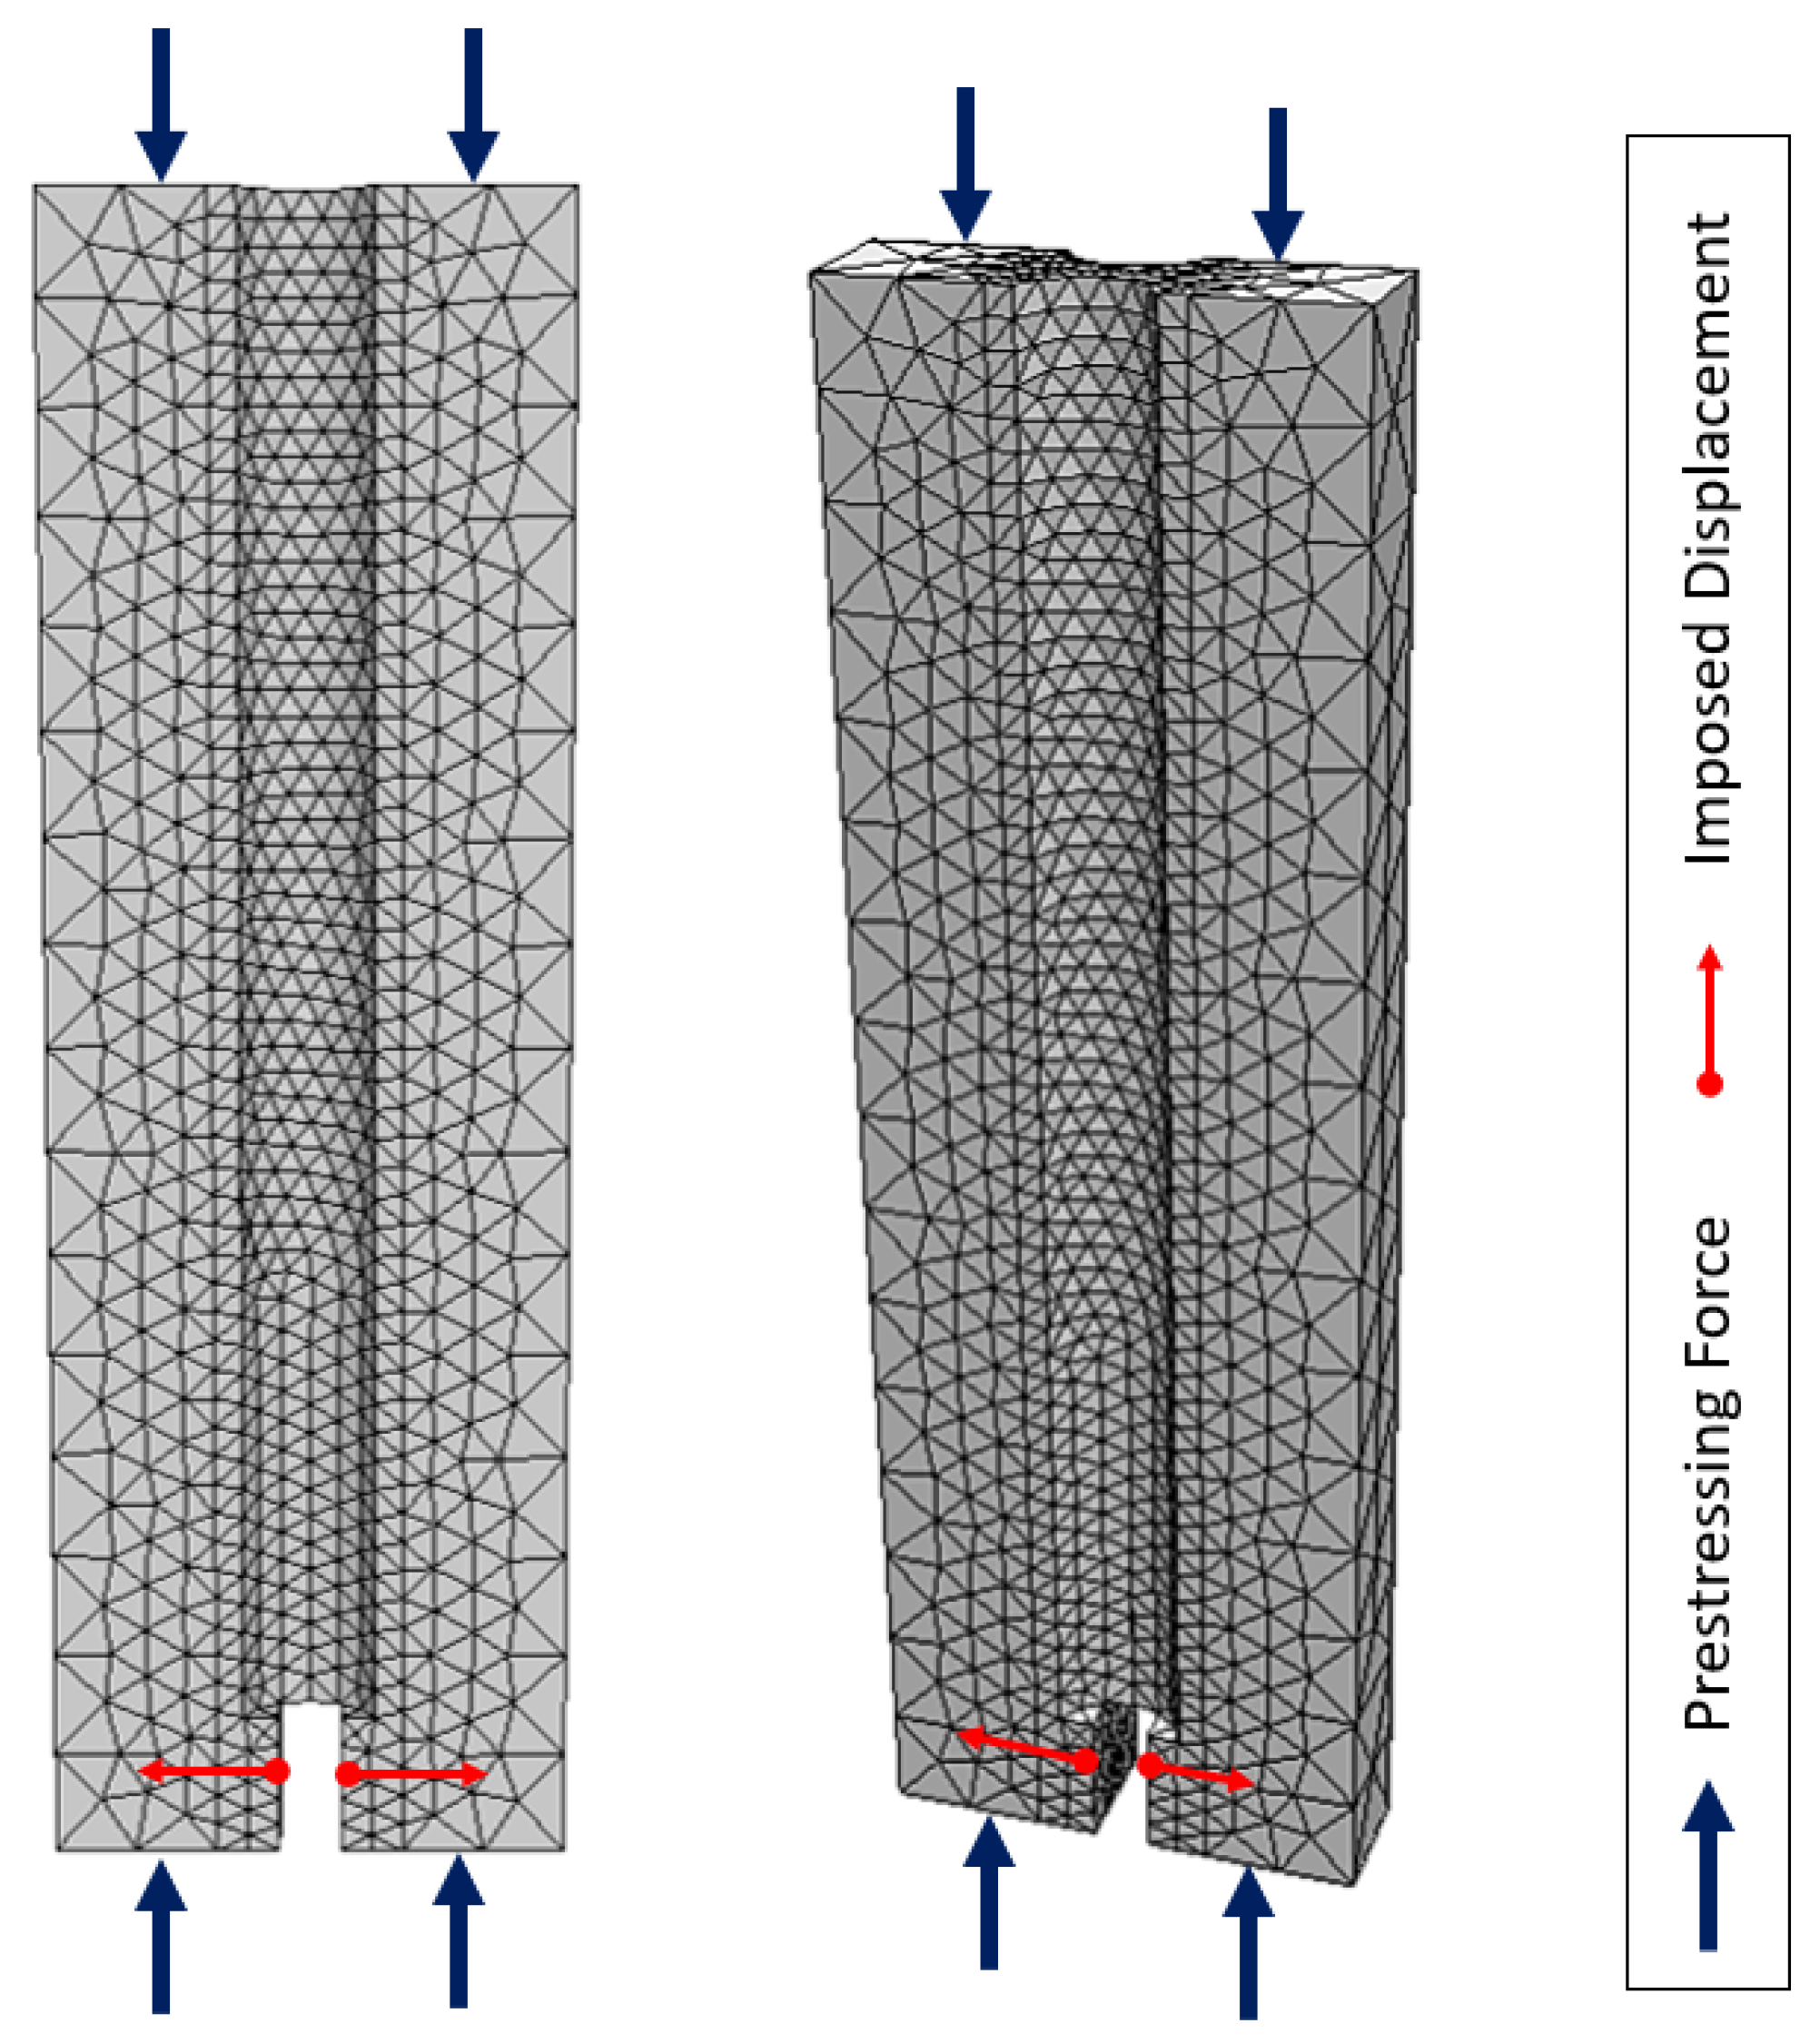
3.2. Probabilistic Numerical Model

The three-dimensional semi-explicit probabilistic model, extensively described in [12], is developed in the finite element method (FEM) context and integrates heterogeneity and volume effects using a probabilistic approach. The code is written in FORTRAN language. The model belongs to the fracture mechanics family of models and primarily deals with the propagation of mode I macrocracks. However, it does not take into account mode II fracture propagation in its current version. Although it shares similarities with linear elastic fracture and non-linear fracture models, it distinguishes itself from damage or smeared crack models by not attempting to simulate the microcracking process.
The model utilizes three-dimensional (3D) linear tetrahedral elements to simulate macrocrack propagation. It employs a criterion based on the mode I critical fracture energy, G I C . For each volume element, the dissipation of the cracking energy, following the linear elastic behavior, was modeled through a softening behavior that initiated when the tensile strength, f t , was reached. This softening behavior, exhibiting a descending branch, was depicted by a linear relationship between the principal tensile stress and strain. The governing principle behind this linear relation is a classical isotropic damage law, uniquely characterized by the random assignment of G I C and f t to the mesh elements due to the the model’s probabilistic nature. The basic steps of the FEM code can be seen in Algorithm 1.
Once the dissipative energy associated with this softening behavior reached the value of G I C , the stiffness matrix of the element reduced to zero. As a result, macrocrack propagation was modeled through a sequence of fully damaged elements, rather than the opening of interface elements as traditionally performed in fracture mechanics models. This characteristic defines the model as a non-explicit cracking model, as opposed to an explicit cracking model. It is important to note that in this numerical model, the utilization of a simplistic damage approach was solely aimed at dissipating the energy related to the softening behavior until reaching the G I C value, and it did not hold any physical significance. The objective of the present model did not involve explicitly modeling the microcracking process.
Algorithm 1: Basic steps of the FEM program
1:
Variables initialization
2:
Read input data
3:
Distribute random tensile strength ;// according to Weibull distribution
4:
Distribute random critical fracture energy ;// according to lognormal distribution
5:
istep = 0 ;// load step counter
6:
while the number of load steps is not achieved do
7:
 istep = istep + 1
8:
 i = 0 ;// iteration counter
9:
while the balance between external and internal forces is not achieved do
10:
   i = i + 1
11:
   Evaluate the linear solution of displacements
12:
   Update the total displacements
13:
   Update the damage of the elements
14:
   Update the stiffness matrix
15:
   Update the vector of residual forces
16:
end while
17:
end while
It is worth emphasizing that in the model, all mechanical criteria were assessed at the centroid of the linear volume elements. Besides, the rationale behind considering f t and G I C as probabilistic lay in accounting for the material’s inherent heterogeneity and integrating scale effects, directly linked to this material’s characteristic. As illustrated in [21], the variation in tensile strength values stemmed from this phenomenon. Thus, the intensity of the scale effect diminished with a higher material quality (higher f c values) and reduced heterogeneity (measured as the ratio of the specimen’s volume to the volume of the maximum aggregate).
Furthermore, given the probabilistic nature of the numerical model, a Monte Carlo (MC) technique was employed to ensure statistically robust results. The core principle of this approach entailed running numerous numerical simulations of a particular structural problem, encompassing varied spatial distributions of mechanical material properties defined by identical parameters of the probability distributions. The resulting outcomes were subsequently subjected to comprehensive statistical analysis.
An overview of the model’s formulation, highlighting its key aspects, is presented in Figure 2. As depicted in Figure 2a, the material heterogeneity was represented by each finite element and was quantified through the heterogeneity degree r e , as illustrated in Figure 2b. Figure 2c represents the random distribution of the tensile strength and fracture energy to mesh elements, and the energy dissipation resulting from the cracking process, which is governed by an isotropic damage law. This constitutive law takes into account the tensile strength and the volumetric density of dissipated energy, symbolized as g I C . The value of g I C is determined using an energetic regularization technique [41], calculated as follows: g I C = G I C / l e , with l e being the elementary characteristic length, determined in this context as l e = ( V e ) 1 / 3 . Finally, as portrayed in Figure 2d, the model yielded global structural responses through the implementation of a Monte Carlo approach. Additional details about the model can be found in [12].

3.2.1. Distribution of Random Material Properties

For the tensile strength, the material behavior was represented using the Weibull distribution. The probability density function, f w ( x , b , c ) , for a random variable x 0 is presented in Equation (9).
f w ( x , b , c ) = b c x c b 1 e x c b
The terms b > 0 and c > 0 are the shape and scale parameters of the distribution, related to the dispersion and mean value of x, respectively. The mean μ w and standard deviation σ w of the distribution are evaluated, respectively, according to Equations (10) and (14).
μ w = c Γ 1 + 1 b
σ w = c 2 Γ 1 + 2 b μ 2
For the critical fracture energy, the lognormal distribution was chosen to describe the material behavior. Its probability density function, f L ( x , μ L , σ L ) , is presented in Equation (12), where μ L is the mean and σ L is the standard deviation of the variable’s natural logarithm. The expected mean value E L ( X ) and variance V a r L ( X ) of the distribution are presented in Equation (13) and Equation (14), respectively.
f L ( x , μ L , σ L ) = 1 μ L σ L 2 π e ( ln ( x ) μ L ) 2 2 σ L 2
E L ( X ) = e μ L + σ L 2 2
V a r ( x ) = e σ L 2 1 e 2 μ L + σ L 2

3.2.2. Estimation of the Model Parameters

To ensure a consistent application of the model, it is crucial to precisely determine the parameters governing both the Weibull and lognormal distributions. These distributions typically involve two parameters each. However, considering fracture energy as an intrinsic material property implies a constant mean value. Consequently, once its mean value is known, the task entails determining the scale and shape parameters of the Weibull distribution and the standard deviation of the lognormal distribution.
The assessment of Weibull distribution parameters involves an iterative numerical procedure designed to solve a nonlinear system of equations. This system merges equations that define the distribution’s mean and standard deviation, described in Equations (10) and (14), with the analytical scale law introduced by [21], described in Equations (4)–(7). This scale law estimates the expected mean and standard deviation values for a specified concrete volume; here, it is applied to the finite element scale. This formulation originates from an experimental investigation intended to establish a relationship between concrete heterogeneity and the phenomenon of the scale effect. Through this procedure, each finite element received specific parameters ( b , c ) defining the Weibull distribution that characterizes its behavior. Additional information about the analytical expressions and the implementation of the iterative procedure can be found in [12]. Conversely, the methodology outlining the estimation of standard deviation for the lognormal distribution is detailed in Section 2, while the approach to estimate its mean value is described in Section 4.

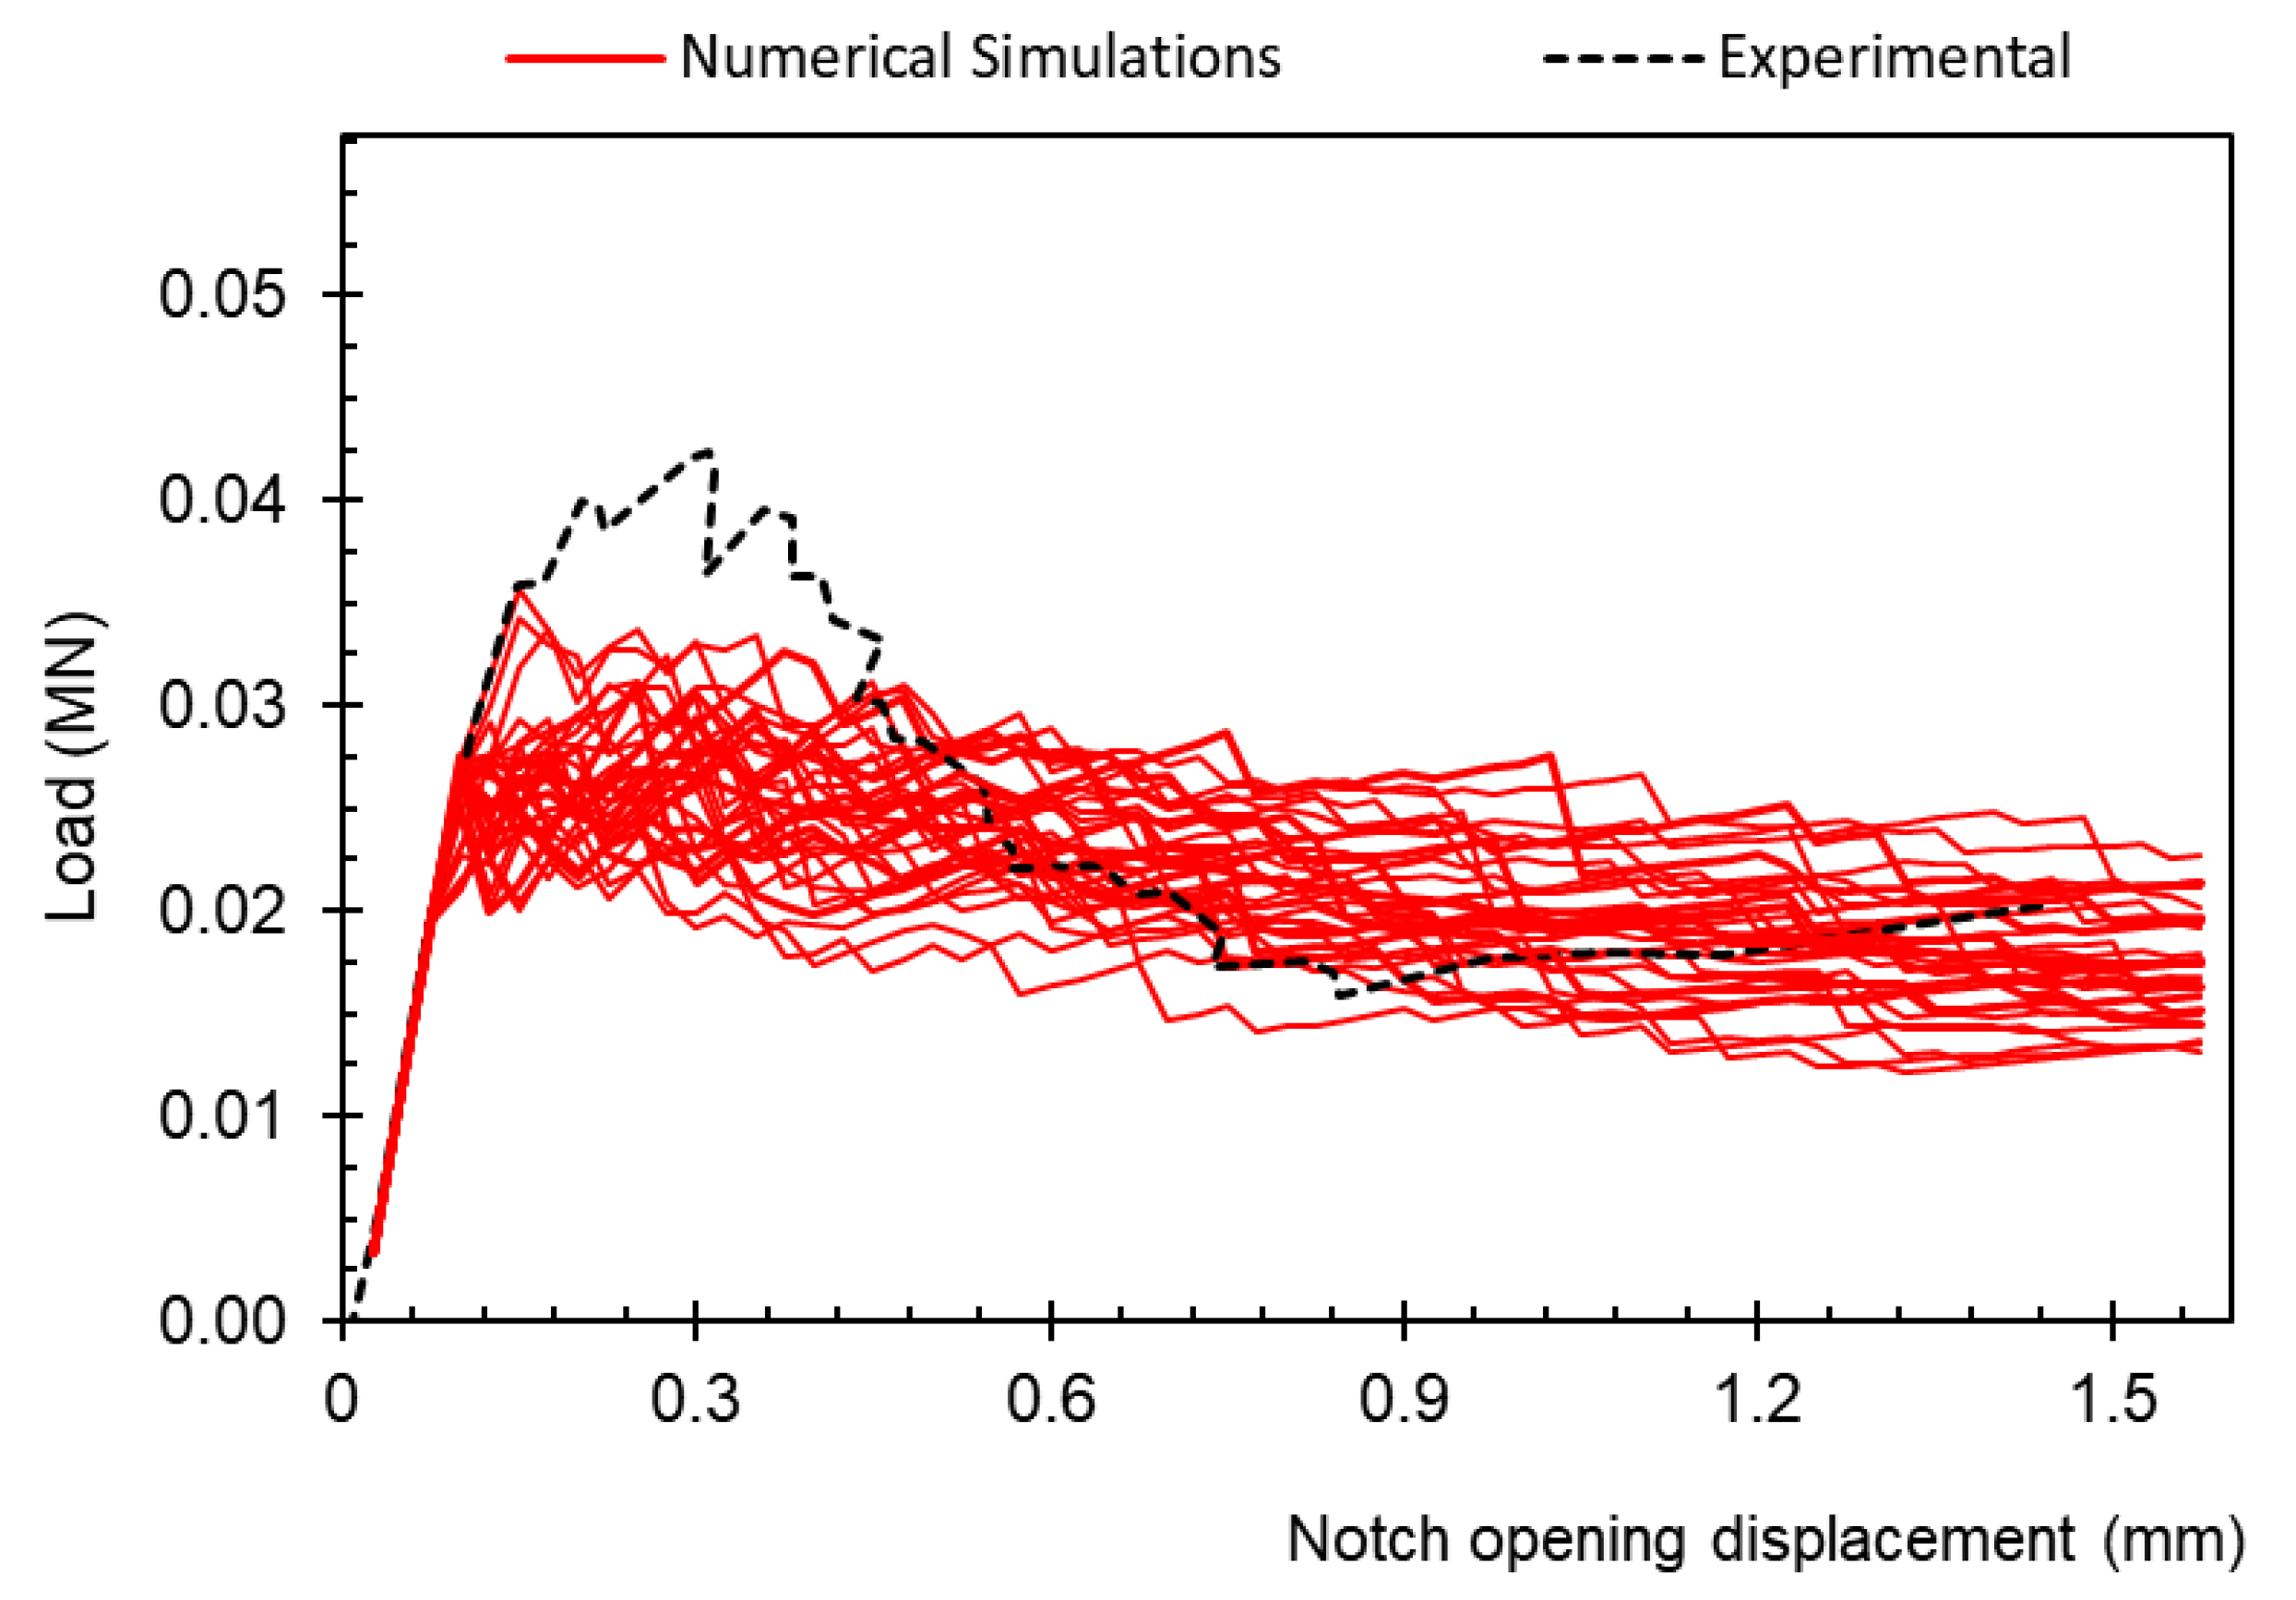
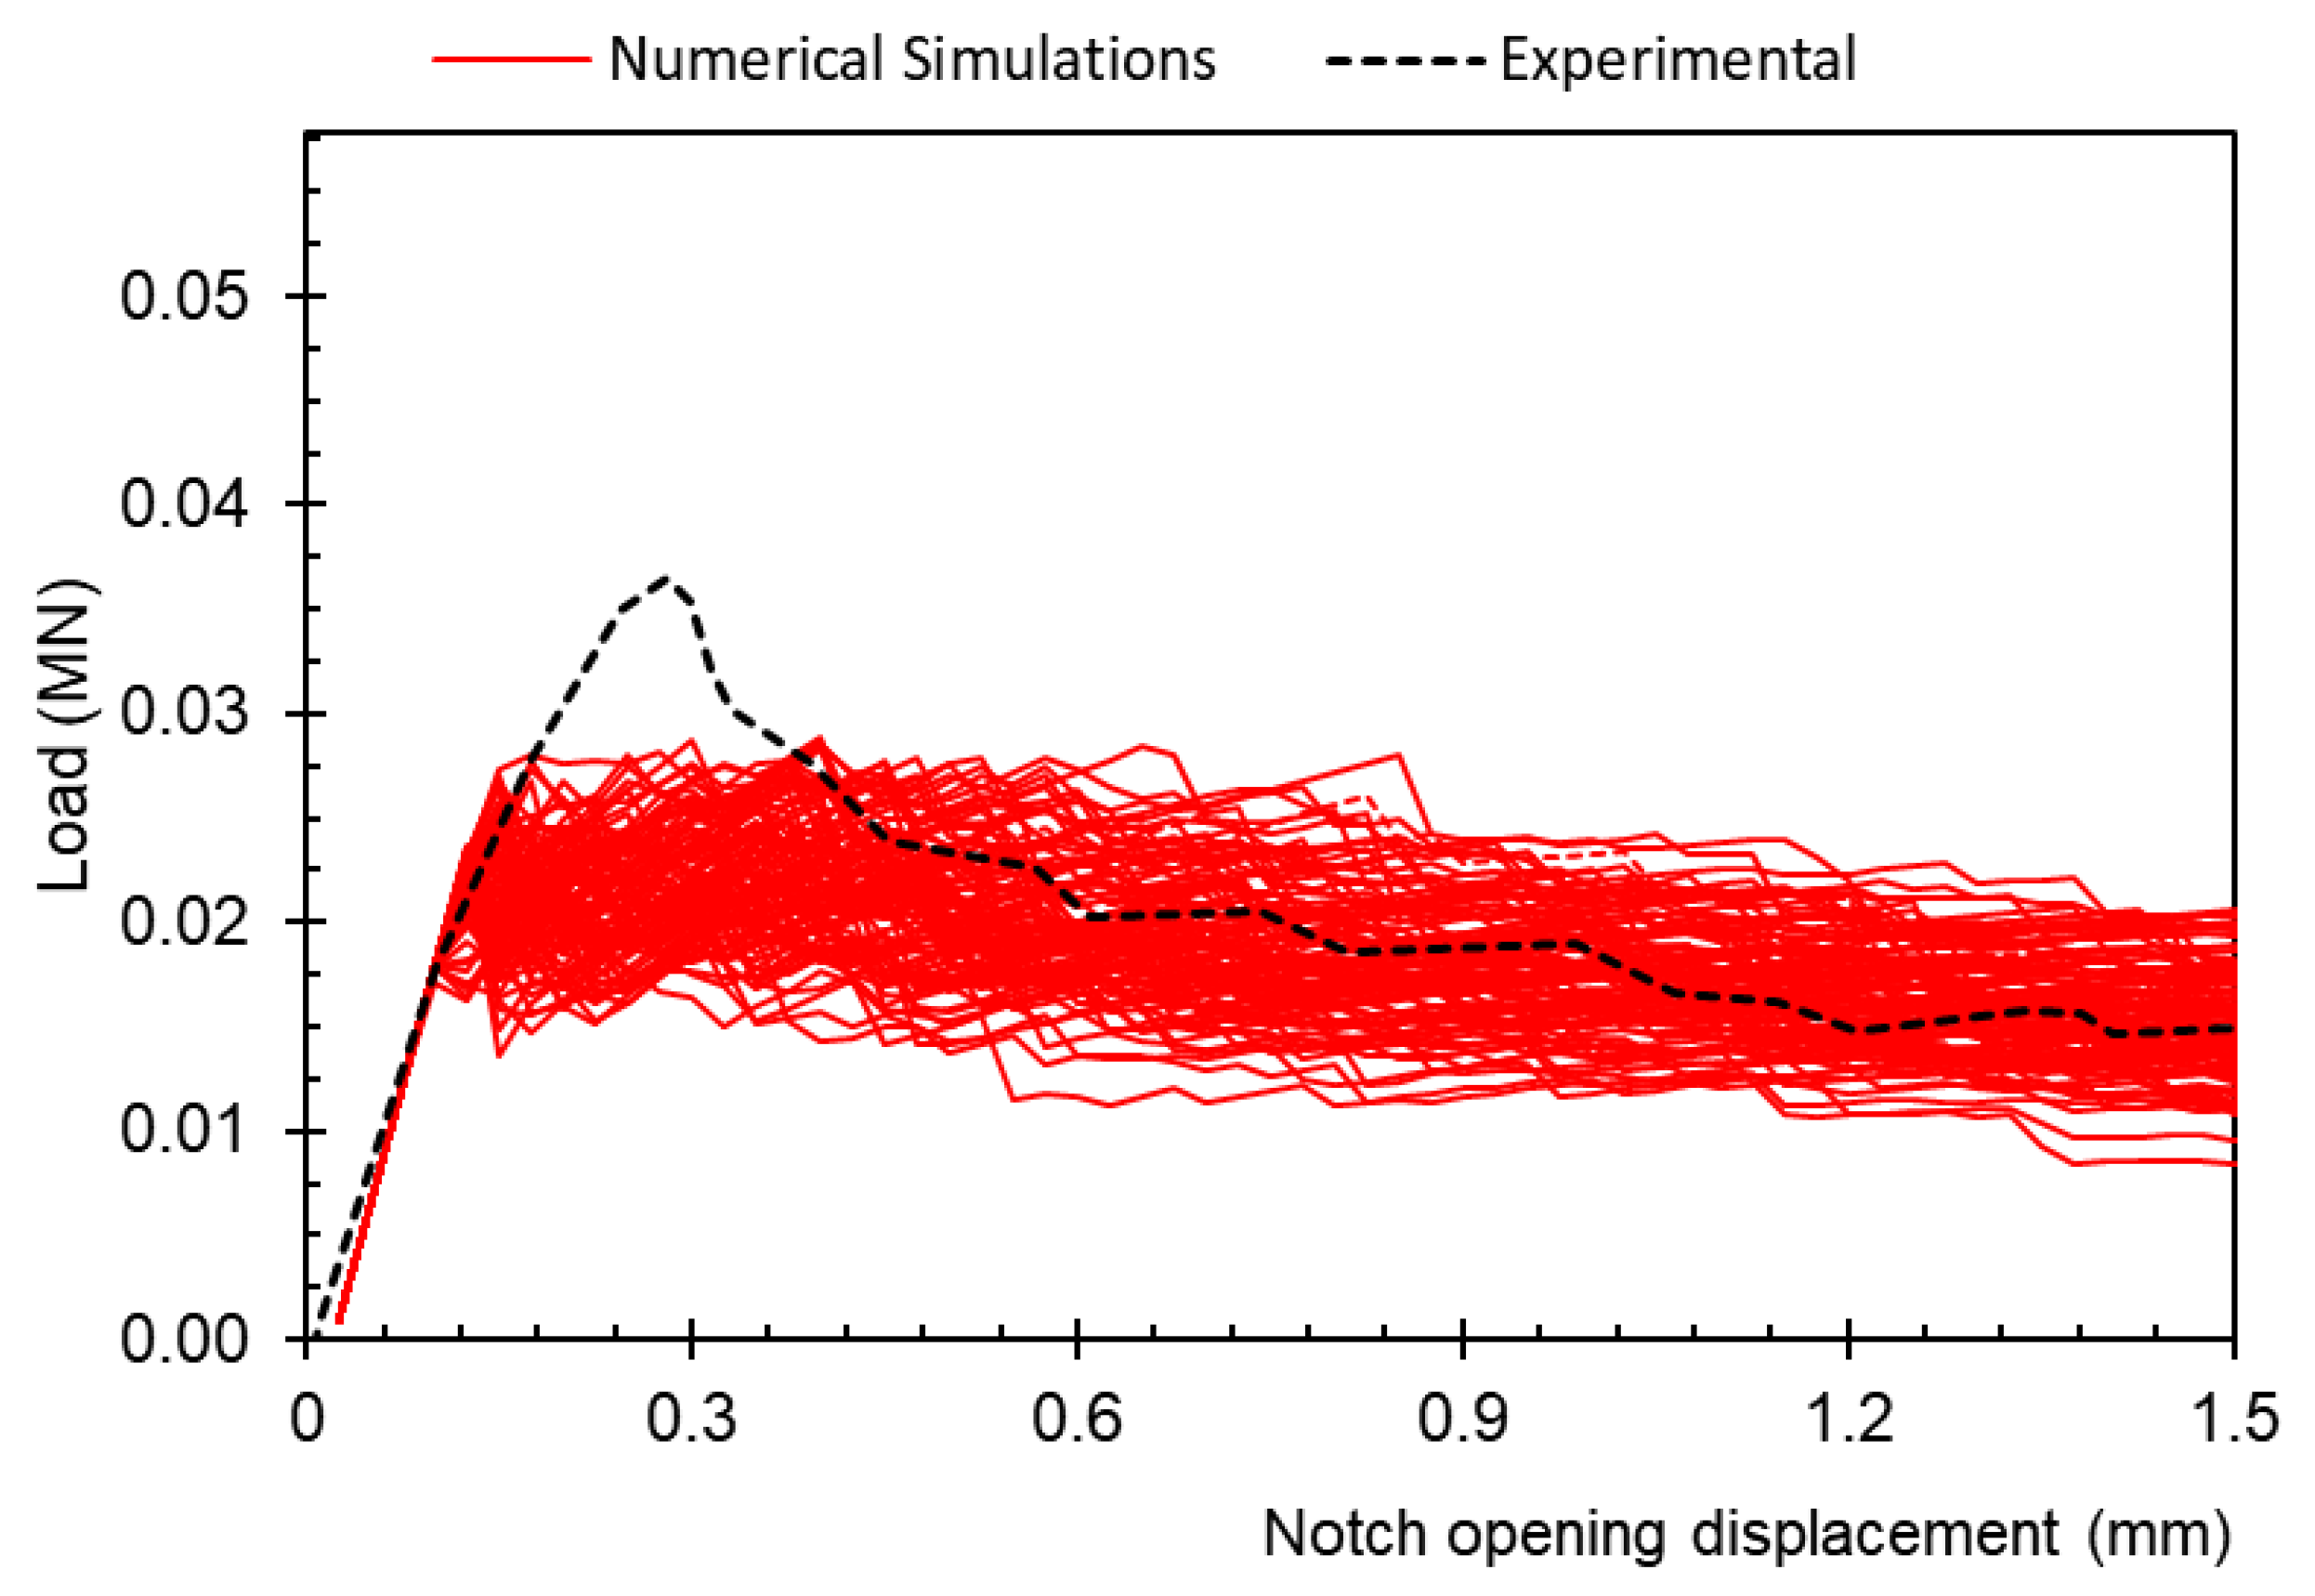
3.3. Numerical Simulations

The numerical simulations conducted in this work for validation purposes focused on a high strength concrete with the following properties: f c = 105 MPa, E = 53.4 GPa, maximum aggregate size = 20 mm, and G I C = 1.52 × 10 4 MN/m. These concrete parameters were obtained from [42] and were suitable for performing the numerical simulations using the present model (as discussed in Section 2). It is worth noting that the mechanical characteristics and maximum aggregate size of this particular concrete differed significantly from those used in the simulations [12] from which Equation (2) was derived. Therefore, if Equation (8) was validated for this new high-strength concrete, it could be considered valid for a wide range of typical concretes.
Figure 3 displays both frontal and 3D perspectives of the finite element mesh utilized in the simulation, pinpointing the locations where the prestressing force and imposed displacements were applied. The mesh comprised 19,564 tetrahedral solid elements with linear interpolation. The simulation of the DCB test involved several boundary conditions to accurately represent its behavior. These conditions included the restriction of displacements along the X axis within the YZ plane, along the Y axis within the XZ plane, and along the Z axis at the central nodes in the XZ plane. Additionally, there were restrictions on Z axis displacements at nodes where prescribed displacements were applied. Moreover, the simulation incorporated the application of prescribed forces specifically in the Y direction, exerted on the elements situated on the specimen’s bottom surface.
The Monte Carlo simulation consisted of the execution of 30 independent finite element analyses. As shown in [12], this number of MC samples was sufficient to produce a consistent outcome concerning the variability of the average curve from the numerical simulations. For this level of mesh refinement, Monte Carlo simulations employing 30 or more finite element analyses did not exhibit significant variability in the average curve. The loading force versus notched opening displacement curves obtained from the Monte Carlo simulation results are presented in Figure 4. These numerical curves were then compared with the experimental data obtained from [42] for a comprehensive evaluation. Additionally, Figure 5 provides an example of the crack pattern obtained from the numerical simulations, with cracked elements represented in red and uncracked elements in blue.
Upon examining the graph presented in Figure 4, several significant observations emerge. Firstly, the peak loads evident in the numerical curves consistently exhibited lower values in contrast with those observed in the experimental curve. This aligned with the findings reported in [12]. A depiction of the Monte Carlo (MC) outcome conducted for 100 samples is presented in Figure 6, further supporting this observation.
As explained in detail in [12], this difference can be attributed to the fact that the proposed model primarily focused on macrocrack propagation rather than the localization process, which was responsible for the peak load. Therefore, for a valid comparison, it was important to consider the behavior of the descending branch of the curves, representing macrocrack propagation.
Moreover, for simplification purposes, the numerical modeling of the notch tip was represented as a line. In contrast, the actual DCB specimen featured a notch tip thickness of 0.5 mm, as depicted in Figure 3. This discrepancy led to higher stress concentrations at the numerical front tip compared with the experimental values. Additionally, it is noteworthy that, after a small notch opening, the experimental curve aligned within the range of the numerical curves. This observation concurred with the findings detailed in [12]. Consequently, based on these outcomes, it can be inferred that Equation (8) was validated for this specific high-strength concrete, and by extension, for other usual concretes.

4. Determination of the Mean Value of G IC

In Section 2, it was mentioned that in order to calculate the standard deviation of G I C , it was essential to know its mean value. However, as discussed in Section 3, obtaining an intrinsic value of G I C through direct testing was challenging and required large-scale fracture mechanics tests, which were time-consuming and costly. Therefore, to address this issue, it is crucial to develop a strategy for determining the intrinsic value of G I C using simpler tests and establishing relationships between G I C and other readily measurable mechanical characteristics of concrete. A recent work was performed to determine this intrinsic value of G I C from the knowledge of the compressive strength, f c , or the tensile splitting strength, f t s [42]. From this work, the following relations were proposed:
G I C = 9.5 f t s + 90 ,
G I C = 0.4 f c + 110 ,
in Equations (15) and (16), the unit of G I C is in J/m2 and f t s and f c are in MPa. It is important to recall that these relations were determined for concretes with the following: 4 f t s 6.5 MPa and 50 f c 105 MPa. They could be considered valid only when the compressive and tensile splitting tests were conducted on cylindrical specimens with dimensions of 16 × 32   cm 2 (standard tests). The direct link between toughness and compressive or tensile strength may be considered overly simplistic. However, this link was both possible and relevant due to the similar underlying physical mechanisms governing these mechanical characteristics.
The transition from diffuse microcracking to localized macrocracking is responsible for the development of compressive and tensile strengths. In the case of G I C , it is associated with the existence of a process zone at the front tip of the macrocrack. The macrocrack can propagate only when the total dissipative energy in this process zone (microcracked zone) was reached, indicating a process of cracking localization and, therefore, macrocrack propagation.
There are no inherent physical or mechanical limitations that restrict the applicability of Equations (15) and (16) to concretes with lower compressive and tensile strengths. However, it should be noted that these relations are not valid for fiber-reinforced concretes [30]. Additionally, considering that Equations (4)–(7) were established for concretes with a maximum aggregate diameter greater than or equal to 10 mm, and Equations (15) and (16) were established for concretes with maximum aggregate diameters of 12 mm and 20 mm, the presented equations were satisfactorily applicable to concrete mixtures with maximum aggregate diameters between 10 mm and 20 mm. In the case of larger aggregates, it is necessary to verify their applicability.

5. Conclusions and Discussion

In this study, our primary objective was to enhance the applicability of a semi-explicit macroscopic probabilistic model by devising strategies to estimate both the mean and standard deviation of G I C , which are parameters of the model. For this aim, an equation to estimate the coefficient of variation of G I C in relation to r e , the mean and standard deviation of the tensile strength was proposed. The methodology’s validation involved a simulation of an experimental DCB test using high-strength concrete with f c = 105 MPa. The simulation confirmed the main assumption of the study, enabling an extension of the model’s applicability to diverse concrete mixtures. Additionally, a strategy to estimate the mean value of G I C was introduced, enabling the assessment of this value using more readily available data, such as compressive strength, f c , or tensile splitting strength, f t s . Thus, this paper offers an approach to address an ongoing issue in the literature regarding the definition of material inputs for modeling concrete cracking, considering the size effects and material heterogeneity.
The numerical model employed in this study, based on finite element theory, is designed to analyze the propagation of macrocracks in concrete structures. It incorporates the random distribution of material properties over the mesh, accounting for crack propagation through energy dissipation. The random mechanical properties considered in the model are the tensile strength, f t , and the mode I critical fracture energy, G I C . The model assumes that the mean value of G I C remains constant regardless of scale, while its standard deviation varies based on the volume of the mesh elements.
In conclusion, this study extends the applicability of a 3D probabilistic semi-explicit cracking numerical model to concrete mixtures with compressive strengths below 130 MPa and the largest aggregate diameter ranging between 10 mm and 20 mm. The findings contribute to describing the macrocrack propagation in concrete elements. However, for effective application of the model in real concrete structures, further advancements are necessary, particularly in modeling steel rebars and concrete/steel bond. Moreover, future research should focus on extending the model to simulate macrocrack propagation in fiber-reinforced concrete.

Supplementary Materials

The following supporting information can be downloaded at: https://www.mdpi.com/article/10.3390/app14010462/s1, Section S1: Coefficient of Variation of Tensile Strength; Section S2: Coefficient of Variation of Fracture Energy; Section S3: Deduction of the analytical relation between σ μ G I C and σ μ f t .

Author Contributions

Conceptualization, P.R. and M.R.R.; methodology, P.R.; software, M.R.R. and F.L.B.R.; validation, M.R.R.; formal analysis, M.R.R.; investigation, P.R.; writing—original draft preparation, P.R. and M.R.R.; writing—review and editing, P.R., M.R.R. and E.d.M.R.F.; supervision, P.R., E.d.M.R.F. and F.L.B.R. All authors have read and agreed to the published version of the manuscript.

Funding

This study was financed by Brazilian scientific agencies, namely the Conselho Nacional de Desenvolvimento Científico e Tecnológico (CNPq), and the Coordenação de Aperfeiçoamento de Pessoal de Nível Superior (CAPES)—Finance Code 001.

Institutional Review Board Statement

Not applicable.

Informed Consent Statement

Not applicable.

Data Availability Statement

The data presented in this study are available in the article.

Conflicts of Interest

The authors declare no conflicts of interest.

References

  1. Mazars, J. Application de la Mecanique de L’endommagement au Comportement non Lineaire et a la Rupture du Beton de Structure. Ph.D. Thesis, Ecole Normale Supériore de l’Enseignement Technique, Paris, France, 1984. [Google Scholar]
  2. Pijaudier-Cabot, G.; Bažant, Z. Nonlocal damage theory. J. Eng. Mech. 1987, 113, 1512–1533. [Google Scholar] [CrossRef]
  3. Rashid, Y.R. Ultimate Srength Analysis of Pre-stressed Concrete Pressure Vessels. Nucl. Eng. Des. 1968, 7, 334–344. [Google Scholar] [CrossRef]
  4. De Borst, R.; Nauta, P. Nonorthogonal cracks in a smeared finite element model. Eng. Comput. 1985, 2, 35–46. [Google Scholar] [CrossRef]
  5. Feenstra, P.H.; De Borst, R. A plasticity model and algorithm for mode-I cracking in concrete. Int. J. Numer. Methods Eng. 1995, 38, 2509–2529. [Google Scholar]
  6. Hillerborg, A.; Modeer, M.; Petersson, P. Analysis of crack formation and crack growth in concrete by means of fracture mechanics and finite elements. Cement Concrete Res. 1976, 6, 773–782. [Google Scholar] [CrossRef]
  7. Hillerborg, A. Numerical methods to simulate softening and fracture of concrete. In Fracture Mechanics of Concrete: Structural Application and Numerical Calculation; Springer: Dordrecht, The Netherlands, 1985; pp. 141–170. [Google Scholar]
  8. Möes, N.; Belytschko, T. Extended finite element method for cohesive crack growth. Eng. Fract. Mech. 2002, 69, 813–833. [Google Scholar]
  9. Armero, F.; Garikipati, K. An analysis of strong discontinuities in multiplicative nite strain plasticity and their relation with the numerical simulation of strain localization in solids. Int. J. Solids Struct. 1996, 33, 2863–2885. [Google Scholar] [CrossRef]
  10. Chang, Z.; Zhang, H.; Schlangen, E.; Šavija, B. Lattice Fracture Model for Concrete Fracture Revisited: Calibration and Validation. Appl. Sci. 2020, 10, 4822. [Google Scholar]
  11. Rastiello, G. Influence de la Fissuration sur le Transfert de Fluides Dans les Structures en Béton. Stratégies de Modélisation Probabiliste et Étude Expérimentale. Ph.D. Thesis, IFSTTAR, Paris, France, 2013. [Google Scholar]
  12. Rita, M.R. Implementation of a 3D Macroscopic Probabilistic Model for Semi-Explicit Concrete Cracking. Ph.D. Thesis, UFRJ, Rio de Janeiro, Brazil, 2022. [Google Scholar]
  13. Nadai, A. Theory of Flow and Fracture of Solids; McGraw-Hill: New York, NY, USA, 1950; Volume 1. [Google Scholar]
  14. Rots, J.G. Prediction of Dominant Cracks Using the Smeared Crack Concept; Technical Report; Institute TNO for Building Materials and Building Structures: Rijswijk, The Netherlands, 1983. [Google Scholar]
  15. Bazant, Z.P. Mechanics of distributed cracking. Appl. Mech. Rev 1986, 39, 675–705. [Google Scholar] [CrossRef]
  16. Bažant, Z.P.; Pijaudier-Cabot, G. Measurement of Characteristic Length of Nonlocal Continuum. J. Eng. Mech. 1989, 115, 755–767. [Google Scholar] [CrossRef]
  17. Pijaudier-Cabot, G.; Mazars, J.; Pulikowski, J. Steel-Concrete Bond Analysis with Nonlocal Continuous Damage. J. Struct. Eng. 1991, 117, 862–882. [Google Scholar] [CrossRef]
  18. Fichant, S.; La Borderie, C.; Pijaudier-Cabot, G. Isotropic and anisotropic descriptions of damage in concrete structures. Mech. Cohesive-Frict. Mater. 1999, 4, 339–359. [Google Scholar] [CrossRef]
  19. Zhou, X.; Feng, B. A smeared-crack-based field-enriched finite element method for simulating cracking in quasi-brittle materials. Theor. Appl. Fract. Mech. 2023, 124, 103817. [Google Scholar] [CrossRef]
  20. Matos, L.M.P.; Barros, J.A.O.; Ventura-Gouveia, A.; Calçada, R.A.B. Two-dimensional integrated mixed-mode smeared crack model for simulating FRC structures. Eng. Fract. Mech. 2023, 289, 109401. [Google Scholar] [CrossRef]
  21. Rossi, P.; Wu, X.; Le Maou, F.; Belloc, A. Scale effect on concrete in tension. Mater. Struct. 1994, 27, 437–444. [Google Scholar] [CrossRef]
  22. Phan, T.S.; Tailhan, J.L.; Rossi, P. 3D numerical modelling of concrete structural element reinforced with ribbed flat steel rebars. Struct. Concr. 2013, 14, 378–388. [Google Scholar] [CrossRef]
  23. Rossi, P.; Tailhan, J.L.; Desnoyers, D. Numerical models for designing UHPRFC-fibre-reinforced concrete structures: Why and which ones? Special Publication FIB Bulletin 79-ACI SP 2017, 310, 289–300. [Google Scholar] [CrossRef]
  24. Nader, C.; Rossi, P.; Tailhan, J.L. Multi-scale strategy for modeling macrocracks propagation in reinforced concrete structures. Cem. Concr. Compos. 2019, 99, 262–274. [Google Scholar] [CrossRef]
  25. Xu, P.; Ma, J.; Zhang, M.; Ding, Y.; Meng, L. Fracture Energy Analysis of Concrete considering the Boundary Effect of Single-Edge Notched Beams. Adv. Civ. Eng. 2018, 2018, 3067236. [Google Scholar] [CrossRef]
  26. Ravindra, G.; Bažant, Z.P.; Karr, M.E. Fracture Properties and Brittleness of High-Strength Concrete. ACI Mater. J. 1990, 87, 608–618. [Google Scholar]
  27. Bažant, Z.P.; Kazemi, M.T. Determination of fracture energy, process zone length and brittleness number from size effect, with application to rock and concrete. Int. J. Fract. 1990, 44, 111–131. [Google Scholar] [CrossRef]
  28. Le, J.L.; Bažant, Z.P.; Bazant, M.Z. Unified nano-mechanics based probabilistic theory of quasibrittle and brittle structures: I. Strength, static crack growth, lifetime and scaling. J. Mech. Phys. Solids 2011, 59, 1291–1321. [Google Scholar] [CrossRef]
  29. Rossi, P.; Acker, P.; Francois, D. Measurements of the fracture toughness KIC of concrete. In Proceedings of the 6th International Conference on Fracture, New Delhi, India, 4–10 December 1984; pp. 2833–2839. [Google Scholar]
  30. Rossi, P. Fissuration du bÉton: Du Matériau à la Structure-Application de la mÉcanique Lineaire de la Rupture. Ph.D. Thesis, L’Ecole Nationale des Ponts et Chaussées, Paris, France, 1986. [Google Scholar]
  31. Ramamurty, U. Mechanical Testing Methods of Fibers and Composites. In Encyclopedia of Materials: Science and Technology; Elsevier: Amsterdam, The Netherlands, 2001; pp. 5271–5274. [Google Scholar]
  32. Broughton, W. Testing the Mechanical, Thermal and Chemical Properties of Adhesives for Marine Environments; Adhesives in Marine Engineering, Woodhead Publishing Series in Welding and Other Joining Technologies; Woodhead Publishing: Cambridge, UK, 2012. [Google Scholar]
  33. Entov, V.; Yagust, V. Experimental investigation of laws governing quasi static development of crack in concrete. Mech. Solids 1975, 10, 87–95. [Google Scholar]
  34. Watson, K. The estimation of fracture surface energy as a measure of the “toughness” of hardened cement paste. Cem. Concr. Res. 1978, 8, 651–656. [Google Scholar] [CrossRef]
  35. Wittman, F. Mechanisms and mechanics of fracture of concrete. In Proceedings of the 5th International Conference on Fracture (ICF5), Cannes, France, 29 March–3 April 1981; Invited lecture. Volume 4, pp. 1467–1487. [Google Scholar]
  36. Walsh, P. Fracture of plain concrete. Indian Concr. J. 1982, 89, 469–476. [Google Scholar]
  37. Carpinteri, A. Experimental determination of fracture toughness KIC for aggregative materials. Adv. Fract. Res. 1982, 4, 1491–1498. [Google Scholar]
  38. Shah, S.P. Application of Fracture Mechanics to Cementitious Composites. In Proceedings of the NATO Advanced Research Workshop, Evanston, IL, USA, 4–7 September 1984. [Google Scholar]
  39. Reinhardt, H.W. The role of fracture mechanics in rational rules for concrete design. IABSE Period. 1 1986, 10, 1–15. [Google Scholar]
  40. Rossi, P. Fracture properties of concrete determined by means of wedge splitting tests and tapered double cantilever beams tests. Fracture mechanics test methods for concrete. In Proceedings of the RILEM Report 5; Shah, S., Carpinteri, A., Eds.; CRC Press: New York, NY, USA, 1991. [Google Scholar]
  41. Bazant, Z.; Oh, B. Crack band theory for fracture of concrete. Mater. Struct. 1983, 3, 155–177. [Google Scholar]
  42. Rossi, P. Determination of Toughness Characteristics of Concretes. Curr. Trends Civ. Struct. Eng. 2023, 10, 1–7. [Google Scholar]
Figure 1. Detail of the geometry and of the loading conditions related to the DCB specimen.
Applsci 14 00462 g001
Figure 2. An overview of the formulation of the 3D probabilistic macroscopic model for “semi-explicit” cracking of concrete is provided in this figure. (a) illustrates the material heterogeneity, while (b) shows the correlation between the degree of heterogeneity, volume effects, and the utilization of random mechanical properties distribution. (c) presents the random distributions and the elementary behavior of energy dissipation during damage evolution. Finally, (d) demonstrates an example of the global behavior obtained using the Monte Carlo method.
Applsci 14 00462 g002
Figure 3. 3D Finite element mesh of the DCB specimen—frontal and 3D view.
Applsci 14 00462 g003
Figure 4. Loading force versus notched opening displacement curves—numerical and experimental results.
Applsci 14 00462 g004
Figure 5. Example of numerical crack propagation pattern.
Applsci 14 00462 g005
Figure 6. Loading force versus notched opening displacement curves—Numerical and experimental results from [12].
Applsci 14 00462 g006
Table 1. Description of the mixtures used to determine Equation (2) and perform the validation.
ConstituentConcrete 1Concrete 2
Quantity
Aggregate 1 (4–12 mm)1105 kg/m3-
Aggregate 2 (5–20 mm)-1265 kg/m3
Sand (0–5 mm)700 kg/m3652 kg/m3
Cement400 kg/m3421 kg/m3
Water190 L/m3112 L/m3
Silica fume-42.1 kg/m3
Superplasticizer (dry powder)-7.6 kg/m3
Disclaimer/Publisher’s Note: The statements, opinions and data contained in all publications are solely those of the individual author(s) and contributor(s) and not of MDPI and/or the editor(s). MDPI and/or the editor(s) disclaim responsibility for any injury to people or property resulting from any ideas, methods, instructions or products referred to in the content.

