Abstract
Many studies have revealed the benefits of augmented reality (AR) to enhance productivity and fulfill a quality function in industry. Yet, the potential adverse effects of AR, such as physical stress, have not been extensively studied. This study investigates the effect of task difficulty (simple versus complex maintenance tasks) on the overall performance and physical stress of individuals while interacting with multimedia instructions (i.e., AR via HoloLens versus. paper-based guidance). Twenty-eight healthy male participants with a mean age of 32.12 years (standard deviation of 2.45 years) were randomly assigned to two groups: AR-based group and paper-based group. The metrics of total maintenance time, NASA-TLX scores, and heart rate variability (HRV) were used to evaluate overall performance, perceived workload, and physical stress, respectively. The findings suggest that AR-based instruction for a complex task significantly reduced both total maintenance time (by 14.94%) and physical stress in comparison with paper-based instruction. Paper-based instruction was found to destabilize heart rhythm, increase heart rate, and cause a shift in autonomic balance due to heightened sympathetic nerve activation. This study concludes that AR-based instruction is more efficient and less stressful than paper-based instruction, indicating that the AR system may offer independent benefits in reducing physical workloads.
1. Introduction
Industrial maintenance and assembly tasks are extremely challenging operations that require physical abilities such as fine motor control and bimanual coordination. These tasks can overwhelm employees who must perform many actions requiring a lot of effort in a short period [1]. AR systems are now extensively used as an effective guiding tool for extremely challenging maintenance tasks [2,3,4,5,6,7,8,9,10,11,12]. Compared to traditional assistance techniques for delivering instructions and job-relevant information, AR tools have been found to be more engaging, leading to increased productivity and fulfilling a quality control function [13,14,15,16,17,18,19]. Furthermore, for more challenging tasks requiring strategic planning and intensive problem solving, AR methods have shown considerable benefits over conventional methods by enhancing the cognitive comprehension of tasks [6]. Previous studies have primarily focused on the efficacy of AR in terms of task completion time, success rates, and various subjective measures [9,10,11,20,21,22,23,24,25,26,27,28,29,30,31,32]. It is, however, uncertain whether using AR instruction can lead to adverse effects such as motion sickness, increased mental workload, increased physical stress, and visual fatigue [33,34,35,36,37]. As the AR industry grows, it is essential to address potential safety concerns like physical stress associated with AR instruction.
Physical stress can be defined as a complex state that can influence an individual’s ability to remain alert and attentive [38] depending on task characteristics, conditions, and the individual. In the field of human factors research, one area of special importance is measuring physiological stress utilizing physiological indicators. It is, therefore, quite essential that the measurement methods used are accurate. The most frequent physiological method used for measuring physical stress is heart rate variability (HRV), which is extracted from an electrocardiogram (ECG) [39,40,41]. An ECG represents the graphical record of an individual’s heart’s electrical activity, produced by the depolarization and repolarization of the atria and ventricles [42]. HRV is the variation in the time intervals between consecutive heartbeats [43] and can be used as a sensitive diagnostic technique for monitoring the activity of the autonomic nervous system (ANS) in stressful situations [16,44]. The central nervous system’s autonomic branches affect the electrical activity of the heart through the sympathetic (SNS) and parasympathetic (PNS) divisions of the ANS, affecting heart rate (HR) and beat-to-beat rhythm. PNS activity promotes relaxation and regeneration, and SNS activity mobilizes the body for activities such as the ‘‘fight or flight’’ response [45,46]. The ANS plays a crucial role in stress and workload [37], making it an intriguing source of information to investigate. Signal fluctuations in the heart’s rhythm can be sent to the brain via the vagal nerve terminals, leading to increased emotional stress and a reduced cognitive capacity for processing visual information [44,47,48,49]. It has been found that the cognitive and neurological functions of humans can influence their cardiac rhythm [50]. Conversely, the sensory input of the heart can also affect performance, cognitive functions, and working memory [47].
Previous studies have used HRV indicators to examine the physical stress associated with stereoscopic displays [40,44,49,51,52]. For instance, Tumler et al. [16] objectively evaluated user strain during picking tasks in an industrial warehouse while using either an AR system or a simple paper list instruction, with measurements based on HRV. Their results showed that long-term use (two hours) of the AR system did not significantly increase overall strain. The variation in stress induced by the AR system was similar to that produced by the paper list method. Park et al. [44] assessed 3D visual fatigue using heart rhythm and humans’ autonomic balance. Their study showed that viewing 3D video destabilizes heart rhythm, increases heart rate, and causes a shift in autonomic balance due to increased activation of the sympathetic nerves. Ramadan and Alhaag [49] evaluated the physical stresses associated with viewing 3D and 2D displays using HRV. Their results indicated that viewing the 3D displays significantly increased physical stresses compared to 2D displays. This was evidenced by significant increases in HR and decreases in the standard deviation of heart rate (STDHR), mean time between heartbeats (m-RR intervals), very low frequency (VLF) power, and LF/HF power when viewing 3D displays compared to 2D displays. Yuan et al. [52] studied visually induced motion sickness (VIMS) and the visual impacts of head-mounted displays (HMDs). They showed that the experience of HMDs caused higher visual discomfort (i.e., simulator sickness and visual strain) compared to the experience of TV and desktop displays. Their evaluation, however, was limited to research using HMDs for virtual reality. Gao et al. [51] assessed visual fatigue when viewing virtual magic cube tasks through optical see-through HMDs (OST-HMDs) compared to viewing real objects in the real world. They found that participants were more likely to experience discomfort when viewing virtual objects presented by OST-HMDs. Also, their study provided suggestions that HRV measures could be used to explore how visual fatigue is induced by AR content.
Increasing task difficulties has been reported to cause an increase in HR [53]. Also, HR has been found to increase during multitasking conditions [54] or when an additional memory load is introduced [55]. RR intervals have been observed to decrease during complex tasks compared to simple tasks [56]. An increased mean HR was found during a Stroop test, and a reduction in high-frequency (HF) power was noted, with a large reduction in low-frequency (LF) power seen during tasks of high complexity [57]. The same findings regarding LF power were also reported by Splawn and Miller [39] and Lehrer et al. [58] with regard to increased task difficulties. The LF/HF ratio of HRV spectra is a proxy for the degree of sympathovagal balance present in healthy individuals [59]. It has been suggested that the standard deviation of RR intervals (SDRR) is the best indicator of total HRV (overall autonomic activity). While LF has been primarily utilized as a measurement of sympathetic modulation activity, HF, RMSSD, and PNN50 have been used as indicators of vagal modulation activity [44,49].
In the comparison of AR against traditional instruction in previous studies, there is a substantial paucity of experiential data from user studies assessing the potentially negative consequences of AR-based training techniques. Furthermore, the comparisons and evaluations were mostly accomplished with non-industrial products using tasks with low levels of difficulty and few variations, which may not be representative of real industrial settings [60,61,62]. Consequently, the conclusions drawn from such studies are limited and specific, and may not apply to the wide variety of tasks in industrial settings, particularly where there is a high degree of product variability. To gain a deeper understanding of the features of AR-based instruction methods compared to paper-based approaches, it is beneficial and important to address more thoroughly the potential negative impact of AR-based instruction methods using objective techniques.
To better reflect actual industrial situations, the design of the experiment should involve a variety of complex tasks such as fitting, screwing, fastening, etc. Hence, this research is essential as it will contribute to the body of knowledge by advancing our understanding of how to evaluate the effects of AR systems on a user’s physical stress while performing maintenance tasks. As a result, the main goal of this research is to assess the impact of various guidance techniques (i.e., AR-based and paper-based guidance) and task difficulty on human performance and physical stress. Human performance as a function of different training methods was measured by total guidance time, while physical stress was evaluated using HRV.
This research aims to answer the following question: How do AR-based guidance techniques influence human physical stress, perceived workload, and user task performance (i.e., task completion time) across a range of task difficulties? For maintenance guidance, it was hypothesized that AR-based engagement would be more efficient and successful than traditional paper-based techniques. Therefore, AR-based interactions were expected to result in lower physical stress and perceived workload and improved performance in the experimental maintenance tasks compared to paper-based interactions.
2. Materials and Methods
2.1. Participants
A total of 28 male college students were recruited from King Saud University. The participants had a mean age (SD) of 32.12 (2.45) years, weighed an average of 71 (9.80) kg, and had a mean height of 168.13 (3.72) cm. According to the results of the self-report screening survey, all the participants were in good health, had normal vision, did not have any diseases of the nervous system, had no history of neck or shoulder pain issues, and had no other type of musculoskeletal injury. Furthermore, none reported experiencing any kind of sleep disruption during the prior two weeks.
Participants were requested not to eat or smoke for at least two hours prior to the data collection session. They were also instructed to avoid any strenuous physical activity the day before the experiment and maintain their typical sleep pattern (approximately six hours of sleep each night). Only individuals who had either no previous information or a minimal amount of prior knowledge about the activity that needed to be completed were asked to take part in the experiment.
2.2. Experiment Variables
2.2.1. Maintenance Tasks
This study focused on the overhaul maintenance activities of a piston pump, including the repair of the gearbox (a complex task) and the inspection of the seal of the pump housing (a simple task). The piston pump housing and the gearbox in their fully assembled state are shown in Figure 1.
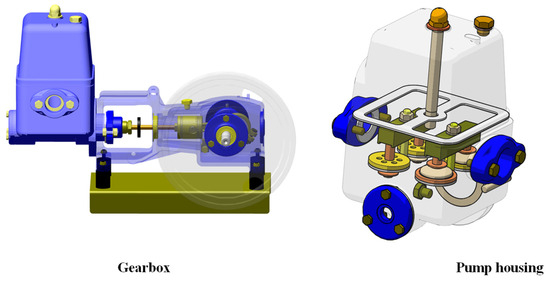
Figure 1.
Fully assembled state of the gearbox and pump housing of piston pump.
Figure 2 presents the exploded view of the piston pump gearbox (for the complex task). In this complex task, individuals were required to fix the piston pump gearbox and inspect all its seals. This task involved 32 sets of components that needed to be assembled in 40 stages using a soft hammer, screwdriver, jig, puller, and open-ended wrench. Figure 3 shows an exploded view of the pump housing (for the simple task). The simple task required individuals to verify all pump housing seals during the disassembly of their parts. This task was less demanding than the complex task as it involved fewer steps (26), unspecialized hand tools, and lightweight components. The degree of complexity and the details of the steps for the two tasks are thoroughly described and evaluated experimentally in studies by Alhaag et al. [1] and Alessa et al. [63].
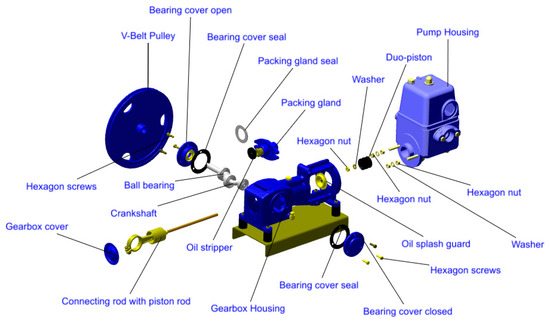
Figure 2.
Exploded view of the piston pump gearbox (complex task).
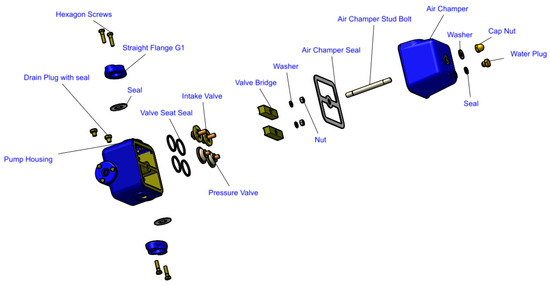
Figure 3.
Exploded view of the pump housing (simple task).
2.2.2. Instruction Methods
Both paper-based and AR-based instructions were created for this study to instruct the individuals on how to properly execute the maintenance activities. Paper-based instructions were provided on a folder of A4 paper, with one page dedicated to every two steps, and were adapted directly from the piston pump’s manual. Each step of the paper instructions had photos, written details, and the necessary tools that were required for each step; see Figure 4.
Figure 4.
Example of paper-based instruction for simple task (pump housing maintenance).
For the complex task, paper-based instructions spanned 22 pages and included 40 individual steps to carry out. For the simple task, paper-based instructions spanned 14 pages and had a total of 26 individual steps. An example of one participant employing the paper-based instruction method to complete the simple task is shown in Figure 5.
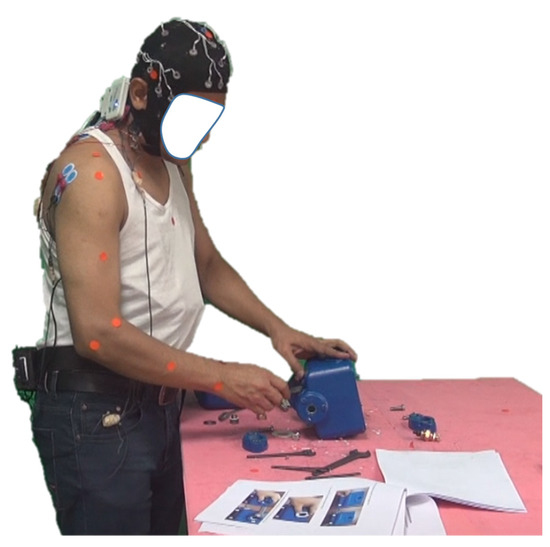
Figure 5.
Participant employing paper-based instructions to complete the simple task.
The AR-based instructions were developed using Creo Illustrate and Vuforia Studio software (2019 version) for generating the maintenance steps and the AR experience, respectively. In addition, JavaScript was utilized to create the essential characteristics of AR apps. Figure 6 gives an overview of the implementation of the AR-based maintenance instructions. For displaying the AR instruction, the Vuforia View app stored on the Microsoft HoloLens (1st gen) was used for scanning specific quick responses (QRs), as shown in Figure 7.
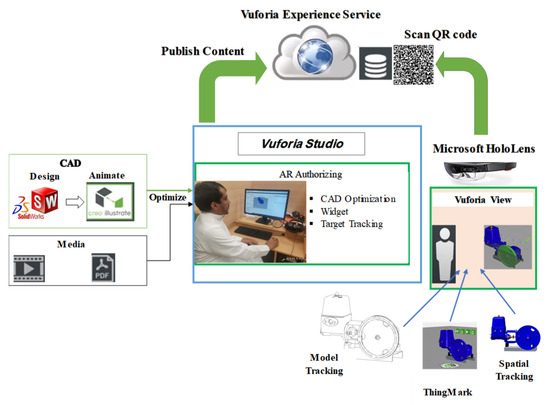
Figure 6.
Workflow for the building of the AR-based maintenance instructions.

Figure 7.
Quick response (QR) codes created by PTC software version 9.2.2. Note the hexagonal-shaped QR code, which allowed a device to access the correct augmented reality experience.
The 3D animated maintenance sequence was delivered to the participants’ surroundings using the first-generation Microsoft HoloLens (Microsoft, 2019), as presented in Figure 8. In this method, participants could experience the digital model interacting with the real environment. For instance, they placed the model in the recognized marker 130 cm away from them on the maintenance desk.
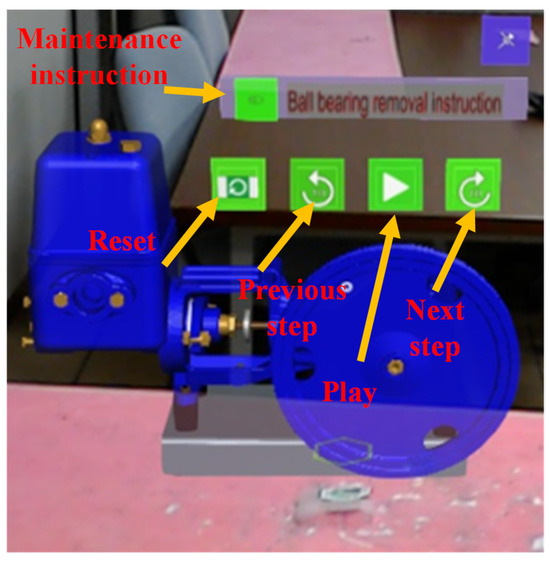
Figure 8.
AR experience for a complex task.
The interaction technique for the proposed AR application employed head movement tracking, letting users manipulate the maintenance 3D animation sequence using 3D buttons. To trigger the maintenance steps, the users merely needed to move their heads to manipulate a pointer and point to a 3D button. The user could navigate through the instruction sequence in the application using 3D buttons to obtain guidance on the current step, move to the next or previous step, and rapidly go to any step. Figure 9 presents an example of one participant performing the complex and simple tasks via the AR method.

Figure 9.
Participant employing AR techniques to complete some steps of the complex and simple tasks.
To minimize the impact of varying AR systems and instruction formats on the reproducibility of this study, the experimental protocol incorporated an AR system that is a market leader known for setting industry standards. Additionally, a standardized presentation style for both digital and manual instructions was employed to reduce design variability. However, it is recognized that different AR systems and instructional formats could yield different outcomes. Therefore, the results should be interpreted with the understanding that they might vary under alternative conditions, and further research is encouraged to investigate a range of technologies and presentation styles to better ascertain the generalizability of these findings.
2.3. Experimental Design
This experiment was represented by a 2 × (2 × 14) mixed design. The difficulty of the maintenance tasks, with two levels (simple and complex tasks), was treated as a within-subject factor. The instruction techniques, with two levels (AR-based instructions and paper-based instructions), were treated as between-subject factors. Task complexity was counterbalanced across participants to avoid order effects. The dependent variables for this design included the overall task time, the perceived workload as measured by the NASA TLX, and heart rate variability (HRV).
2.4. Response Variables
2.4.1. Human Performance
Performance was measured in terms of total task time, which represents the overall duration taken to accomplish the work while following the guidelines. This duration was captured using a camera system in conjunction with a stopwatch.
2.4.2. Perceived Workload (NASA-TLX)
The NASA-Task Load Index developed by Hart [64] was utilized to assess participants’ levels of mental workload. The questionnaire includes six questions, each designed to measure different factors such as mental and physical workload, temporal demands, performance, effort, and frustration level. Participants used a workload rating scale of 0–20 (1 being low and 20 being excessive) to score each element. The total estimated workload was calculated by averaging the six indicators.
2.4.3. Physical Stress
The HRV parameters of the ECG were used to assess user stress during the performance of the tasks under the different instruction methods. A one-channel MT-ECG-1 preamplifier (Mega Electronics Ltd., Kuopio, Finland) with three lead wires was used to record the ECG signals. Ag/AgCl solid, adhesive, pre-gelled electrodes were positioned on the participants’ chests to reduce the occurrence of muscle contraction artifacts during the task [65] (see Figure 10). Mega Win 3.0.1 software (Mega Electronics Ltd., Kuopio, Finland) was used to acquire the ECG signals at a sampling rate of 1000 Hz with a resolution of 12 bits. Before any further processing, the quality of the signal was visually inspected.
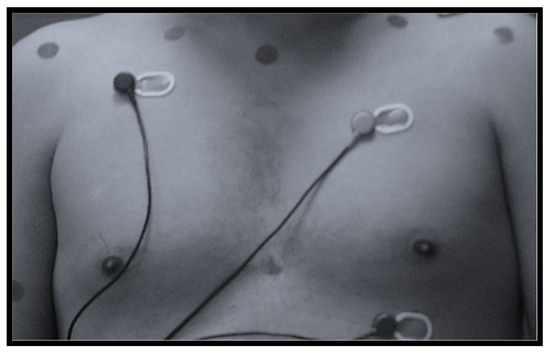
Figure 10.
ECG electrode placement.
To decrease high-frequency noise, the ECG signals were preprocessed via a 40 Hz cutoff low-pass filter. In addition, a 0.3 Hz cutoff high-pass filter was implemented to attenuate baseline wander. ECG signals were processed using Kubios HRV Analysis Software version 2.2 [63]. The processing workflow of the ECG data is outlined in Figure 11. The ECG processing started with the previously filtered signals and the detection of the QRS complexes(the depolarization of the ventricles).
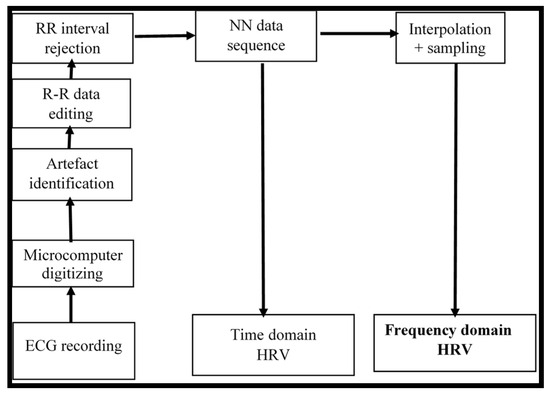
Figure 11.
Steps used for processing the ECG signals to obtain HRV analysis.
Time series analyses of HRV began with the elimination of artifacts caused by erroneous RR intervals (i.e., falsely detected QRS complexes) [59,66]. Artifacts in recorded ECG signals can cause significant distortion to ECG results [59]. The important part of the analysis focused on achieving two types of parameters: time domain and frequency domain features. A useful reference about the interpretation, measurement, and medical use of HRV can be seen in [59,67]. Artifact beats were filtered out from the recorded ECGs by deleting RR intervals that deviated by more than 25% from one another [66]. For the data length to stay constant (i.e., with the same number of beats), the removed RR intervals were substituted with values obtained by linear interpolation. Low-frequency disturbances in the baseline trend were eliminated using the smoothness prior approach with a Lambda of 1000 [68,69].
Within the HRV time domain, three types of variables were analyzed in this study: statistical, geometrical, and nonlinear. For statistical parameters, the mean RR interval (m-RR, in ms), standard deviation of normal-to-normal RR intervals (SDRR), mean heart rate (m-HR, in BPM), standard deviation of heart rate (SDHR), root mean square of successive RR interval differences (RMSSD, in ms), and percentage of RR intervals differing >50 ms from the preceding one (pNN50) were computed. Geometrical features involved calculations on the HRV triangular index and the triangle base used to represent the RR time series histogram (TINN). Nonlinear HRV features such as sample entropy (SaEn), SD1, SD2, and approximate entropy (ApEn) were also calculated.
A frequency domain analysis was also performed on the ECG data using fast Fourier transformations (FFT). [70]. The non-equidistant beat-by-beat time series was converted into a new time series sampled at uniform intervals using a quadratic interpolation at 4 Hz [71,72]. Subsequently, any possible trends in the signals were eliminated by detrending, and the variations in the signals were extracted by suppressing the mean [73]. Power spectra of the periodic oscillations were obtained using the Welch’s periodogram function with a 256 s window and 50% overlap, allowing for a frequency resolution of 0.015 to 0.02 Hz [72]. Frequency domain parameters were computed by dividing the RR time series PSD into three frequency bands, with the spectral power being the area below the power spectral density (PSD) for each period.
Frequencies below 0.04 Hz were considered very low frequency (VLF). The area under the PSD from 0.04 Hz to 0.15 Hz was computed to yield the low-frequency power (LF), and the same process from 0.15 Hz to 0.4 Hz yielded the high-frequency power (HF). The low-to-high frequency power ratio (LF/HF) of HRV spectra is often used as an indicator of sympathogal balance in healthy individuals. Specifically, LF was utilized to represent sympathetic modulation activity, while HF was considered to represent vagal modulation activity [59]. From the frequency domains, the relative powers of the LF bands and HF bands and the low-to-high frequency (LF/HF) ratio were used in the analysis.
2.5. Experimental Procedure
Each participant, before participating in the experiment, read and signed an informed consent form approved by the Institutional Review Board at King Saud University (code: E-19-4467). Upon arrival, a general health questionnaire was given, and the study’s rationale was thoroughly explained. Participants also completed surveys regarding their prior experience with AR in a maintenance context. Subsequently, participants were randomly divided into two groups. The first group received AR training using Microsoft HoloLens1 (first version, Microsoft, 2019) on the maintenance steps, including a 10–15 min familiarization session with HoloLens and its features [6,10]. A scooter disassembly and assembly demo was used for this process, and they were taught the proper use of the toolkit. The second group received written instructions on A4 paper for the tasks. After becoming comfortable with the assigned guidance methods, either HoloLens or paper instructions, participants returned the next day to perform the maintenance tasks using their respective methods.
On the following day, Ag/AgCl electrodes for the ECGs were attached to participants’ chests. Baseline data consisting of three minutes of ECG signal were acquired while they were in a resting position. ECG signals were also collected during each training procedure and maintenance activity. Participants in Group 1 (the AR-based guidance group) were randomly assigned either a complex or a simple task to complete using AR instructions, as shown in Figure 12. Tasks were assigned in various sequences using a counterbalancing strategy to eliminate task order impact, with either AB or BA sequences (A and B representing complex and simple tasks, respectively). In the AB sequence, fifty percent of the participants in Group 1 first performed a complex task. The BA sequences were given to the remaining participants to carry out the simple task first. In this session, individuals completed half of the experiment (a simple or complex task).
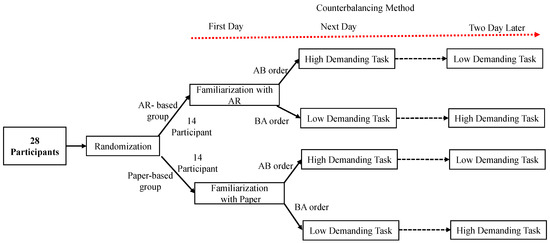
Figure 12.
Experimental sequences.
The second session of the experiment required participants to return to the lab two days later to complete their remaining task (simple or complex) following AR instructions (for Group 1) or paper instructions (for Group 2), as shown in Figure 12. Signals were recorded for an additional three minutes at the end of each session. After that, participants filled out NASA Tlx questionnaires, measuring their personal perception of the task and its execution in terms of perceived effort. Participants were acknowledged once all sessions were completed and the electrodes were taken off.
2.6. Statistical Analysis
SPSS Statistics software (version 23.0; IBM Inc., Armonk, NY, USA) was used for statistical analysis, with a significance level of 0.05. The normality assumption across all experimental conditions was verified using Kolmogorov–Smirnov tests [74]. All response variables were not statistically significant (p > 0.05) based on the Kolmogorov–Smirnov tests. Mauchly’s test of sphericity was conducted on all responses across all variables to ensure that the variance homogeneity assumption was met. Given its binary nature (two levels), sphericity analysis confirmed that the primary assumption was satisfied.
To examine the main and interaction effects of the instructional approach and task complexity on task completion time, HRV, and perceived workload (NASA TLX), a two-way analysis of variance (ANOVA) with a repeated measures methodology was performed. Simple effect analysis further investigated the significance of the observed interaction effects. To identify significantly differing task difficulty permutations, a paired t-test was performed. Pairwise evaluations of the interaction effects using an independent sample t-test were carried out to determine the substantially different permutations of the training strategies. Calculations were made to determine the descriptive statistics (mean and standard deviation) of each dependent variable. In addition, the effect size was determined using the partial eta-squared value (η2) representing the proportion of total variation in the dependent variables attributable to the specific independent variable.
3. Results
3.1. Performance
The mixed ANOVA showed that task difficulty significantly impacted total time {F (1,26) = 286.30, p = 0.00, η2 = 0.92}. Maintenance time increased from simple to complex tasks {mean: 13.34 versus 26.62}, regardless of instruction method. Time to completion was also significantly affected by the interaction between the method of instruction and task complexity {F (1,26) = 7.23, p = 0.012, η2 = 0.22}. Higher completion times for complex tasks were found with both AR-based guidance (24.48 versus 13.30, t (13) = 29.18, p = 0.00) and paper-based guidance (28.76 versus 13.36, t (13) = 10.09, p = 0.00). The AR instruction group finished the complex task faster than the paper instruction group. While the AR group completed the simple task slightly faster than the paper-based group, the difference was not statistically significant (p > 0.05). Overall, the study found that AR reduced completion time for complex tasks.
3.2. Perceived Workload (NASA-TLX) Scores
The NASA TLX workload questionnaire measured participants’ perceived workload [64]. As shown by the arrows in Figure 13, a higher total score reflected a larger perceived load, except for the performance subscale, where a higher total score indicated a lower self-reported level of success with the task. The main effect of task complexity was significant on the mental load {F (1,26) = 939.92, p = 0.000, η2 = 0.97}, physical load {F (1,26) = 202.59, p = 0.000, η2 = 0.90}, temporal load {F (1,26) = 202.08, p = 0.000, η2 = 0.90}, performance {F (1,26) = 15.30, p = 0.001, η2 = 0.40}, effort {F (1,26) = 38.91, p = 0.000, η2 = 0.60}, and frustration {F (1,26) = 125.00, p= 0.000, η2 = 0.83} subscales as well as overall mean NASA-TLX scores {F (1,26) = 672.45, p = 0.000, η2 = 0.96}. Throughout the complex task, scores increased across the subscales. It was found that there was a considerable influence that instruction technique had on performance {F (1,26) = 25.46, p = 0.000, η2 = 0.50}, frustration {F (1,26) = 70.08, p = 0.00, η2 = 0.73}, and overall mean NASA-TLX scores {F (1,26) = 9.34, p = 0.005, η2 = 0.26}, with these scores being higher for paper-based instruction.
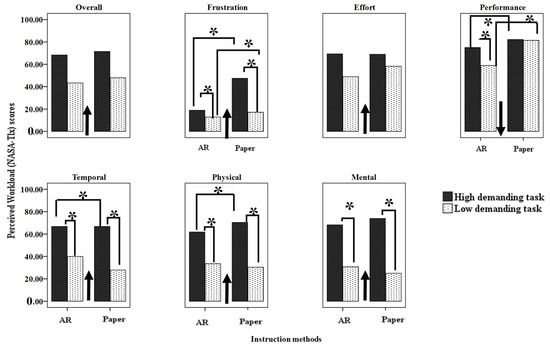
Figure 13.
The interaction effects of task complexity and instruction method on NASA-TLX subscores. Arrows indicate a greater perceived load. Error bars represent a 95% confidence interval. Columns connected with lines and “*” marks are significantly different from each other.
All NASA-TLX subscales, except for effort and the overall mean, showed statistically significant interactions between task complexity and instruction technique (p > 0.5). The interaction effects of task complexity and instruction method on the NASA-TLX results are presented in Figure 13. The paired t-test revealed that as task complexity increased, so did average scores of mental and physical load, performance, and frustration for both approaches of instruction. When participants were given written instructions for a complex task, they reported significantly higher levels of physical workload, performance, and frustration. There was no statistically significant difference in mental load between AR and paper-based guidance for either simple or complex tasks (p > 0.05). Also, physical load did not significantly differ across groups when performing the simple task.
3.3. Physical Stress
The HRV parameters from the ECGs were used to assess user stress during task performance under the different instruction methods. Statistical analysis results for all HRV parameters are demonstrated in Table 1. For time domain characteristics, the RMSSD and SD1 were significantly affected by the instruction approach (p < 0.05). The m-RR, m-HR, SDHH, RMSSD, HRV triangular index, TINN, SD1, ApEn, and SampEn were significantly affected by task complexity (p < 0.05). Statistical analysis of the interaction effects indicated that m-RR, m-HR, SDHH, RMSSD, TINN, and SD1 were all significantly different depending on whether the instruction was paper- or AR-based and whether the task was simple or complex (p < 0.05). Figure 14 shows the significant interaction effects of the instruction methods and task complexity on m-RR interval, m-HR, SDHR, RMSSD, TINN, and SD1. The results revealed that for the paper group, performing the complex task resulted in significantly lower m-RR, RMSSD, and SD1 values and higher m-HR, SDHR, and TINN values compared to the simple task. However, using AR-based instruction for either the complex or the simple task did not yield any significantly different results (p > 0.05). Comparing paper-based and AR-based instructions for the complex task showed a statistically significant difference (p < 0.05).

Table 1.
Mean (SD) and statistical results for HRV responses across experimental tasks. Bold p-values indicate a significant difference. Bolded p-value, and background color indicate a significant effect. Note: η2 is partial eta squared.
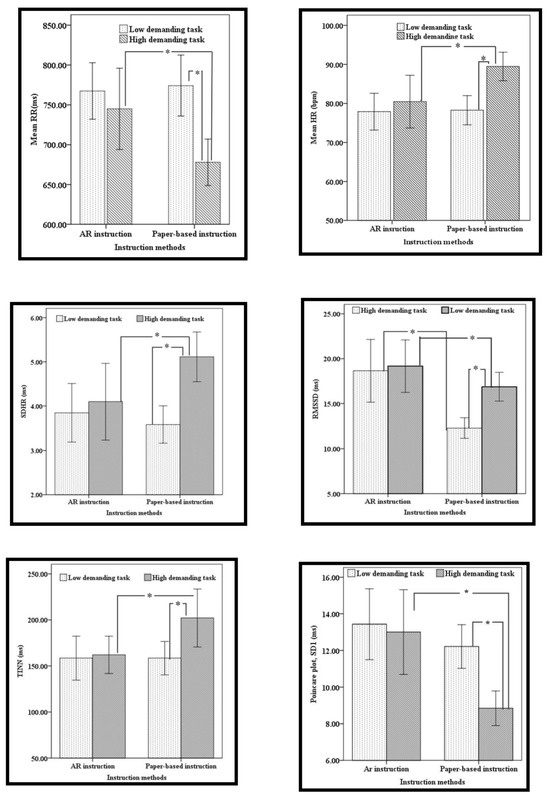
Figure 14.
Interaction effects of instruction approaches and task complexity on m-RR interval, m-HR, SDHR, RMSSD, TINN, and SD1. Error bars represent a 95% confidence interval. Columns connected with lines and “*” marks are significantly different from each other.
For the frequency domain variables of HRV, task complexity had statistically significant effects on LF, HF, and the LF/HF ratio (p < 0.05). Interaction effects between instruction methods and task complexity significantly influenced LF, HF, and the LF/HF ratio (p < 0.05). Figure 15 shows these interaction effects on LF, HF, and the LF/HF ratio, respectively. Pairwise tests revealed that performing the complex maintenance task using paper-based instruction resulted in higher HF/LF ratios and LF values and lower HF values compared to the simple task (p < 0.05). No significant change was seen in LF, HF, or the LF/HF ratio when using AR-based instruction for either simple or complex tasks (p > 0.05). However, there was a significant difference between AR and paper-based instruction for the complex task (p < 0.05), but no significant difference was found for the simple task (p > 0.05).
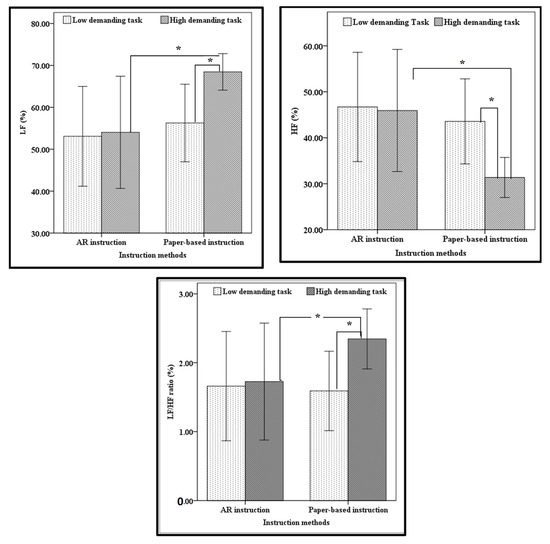
Figure 15.
Interaction effects between instruction methods and task complexity on HF, LF, and the LF/HF ratio. Error bars represent a 95% confidence interval. Columns connected with lines and “*” marks are significantly different from each other.
4. Discussion
The goal of this research was to compare physical workloads, human performance, and perceived workloads during maintenance tasks, considering the variables of instructional methods (paper-based versus AR-based) and task complexity (simple versus complex). Current methodologies of tracking user interactions with AR systems are largely subjective, necessitating the development of sensitive and accurate methodologies to evaluate user workload during routine maintenance tasks. The findings from this study significantly contribute to our understanding of how physical workloads vary when using AR systems for training. Specifically, they provide insights into the differential impacts of paper-based and AR-based instructions on workload and performance during maintenance and assembly tasks. These insights are crucial for developing more effective and user-friendly AR training systems for complex and simple tasks alike.
4.1. Performance
This study compared the effectiveness of AR-based instructions to paper-based methods in terms of task completion time. Notably, completion times varied between maintenance tasks, with a significant increase (50%) from simple to complex tasks across all instruction types. Both AR (24.48 vs. 13.30 min) and paper-based (28.76 vs. 13.34 min) instructions required considerably more time to complete complex tasks than simple ones. However, while completion times for simple tasks were similar with both methods, completion times with AR-based instruction were significantly faster for complex tasks. These results indicate that AR-based instruction during complex activities can greatly shorten maintenance times. It may be claimed that paper-based instructions may be less efficient for challenging tasks because they require the user to browse the paper and extract information from the material. In contrast, AR-based instruction systems offer a variety of features that can be displayed upon request. Therefore, while AR did not enhance performance for simple tasks, it proved significantly more efficient for more challenging tasks.
This study supports previous findings [21,75,76,77,78]. Wiedenmaier et al. [21] observed that paper manuals and AR support were equally effective for simple tasks, but AR support outperformed paper-based support for complex tasks. Deshpande and Kim [79] discovered that using paper instructions for assembly activities with a modest level of complexity was more time-consuming than following AR instructions. Similarly, Mengoni et al. [75] reported minor improvements when applying AR to tasks of low complexity compared to traditional approaches, while AR was found to be more effective when applied to more complicated activities, as indicated by Alves et al. [77]. Bendzioch et al. [78] investigated the influence of product difficulty (difficult, medium, and easy) on task completion time with different instruction types (AR, tablet, projection, and paper instructions). They found that compared to paper instructions, using AR glasses resulted in time reductions of 3.16%, 9.51%, and 9% for easy, medium, and difficult tasks, respectively [78].
4.2. Perceived Workload (NASA-TLX) Scores
The results indicated that using paper-based methods for complex tasks increased the mean score ratings of physical demand, performance, and frustration compared to AR-based instruction. For the complex task, the AR instruction method reduced physical workload by 12.18%, performance improved by 8.69%, and frustration improved by 60.14%. AR instruction resulted in greater temporal demand ratings and worse performance ratings for the simple task than paper instruction. AR instruction for the simple task increased temporal demand by 43.63% and decreased performance and frustration by 27.64% and 24.97%, respectively, compared to paper-based instruction. Overall, the AR-based method reduced performance, frustration, and mean scores by 18.13%, 50.82%, and 6.50%, respectively. Additionally, it was observed that the average ratings for mental workload, physical workload, temporal demand, and frustration all rose as the task difficulty went up, regardless of which instruction method was used. Some previous studies have shown that the utilization of AR for the purpose of delivering visual assistance and task-specific information has been found to effectively decrease cognitive load and result in enhanced performance [15,80,81]. Conversely, several studies have indicated that AR may be seen as mentally demanding and consequently result in diminished performance [82,83]. The outcomes of this study align with the findings from previous research [15,80,81]. It was demonstrated that factors such as the type of AR display device used, the relevance and timeliness of the content, the manner of information presentation, and user and task characteristics all profoundly influence mental effort and task performance [84]. The observed discrepancies in results could potentially be attributed to variations in study types, technologies employed, and research strategies.
4.3. Physical Stress
HRV, as previously outlined, was used to assess the impacts of task complexity and instruction method on physical stress. The physical stress analyzed in this study represents the measurable portion of physical resources expended during the performance of the two maintenance tasks using different instruction methods. HRV analysis, derived from electrocardiogram (ECG) data, is a highly responsive diagnostic technique used to assess the activity of the autonomic nervous system (ANS) under stressful situations [85]. The ANS’s branches modulate the heart’s electrical activity via the sympathetic (SNS) and parasympathetic (PNS) divisions, influencing heart rate and rhythm. PNS activity promotes relaxation and regeneration and SNS activity mobilizes the body for activities such as the ‘‘fight or flight’’ response [45,46].
The time domain of HRV showed significant effects of task complexity on m-RR, m-HR, SDHH, RMSSD, HRV triangular index, and TINN. As task difficulty escalated from simple to complex, m-HR, SDHR, HRV triangular index, and TINN indicators increased, while m-RR and RMSSD indicators decreased, irrespective of the instructional approaches employed. This indicates that increased task complexity results in higher physical activity levels, leading to enhanced sympathetic activity through central and autonomic nervous system integration, a finding consistent with several other studies [86,87,88]. Paper-based instruction was associated with lower values of RMSSD compared to AR-based instruction, regardless of task complexity. The statistical analysis showed that for the paper-based instruction group, the complex task significantly reduced m-RR and RMSSD values and increased m-HR, SDHR, and TINN values compared to the simple task. Comparing the two instruction methods during a complex task, AR instruction significantly reduced physical workload level by an average of 13.66% (10.95% for m-RR, 10.09% for m-HR, 19.96% for SDHR, and 53.13% for RMSSD). However, no changes in physical workload were observed when comparing the two instructional methods for a simple task. In addition, using AR for both complex and simple tasks resulted in the same physical workload.
A higher workload has been reported to be associated with lower values of m-RR and higher values of m-HR [89], and a decrease in RMSSD of HRV has been used as an indicator of fatigue and stress [90,91]. The variations in the time domains of HRV in this study acted as indicators of a high physical workload that suggest increased sympathetic activity. The observed reductions in RMSSD indicated a decrease in vagal modulation of the HR [90,91,92]. Based on the time domain of HRV parameters, the results indicated that the utilization of AR training for the complex task led to a notable decrease in workload when compared to the traditional paper-based instruction approach. These results align with other research demonstrating a correlation between alterations in task difficulty and corresponding variations in physical load [93,94,95,96,97,98]. Furthermore, previous studies have reported that HR increases when task difficulty [53,99,100,101] or stressful conditions [102,103] increase. Theoretically, based on the measures used in this study, the complex task is associated with high stress levels, which explains the changes observed in the HRV time domain variables.
HRV analysis through nonlinear domains focuses on the complex time behavior of heart rhythm. The results demonstrated a statistically significant effect of task complexity on SD1, ApEn, and SampEn. These measures exhibited a drop in values during complex tasks in comparison to simple tasks, irrespective of the instructional techniques employed. Our findings are in line with those reported in previous studies [98,104]. Anishchenko et al. [104] found that nonlinear metrics decreased significantly during stressful conditions. The results also showed that for paper-based instruction, the SD1 value was significantly reduced when performing the complex maintenance task. However, with AR instruction, the SD1 values for both simple and complex tasks remained unchanged. The findings of this study indicate that participants experienced higher levels of stress when engaging in paper-based instruction during the complex tasks compared to both the simple task and the AR instruction-based technique tasks. Hence, the use of AR instruction for executing complex tasks substantially alleviated the physical workload. The observed reduction in complexity measurements indicates a shift towards more stability and periodicity in HR during periods of stress. This shift might be associated with enhanced regularity, the separation of interconnected networks, and the inactivation of control mechanisms within the cardiovascular system [105,106]. Such a decrease in HR complexity in response to stressful situations may indicate diminished flexibility and fitness of the cardiac pacemaker [107].
For the frequency domain variables of HRV, the results indicated that task complexity significantly influenced LF, HF, and the LF/HF ratio. As the task difficulty increased, HF decreased while LF and the LF/HF ratio rose. The results also showed that LF and HF/LF values were higher for the complex maintenance task while employing paper-based instruction, but HF values were lower. Moreover, performing the complex task using the paper instruction technique resulted in a higher HF/LF ratio and LF values and lower HF values compared to AR-based instruction. There was no significant difference between AR and paper-based instruction for the simple tasks, and no changes were seen between the complex and simple tasks when using AR-based instruction. This result is similar to those regarding the time domain of HRV, suggesting that the AR-based instruction technique was effective in dealing with increased maintenance task difficulty. The findings from the frequency domain parameters also showed that the mental and physical workloads for the challenging task were lowered by 46.27% when using AR instruction. The findings suggest that AR instruction is superior to paper instruction in boosting cognitive processing during complex tasks.
The parasympathetic nervous system, which influences the effect of breathing on HR and is represented as HF power [108], is characterized by respiratory sinus arrhythmia [109]. Parasympathetic modulation causes a rise in HR [108], observed while carrying out the challenging task using paper-based instruction. A further decline in HF power was noted during the complex task using paper-based instruction. This decline can be attributed to alterations in the breathing pattern resulting from the adoption of uncomfortable postures, such as frequent bending and reaching while utilizing paper instructions. The observed rise in LF power during the complex task involving paper-based instruction could also be attributed to the adoption of uncomfortable body positions. According to a study by [109], changes in body position were shown to greatly enhance power within the LF range. Furthermore, elevated LF is noted in several scenarios, including a 90-degree tilt of the head when the body is in a supine position, standing, experiencing mental stress, moderate exercise among healthy individuals, and participating in physical activity [59]. This could explain the higher LF power values when performing a complex task using paper instructions. Perini and Veicsteinas [94] observed a 2.5-fold rise in the LF/HF ratio during high-intensity exercise compared to resting levels. The LF/HF ratio was employed as an indicator of sympathetic activity and HF power was utilized to indicate parasympathetic activity in the evaluation of work stress [98]. Collins et al. [98] observed a significant increase in the LF/HF ratio and a decrease in HF power among those experiencing high levels of strain throughout workdays. This study also indicates that the LF/HF ratio exhibited an increase during the execution of complex tasks utilizing paper-based instruction, accompanied by a drop in HF power. These outcomes align with previously reported findings [98,110].
Overall, HRV indices are sensitive indicators of physical stress. The fluctuations in HRV delineate the duration of specific information extractions during engagement in cognitively demanding tasks. This phenomenon was further supported by an interaction effect seen with the instructional approach, which can be attributed to contrasting inclinations in the processing of difficult tasks. These findings revealed that using AR instruction significantly reduced the physical stress for the complex task, implying that AR instruction is better than paper instruction for complex tasks. In addition, the physical workload of the AR users decreased while participants performed the maintenance tasks, whether simple or complex. As the two tasks were performed in an AR setting, the HRV metrics remained approximately constant. In contrast, the HRV metrics increased when performing the complex task in a paper-based setting. This means that the instruction methods and thus the workloads increased with complex tasks but remained relatively constant for simple tasks. It is likely that the individuals had developed a level of familiarity with the nature of simple tasks and the corresponding processes of decision making, searching, and maintenance. This familiarity served to diminish the necessity for the further extraction of information. The AR system independently reduced the physical workload. The elevation in physical load resulted in a disruption of the homeostatic equilibrium, leading to subsequent allostatic adaptations. These adaptations, in turn, influenced the temporal spacing between R-peaks, therefore affecting HR and HRV parameters. HRV is recognized not only as a measure of ANS equilibrium but also as an indicator of central–peripheral neural feedback and the integration between the central nervous system (CNS) and the ANS [47,111].
There are some limitations to the current study that warrant mention. This research did not track how the participant’s upper body moved. Monitoring kinematic variances between individuals may help in understanding the variety of stiffness responses to complex tasks and different instructional approaches. In addition, all participants in this study were male. Future work should consider incorporating women and other physiological signals, such as upper arm muscular activity, into the evaluation. Furthermore, the age range, education level, and formation of the participants in this study were quite limited. Future investigations could benefit from exploring the implications of our findings for broader age groups and different participants with different education levels and formations. Also, while the current study provides insights into the effects of AR instructions, it is limited to short-term use. The long-term implications of daily, extended use of AR in occupational settings remain to be explored.
Another limitation of this study is the relative inexperience of the target participants. While this choice was deliberate to simulate a training scenario for new workers or for introducing new complex tasks, it may not fully represent the experiences of seasoned operators. To better generalize our findings, future research should include experienced participants. This will allow for a more comprehensive understanding of AR technology’s utility across different skill levels, particularly for training on new or complex tasks within industrial settings. A notable limitation arose from the specific selection and use of interface types (visual and auditory), technological tools (such as paper, HMD, laptop, and HHD), and research design choices (including between, within, or mixed designs). In this study, a mixed experimental design was implemented, incorporating one between-subject variable (instruction methods) and one within-subject variable (task complexity). Task complexity was counterbalanced across participants to avoid order effects. For future work, it would be worthwhile to consider other experimental designs that ensure both groups experience similar mental and physical loads associated with wearing the display, including potential restrictions on field of view (FOV) and head mobility. This could be achieved by having both groups perform one task with the AR display and one task with physical instructions, counterbalancing the order of the tasks and the use of AR or paper instructions. Future research should also consider employing tasks of equal cognitive complexity, such as assembling a Lego set or arranging pieces of an image (i.e., a puzzle).
The outcomes and conclusions derived in this study are largely contingent on these particular choices. Future studies involving a different combination of these elements might yield divergent results, emphasizing the unique context of this user study.
5. Conclusions
To address the knowledge gap in the literature regarding the efficiency and benefits of using AR tools as a training method, this study aimed to perform experiments on human subjects with different training methods and different levels of task complexity. The current study adopted the ECG measure approach to evaluate the workload of AR users on maintenance tasks. The findings indicate that for more challenging tasks, AR instruction has an essential benefit over traditional paper-based instruction in reducing both the time taken for maintenance and physical stress. AR resulted in a time reduction of 14.94% for complex tasks. Moreover, utilizing paper-based instruction led to an unstable heart rhythm, an increase in HR, and a shift in autonomic balance, primarily due to increased activation of the sympathetic nerves. The findings revealed that physical stress for AR users was reduced while they performed the two maintenance tasks. With both tasks performed in an AR setting, the HRV metrics remained approximately constant. This study concludes that AR-based instruction is more efficient and less stressful than paper-based instruction, indicating that AR systems may offer independent benefits in reducing physical workloads. Both subjective and physiological measures (ECGs) support these findings. HRV indices and frustration ratings strongly suggested an increase in physical stress when the participants performed a complex task using paper-based instruction. The current study adopted the ECG measure approach to evaluate the workload of AR users on maintenance tasks. This aids in understanding the benefits and drawbacks of AR instructional techniques, which are transforming traditional instruction systems. Moreover, the results of this study can help manufacturing stakeholders better understand the benefits of AR technology as an instruction tool for manual tasks. Furthermore, the present study’s results provide a foundation for the appropriate application of this technology in industrial sectors across the globe.
Author Contributions
Conceptualization, M.H.A.; Data curation, F.M.A. and M.H.A.; Formal analysis, M.H.A.; Funding acquisition, F.M.A.; Investigation, M.H.A.; Methodology, F.M.A. and M.H.A.; Project administration, M.H.A.; Resources, F.M.A. and I.M.A.-h.; Software, M.H.A. and M.M.N.; Supervision, F.M.A. and I.M.A.-h.; Validation, F.M.A., M.H.A., I.M.A.-h., M.M.N., H.K. and N.H.; Visualization, M.H.A. and H.K.; Writing—original draft, F.M.A. and M.H.A.; Writing—review and editing, F.M.A., M.H.A., I.M.A.-h., M.M.N., H.K. and N.H. All authors have read and agreed to the published version of the manuscript.
Funding
This study was funded by King Saud University Researchers Supporting Project.
Institutional Review Board Statement
This study was conducted in accordance with the Declaration of Helsinki and approved by the Human Participants Review Subcommittee of the Institutional Review Board at King Khalid University Hospital, College of Medicine, King Saud University (protocol code E-19-4467 and date of approval 23 January 2020).
Informed Consent Statement
Informed consent was obtained from all subjects involved in the study.
Data Availability Statement
All data supporting the reported results are included in the manuscript.
Acknowledgments
The authors appreciate the support from Researchers Supporting Project number (RSPD2023R814), King Saud University, Riyadh, Saudi Arabia.
Conflicts of Interest
The authors declare no conflicts of interest.
References
- Alhaag, M.H.; Ramadan, M.Z.; Al-harkan, I.M.; Alessa, F.M.; Alkhalefah, H.; Abidi, M.H.; Sayed, A.E. Determining the Fatigue Associated with Different Task Complexity during Maintenance Operations in Males Using Electromyography Features. Int. J. Ind. Ergon. 2022, 88, 103273. [Google Scholar] [CrossRef]
- Schwald, B.; De Laval, B. An Augmented Reality System for Training and Assistance to Maintenance in the Industrial Context. J. WSCG 2003, 11, 1–3. [Google Scholar]
- Haritos, T.; Macchiarella, N.D. A Mobile Application of Augmented Reality for Aerospace Maintenance Training. In Proceedings of the 24th Digital Avionics Systems Conference, Washington, DC, USA, 30 October–3 November 2005; Volume 1, p. 5-B. [Google Scholar]
- Moghaddam, M.; Wilson, N.C.; Modestino, A.S.; Jona, K.; Marsella, S.C. Exploring Augmented Reality for Worker Assistance versus Training. Adv. Eng. Inform. 2021, 50, 101410. [Google Scholar] [CrossRef]
- De Crescenzio, F.; Fantini, M.; Persiani, F.; Di Stefano, L.; Azzari, P.; Salti, S. Augmented Reality for Aircraft Maintenance Training and Operations Support. IEEE Comput. Graph. Appl. 2010, 31, 96–101. [Google Scholar] [CrossRef] [PubMed]
- Gavish, N.; Gutiérrez, T.; Webel, S.; Rodríguez-Arce, J.; Peveri, M.; Bockholt, U.; Tecchia, F. Evaluating Virtual Reality and Augmented Reality Training for Industrial Maintenance and Assembly Tasks. Interact. Learn. Environ. 2015, 23, 778–798. [Google Scholar] [CrossRef]
- Christian, J.; Krieger, H.; Holzinger, A.; Behringer, R. Virtual and Mixed Reality Interfaces for E-Training: Examples of Applications in Light Aircraft Maintenance. In Proceedings of the International Conference on Universal Access in Human-Computer Interaction, Beijing, China, 22–27 July 2007; pp. 520–529. [Google Scholar]
- Casado, S.; Engelke, T.; Gavish, N.; Gutiérrez, T.; Rodríguez, J.; Sánchez, E.J.; Tecchia, F.; Webel, S. A Training System for Skills Transfer Involved in Industrial Maintenance and Assembly Tasks. In Proceedings of the SKILLS Conference, Bilbao, Spain, 22 June 2009; pp. 129–134. [Google Scholar]
- Rios, H.; Hincapié, M.; Caponio, A.; Mercado, E.; Mendívil, E.G. Augmented Reality: An Advantageous Option for Complex Training and Maintenance Operations in Aeronautic Related Processes. In Proceedings of the International Conference on Virtual and Mixed Reality, Orlando, FL, USA, 9–14 July 2011; pp. 87–96. [Google Scholar]
- Werrlich, S.; Daniel, A.; Ginger, A.; Nguyen, P.-A.; Notni, G. Comparing HMD-Based and Paper-Based Training. In Proceedings of the 2018 IEEE International Symposium on Mixed and Augmented Reality (ISMAR), Munich, Germany, 16–20 October 2018; pp. 134–142. [Google Scholar]
- Werrlich, S.; Lorber, C.; Nguyen, P.-A.; Yanez, C.E.F.; Notni, G. Assembly Training: Comparing the Effects of Head-Mounted Displays and Face-to-Face Training. In Proceedings of the International Conference on Virtual, Augmented and Mixed Reality, Las Vegas, FL, USA, 15–20 July 2018; pp. 462–476. [Google Scholar]
- Watanabe, M.; Kaneoka, K.; Okubo, Y.; Shiina, I.; Tatsumura, M.; Miyakawa, S. Trunk Muscle Activity While Lifting Objects of Unexpected Weight. Physiotherapy 2013, 99, 78–83. [Google Scholar] [CrossRef] [PubMed]
- Söderberg, C.; Johansson, A.; Mattsson, S. Development of Simple Guidelines to Improve Assembly Instructions and Operator Performance. In Proceedings of the 6th Swedish Production Symposium, Gothenburg, Sweden, 16–18 September 2014. [Google Scholar]
- Vanneste, P.; Huang, Y.; Park, J.Y.; Cornillie, F.; Decloedt, B.; den Noortgate, W. Cognitive Support for Assembly Operations by Means of Augmented Reality: An Exploratory Study. Int. J. Hum. Comput. Stud. 2020, 143, 102480. [Google Scholar] [CrossRef]
- Jeffri, N.F.S.; Rambli, D.R.A. A Review of Augmented Reality Systems and Their Effects on Mental Workload and Task Performance. Heliyon 2021, 7, e06277. [Google Scholar] [CrossRef]
- Tumler, J.; Doil, F.; Mecke, R.; Paul, G.; Schenk, M.; Pfister, E.A.; Huckauf, A.; Bockelmann, I.; Roggentin, A. Mobile Augmented Reality in Industrial Applications: Approaches for Solution of User-Related Issues. In Proceedings of the 2008 7th IEEE/ACM International Symposium on Mixed and Augmented Reality, Cambridge, UK, 15–18 September 2008; pp. 87–90. [Google Scholar]
- Mendoza-Ramírez, C.E.; Tudon-Martinez, J.C.; Félix-Herrán, L.C.; Lozoya-Santos, J.d.J.; Vargas-Martínez, A. Augmented Reality: Survey. Appl. Sci. 2023, 13, 10491. [Google Scholar] [CrossRef]
- Pereira, A.C.; Alves, A.C.; Arezes, P. Augmented Reality in a Lean Workplace at Smart Factories: A Case Study. Appl. Sci. 2023, 13, 9120. [Google Scholar] [CrossRef]
- Li, K.W.; Khaday, S.; Peng, L. Assessments of Order-Picking Tasks Using a Paper List and Augmented Reality Glasses with Different Order Information Displays. Appl. Sci. 2023, 13, 12222. [Google Scholar] [CrossRef]
- Pringle, A.; Campbell, A.G.; Hutka, S.; Keane, M.T. Using an Industry-Ready AR HMD on a Real Maintenance Task: AR Benefits Performance on Certain Task Steps More than Others. In Proceedings of the ISMAR: The International Symposium on Mixed and Augmented Reality 2018, Munich, Germany, 16–20 October 2018. [Google Scholar]
- Wiedenmaier, S.; Oehme, O.; Schmidt, L.; Luczak, H. Augmented Reality (AR) for Assembly Processes Design and Experimental Evaluation. Int. J. Hum. Comput. Interact. 2003, 16, 497–514. [Google Scholar] [CrossRef]
- Henderson, S.; Feiner, S. Exploring the Benefits of Augmented Reality Documentation for Maintenance and Repair. IEEE Trans. Vis. Comput. Graph. 2010, 17, 1355–1368. [Google Scholar] [CrossRef] [PubMed]
- Henderson, S.J.; Feiner, S. Evaluating the Benefits of Augmented Reality for Task Localization in Maintenance of an Armored Personnel Carrier Turret. In Proceedings of the 2009 8th IEEE International Symposium on Mixed and Augmented Reality, Orlando, FL, USA, 19–22 October 2009; pp. 135–144. [Google Scholar]
- Baird, K.M.; Barfield, W. Evaluating the Effectiveness of Augmented Reality Displays for a Manual Assembly Task. Virtual Real. 1999, 4, 250–259. [Google Scholar] [CrossRef]
- Jetter, J.; Eimecke, J.; Rese, A. Augmented Reality Tools for Industrial Applications: What Are Potential Key Performance Indicators and Who Benefits? Comput. Hum. Behav. 2018, 87, 18–33. [Google Scholar] [CrossRef]
- Kolla, S.S.V.K.; Sanchez, A.; Plapper, P. Comparing Effectiveness of Paper Based and Augmented Reality Instructions for Manual Assembly and Training Tasks. In Proceedings of the Conference on Learning Factories (CLF), Online, 1–2 July 2021. [Google Scholar]
- Havard, V.; Baudry, D.; Savatier, X.; Jeanne, B.; Louis, A.; Mazari, B. Augmented Industrial Maintenance (AIM): A Case Study for Evaluating and Comparing with Paper and Video Media Supports. In Proceedings of the International Conference on Augmented Reality, Virtual Reality and Computer Graphics, Otranto, Italy, 15–18 June 2016; pp. 302–320. [Google Scholar]
- Havard, V.; Baudry, D.; Jeanne, B.; Louis, A.; Savatier, X. A Use Case Study Comparing Augmented Reality (AR) and Electronic Document-Based Maintenance Instructions Considering Tasks Complexity and Operator Competency Level. Virtual Real. 2021, 25, 999–1014. [Google Scholar] [CrossRef]
- Illing, J.; Klinke, P.; Grünefeld, U.; Pfingsthorn, M.; Heuten, W. Time Is Money! Evaluating Augmented Reality Instructions for Time-Critical Assembly Tasks. In Proceedings of the 19th International Conference on Mobile and Ubiquitous Multimedia, Essen, Germany, 22–25 November 2020; pp. 277–287. [Google Scholar]
- Hoover, M.; Miller, J.; Gilbert, S.; Winer, E. Measuring the Performance Impact of Using the Microsoft Hololens 1 to Provide Guided Assembly Work Instructions. J. Comput. Inf. Sci. Eng. 2020, 20, 61001. [Google Scholar] [CrossRef]
- Brice, D.; Rafferty, K.; McLoone, S. AugmenTech: The Usability Evaluation of an AR System for Maintenance in Industry. In Proceedings of the International Conference on Augmented Reality, Virtual Reality and Computer Graphics, Lecce, Italy, 7–10 September 2020; pp. 284–303. [Google Scholar]
- Gonzalez-Franco, M.; Pizarro, R.; Cermeron, J.; Li, K.; Thorn, J.; Hutabarat, W.; Tiwari, A.; Bermell-Garcia, P. Immersive Mixed Reality for Manufacturing Training. Front. Robot. AI 2017, 4, 3. [Google Scholar] [CrossRef]
- Drouot, M.; Le Bigot, N.; Bricard, E.; De Bougrenet, J.-L.; Nourrit, V. Augmented Reality on Industrial Assembly Line: Impact on Effectiveness and Mental Workload. Appl. Ergon. 2022, 103, 103793. [Google Scholar] [CrossRef]
- Drouot, M.; Le Bigot, N.; Bolloc’h, J.; Bricard, E.; de Bougrenet, J.-L.; Nourrit, V. The Visual Impact of Augmented Reality during an Assembly Task. Displays 2021, 66, 101987. [Google Scholar] [CrossRef]
- Hirota, M.; Kanda, H.; Endo, T.; Miyoshi, T.; Miyagawa, S.; Hirohara, Y.; Yamaguchi, T.; Saika, M.; Morimoto, T.; Fujikado, T. Comparison of Visual Fatigue Caused by Head-Mounted Display for Virtual Reality and Two-Dimensional Display Using Objective and Subjective Evaluation. Ergonomics 2019, 62, 759–766. [Google Scholar] [CrossRef] [PubMed]
- Condino, S.; Carbone, M.; Piazza, R.; Ferrari, M.; Ferrari, V. Perceptual Limits of Optical See-through Visors for Augmented Reality Guidance of Manual Tasks. IEEE Trans. Biomed. Eng. 2019, 67, 411–419. [Google Scholar] [CrossRef] [PubMed]
- Nardelli, M.; Condino, S.; Ghiasi, S.; Callara, A.L.; Rho, G.; Carbone, M.; Ferrari, V.; Scilingo, E.P.; Greco, A. Recognizing AR-Guided Manual Tasks through Autonomic Nervous System Correlates: A Preliminary Study. In Proceedings of the 2020 IEEE International Symposium on Medical Measurements and Applications (MeMeA), Bari, Italy, 1 June–1 July 2020; pp. 1–6. [Google Scholar]
- Scott, R.; Calhoun, L.T. Human Factors in Ship Design: Preventing and Reducing Shipboard Operator Fatigue; University of Michigan: Ann Arbor, MI, USA, 2006; pp. 1–29. [Google Scholar]
- Splawn, J.M.; Miller, M.E. Prediction of Perceived Workload from Task Performance and Heart Rate Measures. Proc. Hum. Factors Ergon. Soc. Annu. Meet. 2013, 57, 778–782. [Google Scholar] [CrossRef]
- Kim, C.J.; Park, S.; Won, M.J.; Whang, M.; Lee, E.C. Autonomic Nervous System Responses Can Reveal Visual Fatigue Induced by 3D Displays. Sensors 2013, 13, 13054–13062. [Google Scholar] [CrossRef] [PubMed]
- Park, S.-I.; Whang, M.-C.; Kim, J.-W.; Mun, S.-C.; Ahn, S.-M. Autonomic Nervous System Response Affected by 3D Visual Fatigue Evoked during Watching 3D TV. Korean J. Sci. Emot. Sensib. 2011, 14, 653–662. [Google Scholar]
- Thirrunavukkarasu, R.R.; Meeradevi, T.; Ravi, A.; Ganesan, D.; Vadivel, G.P. Detection R Peak in Electrocardiogram Signal Using Daubechies Wavelet Transform and Shannon’s Energy Envelope. In Proceedings of the 2019 5th International Conference on Advanced Computing & Communication Systems (ICACCS), Coimbatore, India, 15–16 March 2019; pp. 1044–1048. [Google Scholar]
- McCraty, R.; Shaffer, F. Heart Rate Variability: New Perspectives on Physiological Mechanisms, Assessment of Self-Regulatory Capacity, and Health Risk. Glob. Adv. Health Med. 2015, 4, 46–61. [Google Scholar] [CrossRef] [PubMed]
- Park, S.; Won, M.J.; Mun, S.; Lee, E.C.; Whang, M. Does Visual Fatigue from 3D Displays Affect Autonomic Regulation and Heart Rhythm? Int. J. Psychophysiol. 2014, 92, 42–48. [Google Scholar] [CrossRef]
- Bigger, J.T., Jr. Spectral Analysis of RR Variability to Evaluate Autonomic Physiology and Pharmacology and to Predict Cardiovascular Outcomes in Humans. In CCardiac Electrophysiology from Cell to Bedside, 2nd ed.; WB Saunders Company: Philadelphia, PA, USA, 1995; pp. 1151–1170. [Google Scholar]
- Hall, J.E. Guyton and Hall Textbook of Medical Physiology, Jordanian Edition E-Book; Elsevier Health Sciences: Amsterdam, The Netherlands, 2016. [Google Scholar]
- Hansen, A.L.; Johnsen, B.H.; Thayer, J.F. Vagal Influence on Working Memory and Attention. Int. J. Psychophysiol. 2003, 48, 263–274. [Google Scholar] [CrossRef]
- McCraty, R.; Watkins, A. Autonomic Assessment Report: A Comprehensive Heart Rate Variability Analysis. In Heart Math Research Center Reports; Institute of Heart Math: Boulder Creek, CA, USA, 1996. [Google Scholar]
- Ramadan, M.Z.; Alhaag, M.H. Evaluating the User Physical Stresses Associated with Watching 3D and 2D Displays over Extended Time Using Heart Rate Variability, Galvanic Skin Resistance, and Performance Measure. J. Sens. 2018, 2018, 2632157. [Google Scholar] [CrossRef]
- McCraty, R.; Atkinson, M.; Tomasino, D.; Bradley, R.T. The Coherent Heart Heart-Brain Interactions, Psychophysiological Coherence, and the Emergence of System-Wide Order. Integr. Rev. A Transdiscipl. Transcult. J. New Thought Res. Prax. 2009, 5, 354–381. [Google Scholar]
- Gao, Y.; Liu, Y.; Normand, J.-M.; Moreau, G.; Gao, X.; Wang, Y. A Study on Differences in Human Perception between a Real and an AR Scene Viewed in an OST-HMD. J. Soc. Inf. Disp. 2019, 27, 155–171. [Google Scholar] [CrossRef]
- Yuan, J.; Mansouri, B.; Pettey, J.H.; Ahmed, S.F.; Khaderi, S.K. The Visual Effects Associated with Head-Mounted Displays. Int. J. Ophthalmol. Clin. Res. 2018, 5, 85. [Google Scholar]
- De Rivecourt, M.; Kuperus, M.N.; Post, W.J.; Mulder, L.J.M. Cardiovascular and Eye Activity Measures as Indices for Momentary Changes in Mental Effort during Simulated Flight. Ergonomics 2008, 51, 1295–1319. [Google Scholar] [CrossRef]
- Fournier, L.R.; Wilson, G.F.; Swain, C.R. Electrophysiological, Behavioral, and Subjective Indexes of Workload When Performing Multiple Tasks: Manipulations of Task Difficulty and Training. Int. J. Psychophysiol. 1999, 31, 129–145. [Google Scholar] [CrossRef] [PubMed]
- Finsen, L.; Søgaard, K.; Jensen, C.; Borg, V.; Christensen, H. Muscle Activity and Cardiovascular Response during Computer-Mouse Work with and without Memory Demands. Ergonomics 2001, 44, 1312–1329. [Google Scholar] [CrossRef]
- Fairclough, S.H.; Venables, L.; Tattersall, A. The Influence of Task Demand and Learning on the Psychophysiological Response. Int. J. Psychophysiol. 2005, 56, 171–184. [Google Scholar] [CrossRef] [PubMed]
- Delaney, J.P.A.; Brodie, D.A. Effects of Short-Term Psychological Stress on the Time and Frequency Domains of Heart-Rate Variability. Percept. Mot. Ski. 2000, 91, 515–524. [Google Scholar] [CrossRef]
- Lehrer, P.; Karavidas, M.; Lu, S.-E.; Vaschillo, E.; Vaschillo, B.; Cheng, A. Cardiac Data Increase Association between Self-Report and Both Expert Ratings of Task Load and Task Performance in Flight Simulator Tasks: An Exploratory Study. Int. J. Psychophysiol. 2010, 76, 80–87. [Google Scholar] [CrossRef]
- Camm, A.J.; Malik, M.; Bigger, J.T.; Breithardt, G.; Cerutti, S.; Cohen, R.J.; Coumel, P.; Fallen, E.L.; Kennedy, H.L.; Kleiger, R.E.; et al. Heart Rate Variability: Standards of Measurement, Physiological Interpretation and Clinical Use. Task Force of the European Society of Cardiology and the North American Society of Pacing and Electrophysiology. Circulation 1996, 93, 1043–1065. [Google Scholar]
- Blattgerste, J.; Strenge, B.; Renner, P.; Pfeiffer, T.; Essig, K. Comparing Conventional and Augmented Reality Instructions for Manual Assembly Tasks. In Proceedings of the 10th International Conference on PErvasive Technologies Related to Assistive Environments, Rhodes, Greece, 21–23 June 2017; pp. 75–82. [Google Scholar]
- Funk, M.; Kosch, T.; Schmidt, A. Interactive Worker Assistance: Comparing the Effects of in-Situ Projection, Head-Mounted Displays, Tablet, and Paper Instructions. In Proceedings of the 2016 ACM International Joint Conference on Pervasive and Ubiquitous Computing, Heidelberg, Germany, 12–16 September 2016; pp. 934–939. [Google Scholar]
- Loch, F.; Quint, F.; Brishtel, I. Comparing Video and Augmented Reality Assistance in Manual Assembly. In Proceedings of the 2016 12th International Conference on Intelligent Environments (IE), London, UK, 14–16 September 2016; pp. 147–150. [Google Scholar]
- Alessa, F.M.; Alhaag, M.H.; Al-Harkan, I.M.; Ramadan, M.Z.; Alqahtani, F.M. A Neurophysiological Evaluation of Cognitive Load during Augmented Reality Interactions in Various Industrial Maintenance and Assembly Tasks. Sensors 2023, 23, 7698. [Google Scholar] [CrossRef]
- Hart, S.G.; Staveland, L.E. Development of NASA-TLX (Task Load Index): Results of Empirical and Theoretical Research. Adv. Psychol. 1988, 52, 139–183. [Google Scholar]
- Khalaf, T.M.; Ramadan, M.Z.; Ragab, A.E.; Alhaag, M.H.; AlSharabi, K.A. Psychophysiological Responses to Manual Lifting of Unknown Loads. PLoS ONE 2021, 16, e0247442. [Google Scholar] [CrossRef] [PubMed]
- Malik, M.; Cripps, T.; Farrell, T.; Camm, A.J. Prognostic Value of Heart Rate Variability after Myocardial Infarction. A Comparison of Different Data-Processing Methods. Med. Biol. Eng. Comput. 1989, 27, 603–611. [Google Scholar] [CrossRef]
- Soares-Miranda, L.; Sattelmair, J.; Chaves, P.; Duncan, G.; Siscovick, D.S.; Stein, P.K.; Mozaffarian, D. Physical Activity and Heart Rate Variability in Older Adults: The Cardiovascular Health Study. Circulation 2014, 129, 2100–2110. [Google Scholar] [CrossRef]
- Tarvainen, M.P.; Ranta-Aho, P.O.; Karjalainen, P.A. An Advanced Detrending Method with Application to HRV Analysis. IEEE Trans. Biomed. Eng. 2002, 49, 172–175. [Google Scholar] [CrossRef]
- Tarvainen, M.P.; Niskanen, J.-P.; Lipponen, J.A.; Ranta-Aho, P.O.; Karjalainen, P.A. Kubios HRV—A Software for Advanced Heart Rate Variability Analysis. In Proceedings of the 4th European Conference of the International Federation for Medical and Biological Engineering, Antwerp, Belgium, 23–27 November 2008; pp. 1022–1025. [Google Scholar]
- Appathurai, A.; Carol, J.J.; Raja, C.; Kumar, S.N.; Daniel, A.V.; Malar, A.J.G.; Fred, A.L.; Krishnamoorthy, S. A Study on ECG Signal Characterization and Practical Implementation of Some ECG Characterization Techniques. Measurement 2019, 147, 106384. [Google Scholar] [CrossRef]
- Poletto, R.; Janczak, A.M.; Marchant-Forde, R.M.; Marchant-Forde, J.N.; Matthews, D.L.; Dowell, C.A.; Hogan, D.F.; Freeman, L.J.; Lay, D.C., Jr. Identification of Low and High Frequency Ranges for Heart Rate Variability and Blood Pressure Variability Analyses Using Pharmacological Autonomic Blockade with Atropine and Propranolol in Swine. Physiol. Behav. 2011, 103, 188–196. [Google Scholar] [CrossRef]
- Ramadan, M.Z.; Al-Tayyar, S.N.; Alhaag, M.H.; Soliman, A.T.; Abdelgawad, A.E. Evaluation of an Ergonomically Designed Schoolbag: Heart Rate Variability and Body Discomfort Rating. Work 2022, 72, 539–552. [Google Scholar] [CrossRef]
- Butkevičiūtė, E.; Bikulčienė, L.; Sidekerskienė, T.; Blažauskas, T.; Maskeliūnas, R.; Damaševičius, R.; Wei, W. Removal of Movement Artefact for Mobile EEG Analysis in Sports Exercises. IEEE Access 2019, 7, 7206–7217. [Google Scholar] [CrossRef]
- Hanusz, Z.; Tarasińska, J. Normalization of the Kolmogorov–Smirnov and Shapiro–Wilk Tests of Normality. Biom. Lett. 2015, 52, 85–93. [Google Scholar] [CrossRef]
- Mengoni, M.; Ceccacci, S.; Generosi, A.; Leopardi, A. Spatial Augmented Reality: An Application for Human Work in Smart Manufacturing Environment. Procedia Manuf. 2018, 17, 476–483. [Google Scholar] [CrossRef]
- Radkowski, R.; Herrema, J.; Oliver, J. Augmented Reality-Based Manual Assembly Support with Visual Features for Different Degrees of Difficulty. Int. J. Hum. Comput. Interact. 2015, 31, 337–349. [Google Scholar] [CrossRef]
- Alves, J.; Marques, B.; Oliveira, M.; Araújo, T.; Dias, P.; Santos, B.S. Comparing Spatial and Mobile Augmented Reality for Guiding Assembling Procedures with Task Validation. In Proceedings of the 2019 IEEE International Conference on Autonomous Robot Systems and Competitions (ICARSC), Porto, Portugal, 24–26 April 2019; pp. 1–6. [Google Scholar]
- Bendzioch, S.; Bläsing, D.; Hinrichsen, S. Comparison of Different Assembly Assistance Systems Under Ergonomic and Economic Aspects. In Proceedings of the International Conference on Human Systems Engineering and Design: Future Trends and Applications, Munich, Germany, 16–18 September 2019; pp. 20–25. [Google Scholar]
- Deshpande, A.; Kim, I. The Effects of Augmented Reality on Improving Spatial Problem Solving for Object Assembly. Adv. Eng. Inform. 2018, 38, 760–775. [Google Scholar] [CrossRef]
- Tang, A.; Owen, C.; Biocca, F.; Mou, W. Comparative Effectiveness of Augmented Reality in Object Assembly. In Proceedings of the SIGCHI Conference on Human Factors in Computing Systems, Fort Lauderdale, FL, USA, 5–10 April 2003; pp. 73–80. [Google Scholar]
- Lamberti, F.; Manuri, F.; Sanna, A.; Paravati, G.; Pezzolla, P.; Montuschi, P. Challenges, Opportunities, and Future Trends of Emerging Techniques for Augmented Reality-Based Maintenance. IEEE Trans. Emerg. Top. Comput. 2014, 2, 411–421. [Google Scholar] [CrossRef]
- Bosch, T.; Könemann, R.; de Cock, H.; Van Rhijn, G. The Effects of Projected versus Display Instructions on Productivity, Quality and Workload in a Simulated Assembly Task. In Proceedings of the 10th International Conference on PErvasive Technologies Related to Assistive Environments, Rhodes, Greece, 21–23 June 2017; pp. 412–415. [Google Scholar]
- Büttner, S.; Prilla, M.; Röcker, C. Augmented Reality Training for Industrial Assembly Work-Are Projection-Based AR Assistive Systems an Appropriate Tool for Assembly Training? In Proceedings of the 2020 CHI Conference on Human Factors in Computing Systems, Honolulu, HI, USA, 25–30 April 2020; pp. 1–12. [Google Scholar]
- Dan, A.; Reiner, M. EEG-Based Cognitive Load of Processing Events in 3D Virtual Worlds Is Lower than Processing Events in 2D Displays. Int. J. Psychophysiol. 2017, 122, 75–84. [Google Scholar] [CrossRef] [PubMed]
- Toffanin, P.; de Jong, R.; Johnson, A.; Martens, S. Using Frequency Tagging to Quantify Attentional Deployment in a Visual Divided Attention Task. Int. J. Psychophysiol. 2009, 72, 289–298. [Google Scholar] [CrossRef]
- Hoover, A.; Singh, A.; Fishel-Brown, S.; Muth, E. Real-Time Detection of Workload Changes Using Heart Rate Variability. Biomed. Signal Process. Control 2012, 7, 333–341. [Google Scholar] [CrossRef]
- Longo, L. Experienced Mental Workload, Perception of Usability, Their Interaction and Impact on Task Performance. PLoS ONE 2018, 13, e0199661. [Google Scholar] [CrossRef]
- Chen, F.; Zhou, J.; Wang, Y.; Yu, K.; Arshad, S.Z.; Khawaji, A.; Conway, D. Robust Multimodal Cognitive Load Measurement; Springer: Berlin/Heidelberg, Germany, 2016. [Google Scholar]
- Wang, Z.L.; Yang, L.; Ding, J.S. Application of Heart Rate Variability in Evaluation of Mental Workload. Chin. J. Ind. Hyg. Occup. Dis. 2005, 23, 182–184. [Google Scholar]
- Taelman, J.; Vandeput, S.; Spaepen, A.; Huffel, S. Van Influence of Mental Stress on Heart Rate and Heart Rate Variability. In Proceedings of the 4th European Conference of the International Federation for Medical and Biological Engineering, Antwerp, Belgium, 23–27 November 2008; pp. 1366–1369. [Google Scholar]
- Melillo, P.; Bracale, M.; Pecchia, L. Nonlinear Heart Rate Variability Features for Real-Life Stress Detection. Case Study: Students under Stress Due to University Examination. Biomed. Eng. Online 2011, 10, 96. [Google Scholar] [CrossRef]
- Seipäjärvi, S.M.; Tuomola, A.; Juurakko, J.; Rottensteiner, M.; Rissanen, A.-P.E.; Kurkela, J.L.O.; Kujala, U.M.; Laukkanen, J.A.; Wikgren, J. Measuring Psychosocial Stress with Heart Rate Variability-Based Methods in Different Health and Age Groups. Physiol. Meas. 2022, 43, 55002. [Google Scholar] [CrossRef] [PubMed]
- Kamath, M.V.; Fallen, E.L.; Mckelvie, R. Effects of Steady State Exercise on the Power Spectrum of Heart Rate Variability. Med. Sci. Sports Exerc. 1991, 23, 428–434. [Google Scholar] [CrossRef] [PubMed]
- Perini, R.; Veicsteinas, A. Heart Rate Variability and Autonomic Activity at Rest and during Exercise in Various Physiological Conditions. Eur. J. Appl. Physiol. 2003, 90, 317–325. [Google Scholar] [CrossRef] [PubMed]
- Yamamoto, Y.; Hughson, R.L.; Peterson, J.C. Autonomic Control of Heart Rate during Exercise Studied by Heart Rate Variability Spectral Analysis. J. Appl. Physiol. 1991, 71, 1136–1142. [Google Scholar] [CrossRef] [PubMed]
- Charles, R.L.; Nixon, J. Measuring Mental Workload Using Physiological Measures: A Systematic Review. Appl. Ergon. 2019, 74, 221–232. [Google Scholar] [CrossRef] [PubMed]
- Luft, C.D.B.; Takase, E.; Darby, D. Heart Rate Variability and Cognitive Function: Effects of Physical Effort. Biol. Psychol. 2009, 82, 186–191. [Google Scholar] [CrossRef]
- Collins, S.M.; Karasek, R.A.; Costas, K. Job Strain and Autonomic Indices of Cardiovascular Disease Risk. Am. J. Ind. Med. 2005, 48, 182–193. [Google Scholar] [CrossRef]
- De Waard, D.; Brookhuis, K.A. The Measurement of Drivers’ Mental Workload. Ph.D. Thesis, University of Groningen, Groningen, The Netherlands, 1996. [Google Scholar]
- Backs, R.W.; Navidzadeh, H.T.; Xu, X. Cardiorespiratory Indices of Mental Workload during Simulated Air Traffic Control. Proc. Hum. Factors Ergon. Soc. Annu. Meet. 2000, 44, 89–92. [Google Scholar] [CrossRef]
- Embrey, D.; Blackett, C.; Marsden, P.; Peachey, J. Development of a Human Cognitive Workload Assessment Tool; MCA Final Report; Human Reliability Associates: Lancashire, UK, 2006; pp. 1–253. [Google Scholar]
- Sharma, N.; Gedeon, T. Objective Measures, Sensors and Computational Techniques for Stress Recognition and Classification: A Survey. Comput. Methods Programs Biomed. 2012, 108, 1287–1301. [Google Scholar] [CrossRef]
- Alberdi, A.; Aztiria, A.; Basarab, A. Towards an Automatic Early Stress Recognition System for Office Environments Based on Multimodal Measurements: A Review. J. Biomed. Inform. 2016, 59, 49–75. [Google Scholar] [CrossRef]
- Anishchenko, V.S.; Igosheva, N.B.; Pavlov, A.N.; Khovanov, I.A.; Yakusheva, T.A. Comparative Analysis of Methods for Classifying the Cardiovascular System’s States under Stress. Crit. Rev. Biomed. Eng. 2001, 29, 462–481. [Google Scholar] [CrossRef] [PubMed]
- Nahshoni, E.; Aizenberg, D.; Sigler, M.; Strasberg, B.; Zalsman, G.; Imbar, S.; Adler, E.; Weizman, A. Heart Rate Variability Increases in Elderly Depressed Patients Who Respond to Electroconvulsive Therapy. J. Psychosom. Res. 2004, 56, 89–94. [Google Scholar] [CrossRef] [PubMed]
- Pincus, S.M. Greater Signal Regularity May Indicate Increased System Isolation. Math. Biosci. 1994, 122, 161–181. [Google Scholar] [CrossRef] [PubMed]
- Schubert, C.; Lambertz, M.; Nelesen, R.A.; Bardwell, W.; Choi, J.-B.; Dimsdale, J.E. Effects of Stress on Heart Rate Complexity—A Comparison between Short-Term and Chronic Stress. Biol. Psychol. 2009, 80, 325–332. [Google Scholar] [CrossRef] [PubMed]
- Vuksanović, V.; Gal, V. Heart Rate Variability in Mental Stress Aloud. Med. Eng. Phys. 2007, 29, 344–349. [Google Scholar] [CrossRef]
- Kamath, M.V.; Fallen, E.L. Power Spectral Analysis of Heart Rate Variability: A Noninvasive Signature of Cardiac Autonomic Function. Crit. Rev. Biomed. Eng. 1993, 21, 245–311. [Google Scholar]
- Hjortskov, N.; Rissén, D.; Blangsted, A.K.; Fallentin, N.; Lundberg, U.; Søgaard, K. The Effect of Mental Stress on Heart Rate Variability and Blood Pressure during Computer Work. Eur. J. Appl. Physiol. 2004, 92, 84–89. [Google Scholar] [CrossRef]
- Thayer, J.F.; Hansen, A.L.; Saus-Rose, E.; Johnsen, B.H. Heart Rate Variability, Prefrontal Neural Function, and Cognitive Performance: The Neurovisceral Integration Perspective on Self-Regulation, Adaptation, and Health. Ann. Behav. Med. 2009, 37, 141–153. [Google Scholar] [CrossRef]
Disclaimer/Publisher’s Note: The statements, opinions and data contained in all publications are solely those of the individual author(s) and contributor(s) and not of MDPI and/or the editor(s). MDPI and/or the editor(s) disclaim responsibility for any injury to people or property resulting from any ideas, methods, instructions or products referred to in the content. |
© 2023 by the authors. Licensee MDPI, Basel, Switzerland. This article is an open access article distributed under the terms and conditions of the Creative Commons Attribution (CC BY) license (https://creativecommons.org/licenses/by/4.0/).