Article

Bioprocessing of Hempseed (Cannabis sativa L.) Food By-Products Increased Nutrient and Phytochemical In Vitro Bioavailability during Digestion and Microbial Fermentation

1
School of Food and Biological Engineering, Jiangsu University, Zhenjiang 212013, China
2
Rowett Institute, University of Aberdeen, Foresterhill Health Campus, Aberdeen AB25 2ZD, UK
3
School of Grain Science and Technology, Jiangsu University of Science and Technology, Zhenjiang 212013, China
*
Author to whom correspondence should be addressed.
These authors contributed equally.
Appl. Sci. 2023, 13(9), 5781; https://doi.org/10.3390/app13095781
Submission received: 29 March 2023 / Revised: 14 April 2023 / Accepted: 28 April 2023 / Published: 8 May 2023

Abstract

:

Featured Application

This work brings key evidence to promote the use of hempseed food by-products in the development of functional ingredients such as prebiotics and foods for prevention and aid of metabolic disorders.

Abstract

Agricultural hemp (Cannabis sativa L.) is currently underutilised for food and could be pivotal to the development and expansion of a low-carbon food production system and to contribute to sustainable diets. Dehulling hempseed for food (for hempseed hearts) generates several by-products, including hempseed “screenings”. This study assessed the effects of several bioprocessing treatments (using enzyme mixtures, yeast, and combinations of both) on hemp screenings nutrient and phytochemical content and their digestion and metabolism in vitro (using a gastrointestinal digestion model and incubations with human mixed microbiota-faecal samples from three healthy donors). The nutrients and phytochemicals’ metabolites were measured using targeted LC-MS/MS and GC analysis. The hempseed screenings are rich in insoluble NSP (16.46 ± 0.86%), protein (20.15 ± 0.11%, with 3.83% tryptophan), syringaresinol, p-coumaric and protocatechuic acids. The hempseed screenings are highly fermentable, resulting in a significant increase in acetic, propionic, and butyric acids following fermentation with faecal microbiota. The bioprocessing treatments significantly increased the extractability of the phytochemicals, especially in free and alkaline-labile forms, without improving the fibre fermentation. The findings from this study support the use of hempseed screenings as a source of dietary nutrients for biodiversification and development of potential functional foods for metabolic and gut health.

1. Introduction

With an ever-increasing global population and concerns about the impact of climate change on food supply chains, food security has become a pressing issue [1]. Consideration also needs to be given to reducing greenhouse gas levels and to the delivery of greener, healthier, and more sustainable foods. Food producers are, therefore, exploring alternative and resilient crops, such as agricultural hemp (Cannabis sativa L.). This is very low in tetrahydrocannabinol (THC) and has immense industrial potential while being highly sustainable and environmentally beneficial [2]. Hempseed has a high nutritional value containing 25 to 35% oil, 20 to 25% protein, 20 to 30% carbohydrates, 10 to 15% insoluble fibre [3,4] and is rich in bioactive phytochemicals [5].
As high-protein crop, hemp could potentially rapidly meet the growing demand for plant protein and contribute towards meeting the “Reference Nutrient Intake (RNI)” (0.75 g protein per Kg body weight per day) [6]. Unlike soya and wheat protein, hemp is not currently defined as an allergen and hemp-based food products are not known to cause food allergies or coeliac syndrome [7]. As a source of dietary fibre, such as non-starch polysaccharides (NSP), could be fermented to short-chain fatty acids (SCFAs) by colonic microbes, impacting various physiological effects [8,9]. The microbial-derived metabolites of protein (specifically aromatic amino acids) such as indole-3-propionic acid (IPA), associated with a lower likelihood of developing type 2 diabetes (T2D), the indoles recognized as possessing anti-oxidative and anti-inflammatory properties, and the 4-hydroxyphenylacetic acid (4-HPAA) being proposed for potential nutritional therapies for hepatic steatosis [10]. As these findings could be exploited to promote metabolic health and prevent chronic disease, it is, therefore, important to assess the bioavailability, metabolism, including fermentability, of high protein and fibre food crops such as hemp.
The most studied hemp food by-product is the hemp meal produced after the oil extraction process and milled into flour to produce breads, potato chips, burger patties [11]. The consumption of hemp-rich meals (bread baked with hemp flour) beneficially modulated gastrointestinal hormones and promoted satiety in healthy individuals [12]. The dehulling of hempseeds to produce the hemp hearts removes the outer shell, mainly composed of fibre [4] and the hemp screenings, which are often discarded. Here, we have studied the “hempseed screenings” which are understudied hemp food by-products with the scope of developing potential functional food ingredients to promote zero-waste hemp food production and a circular nutrition and a circular economy. The ‘circular economy’ refers to markets that promote the transformation of waste products into value-added items for reintroduction into the economy. Not only is this beneficial for the environment by reducing waste, but it also encourages the creation of new jobs and the development of alternate sectors to facilitate such activities [13].
To develop value-added products from plant seed by-products, various pre-treatments have been explored to improve their functionality and nutritional properties. For example, bioprocess strategies like enzymatic and fermentation treatments have been successfully applied to modify cereal and pseudocereals brans, demonstrated by enhanced SCFA production and accessibility of phenolics [14,15,16]. Recently, lactobacilli fermentation has been used to improve the functional properties of hempseed hull, resulting in an increased content of volatile organic acids and terpenes [17]. However, whether such bioprocessing treatments may affect the bound plant metabolites and the fibre composition in hempseed by-products is still unknown. As for the colonic fermentation behaviour, fiber-rich hemp hull was more slowly degraded than its protein isolates and fructo-oligosaccharides [18], while our understanding of the gut transformations of plant metabolites in hempseed by-products is still limited.
With the aim of promoting hempseed screenings as a potential ingredient for the food industry, this study explored its potential use as a source of dietary fibre, protein, and bioactive phytochemicals. The effects of the bioprocessing treatments on the nutrient and phytochemical content, their extractability and their in vitro digestion and microbial metabolism (using human mixed microbiota) are also investigated.

2. Materials and Methods

2.1. Standards and Reagents

Standards and general laboratory reagents were purchased from Sigma-Aldrich (Gil-lingham, UK) and Fisher Scientific UK Ltd. (Loughborough, UK) or synthesized as described previously [19,20].

2.2. Preparation of Hempseed Screenings for Analysis

Industrial by-product hempseed screenings were supplied by the Good Hemp Company (BRAHAM & MURRAY, Devon, UK). The hemp screenings were obtained by dehulling the whole hemp seed industrially by using a Satake dehuller followed by a sifter and aspirator, which separated the shells from the screenings and the hempseed hearts using a gravity separator. Hempseed screenings were freeze milled with liquid nitrogen (Spex 6700, Edison, NJ, USA) and the powder was used for all the consequent work.

2.3. Macronutrient Analysis

Determination of dry matter and ash was according to the standard procedures of the Association of Official Analytical Chemists [21], crude protein was estimated as total nitrogen by the Dumas combustion method using a Vario Max CN analyser (N × 6.25), total fat was determined by Soxtec method (Soxtec™ 2050 Auto Fat Extraction System) [22], and a previously published method was used to determine the resistant starch and soluble and insoluble non-starch polysaccharide (NSP) [23]. The amino acid analysis was done by Alta Bioscience Ltd., using ISO/IEC 17025:2017 accredited methodologies.

2.4. Bioprocessing of Hempseed Screenings

The hempseed screening bioprocessing was done according to a previous publication [24], with several amendments. Two bioprocessing experiments generating seven different bioprocessed samples were performed (Figure 1). In the first bioprocessing treatment, the enzyme mixtures I (EM_1) were prepared with three commercial carbohydrate-hydrolyzing food grade enzymes: 0.01% (w/w) Fungamyl® 800 L, 0.14% (w/w) Viscozyme® L (Novozymes Corp., Bagsvaerd, Denmark), 0.36% (w/w) Depol 740 L, Biocatalysts Ltd., Wales, UK) and Millipore water (pH 6.5). Fermentation bioprocessing (BY_1) was performed by mixing 22% (w/w) hempseed screenings and 0.27% (w/w) Baker’s yeast (Sigma-Aldrich, Darmstadt, Germany) with Millipore water. For the EM + BY_1 group, enzyme mixture I was applied along with yeast fermentation. All the mixtures in the first bioprocessing were kept at 20 °C for 20 h in a shaker at 150 rpm.
In the second bioprocessing, EM_2 used enzyme mixture I. EC_2 was treated with enzyme mixtures II, which were prepared with the combination of enzyme mixture I and 0.01% (w/w) cellulase from Trichoderma sp. (Sigma-Aldrich, Gillingham, UK). Fermentation bioprocessing (BY_2) was continuously performed by mixing 22% (w/w) hempseed screenings and 0.27% (w/w) Baker’s yeast. For the EC + BY_2, enzyme mixtures II were applied along with Baker’s yeast fermentation. The second bioprocessing used Millipore water adjusted to pH 5 and contained two phases: An initial incubation at 40 °C for 4 h and then 20 °C for 20 h without mixing. After bioprocessing, these mixtures in triplicate were directly freeze-dried for the subsequent experiments.

2.5. Non-Starch Polysaccharide (NSP) Analysis

To evaluate the impact of different bioprocessing treatments on the NSP compositions of the hempseed screenings, monosaccharide composition of the hydrolysed soluble and insoluble NSP was analysed using gas chromatography with Flame Ionised Detection [25]. The samples were treated with heat-stable amylase to remove starch, and the NSPs were measured as the sum of the constituent sugars released by sulphuric acid (H2SO4) (7 M) hydrolysis at 100 °C for 1 h. All analyses were performed in triplicate.

2.6. Extraction of Phytochemicals

Phytochemical extractions from raw and bio-processed hemp materials were conducted according to a previous publication [5]. Briefly, samples (approx. 0.1 g dry weight; n = 3) were suspended in hydrochloric acid (HCl;0.2 M; 3 mL) and then extracted into ethyl acetate (EtOAc; 5 mL), followed by vortex mixing and centrifugation (5 min at 3200× g). The extraction was repeated twice again. The combined EtOAc extracts were left to stand over sodium sulphate (anhydrous) and then filtered. The solvent was removed under reduced pressure at less than 40 °C, and the residue was dissolved with methanol (0.5 mL), which represented the “free fraction” and was stored at −70 °C prior to LC-MS analysis. The remaining aqueous fraction was neutralised and freeze-dried for extraction of ‘bound fraction’. The freeze-dried pellets were suspended in NaOH (3 mL; 1 M) and stirred at room temperature for 4 h under nitrogen. The pH was reduced to pH 2 with HCl (6 M), and samples were extracted into EtOAc (5 mL). This was repeated twice and processed as described above to obtain the ‘alkaline fraction’. The pH of the aqueous fraction was then brought to pH 7 and freeze-dried again. The freeze-dried aqueous fractions were suspended in HCl (3 mL; 2 M) and incubated at 95 °C for 30 min. The samples were cooled to room temperature and extracted with EtOAc (5 mL) three times again and processed as described above to obtain the ‘acid fraction’.
To prepare samples for LC-MS analysis, an aliquot (50 µL) of each type of methanol-dissolved extract prepared above was transferred to an Eppendorf. Internal standard 1 (IS1) for negative-mode mass spectrometry ([13C]benzoic acid; 2 ng/µL in 75% methanol containing 0.02% acetic acid; 50 µL), internal standard 2 (IS2) for positive-mode mass spectrometry (2-amino-3,4,7,8-tetramethylimidazo [4,5-ƒ]quinoxaline; 0.5 ng/µL in 75% methanol containing 0.02% acetic acid; 50 µL), and acidified (0.4 M HCl) methanol (100 µL) were added. The samples were mixed well and centrifuged (12,500× g, 5 min). The supernatant was divided into three parts for three LC-MS/MS methods, as detailed below.

2.7. LC-MS Analysis

LC-MS/MS analysis of metabolites from raw, bioprocessed, digested and microbial incubated hemp material was performed on an Agilent 1100 LC-MS system using a Zorbax Eclipse 5 µm, 150 × 4 mm column from Agilent Technologies (Wokingham, UK) as described and published [26,27,28,29,30]. The plant material was extracted using the methods described above to capture data on the metabolites produced predominantly by the phenylpropanoid pathway, as well as products of protein and carbohydrate metabolism. This included derivatives and metabolites of the simple phenols, benzoic acids, phenolic acids, phenylacetic acids, phenypropionic acids, phenylpyruvic acids, phenyllactic acids, mandellic acids, phenolic dimers, acetophenones, benzaldehydes, cinnamaldehydes, benzyl alcohols, cinnamyl alcohols, indoles, isoflavones, coumarins, chalcones, flavanones, flavones, flavonols, and anthocyanidins. Liquid chromatography separation of the metabolites was performed on an Agilent 1100 LC–MS system (Agilent Technologies, Wokingham, UK) using a Zorbax Eclipse 5 μm, 150 × 4.6 mm C18 column (Agilent Technologies, Wokingham, UK). Three gradients were used to separate the different categories of metabolites and the mobile phase solvents in each case were water containing 0.1% acetic acid (A) and acetonitrile containing 0.1% acetic acid (B). The LC eluent was directed into, without splitting, an ABI 3200 triple quadrupole mass spectrometer (Applied Biosystems, Warrington, UK) fitted with a Turbo Ion Spray™ (TIS) source. All the metabolites were quantified using multiple reaction monitoring (MRM). For all the phytochemical quantifications, the standard calibrations were over a concentration interval of 2 ng/μL to 10 pg/μL. The threshold used for quantification was a signal to noise ratio of 3 to 1. All the ion transitions for each of the metabolites were determined based on their molecular ions and strong fragment ions, their voltage parameters, declustering potential, collision energy and cell entrance/exit potentials were optimised individually for each metabolite and have been previously described [26,27,28,29,30].

2.8. In Vitro Gastrointestinal Digestion (IVDG) Model with Dialysis Process

In vitro gastrointestinal digestion (IVDG) was performed according to the harmonised protocol developed by the COST INFOGEST network, with slight modifications [31,32]. The IVDG model consists of an oral phase, a gastric phase, and an intestinal phase. All solutions were preheated to 37 °C prior to use, and all the experimental conditions were performed in a pre-set 37 °C shaking water bath (Grant OLS-200, UK). Briefly, in the oral phase, weighed sample (1 g) in triplicate was mixed with 3 mL of water to create a ‘food-like’ paste. 50% (v/v) Simulated Salivary Fluid (SSF, pH 7) containing calcium chloride (CaCl2) (150 mM) and amylase (150 U/mL) was added to the paste and was allowed to mix for 2 min. Followed by mixing, the sample from the oral phase with the same volume of gastric phase, Simulated Gastric Fluid (SGF, pH 3) containing (16 mg/mL) and CaCl2 (0.15 mM). After adjusting to pH 3.0 with 1 M HCl, the sample was incubated for 2 h stimulating gastric phase. Then the simulated food bolus was exposed to Simulated Intestinal Fluid (SIF, pH 7) at 50% (v/v) that contained pancreatin (without bile acids) and was incubated for further 3 h after the pH was brought to 7.0 with 1 M NaOH.
The digesta from the IVDG were transferred to a 50 mL falcon tube and centrifuged (3200× g, 5 min, 4 °C). The pellet was kept at −20 °C. The supernatant was transferred into a cellulose dialysis membrane (Cheshire biotech Cheshire, UK) with a molecular weight cut off of 12–14 kDa and dialysed against a 100-fold volume of denoised water for one hour at room temperature, repeated twice again. The dialysis fluid from outside of dialysis membrane was collected and combined, 30 mL aliquots were sampled from 4.5 L homogeneous dialysis fluid and analysed for metabolites by LC-MS/MS, which represent the small molecules likely absorbed in the small intestine. Aliquots of the dialysis fluid were freeze-dried and dissolved with 100 µL methanol for LC-MS analysis as detailed in 2.4 and 2.5. The digesta retained inside of dialysis membrane were combined with the saved pellets, stored at −70 °C and freeze-dried. This fraction represents the portion delivered to the colon and was used as the substrate for the faecal incubation.

2.9. In Vitro Incubation of Hemp Samples Using Human Mixed Microbiota (Faecal Samples)

2.9.1. Human Faecal Incubation

Freeze-dried digesta from IVDG were weighed (0.025 ± 0.001 g) in six replicate pre-weighed Hungate tubes sealed with butyl rubber stoppers and screw caps (Bellco Glass, Shrewsbury, UK). A volume of approximately 7.5 mL M2 basal medium (containing no other carbohydrate energy source) was subsequently added and autoclaved. The faecal slurry was achieved by anaerobically mixing 2 g of fresh faeces (three healthy omnivore human donors) with 8 mL of anaerobic 50 mM phosphate buffer containing 0.05% cysteine under a CO2 atmosphere and vortex mixing. After cooling, three tubes of six duplicates (three control tubes incubated with 100 µL buffer) were inoculated with the 100 µL faecal slurry under CO2 and incubated at 37 °C. Samples for metabolite analysis by LC-MS/MS were recovered at 0 h and at 24 h, 48 h, and 72 h post-inoculation. Samples recovered at 0 h and 72 h were also used for the SCFA analysis.
Written informed consent was obtained from each subject. The volunteers were healthy, consuming an omnivore diet, with no use of antibiotics for at least three months prior to the study. The study involved collection of faecal samples from human donors, followed all the principles of the Declaration of Helsinki and good clinical practice, and all procedures involving human subjects were reviewed and approved by the Human Studies Management Committee of the Rowett Institute, University of Aberdeen, UK, and the Rowett Institute Ethics Panel. The study was carried out from October 2019 until October 2020.

2.9.2. Short Chain Fatty Acid (SCFA) Analysis

SCFA levels were measured in the inoculated supernatants by gas chromatography, as described previously [33]. Following conversion to tert-butyldimethylsilyl derivatives, 1 μL of the sample was analysed using a Hewlett–Packard (Palo Alto, CA, USA) gas chromatograph fitted with a fused silica capillary column with helium as a carrier gas. The SCFA concentrations were calculated from the relative response factor with respect to the internal standard (2-ethyl butyrate).

2.9.3. LC-MS/MS Microbial Metabolites Analysis

The collected supernatants from the inoculation were mixed with a specific volume of methanol and internal standard solution (1:2:2, v/v/v), and centrifuged at 12,000× g for 10 min. The supernatant was used for LC-MS/MS analysis (see Method 2.5 and 2.6).

2.10. Statistical Analysis

Significance differences were * p < 0.05 and ** p < 0.01 between groups using one-way ANOVA and Turkey’s multiple comparisons. All the analyses were performed in triplicate, and results were presented as the mean ± standard deviation. The principal component analysis (PCA), and heatmap were visualised using R 4.0.3. Specific to the heatmap, a function of log10-transformation was applied to normalise the concentration of metabolites. The microbial metabolites measured by LC-MS/MS analysis following the mixed microbiota incubations of hempseed screening samples were also analysed by principal component analysis (PCA), unit variance (UV)-scaled using SIMCA 14.1 (Umetrics, Cambridge, UK).

3. Results

3.1. Hempseed Screening Composition

Hempseed Screenings Are a Rich Source of Nutrients

The protein (determined as crude nitrogen content), total fat, total carbohydrate, resistant starch, soluble non-starch polysaccharides (NSP), and insoluble NSP content presented as % of dry weight (including ash and dry matter) for hemp screenings are in Table 1. The screenings are a rich source of protein, dietary fibre, and fat. The protein content (20.15%) is similar to the whole hemp seed, which could vary between 21 and 27% and is higher than in the hemp hull (8–16%) and lower than in the hemp seed meal (cold press expelling; 30–50%) depending on the variety [3]. This protein value is similar to beans and pulses, such as fava beans (26.1%), lentils (25.8%), chickpeas (19.3%), and kidney beans (21.6%) in terms of protein content according to USDA National Nutrient Database [34]. One hundred grams of screenings could therefore be an additional source of dietary macronutrients, contributing up to 50% of the “Reference Nutrient Intake (RNI)” for protein for adults (0.75 g protein per Kg body weight per day), which is 56 g men and 45 g women per day [6]. The total NSP (sum of soluble and insoluble) of 16.78%, 100 g of screenings could deliver approximately 56% of the daily recommendation for fibre and 67% of RDA for NSP [35].
The hempseed screening contains all the essential amino acids (Table 1) (EAA) and non-EAA. Tryptophan is the most abundant amino acid, with a concentration of 3.83%, which could satisfy the RDA for this essential amino acid (5 mg/Kg/day adults), followed by three non-EAA glutamic acid (3.02 %), aspartic acid (2.03%), and arginine (1.91%). Furthermore, hemp screening could also satisfy the RDA for histidine, glutamic acid, and threonine.

3.2. Hempseed Screenings Bioprocessing

3.2.1. Hempseed Screenings Bioprocessing Treatments Increased the Solubility of Dietary Fibre (NSP)

The insoluble NSP in the raw hempseed screenings (Table 2) is mainly composed of 7.01% xylose, 4.46% glucose, 0.86% arabinose, 0.48% galactose, and 3.10% uronic acid, which suggested the existence of pectin and hemicellulose fractions (such as xylan, xyloglucan, arabinoxylan, and galactoxyloglucan). Insoluble fibres are dominant in hempseeds, consisting of approximately cellulose (46%), lignin (31%), and hemicellulose (22%) [36]. Monosaccharide composition analysis indicated that hempseed hulls were almost entirely dominated by xylose (99.65%), with a limited amount of rhamnose, glucose, arabinose, and galactose [37]. The soluble NSP in the raw hempseed screenings is mainly composed of 0.08% arabinose, 0.06% galactose, 0.06% uronic acid, 0.04% glucose, and 0.04% fucose, as well as a low amount of 0.03% xylose. This indicates that uronic acid-containing polysaccharides such as glucurono-arabinogalactan are probably the major type of soluble NSP.
Interestingly, both the first and second bioprocessing treatments effectively decreased the content of insoluble NSP and increased the content of soluble NSP (Table 2). After the first bioprocessing, using enzyme mixture I (EM_1) resulted in the lowest content of insoluble NSP (14.32%) and the highest content of soluble NSP (0.58%). After the second bioprocessing using EM_2, the lowest content of insoluble NSP (11.96%) was observed, followed by EC+BY_2 (12.50%) and EC_2 (12.87%). Meanwhile, after treatment with EC_2, the highest content of soluble NSP (0.52%) was obtained, followed by EC+BY_2 (0.48%) and EM_2 (0.46%) treatments. This suggests that the second bioprocessing was most suitable for the solubilization of hemicellulose compared to the first bioprocessing, and the combination of enzymatic and fermentation treatments was more capable of depolymerizing the cell wall compared to fermentation alone.
Regarding the monosaccharides composition of insoluble NSP (Table 2), the first and second bioprocessing consistently decreased the content of glucose, arabinose, galactose, and uronic acid. Specifically, the second bioprocessing effectively decreased the content of glucose for insoluble NSP compared to the first bioprocessing, while the glucose content of the insoluble NSP was similar after treatment with EC_2 with cellulase (3.25%), EM_2 without cellulase (3.17%), and EC+BY_2 (3.05%). The monosaccharides composition of the soluble NSP varied greatly between bioprocessing treatments, except that both the first and second bioprocessing consistently increased the content of uronic acid. Notably, the uronic acid content of soluble NSP was the most abundant in EM_1 (0.58%), followed by EC_2 (0.52%). Overall, EM_1 was seemingly more capable of solubilizing the insoluble NSP than other treatments from the first bioprocessing. Similar findings were observed for the EM_2 when compared with other treatments from the second bioprocessing.

3.2.2. Hempseed Screenings Bioprocessing Treatments Increased the Extractability of Several Plant Metabolites

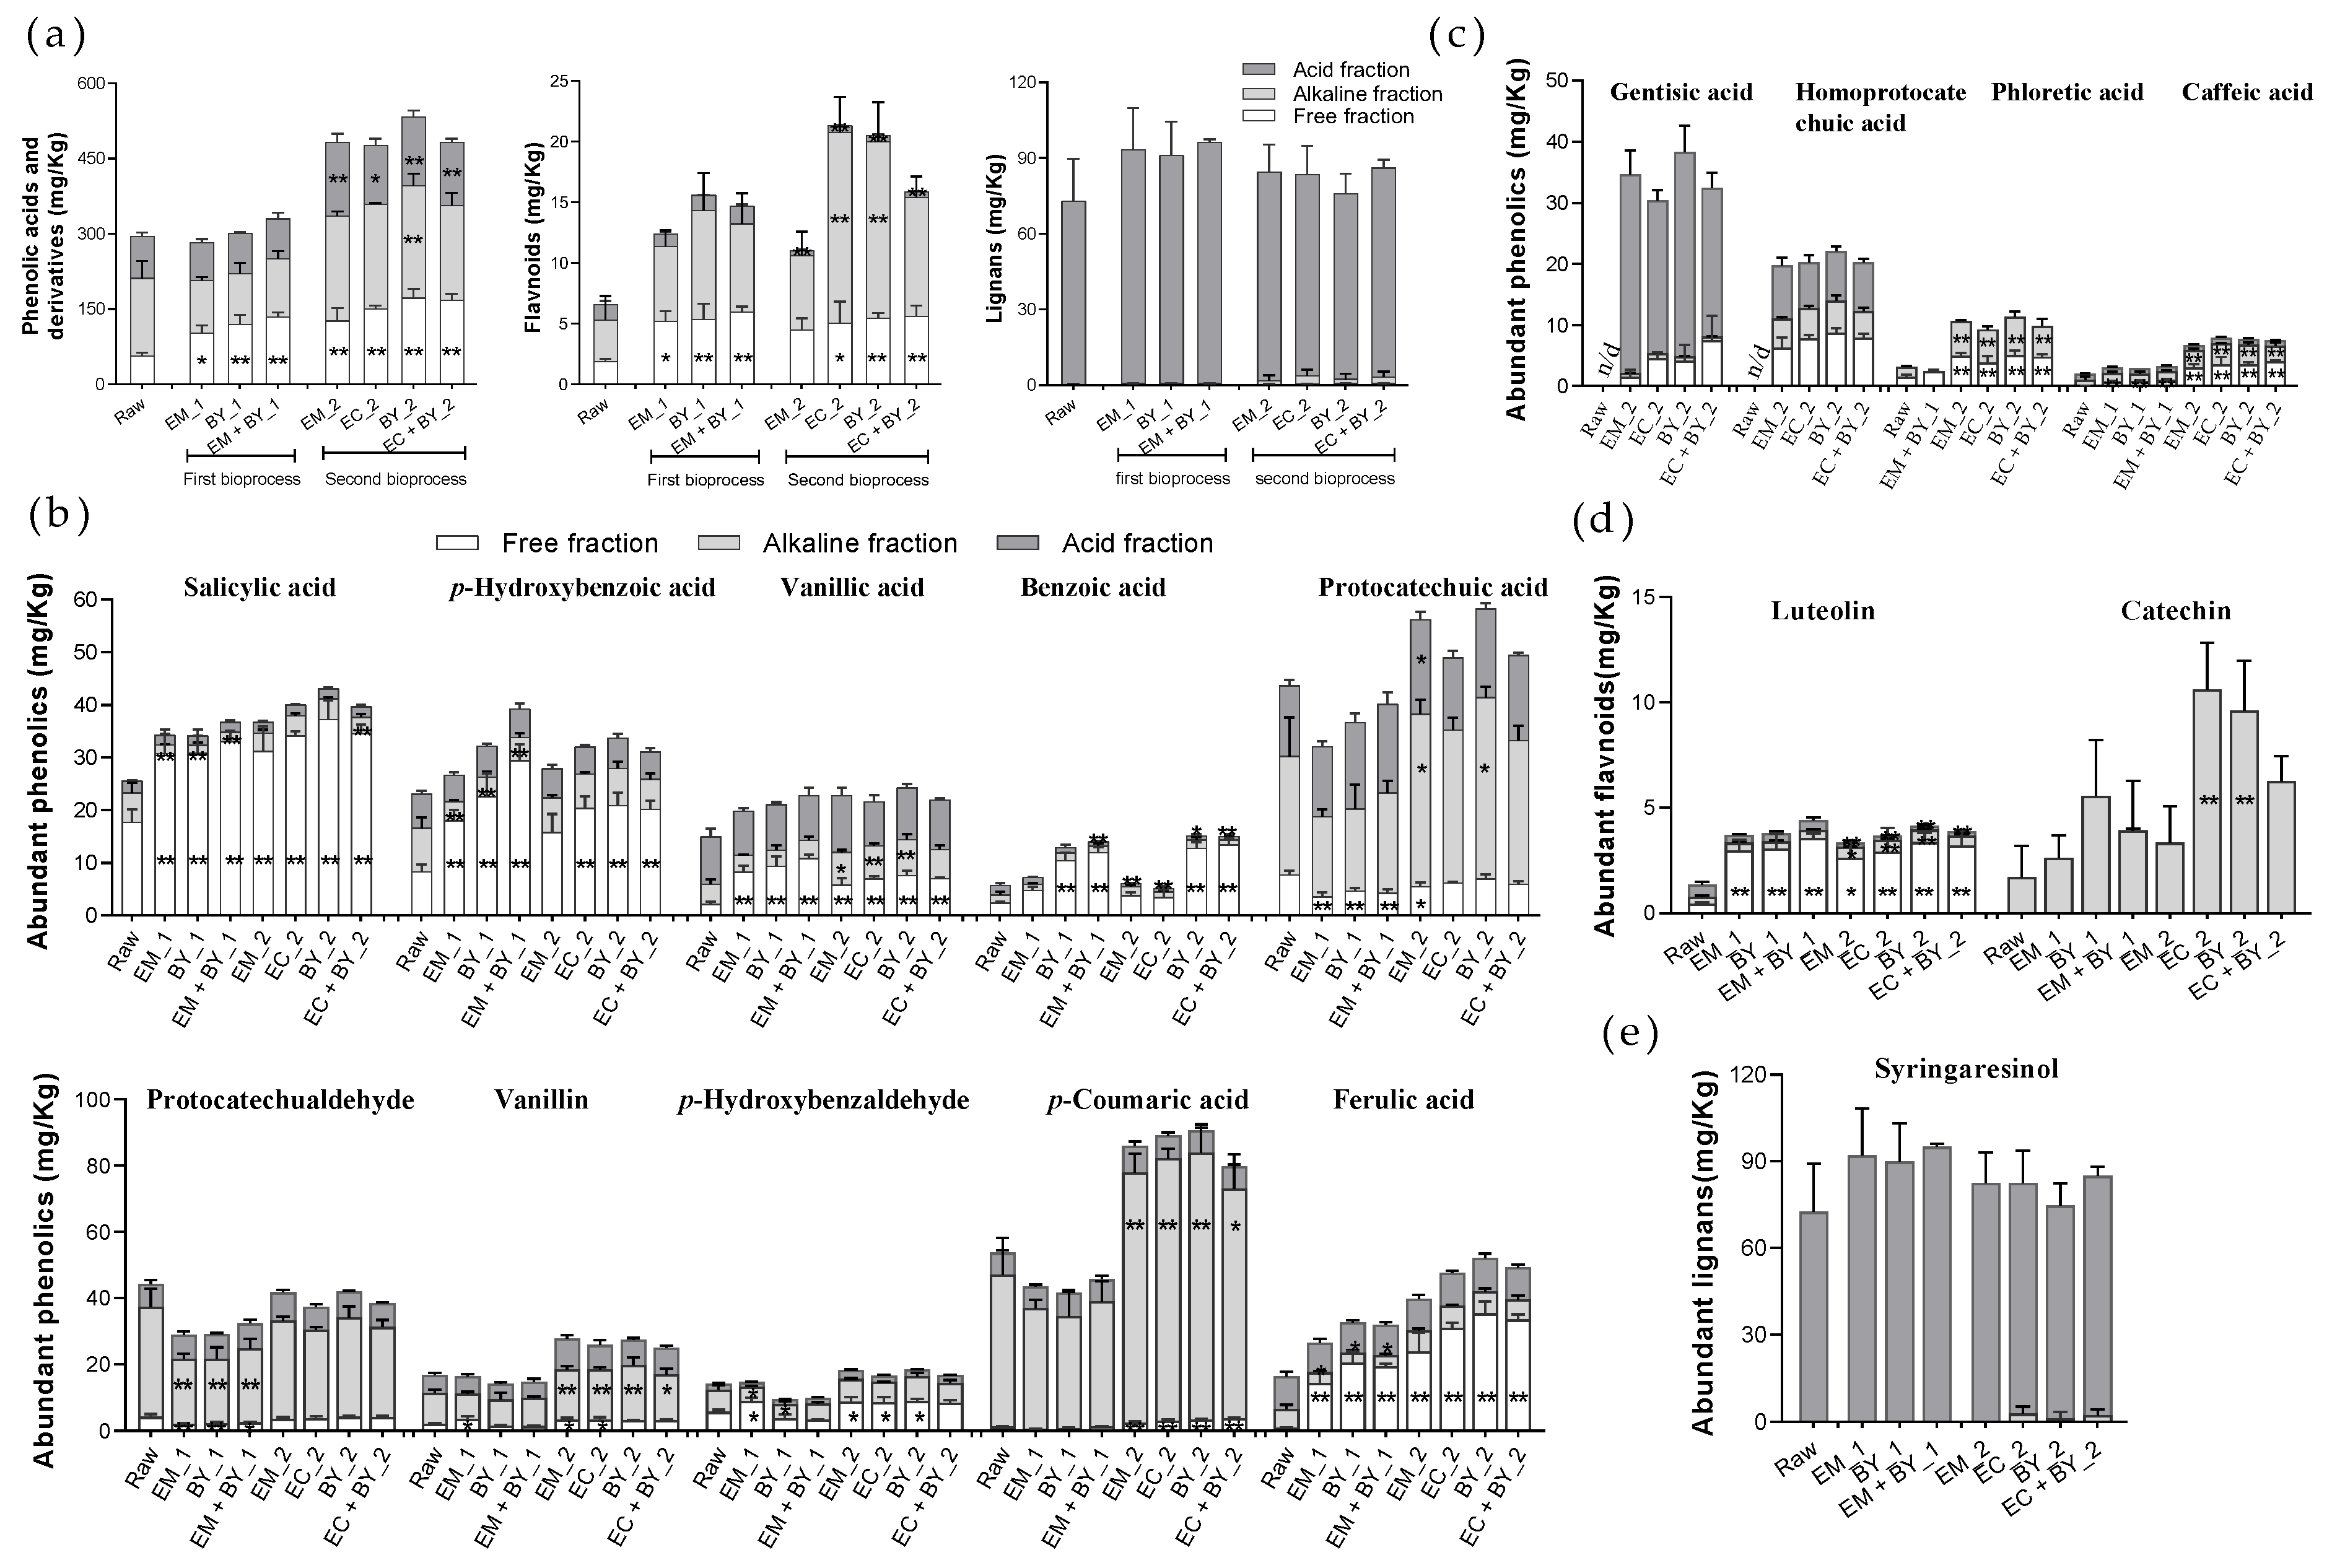
Quantitative profiling of plant metabolites from the hempseed screenings by targeted LC-MS/MS is shown in Table S1. The sum of the free, alkaline-labile, and acid-labile fractions measured by LC-MS/MS was indicated as total content, including total phenolic acids and derivatives/aldehydes (PAD), flavonoids, and lignans (Figure 2a). Compared with the raw hempseed screenings, both the first and second bioprocessing treatments significantly increased the content of free PAD and flavonoids released from the screenings, except for the total flavonoids after EM_2 treatment. The second bioprocessing only significantly increased the content of acid-labile PAD and flavonoids released. The BY_2 treatment significantly increased the content of alkaline-labile PAD and flavonoids released, resulting in the highest total extractable PAD (533.37 mg/Kg) and second highest total extractable flavonoids (20.50 mg/Kg). The EC_2 treatment significantly increased the content of alkaline-labile flavonoids, along with the highest total flavonoids (21.31 mg/Kg) released from the matrix. The EM_1 had the lowest total PAD (283.36 mg/Kg) and the relatively lower total flavonoids (12.38 mg/Kg) released. These results show a similar trend to NSP results in that hemicellulose solubilization and plant metabolite release is higher following the second bioprocessing compared to the first.
The PCA (Principal Component Analysis; Figure S1) diagram of all the plant metabolites measured by targeted LC-MS/MS shows a clear discrimination between raw, first bioprocessed, and second bioprocessing treatment of hempseed screenings. The ten most abundant individual PAD with a total content of more than 10 mg/Kg is presented in Figure 2b, with benzoic acid, salicylic acid, p-hydroxybenzoic acid, vanillic acid, benzoic acid, and protocatechuic acid, benzaldehyde, protocatechualdehyde, vanillin, and p-hydroxybenzaldehyde, and cinnamic acids, p-coumaric acid and ferulic acid. Both the first and second bioprocessing significantly increased the release in free fraction of salicylic acid, p-hydroxybenzoic acid, vanillic acid, and ferulic acid. For salicylic acid and p-hydroxybenzoic acid, a significant decrease in the alkaline-labile forms was observed after the first bioprocessing. The second bioprocessing increased the release of vanillic acid, vanillin, and p-coumaric acid in alkaline-labile form. The homoprotocatechuic acid (3, 4-dihydroxyphenylacetic acid), phloretic acid (3, 4-hydroxyphenylpropionic acid), and caffeic acid (Figure 2c) were undetectable or found in trace amounts in the raw screening samples and the first bioprocessing, while they were released after the second bioprocessing, being abundant in free and alkaline-labile forms.
Luteolin and catechin were the two most abundant flavonoids in the raw hempseed screenings (Figure 2b). Both the first and second bioprocessing treatments significantly increased the release of luteolin in the free form, while the release of catechin was significantly increased in the alkaline-labile form by the second bioprocessing treatment. Syringaresinol was the most abundant lignan in the raw hempseed screenings, exclusively found in the acid-labile form (72.55 ± 16.63 mg/Kg), its release being unaffected by the bioprocessing treatments.
In general, the bioprocessing treatments had a relatively limited impact on the release of the acid-labile plant metabolites, and that significantly affected the amount of plant metabolites released in the free or alkaline forms.

3.2.3. Hemp Screening Bioprocessing Treatments Improved the Upper Gastrointestinal Release of Several Plant Metabolites in the In Vitro Digestion Model

Based on the results presented, the EM_1 and EC_2 bioprocessing treatments were selected to explore further their effect on in vitro digestion (IVDG), early GI bioavailability and fermentability of the hempseed screenings. The IVDG procedure involved oral, gastric, and intestinal steps, along with a dialysis process simulating the mechanical aspects of uptake. Table 3 shows the composition of the metabolites (measured by targeted LC-MS/MS) in the digestible fraction resulting from in vitro digestion of the raw and bioprocessed hemp seed screening material.
Salicylic acid, p-hydroxybenzoic acid, vanillic acid, and ferulic acid are extractable mainly in the free forms, also their in vitro availability was high and was effectively improved by the bioprocessing treatments. For benzoic acid and p-hydroxybenzaldehyde, the bioprocessing treatments showed relatively limited improvement regarding their release in the free forms, this being as well as the case for their in vitro early GI bioavailability (presence in the digesta fraction). Moreover, for p-coumaric acid, protocatechualdehyde, proto-catechuic acid, vanillin, and syringaldehyde (3, 5-dimethoxy-4-hydroxybenzaldehyde), and syringic acid (3, 5-dimethoxy-4-hydroxybenzoic acid), which were abundant mostly in bound forms (Table S1), their in vitro early GI bioavailability was low, and they were resistant to the impact of the bioprocessing treatments.
Gentisic acid was undetectable in the raw material and after EM_1 treatment, this reflected in a low in vitro early GI bioavailability, but was significantly released in the free form (solubilised) after EC_2 treatment, this directly contributing to its higher in vitro early GI bioavailability. However, for homoprotocatechuic acid, phloretic acid, and caffeic acid, with only trace amounts being detected in the raw material and first bioprocessing, their in vitro early GI bioavailability was similar between raw, EM_1 and EC_2, despite being significantly released in the free form after the second bioprocessing. Hence, for several plant metabolites, the increase in free form content by bioprocessing treatments was not always equivalent to the high in vitro early GI bioavailability, probably due to the food matrix effect.

3.2.4. The Bioprocessing Treatments and In Vitro Digestion Treatments Showed no Impact on the Microbial Metabolism, and Both Raw and Bioprocessed Screenings were Rapidly Metabolised within 24 Hours with Little Further Transformation up to 72 Hours

The in vitro colonic fermentation using human mixed microbiota obtained from faecal samples from three donors was used to explore the production and potential bioavailability of plant metabolites in the human colon. The freeze-dried digesta pellet obtained from the in vitro digestion was used as the fermentation substrate, using the raw product, and the factions treated with EM_1, and EC_2 without simulated digestion as the controls.
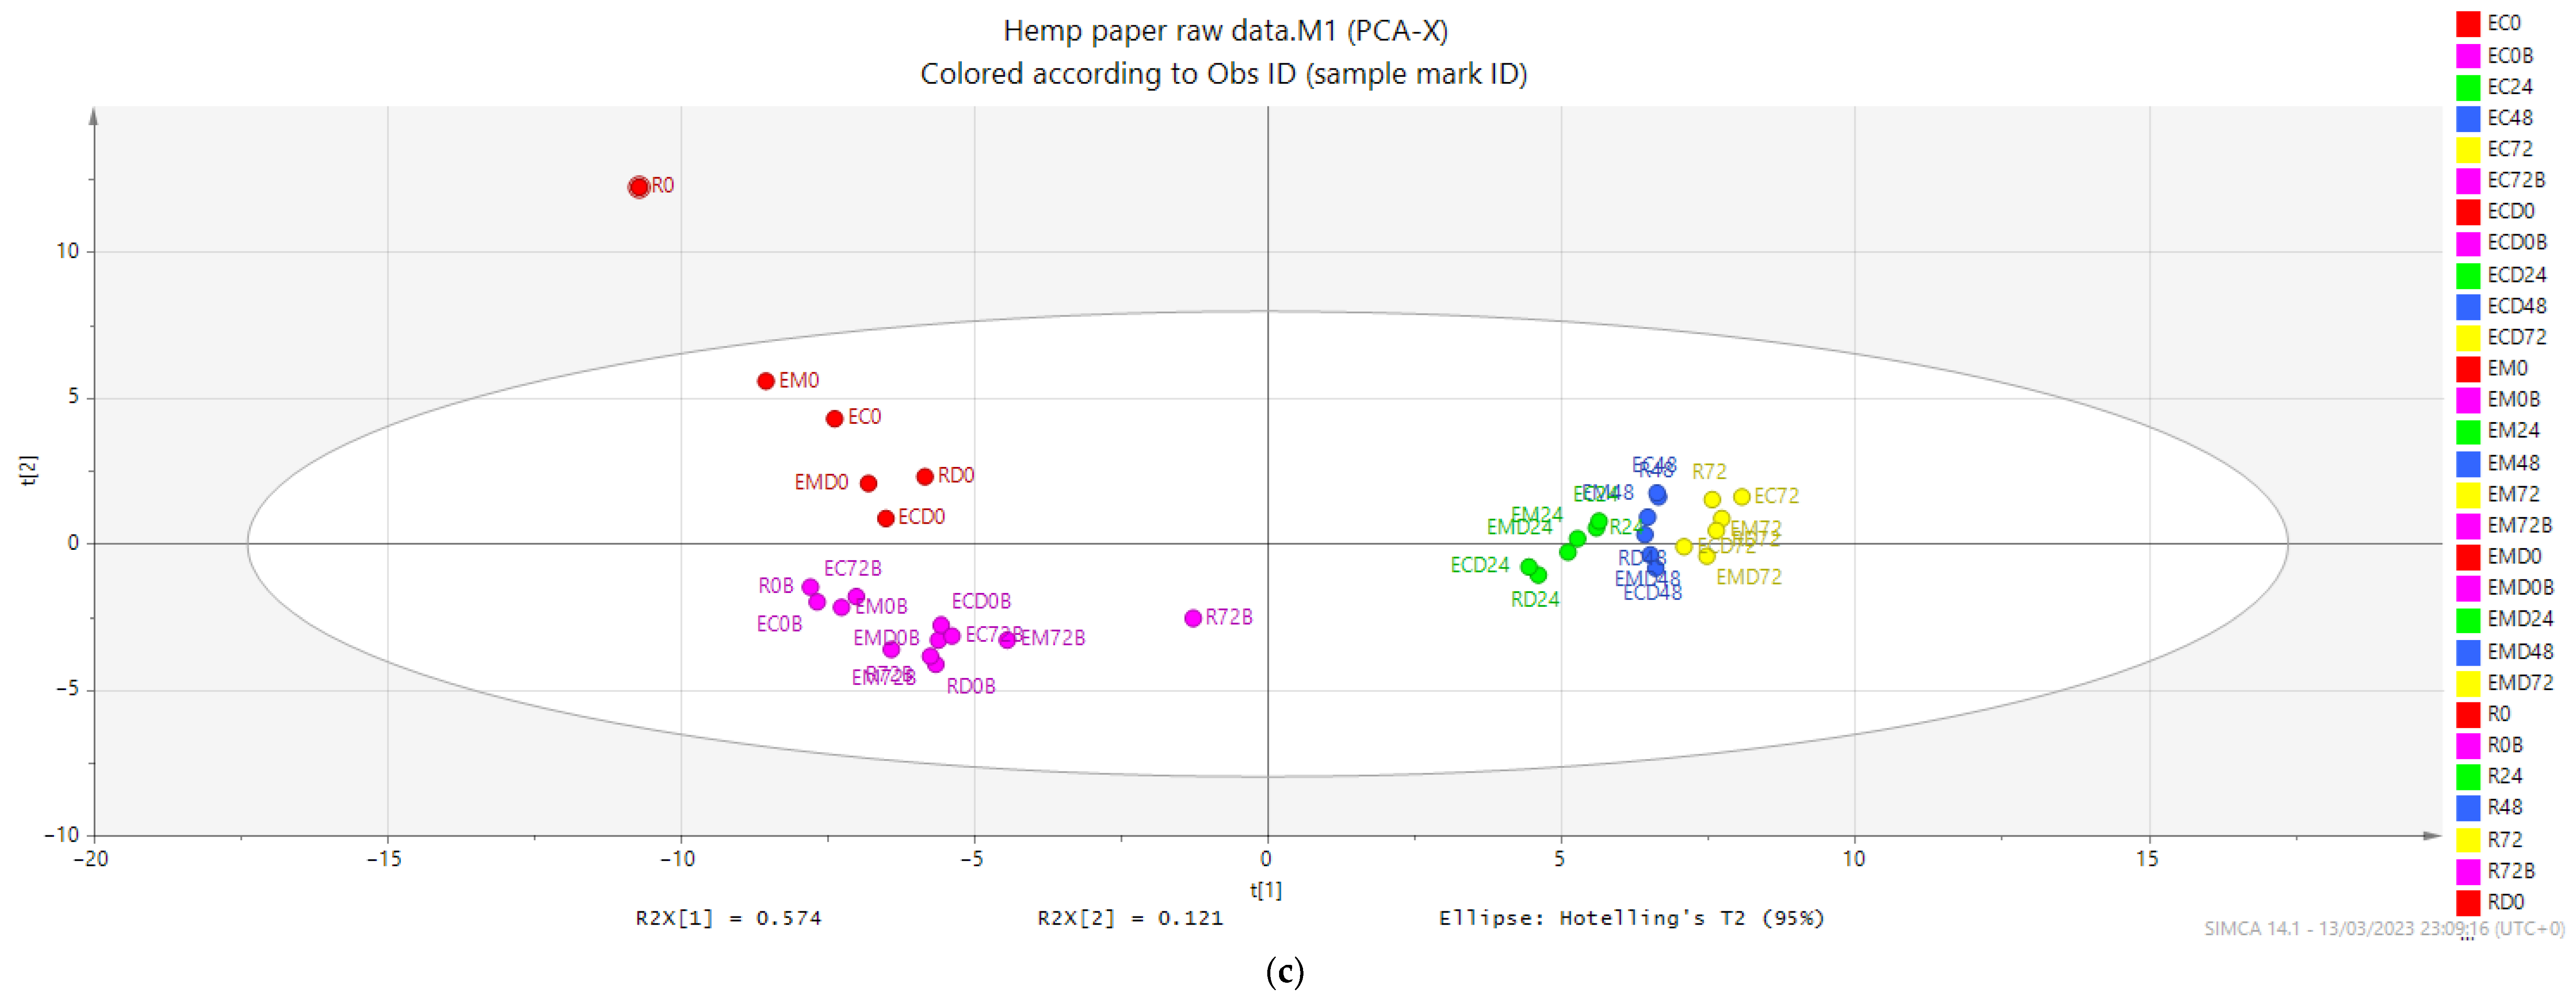
The PCA of microbial metabolites (Figure 3c) shows a scattering of baseline samples (0 h in red color), with the raw material (with no processing) observed as an outlier in the PCA. This reinforces the significant influence of bioprocessing treatments on raw hemp seed screenings as presented and discussed at point 3.1.3. The PCA diagram depicts a grouping of all the blanks (0 and 72 h in pink color) in one quadrant indicating no significant microbial transformation in time on the blank sample within 72 h. Furthermore, a clear segregation and grouping of microbial metabolites were measured at 24 h (bright green color), and in close proximity, two more groupings for the microbial metabolites were measured at 48 (blue color) and respectively 72 h (yellow color). The bioprocessed and in vitro digestion treated samples showed no difference in microbial metabolites, and both raw and bioprocessed screenings were rapidly metabolised with a clear change of metabolite profile within 24 h. Therefore, the results demonstrate that the microbial transformation of the substrates took place in the first 24 h across three donors with obvious divergence between 0 and 24 h, while it showed a similar microbial metabolite profile between 24, 48, and 72 h.
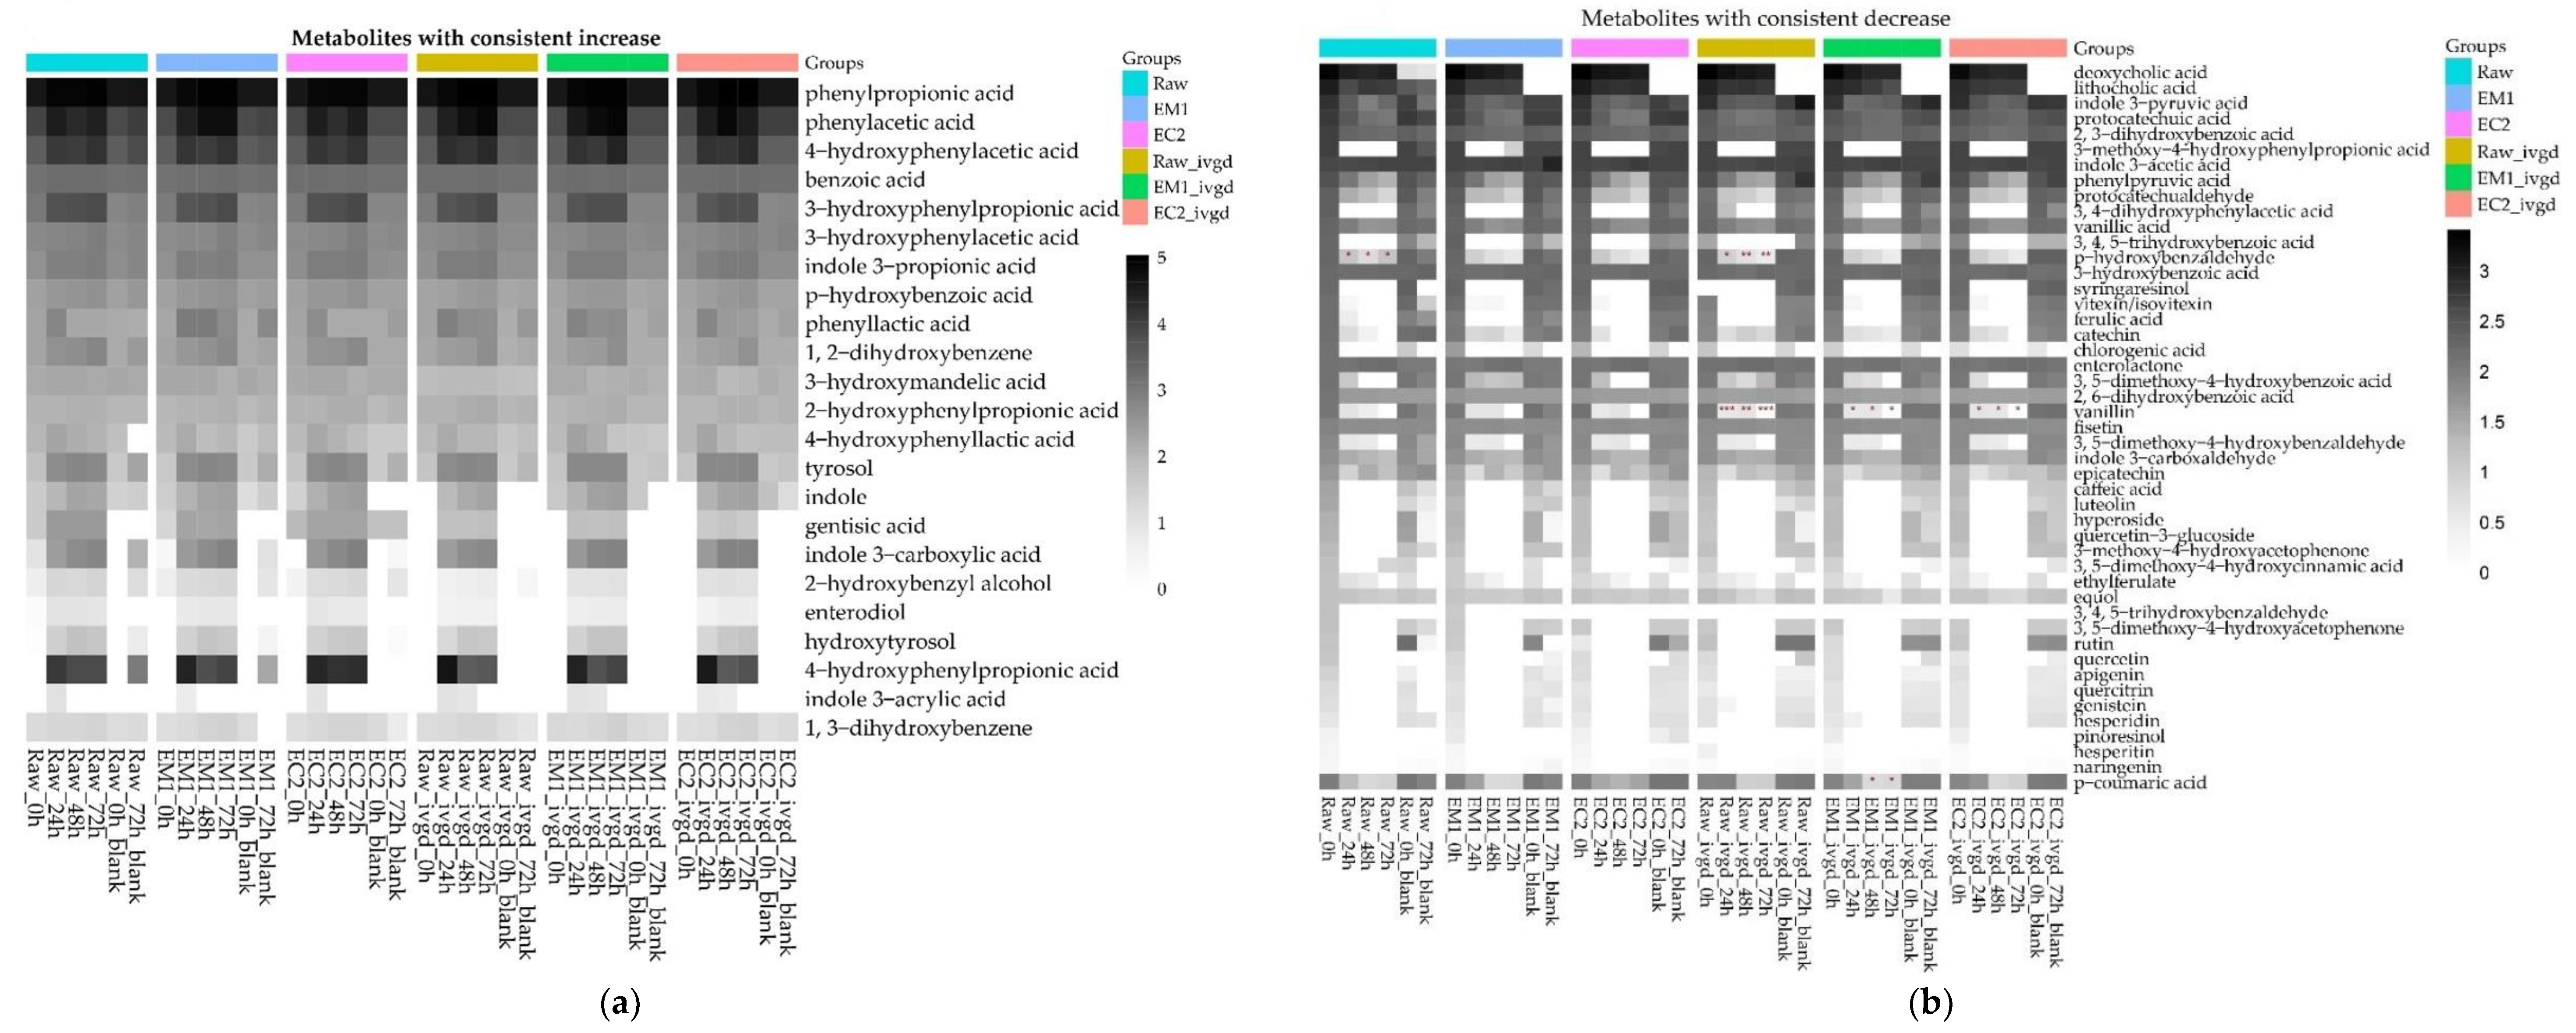
The heatmaps were used to reveal the change in concentration for the individual plant metabolites in time for the mixed microbiota incubations. The metabolites with a consistent increase when compared with 0 h are presented in Figure 3a, and the microbial metabolites with a consistent decrease across all three donors in Figure 3b.
The metabolites with a consistent increase in average (having the same trends across all volunteers) during 72 h from three donors’ incubations are mainly the microbial metabolites derived from protein, specifically of aromatic amino acids; tryptophan, tyrosine and phenylalanine and also derivatives of ferulic acid and lignans (Figure 3a). This increased trend is consistent and mirrored by the consistent decrease trend of precursors or intermediaries of microbial metabolites mentioned, which are decreasing in concentration as further metabolites (Figure 3b). Specifically, the constant increase of tryptophan microbial metabolites such as indoles and indoles derivatives like indole 3-propionic acid and indole 3-carboxylic acid; the increase of tyrosine microbial metabolites such as p-hydroxy benzoic acid, 4-hydroxy phenyl propionic acid, 4-hydroxy phenyl acetic acid, and 4-hydroxy phenyl lactic acid; the increase of phenyl alanine microbial metabolites, such as benzoic acid, phenyl propionic acid, phenyl acetic acid, and phenyl lactic acid; of ferulic acid microbial metabolite 3-hydroxy phenyl propionic acid; respectively syringaresinol metabolites, such as enterodiol.
The most abundant (in terms of concentration) microbial metabolites measured in the fermentation media at 24, 48, and 72 h are the protein metabolites derived from aromatic amino acids above-mentioned and microbial metabolites of ferulic acid. This metabolite profile is very representative of people consuming a high fibre and plant protein diet, suggesting that the hemp screenings could be considered vial candidates for macronutrient bio-diversification of the human diet. Furthermore, amongst the microbial metabolites with a consistent decreasing trend over 72 h were two bile acids deoxycholic and, respectively, lithocholic acid.

3.2.5. Hemp Screenings Are Highly Fermentable Sources of Dietary Fibre, but the Bioprocessing Treatments and In Vitro Digestion Treatment Showed Limited Impact on the Short Fatty Acids Production

The SCFA production over 72 h was analysed, including acetate, propionate, butyrate, and valerate. The incremental changes were calculated by subtracting the value obtained at 0 h from the amount produced in the fermented sample at 72 h for each SCFA. The results for raw material and bioprocessed hempseed screenings (EM_1 and EC_2), as well as their IVDG-predigested samples, are shown in Figure 4. SCFA production in both the raw and bioprocessed samples was found to be consistently increased over the 72-h fermentation period, despite wide variation due to inter-donor differences in SCFA production. In vitro digestion had no significant impact on SCFA production. These results suggests that dietary fibre in the hemp screening samples is highly fermentable and that bioprocessing treatments and digestion treatments showed no impact on SCFA production.

4. Discussion

This study is the first report on the nutrient and phytochemical characterisation of hempseed screenings. Moreover, this is the first detailed report on the fermentability and microbial metabolism in vitro using human mixed microbiota of a hempseed by-product. Our results indicated that hempseed by-products, such as hemp screenings used in the current study, were a rich source of nutrients in terms of protein, dietary fibre and fat. Moreover, the hemp screenings were particularly rich in tryptophan, an essential amino acid needed for general growth and development, the production of niacin (vitamin B3), and the neurotransmitter serotonin. Considering that the reference dietary intake (RDI) for tryptophan is 4 mg per kilogram of body weight, a person weighing 70 Kg should consume a minimum of 10 g of screenings to meet the RDI for tryptophan (280 mg of tryptophan per day).
Insoluble fibre is the dominant fibre in hempseed screenings, comprising 98% of the total NSP measured. This study revealed that the hemp screening fibre was highly fermentable, resulting in high amounts of SCFA, including acetate, propionate, and butyrate, with a significant increase in acetate (p < 0.05), propionate (p < 0.001), and butyrate (p < 0.01) measured following microbial fermentation of the hempseed screenings with human mixed microbiota in vitro. Moreover, there was no overall effect on microbial formation of SCFA after bioprocessing, and therefore, hemp screening fibre remained highly fermentable. These findings suggest the potential use of hempseed screenings as a functional ingredient in foods. Furthermore, these results encourage the adoption of the hemp screenings as a habitual source of nutrients to diversify the fibre composition of the human diets. It is as important to boost the dietary fibre content and diversify the fibre source and ensure that the fibre source is fermentable because of the numerous health benefits attributed to SCFAs production during fermentation, as these weak acids play an important role in the maintenance of gut and metabolic health [38].
Hempseed screenings are also a rich source of phenolic molecules, summing, on average, 375.09 mg/Kg of 129 molecules measured by LC-MS/MS analysis. The bioprocessing treatments had a significant effect on the extractability of these molecules, the total amount almost doubled after the BY_2 treatment to 635.47 mg/Kg (p < 0.01). Other bioprocessing treatments with significant impact on the extractability of phenolics molecules were EC2 with 583.08 mg/Kg (p < 0.01), EM2 with 581.03 mg/Kg (p < 0.01) and BY+EC2 with 591.71 (p < 0.001).
Syringaresinol was the most abundant molecule measured in the hemp screenings, almost exclusively in the bound form being released after acid hydrolysis. The extractability of syringaresinol was not affected by any of the bioprocessing treatments. This suggests that syringaresinol is likely to remain bound through early gastrointestinal (GI) digestion and be released in the colon, where it can be metabolised by the gut microbiota. Indeed, the results of the microbial incubations of the hempseed screenings showed enterolactone was one of the metabolites that increased during the incubations. Lignans, such as enterolactone, are considered human health-promoting molecules [39], thus, dietary intake of lignan-rich foods could be a useful way to sustain the prevention of chronic illness.
Bioprocessing treatments significantly increased the extractability in free form for several plant metabolites such as salicylic acid, p-hydroxy benzoic acid, benzoic acid, luteolin and ferulic acid, suggesting the possible release of molecules early in the gastrointestinal (GI) tract during the digestion of treated hempseed screening, and therefore an improvement of their systemic bioavailability. As these molecules are found in plant products of dietary relevance, such as cereals, fruits, vegetables, herbs, and spices, they are extensively researched for their potential health benefits. This includes salicylic acid for its anti-inflammatory and antioxidant properties, decreasing the risk of developing cancer [40] and ferulic acid for its antioxidant, anti-inflammatory, anti-fibrosis, anti-apoptotic, anti-platelet activities [41]. Collectively, these data indicate that hempseed screenings for development of functional ingredients to promote systemic health and should be considered for use in nutritional therapies for prevention of chronic diseases.
Bioprocessing treatments also significantly increased the extractability of catechin, protocatechuic acid, vanillic acid and p-coumaric acid in the alkaline-labile forms, suggesting that these molecules may potentially be released during microbial fermentation of the bioprocessed treated hempseed screening. This could potentially improve their bioavailability in the colon. Intestinal absorption of dietary catechins is quite low, resulting in most of them being metabolised by gut microbiota in the colon. Catechins are molecules found in abundance in green tea, therefore, their health benefits are extensively studied [42]. Protocatechuic acid is found in abundance in soft fruits and studied for a multitude of health benefits reviewed by Kakkar and Bais [43], such as anti-inflammatory, anti-viral, anticancer, to name a few. Bioprocessing treatments of hempseed screenings could, therefore, boost levels of catechin absorbed early in the GI tract. We observed that catechin present in the product obtained after in vitro digestion was metabolised during microbial incubation with human mixed microbiota, resulting in a decrease in its concentration. This was also the case of p-coumaric acid, which was also extensively metabolised during microbial incubation, and while its concentration was decreased, this was accompanied by an increase in benzoic acid and phenylacetic acid, two potential microbial metabolites of p-coumaric acid [44]. After syringaresinol, p-coumaric was the second most abundant molecule measured in the hempseed screening samples and was also found exclusively in the bound form.
The molecules extractable in their free form, in most cases, were those also measured in the supernatants following in vitro digestion. Moreover, significant increases in the extractability of the molecules predominantly measured in the free form following the bioprocessing treatments were also solubilised during in vitro digestion of these matrixes. For the molecules mostly measured in their bound form, solubilization by in vitro early GI bioavailability was low. These molecules were also found to be mostly resistant to the impact of the bioprocessing treatments. Hence, this was the trend for several plant metabolites, their increase in content in free form following the bioprocessing treatments was not always translating into their high in vitro early GI bioavailability.
These results suggest that the bioprocessing treatments and in vitro digestion treatments showed no impact on microbial metabolism, and both the raw material and bioprocessed screenings were metabolised within 24 h. The metabolites with consistent increases were mainly the microbial metabolites of protein, specifically the aromatic amino acids, tryptophan, tyrosine, and phenylalanine, and also ferulic acid, p-coumaric, and syringaresinol, as these were also the most abundant components measured in the hempseed screening samples. Apart from being a highly fermentable substrate generating SCFA, the hempseed screenings generated several aromatic amino acid microbial metabolites with key benefits for metabolic health. This includedindole-3-propionic acid is associated with a lower likelihood of developing T2D [45] in people with impaired glucose tolerance. Furthermore, some indoles were also recognised as possessing anti-oxidative and anti-inflammatory properties [43,46,47], as well as being potent stimulators of the gut hormone GLP-1 [48,49]. Phenyl propionic acid was the most abundant microbial metabolite measured during microbial incubation, suggesting that there was extensive microbial metabolism of the protein component of the hempseed screening sample. Moreover, 4-hydroxyphenylacetic acid, another microbial metabolite significantly increased following microbial incubation, has been proposed for potential nutritional therapies for hepatic steatosis [10], suggesting the potential gut microbial contribution to the metabolic benefits associated with consumption of hempseed screenings.

5. Conclusions

This study concludes that hempseed screenings are a rich source of dietary protein, especially tryptophan and highly fermentable fibre. The bioprocessing treatments were successfully used to modulate the bioavailability of the hemp screening phytochemicals. The treatments tested (especially EC_2) improved the upper gastrointestinal release of several plant metabolites in the in vitro digestion model. However, the bioprocessing treatments did not affect the microbial metabolism of the hemp screening components (nutrients and phytochemicals).
These findings provide excellent support for the use of hempseed screenings as a suitable candidate for the development of functional ingredients for promoting metabolic and gut health and, therefore, human (in vivo) studies to test these in vitro findings are highly advisable.

Supplementary Materials

The following supporting information can be downloaded at: https://www.mdpi.com/article/10.3390/app13095781/s1, Figure S1: Principal component analysis showing discrimination between raw, first bioprocessed, and second bioprocessed hempseed screenings based on the total content (the sum of free, alkaline, and acid fractions) for all the plant metabolites measured by LC-MS/MS.; Table S1: Quantitative profiling of plant metabolites from the hempseed screenings by targeted LC-MS/MS, concentration in mg/Kg, as average n = 3 determinations ± STD. Where Free fraction compounds are presented in SET A, Alkaline-bound fraction compounds in SET B, Acid-bound fraction presented in SETC and Total compounds in SET D.; Table S2: The metabolites with inconsistent change as average values of concentration (µg/mL) from the three donors for the microbial metabolites. The raw (set 1) and enzyme-treated hempseed screenings (EM_1 and EC_2) set 2 and set 3, as well as their corresponding in vitro-pre-digested samples were inoculated with faecal slurries from three donors (Donor 1, 2 and 3) at 0, 24, 48 and 72 h. Blank samples were inoculated sterile PBS without faecal slurry. Values were the mean of three donors, and each donor had three replicates.

Author Contributions

Conceptualization, M.N. and S.H.D.; methodology, M.N, S.H.D. and W.R.R.; data generation and sample analysis, S.F., Z.Z., G.J.D., A.M., L.S., D.H. and P.M., formal analysis, Z.Z., G.J.D. and D.H.; investigation, S.F. and Z.Z.; data curation, Z.Z. and S.F.; writing—original draft preparation, Z.Z., S.F., M.N., S.H.D.; writing—review and editing, M.N., S.H.D. and W.R.R.; visualization, M.N., S.H.D.; supervision, M.N., S.H.D.; funding acquisition, M.N., S.H.D. All authors have read and agreed to the published version of the manuscript.

Funding

This research was funded by the Scottish government’s Rural and Environment Science and Analytical Services Division (RESAS), China Scholarship Council (CSC) and Nanchang University doctoral students abroad visiting scholar program.

Institutional Review Board Statement

The study was conducted in accordance with the Declaration of Helsinki and good clinical practice, and all procedures involving human subjects were reviewed and approved by the Human Studies Management Committee of the Rowett Institute, University of Aberdeen, UK, and the Rowett Institute Ethics Panel. The study was carried out from October 2019 until October 2020.

Informed Consent Statement

Informed consent was obtained from all subjects involved in the study.

Data Availability Statement

Not applicable.

Acknowledgments

The authors are grateful to the volunteers for their participance in this study and to the Good Hemp company for their hempseed screening samples donation. Furthermore, Songtao and Zhihong would like to thank the China Scholarship Council (CSC) and Nanchang University doctoral students abroad visiting scholar program for the funds received to cover their maintenance in UK during their stage as visiting Ph.D. students from China.

Conflicts of Interest

The authors declare no conflict of interest.

References

  1. FAO; IFAD; UNICEF; WFP; WHO. The State of Food Security and Nutrition in the World 2021. Transforming Food Systems for Food Security, Improved Nutrition and Affordable Healthy Diets for All; FAO: Rome, Italy, 2021. [Google Scholar] [CrossRef]
  2. Madden, S.M.; Ryan, A.; Walsh, P.J.S. A Systems Thinking Approach Investigating the Estimated Environmental and Economic Benefits and Limitations of Industrial Hemp Cultivation in Ireland from 2017–2021. Sustainability 2022, 14, 4159. [Google Scholar] [CrossRef]
  3. Callaway, J.C.J.E. Hempseed as a nutritional resource: An overview. Euphytica 2004, 140, 65–72. [Google Scholar] [CrossRef]
  4. House, J.D.; Neufeld, J.; Leson, G. Evaluating the quality of protein from hemp seed (Cannabis sativa L.) products through the use of the protein digestibility-corrected amino acid score method. J. Agric. Food Chem. 2010, 58, 11801–11807. [Google Scholar] [CrossRef] [PubMed]
  5. Multari, S.; Neacsu, M.; Scobbie, L.; Cantlay, L.; Duncan, G.; Vaughan, N.; Stewart, D.; Russell, W.R. Nutritional and phytochemical content of high-protein crops. J. Agric. Food Chem. 2016, 64, 7800–7811. [Google Scholar] [CrossRef] [PubMed]
  6. British Nutrition Foundation. Available online: https://www.nutrition.org.uk (accessed on 29 December 2022).
  7. Mamone, G.; Picariello, G.; Ramondo, A.; Nicolai, M.A.; Ferranti, P.J.F.R.I. Production, digestibility and allergenicity of hemp (Cannabis sativa L.) protein isolates. Food Res. Int. 2019, 115, 562–571. [Google Scholar] [CrossRef] [PubMed]
  8. Espín, J.C.; González-Sarrías, A.; Tomás-Barberán, F.A. The gut microbiota: A key factor in the therapeutic effects of (poly) phenols. Analyst 2017, 139, 82–93. [Google Scholar] [CrossRef] [PubMed]
  9. Mosele, J.I.; Motilva, M.-J.; Ludwig, I.A. Beta-glucan and phenolic compounds: Their concentration and behavior during in vitro gastrointestinal digestion and colonic fermentation of different barley-based food products. J. Agric. Food Chem. 2018, 66, 8966–8975. [Google Scholar] [CrossRef]
  10. Osborn, L.J.; Schultz, K.; Massey, W.; DeLucia, B.; Choucair, I.; Varadharajan, V.; Banerjee, R.; Fung, K.; Horak, A.J., III; Orabi, D.; et al. A gut microbial metabolite of dietary polyphenols reverses obesity-driven hepatic steatosis. Proc. Natl. Acad. Sci. USA 2022, 119, e2202934119. [Google Scholar] [CrossRef]
  11. Rupasinghe, H.V.; Davis, A.; Kumar, S.K.; Murray, B.; Zheljazkov, V.D. Industrial hemp (Cannabis sativa subsp. sativa) as an emerging source for value-added functional food ingredients and nutraceuticals. Molecules 2020, 25, 4078. [Google Scholar] [CrossRef]
  12. Neacsu, M.; Vaughan, N.J.; Multari, S.; Haljas, E.; Scobbie, L.; Duncan, G.J.; Cantlay, L.; Fyfe, C.; Anderson, S.; Horgan, G.; et al. Hemp and buckwheat are valuable sources of dietary amino acids, beneficially modulating gastrointestinal hormones and promoting satiety in healthy volunteers. Eur. J. Nutr. 2022, 61, 1057–1072. [Google Scholar] [CrossRef]
  13. United Nations Conference on Trade and Development. Circular Economy. UNCTAD. 2022. Available online: https://unctad.org/topic/trade-and-environment/circular-economy (accessed on 29 December 2022).
  14. Coda, R.; Rizzello, C.G.; Curiel, J.A.; Poutanen, K.; Katina, K.J.I.F.S.; Technologies, E. Effect of bioprocessing and particle size on the nutritional properties of wheat bran fractions. Innov. Food Sci. Emerg. Technol. 2014, 25, 19–27. [Google Scholar] [CrossRef]
  15. Koistinen, V.M.; Nordlund, E.; Katina, K.; Mattila, I.; Poutanen, K.; Hanhineva, K.; Aura, A.-M. Effect of bioprocessing on the in vitro colonic microbial metabolism of phenolic acids from rye bran fortified breads. J. Agric. Food Chem. 2017, 65, 1854–1864. [Google Scholar] [CrossRef] [PubMed]
  16. Nordlund, E.; Katina, K.; Aura, A.-M.; Poutanen, K. Changes in bran structure by bioprocessing with enzymes and yeast modifies the in vitro digestibility and fermentability of bran protein and dietary fibre complex. J. Cereal Sci. 2013, 58, 200–208. [Google Scholar] [CrossRef]
  17. Nissen, L.; Casciano, F.; Babini, E.; Gianotti, A. Prebiotic potential and bioactive volatiles of hemp byproduct fermented by lactobacilli. LWT 2021, 151, 112201. [Google Scholar]
  18. Nissen, L.; Casciano, F.; Babini, E.; Gianotti, A. Beneficial metabolic transformations and prebiotic potential of hemp bran and its alcalase hydrolysate, after colonic fermentation in a gut model. Sci. Rep. 2023, 13, 1552. [Google Scholar] [CrossRef]
  19. Russell, W.R.; Forrester, A.R.; Chesson, A.; Burkitt, M.J. Oxidative coupling during lignin polymerization is determined by unpaired electron delocalization within parent phenylpropanoid radicals. Arch. Biochem. Biophys. 1996, 332, 357–366. [Google Scholar] [CrossRef]
  20. Russell, W.R.; Burkitt, M.J.; Scobbie, L.; Chesson, A. Radical formation and coupling of hydroxycinnamic acids containing 1, 2-dihydroxy substituents. Bioorganic Chem. 2003, 31, 206–215. [Google Scholar] [CrossRef]
  21. AOAC. Determination of Moisture, Ash, Protein and Fat. Official Method of Analysis of the Association of Analytical Chemists, 18th ed.; AOAC: Washington, DC, USA, 2005. [Google Scholar]
  22. Anderson, S. Soxtec: Its principles and applications. In Oil Extraction and Analysis; AOCS Publishing: New York, NY, USA, 2019; pp. 11–24. [Google Scholar]
  23. Englyst, H.N.; Quigley, M.E.; Hudson, G.; Cummings, J.H. Determination of dietary fibre as non-starch polysaccharides by gas–liquid chromatography. Analyst 1992, 117, 1707–1714. [Google Scholar] [CrossRef]
  24. Anson, N.M.; Selinheimo, E.; Havenaar, R.; Aura, A.-M.; Mattila, I.; Lehtinen, P.; Bast, A.; Poutanen, K.; Haenen, G.R.M.M. Bioprocessing of wheat bran improves in vitro bioaccessibility and colonic metabolism of phenolic compounds. J. Agric. Food Chem. 2009, 57, 6148–6155. [Google Scholar] [CrossRef]
  25. Englyst, H.N.; Cummings, J.H. Improved method for measurement of dietary fiber as non-starch 6olysaccharides in plant foods. J. Assoc. Off. Anal. Chem. 1988, 71, 808–814. [Google Scholar]
  26. Russell, W.R.; Gratz, S.W.; Duncan, S.H.; Holtrop, G.; Ince, J.; Scobbie, L.; Duncan, G.; Johnstone, A.M.; Lobley, G.; Wallace Duthie, G.G.; et al. High-protein, reduced-carbohydrate weight-loss diets promote metabolite profiles likely to be detrimental to colonic health. Am. J. Clin. Nutr. 2011, 5, 1062–1072. [Google Scholar] [CrossRef] [PubMed]
  27. Russell, W.R.; Duncan, S.H. Advanced analytical methodologies to study the microbial metabolome of the human gut. TrAC Trends Anal. Chem. 2013, 52, 54–60. [Google Scholar] [CrossRef]
  28. Neacsu, M.; McMonagle, J.; Fletcher, R.; Scobbie, L.; Duncan, G.; Cantlay, L.; De Roos, B.; Duthie, G.; Russell, W. Bound phytophenols from ready-to-eat cereals: Comparison with other plant-based foods. Food Chem. 2013, 141, 2880–2886. [Google Scholar] [CrossRef] [PubMed]
  29. Neacsu, M.; Vaughan, N.; Raikos, V.; Multari, S.; Duncan, G.; Duthie, G.; Russell, W.R. Phytochemical profile of commercially available food plant powders: Their potential role in healthier food reformulations. Food Chem. 2015, 179, 159–169. [Google Scholar] [CrossRef]
  30. Neacsu, M.; Vaughan, N.J.; Perri, V.; Duncan, G.J.; Walker, R.; Coleman, M.; Russell, W.R. Analysis Nutritional and chemical profiling of UK-grown potato bean (Apios americana Medik) reveal its potential for diet biodiversification and revalorisation. J. Food Compos. Anal. 2021, 98, 103821. [Google Scholar] [CrossRef]
  31. Barik, S.K.; Dehury, B.; Russell, W.R.; Moar, K.M.; Cruickshank, M.; Scobbie, L.; Hoggard, N.J.B.P. Analysis of polyphenolic metabolites from in vitro gastrointestinal digested soft fruit extracts identify malvidin-3-glucoside as an inhibitor of PTP1B. Biochem. Pharmacol. 2020, 178, 114109. [Google Scholar] [CrossRef]
  32. Minekus, M.; Alminger, M.; Alvito, P.; Ballance, S.; Bohn, T.; Bourlieu, C.; Carrière, F.; Boutrou, R.; Corredig, M.; Dupont, D.J.F.; et al. A standardised static in vitro digestion method suitable for food–an international consensus. Food Funct. 2014, 5, 1113–1124. [Google Scholar] [CrossRef]
  33. Richardson, A.; Calder, A.; Stewart, C.; Smith, A. Simultaneous determination of volatile and non-volatile acidic fermentation products of anaerobes by capillary gas chromatography. Lett. Appl. Microbiol. 1989, 9, 5–8. [Google Scholar] [CrossRef]
  34. USDA National Nutrient Database. 2021. Available online: http://www.nal.usda.gov/fnic/foodcomp/search/https://fdc.nal.usda.gov/fdc-app.html#/food-details/1032521/nutrients (accessed on 29 November 2022).
  35. SACN. Scientific Advisory Committee on Nutrition (SACN)—GOV.UK. In Dietary Reference Values for Energy; The Stationery Office: London, UK, 2015. [Google Scholar]
  36. Vonapartis, E.; Aubin, M.-P.; Seguin, P.; Mustafa, A.F.; Charron, J.-B. Seed composition of ten industrial hemp cultivars approved for production in Canada. J. Food Compos. Anal. 2015, 39, 8–12. [Google Scholar] [CrossRef]
  37. Leonard, W.; Zhang, P.; Ying, D.; Nie, S.; Liu, S.; Fang, Z.J.F.H. Post-extrusion physical properties, techno-functionality and microbiota-modulating potential of hempseed (Cannabis sativa L.) hull fiber. Food Hydrocoll. 2022, 131, 107836. [Google Scholar] [CrossRef]
  38. Blaak, E.; Canfora, E.; Theis, S.; Frost, G.; Groen, A.; Mithieux, G.; Nauta, A.; Scott, K.; Stahl, B.; Van Harsselaar, J.; et al. Short chain fatty acids in human gut and metabolic health. Benef. Microbes 2020, 11, 411–455. [Google Scholar] [CrossRef] [PubMed]
  39. Rodríguez-García, C.; Sánchez-Quesada, C.; Toledo, E.; Delgado-Rodríguez, M.; Gaforio, J.J. Naturally lignan-rich foods: A dietary tool for health promotion? Molecules 2019, 24, 917. [Google Scholar] [CrossRef] [PubMed]
  40. Wood, A.; Baxter, G.; Thies, F.; Kyle, J.; Duthie, G. A systematic review of salicylates in foods: Estimated daily intake of a Scottish population. Mol. Nutr. Food Res. 2011, 55, S7–S14. [Google Scholar] [CrossRef]
  41. Li, D.; Rui, Y.-X.; Guo, S.-D.; Luan, F.; Liu, R.; Zeng, N.J.L. Ferulic acid: A review of its pharmacology, pharmacokinetics and derivatives. Life Sci. 2021, 284, 119921. [Google Scholar] [CrossRef] [PubMed]
  42. mMusial, C.; Kuban-Jankowska, A.; Gorska-Ponikowska, M. Beneficial properties of green tea catechins. Int. J. Mol. Sci. 2020, 21, 1744. [Google Scholar] [CrossRef]
  43. Kakkar, S.; Bais, S. A review on protocatechuic acid and its pharmacological potential. ISRN Pharmacol. 2014, 2014, 952943–952952. [Google Scholar] [CrossRef]
  44. Karbownik, M.; Stasiak, M.; Zygmunt, A.; Zasada, K.; Lewiński, A. Protective effects of melatonin and indole-3-propionic acid against lipid peroxidation, caused by potassium bromate in the rat kidney. Cell Biochem. Funct. 2006, 24, 483–489. [Google Scholar] [CrossRef]
  45. Bento-Silva, A.; Koistinen, V.M.; Mena, P.; Bronze, M.R.; Hanhineva, K.; Sahlstrøm, S.; Kitrytė, V.; Moco, S.; Aura, A.-M. Factors affecting intake, metabolism and health benefits of phenolic acids: Do we understand individual variability? Eur. J. Nutr. 2020, 59, 1275–1293. [Google Scholar] [CrossRef]
  46. De Mello, V.D.; Paananen, J.; Lindström, J.; Lankinen, M.A.; Shi, L.; Kuusisto, J.; Pihlajamäki, J.; Auriola, S.; Lehtonen, M.; Rolandsson, O.; et al. Indolepropionic acid and novel lipid metabolites are associated with a lower risk of type 2 diabetes in the Finnish Diabetes Prevention Study. Sci. Rep. 2017, 7, 46337. [Google Scholar] [CrossRef]
  47. Hwang, I.K.; Yoo, K.Y.; Li, H.; Park, O.K.; Lee, C.H.; Choi, J.H.; Jeong, Y.G.; Lee, Y.L.; Kim, Y.M.; Kwon, Y.G. Indole-3-propionic acid attenuates neuronal damage and oxidative stress in the ischemic hippocampus. J. Neurosci. Res. 2009, 87, 2126–2137. [Google Scholar] [CrossRef]
  48. Wlodarska, M.; Luo, C.; Kolde, R.; d’Hennezel, E.; Annand, J.W.; Heim, C.E.; Krastel, P.; Schmitt, E.K.; Omar, A.S.; Creasey, E.A.; et al. Indoleacrylic acid produced by commensal Peptostreptococcus species suppresses inflammation. Cell Host Microbe 2017, 22, 25–37.e6. [Google Scholar] [CrossRef] [PubMed]
  49. Chimerel, C.; Emery, E.; Summers, D.K.; Keyser, U.; Gribble, F.M.; Reimann, F. Bacterial metabolite indole modulates incretin secretion from intestinal enteroendocrine L cells. Cell Rep. 2014, 9, 1202–1208. [Google Scholar] [CrossRef] [PubMed]
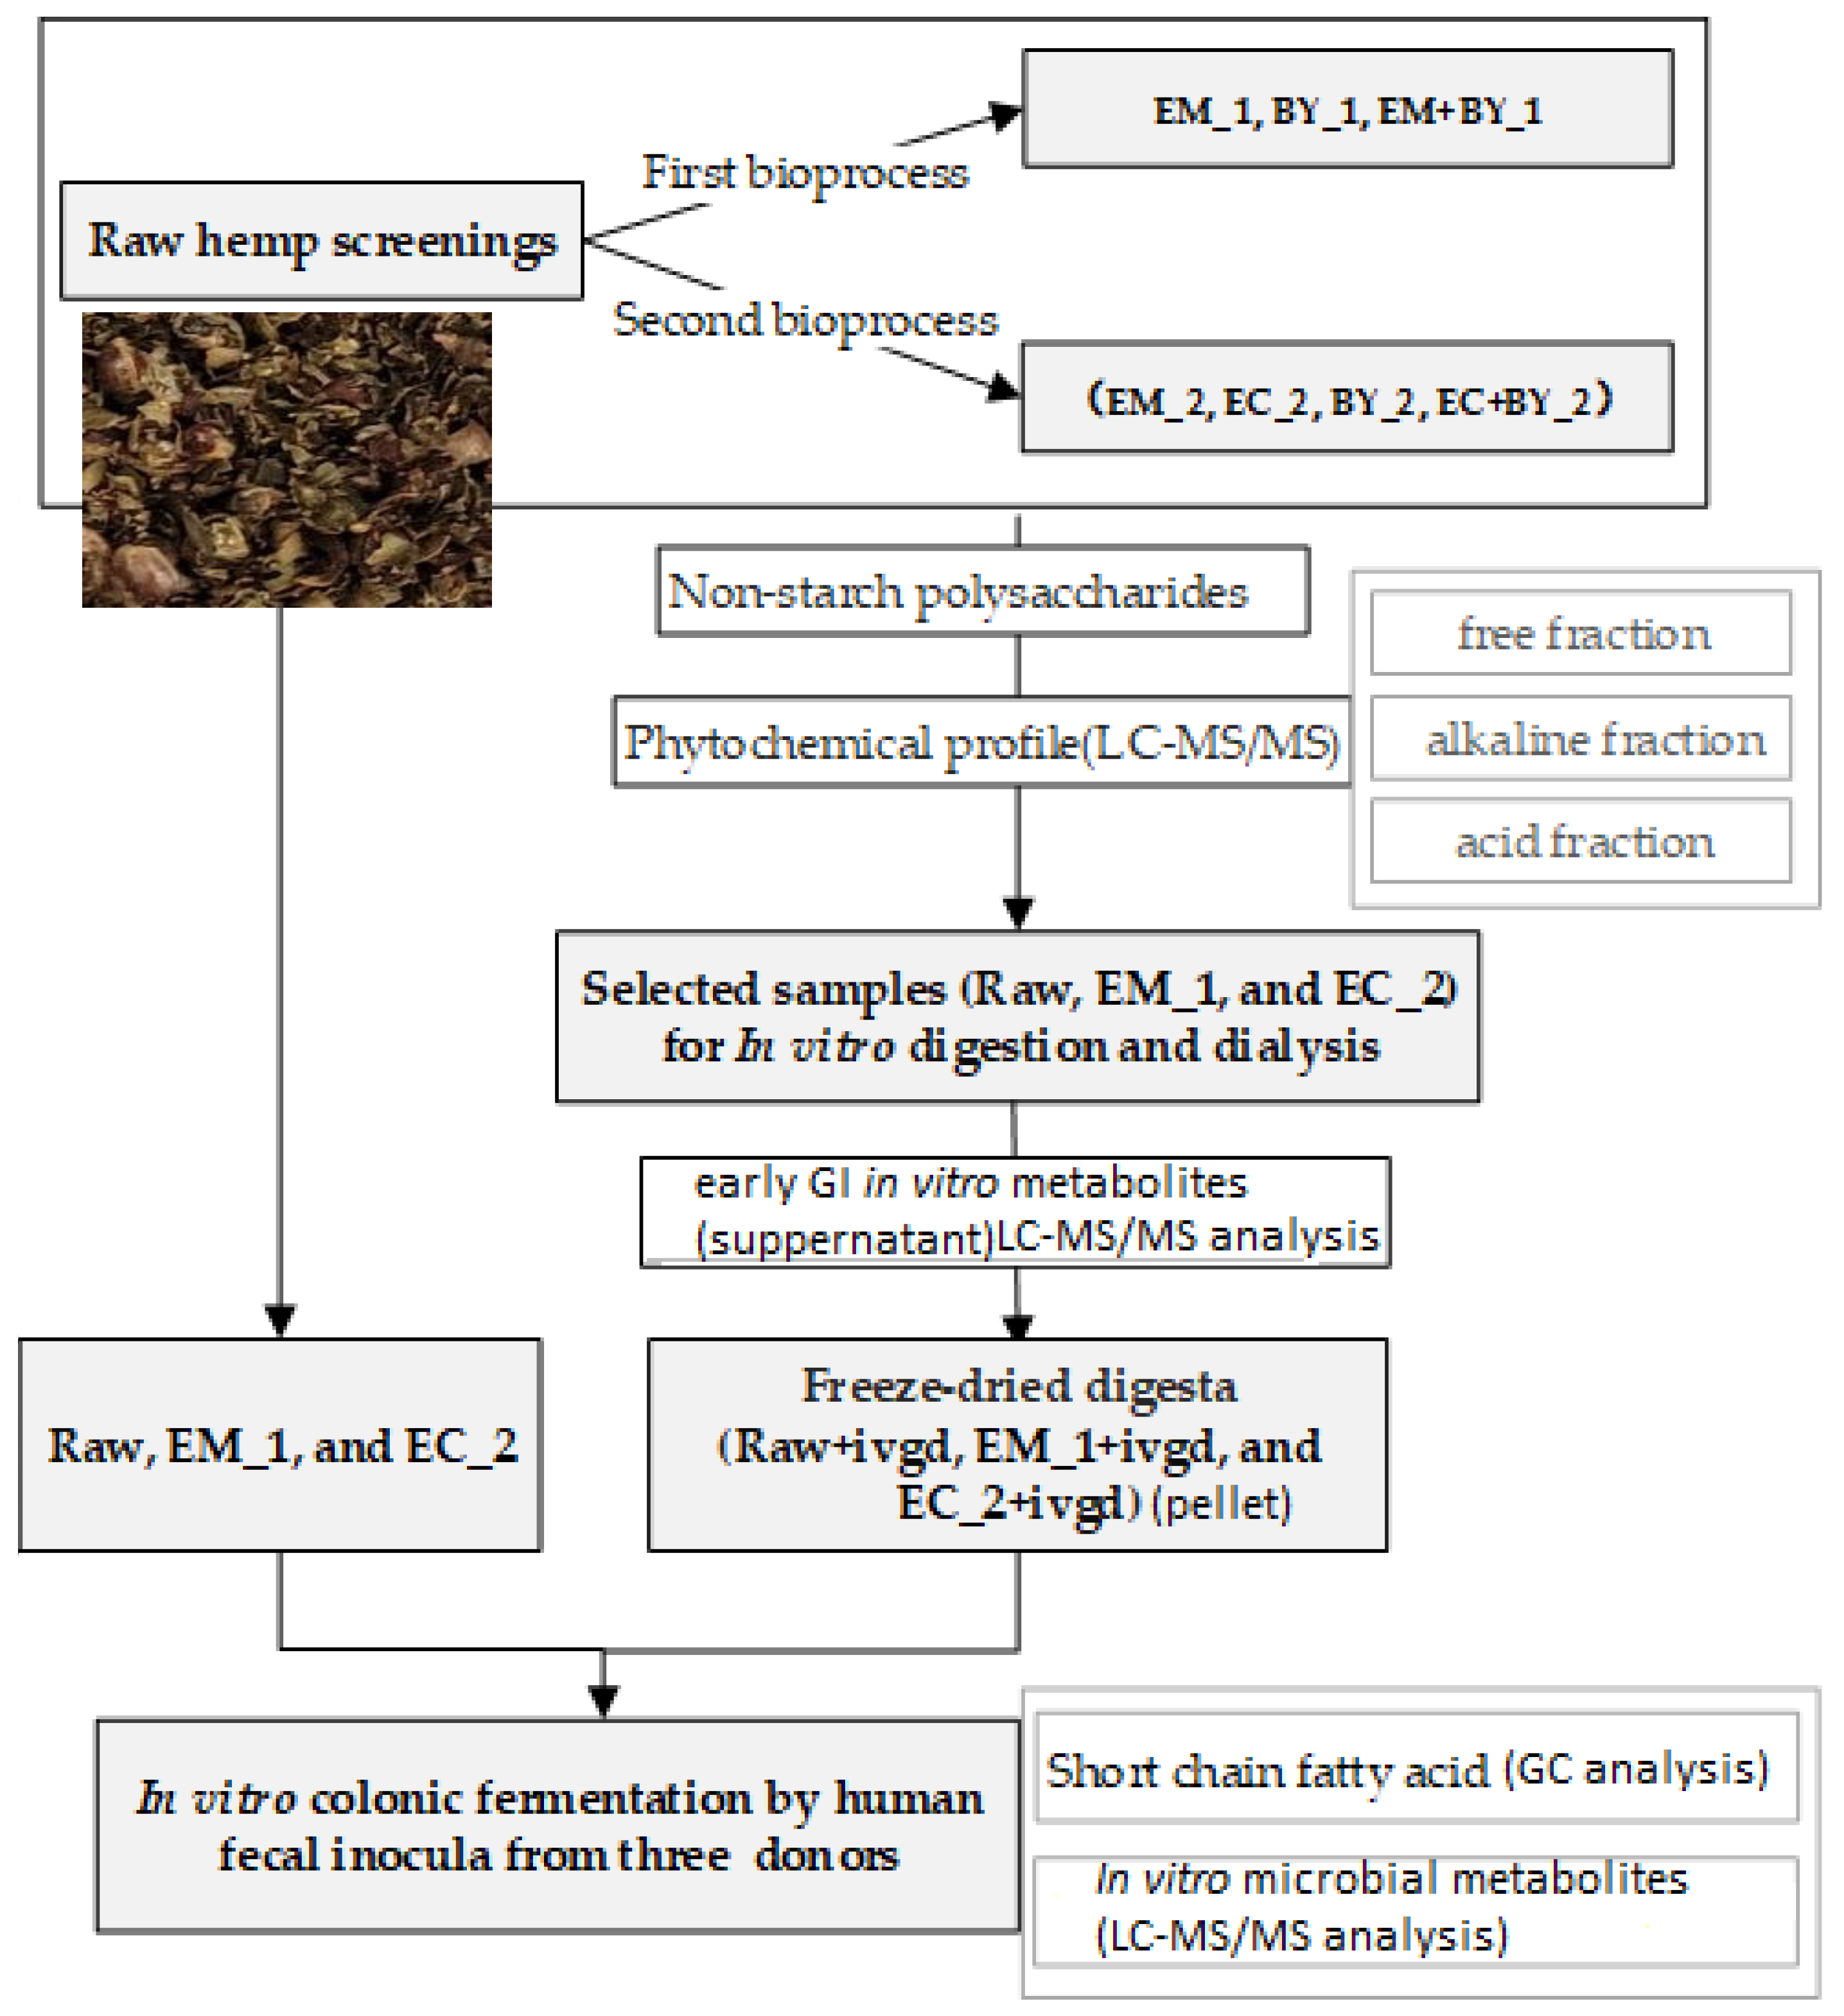
Figure 1. Overview of experimental design: The plant metabolites of the raw hempseed screenings and bioprocessed samples were extracted into their free and bound forms and profiled by targeted LC-MS/MS; the monosaccharide composition analysis of soluble and insoluble NSP by GC analysis. The bioprocessing treatments used enzyme mixture I, enzyme mixture II, yeast fermentation and combinational bioprocessing. The EM_1 (enzymes mixture I) and EC_2 (enzymes mixture II) treatments were selected for in vitro digestion and dialysis system (IVDG) and for in vitro fermentation studies. The concentrations of short chain fatty acids and other digestion and fermentation metabolites were measured using GC and LC-MS/MS analysis.
Applsci 13 05781 g001
Figure 2. Total content of plant metabolites in the free, alkaline-labile, and acid-bound forms of raw and bioprocessed hempseed screenings, including phenolic acids and derivatives, flavonoids, and total lignans (a). Total content is the cumulative sum of the content of individual plant metabolites measured LC-MS/MS in free form, alkaline form, or acid form. A full list of the detected plant metabolites is presented in Supplementary Table S1. Individual phenolic acids and derivatives with a total content of free, alkaline, and acid forms of more than 10 mg Kg−1 affected by both first and second bioprocessing technique (b). Four individual phenolic acids most affected by the second bioprocess (c). In the first bioprocessed samples, gentisic acid and homoprotocatechuic acid were undetectable, and phloretic acid was only detectable in EM + BY_1, and the content of caffeic acid was less than 10 mg Kg−1 (see Supplementary Table S1). The most abundant flavonoids (d) and lignan (e) affected by the bioprocessing. Within the first bioprocess: EM_1 = enzymes mixture I, BY_1= Baker’s Yeast, EM + BY_1 = Baker’s yeast fermentation together with enzymes mixture I, within the second bioprocess: EM_2 = enzymes mixture I, EC_2 = enzymes mixture I with cellulase, BY_2 = Baker’s Yeast, EC + BY_2 = Baker’s yeast fermentation together with mixture I and cellulose. Data are represented with the mean ± S.D. Asterisks indicate the significance between the raw and bioprocessed hempseed screenings, using One-Way ANOVA test: (*) p < 0.05 and (**) p < 0.01.
Applsci 13 05781 g002
Figure 3. Heatmap showing the changes of plant metabolites from hemp screening before (raw) and after bioprocesses during mixed microbiota incubations, including metabolites with consistent increase (a) and consistent decrease (b) during the in vitro colonic fermentation. The metabolites with inconsistent change were shown in Supplementary Table S2, together with all the average values of concentration from the three donors for the microbial metabolites. The raw and enzyme-treated hempseed screenings (EM_1 and EC_2), as well as their corresponding IVDG-predigested samples, were inoculated with faecal slurries from three donors (Donor 1, 2 and 3). Blank samples were inoculated sterile PBS without faecal slurry. Values were the mean of three donors, and each donor had three replicates. The concentration (log 10) was indicated by a colour gradient, where the darker represents the higher concentration. The multiple t-test with the Holm–Sidak method correction was used for statistical comparisons. Significance differences were * p < 0.05, ** p < 0.01, *** p < 0.001 when compared with 0 h samples. Between three donors, the consistently increased and decreased metabolites were marked with red and green, respectively. The principal component analysis (PCA), (unit variance (UV) scaled) of average microbial metabolites measured from faecal incubations from three human donors (c) with baseline samples (0 h in red color) for raw-R, EM_1 & EC_2 treatments-EM and EC, IVDG-predigested samples-D, their blanks-B (0 and 72 h in pink color); the metabolites measured at 24 h-24 (bright green color), the microbial metabolites measured at 48 h-48 (blue color) and respectively 72 h-72 (yellow color).
Applsci 13 05781 g003aApplsci 13 05781 g003b
Figure 4. Short-chain fatty acids (SCFA) production over 72 h fermentation as incremental change (mM) in concentration, average ± STD (n = 3). The raw and enzyme-treated hempseed screenings (EM_1 and EC_2), as well as their IVDG-predigested samples, were inoculated with faecal slurries from each of the three donors (Donor 1, 2 and 3). Values were calculated by subtracting the value of 0 h from the value of the fermented sample at 72 h for each sample. Statistical analysis was evaluated by either one-way ANOVA with Tukey’s tests for multiple comparisons or t-test between two groups (with or without IVDG).
Applsci 13 05781 g004
Table 1. Proximate composition and amino acids composition of the raw hempseed screenings (% w/w). The values are expressed as g/100 g dry weight ± SD (standard deviation).
Proximate
Composition
Content (%)Amino Acids Composition
EAA2Content (%)Non-EAA3Content (%)
dry matter94.32 ± 0.13tryptophan3.83glutamic acid3.02
ash4.47 ± 0.01leucine1.21aspartic acid2.03
protein20.15 ± 0.11valine0.88arginine1.91
total fat25.06 ± 0.22phenylalanine0.85serine0.95
total carbohydrate8.27 ± 0.14isoleucine0.71glycine0.79
total starch0.03 ± 0threonine0.71proline0.77
resistant starchn.d.4histidine0.67alanine0.76
total NSP1 lysine0.67cysteic acid10.52
-Insoluble16.46 ± 0.86methionine0.27tyrosine0.42
-Soluble0.32 ±0.05 cysteine0.20
1 NSP means non-starch polysaccharides. 2 EAA means essential amino acid. 3 non-EAA means nonessential amino acid. 4 n.d. means not detected (i.e., below the detection level).
Table 2. Non-starch polysaccharides (NSP) in the raw and bioprocessed hempseed screenings. Values were expressed as the mean ± S.D., and the total value was the sum of all analysed monosaccharide units (n = 3). A t-test with FDR correction was used for group comparison between Raw and EM_1, EM_2 or EC_2. (*) p < 0.05 and (**) p < 0.01.
NSPRawFirst BioprocessSecond Bioprocess
EM_1BY_1EM+BY_1EM_2EC_2BY_2EC+BY_2
Insoluble (%)
Xylose7.01 ± 0.407.06 ± 0.047.05 ± 0.167.50 ± 0.066.48 ± 0.617.07 ± 0.196.95 ± 0.386.83 ± 0.14
Glucose4.46 ± 0.523.95 ± 0.034.32 ± 0.113.81 ± 0.143.17 ± 0.15 *3.25 ± 0.14 *2.73 ± 0.393.05 ± 0.29
Arabinose0.86 ± 0.010.39 ± 0.02 **0.48 ± 0.000.34 ± 0.000.32 ± 0.01 **0.34 ± 0.01 **0.52 ± 0.010.33 ± 0.01
Galactose0.48 ± 0.010.31 ± 0.01 **0.41 ± 0.000.34 ± 0.030.29 ± 0.03 **0.28 ± 0.00 **0.43 ± 0.040.26 ± 0.01
Rhamnose0.27 ± 0.010.20 ± 0.01 **0.25 ± 0.000.19 ± 0.000.17 ± 0.02 **0.20 ± 0.01 **0.22 ± 0.000.18 ± 0.01
Mannose0.22 ± 0.010.18 ± 0.01 **0.32 ± 0.000.30 ± 0.010.12 ± 0.04 *0.13 ± 0.01 **0.27 ± 0.010.19 ± 0.01
Fucose0.08 ± 0.010.05 ± 0.00 **0.06 ± 0.000.04 ± 0.000.05 ± 0.00 **0.05 ± 0.01 *0.08 ± 0.020.04 ± 0.00
Uronic Acid3.10 ± 0.032.18 ± 0.03 **2.80 ± 0.052.06 ± 0.061.37 ± 0.14 **1.55 ± 0.17 **2.57 ± 0.201.62 ± 0.18
Total16.46 ± 0.8614.32 ± 0.0515.70 ± 0.3114.58 ± 0.1611.96 ± 0.84 **12.87 ± 0.46 **13.77 ± 0.8612.50 ± 0.18
Soluble (%)
Xylose0.03 ± 0.010.06 ± 0.00 **0.02 ± 0.010.04 ± 0.000.04 ± 0.000.06 ± 0.020.04 ± 0.030.08 ± 0.07
Glucose0.04 ± 0.010.02 ± 0.010.02 ± 0.000.02 ± 0.000.03 ± 0.000.04 ± 0.020.04 ± 0.030.03 ± 0.00
Arabinose0.08 ± 0.020.07 ± 0.010.06 ± 0.000.06 ± 0.000.07 ± 0.000.08 ± 0.010.09 ± 0.020.08 ± 0.04
Galactose0.06 ± 0.010.06 ± 0.000.06 ± 0.010.05 ± 0.000.07 ± 0.000.07 ± 0.020.07 ± 0.020.05 ± 0.02
Rhamnose0.02 ± 0.010.06 ± 0.01 **0.02 ± 0.000.02 ± 0.000.03 ± 0.000.04 ± 0.020.04 ± 0.020.02 ± 0.02
Mannosen.d.0.08 ± 0.010.10 ± 0.010.09 ± 0.00n.d.0.02 ± 0.030.04 ± 0.020.03 ± 0.02
Fucose0.04 ± 0.010.06 ± 0.010.05 ± 0.010.06 ± 0.010.05 ± 0.000.05 ± 0.010.03 ± 0.030.04 ± 0.00
Uronic Acid0.06 ± 0.010.17 ± 0.00 **0.05 ± 0.000.13 ± 0.000.17 ± 0.00 **0.16 ± 0.01 **0.05 ± 0.000.15 ± 0.01
Total0.32 ± 0.050.58 ± 0.01 **0.39 ± 0.040.47 ± 0.010.46 ± 0.01 **0.52 ± 0.120.40 ± 0.170.48 ± 0.05
n.d. means not detected (i.e., below the detection level). EM, EC, and BY represented the HS treated with enzyme mixtures I (Depol 740 L + Viscozyme® L + α-Amylase), the combination of enzyme mixtures II and cellulase (enzyme mixtures II), and Baker’s yeast, respectively. EM+BY and EC+BY mean the combination of enzyme treatment and yeast fermentation.
Table 3. The composition of metabolites (measured by targeted LC-MS/MS) measured in the fraction resulted after in vitro digestion of the raw and bioprocessed (EM_1 and EC_2). Values were expressed with mean of three replicates and standard deviation.
Plant Metabolites (mg/Kg)RawEM_1EC_2
Total Content (Initial)Content after In Vitro Digestion Total Content (Initial)Content after In Vitro Digestion Total Content (Initial)Content after In Vitro Digestion
p-coumaric acid53.71 ± 10.723.26 ± 0.4443.56 ± 2.391.23 ± 0.11 *89.09 ± 4.221.53 ± 0.05 *
protocatechualdehyde44.24 ± 5.401.58 ± 0.0528.81 ± 1.901.05 ± 0.09 *37.38 ± 1.061.52 ± 0.12
protocatechuic acid43.66 ± 7.136.52 ± 0.2032.09 ± 1.752.95 ± 0.02 **49.01 ± 1.855.47 ± 0.44
salicylic acid25.59 ± 4.1136.32 ± 1.4834.24 ± 4.6545.30 ± 3.2540.04 ± 1.1148.77 ± 1.55 **
p-hydroxybenzoic acid23.12 ± 2.7120.92 ± 0.9326.73 ± 2.0128.29 ± 1.49 *32.00 ± 2.0131.35 ± 0.58 **
vanillin16.67 ± 0.651.61 ± 0.2116.34 ± 0.732.05 ± 0.3725.77 ± 2.581.98 ± 0.22
ferulic acid16.30 ± 0.4713.91 ± 0.5726.51 ± 3.4521.06 ± 1.02 **47.59 ± 2.2736.97 ± 1.03 **
vanillic acid14.97 ± 0.934.48 ± 0.3619.91 ± 1.3310.35 ± 0.33 **21.67 ± 0.6110.66 ± 0.54 **
p-hydroxybenzaldehyde14.22 ± 1.648.05 ± 0.2214.77 ± 0.688.24 ± 0.5216.58 ± 1.848.65 ± 0.22
syringaldehyde10.81 ± 0.561.86 ± 0.0710.27 ± 0.511.94 ± 0.2119.65 ± 2.581.99 ± 0.04
benzoic acid5.77 ± 0.277.04 ± 0.717.26 ± 0.607.74 ± 1.066.11 ± 0.857.36 ± 1.14
3, 5-dimethoxy-4-hydroxybenzoic acid5.22 ± 0.490.92 ± 0.095.55 ± 0.751.32 ± 0.05 *7.91 ± 1.341.49 ± 0.02 *
phloretic acid3.14 ± 0.325.41 ± 0.27n.d.4.51 ± 0.18 *10.63 ± 0.454.52 ± 0.31 *
caffeic acid2.03 ± 0.493.48 ± 0.133.02 ± 0.382.07 ± 0.04 **7.93 ± 1.323.01 ± 0.07 *
gentisic acidn.d.7.15 ± 0.44n.d.4.41 ± 0.34 **30.41 ± 2.6226.45 ± 1.15 **
homoprotocatechuic acidn.d.4.61 ± 0.54n.d.8.38 ± 0.48 **20.28 ± 1.078.54 ± 0.67 **
n.d. means not detected (i.e., below the detection level). The total content (initial) represents the sum of the free, alkaline, and acid forms of individual metabolites measured by LC-MS/MS (Table S1). A t-test with FDR correction was used for group comparison between Raw and EM_1 as well as Raw and EC_2. (*) p < 0.05 and (**) p < 0.01.
Disclaimer/Publisher’s Note: The statements, opinions and data contained in all publications are solely those of the individual author(s) and contributor(s) and not of MDPI and/or the editor(s). MDPI and/or the editor(s) disclaim responsibility for any injury to people or property resulting from any ideas, methods, instructions or products referred to in the content.