Abstract
The wind turbine generator participates in the primary frequency regulation of the power system by releasing kinetic energy from the rotor. It is necessary to ensure that the rotor speed and converter capacity are within the safe range during the frequency regulation process; otherwise, it will have serious negative effects on the frequency stability of the power system. As an important primary frequency regulation parameter, the dead zone affects the evaluation of the frequency regulation ability of WTG. Therefore, the influence of the dead zone should also be further considered. In order to evaluate the frequency regulation capability of wind turbine generators more comprehensively and accurately, this paper proposes an optimized method for the parameter of virtual synchronous control for wind turbine generators by considering the dead zone and physical constraint boundary of primary frequency regulation. After establishing the time domain expression by considering the frequency regulation dead zone, the real-time frequency regulation capacity of the wind turbine generator is quantified by considering the speed limit of the rotor and the capacity limit of the converter. Furthermore, the optimal value of the frequency regulation coefficient can be derived. Simulation results show that the proposed method can effectively reduce the frequency deviation and frequency change rate of the power system, which can also keep the response within the physical constraint boundary. Consequently, the proposed method can fully utilize the ability for frequency regulation of the wind power generation system and effectively improve the frequency stability of the power system.
1. Introduction
Under the pressure of environmental pollution and an energy crisis, the development and utilization of renewable energies have received more and more attention in the modern power system [1,2]. As WTGs are connected to the power grid through power electronic converters, they are decoupled from the power system and cannot provide frequency support. Therefore, replacing traditional synchronous generators with WTGs will inevitably reduce inertia and weaken the frequency regulation ability of the power system [3,4,5]. In the case of interference, the power system with a high proportion of renewable energies is more prone to grid frequency accidents [6,7].
On the one hand, in order to solve the problem of low inertia and weak damping in the modern system, many scholars have proposed the control strategy of a virtual synchronous generator, that is, by simulating the rotor characteristics of a synchronous generator, the inverter can have inertia and damping [8,9]. The fluctuation of the output frequency and power can be suppressed. In addition, the system’s stability can be improved by using VSG control, which has a broad prospect of application [10,11].
On the other hand, the WTGs participate in frequency regulation mainly through load reduction control [12,13] and rotor kinetic energy control [14,15]. The control of decreasing load is divided into pitch angle control and rotor over-speed control, so that the WTG cannot operate in maximum power point tracking (MPPT) mode. Meanwhile, it reduces the amount of wind energy captured and decreases the economic benefits of the wind farm. Moreover, frequent pitch angle actions will increase the mechanical wear degree of WTG. The rotor kinetic energy control enables the WTG to operate at the MPPT point during normal operation without additional investment. Therefore, this paper focuses on using rotor kinetic energy to realize frequency support for WTG.
A too small frequency regulation coefficient with rotor kinetic energy control is not helpful to fully release the frequency regulation capability of WTGs; on the contrary, a too large frequency regulation coefficient will easily lead to the rotor speed exceeding the constraint value. Therefore, the selection of frequency regulation coefficients for rotor kinetic energy control of WTGs has been further studied. The authors of [16,17] adapted the fixed PFR coefficient control, which results in limitations in the frequency response capability of renewable energy units under different wind speed conditions. Therefore, the variable droop coefficient control method is developed in [18] by adapting to different wind speed conditions. However, the WTG is in a state of load reduction and does not operate at the optimal working point, which reduces the economy of the wind farm. The authors of [19] use the joint control method combining fuzzy control and predictive control to improve the frequency response, supporting the performance of participating systems for VSG. However, the VSG control system is equipped with electrical energy storage, and the control strategy is not applied to WTGs with limited frequency regulation capability, so the practical engineering application value is limited. The authors of [20,21] proposed a modified virtual rotor mechanism, including virtual inertia and virtual damping, to improve the frequency stability of the power system. The authors of [22] studied the comprehensive control strategy of adaptive inertia and damping but did not explain the parameter formulation principle of the inertia and damping coefficients. The authors of [23] proposed a coordinated control method between a wind energy conversion system and a small hydro-generator by modified notch filters without considering the rotor speed constraint of the WTG and the converter capacity limit. The authors of [24] studied the adaptive primary frequency regulation approach with turbine limitations, but they ignored the influence of the primary frequency regulation dead zone.
To sum up, firstly, in most studies, VSG control systems are equipped with electrical energy storage, but the energy storage unit will increase the cost of wind farm construction. There are few studies on the frequency regulation control strategy of a VSG control system with limited frequency regulation capability. Therefore, for WTG based on VSG control with limited frequency regulation capacity, the study of a frequency regulation control strategy has significant practical engineering value. Next, there are a few parameter formulation principles that comprehensively consider the rotor speed constraint of the WTG and the converter capacity limit. Most of the existing literature only considers the rotor speed constraint, which ensures the safety of the operation of WTG, but ignores the converter capacity limit of WTG during the frequency regulation process. The inappropriate frequency regulation parameter tends to make the converter capacity exceed the limit, resulting in converter damage to the WTG. Lastly, the above literature does not quantitatively consider the influence of the PFR dead zone on the frequency regulation process of WTGs. The dead zone is one of the most important parameters of PFR. However, there are few literature studies that quantitatively consider the influence of the PFR dead zone during the frequency regulation process of WTG. The setting of the frequency regulation dead zone is related to the response speed and output of PFR. If the dead zone is set too small, even a slight frequency deviation may cause WTG to respond to the frequency issue, which will affect the service life of WTG and the stability of the power system. If the dead zone setting is too large, the WTG will not act when the system has a large, unbalanced power, which is not conducive to the rapid action of PFR to raise the frequency to the specified range, and frequency accidents may occur. Additionally, the authors of [25] show that if the influence of the PFR dead zone is not considered, the frequency deviation obtained from analysis is smaller than the actual value, so the frequency regulation capability of WTGs cannot be accurately evaluated. Therefore, in the study of frequency regulation parameter optimization for WTG, the modeling of the PFR dead zone should be more carefully considered so as to accurately characterize the PFR capability of WTG, which can improve the capacity of renewable power systems to cope with sudden load changes and the frequency stability of the system.
In order to fill the gaps, this paper proposes an optimization method for a virtual synchronous control parameter of WTG that takes into account the PFR dead zone and physical constraint boundary. The main contributions to this article are as follows:
- Based on the WTG model controlled by VSG, in order to evaluate the frequency regulation capability of WTG more comprehensively and accurately, the primary frequency regulation dead zone is modeled. Then, the evaluation index expression of the whole process of frequency response after the load disturbance is derived through time domain analysis;
- Based on the frequency regulation capacity margin of WTG, this paper proposes a method of frequency regulation capability evaluation by considering both the speed limit of the rotor and the capacity limit of the converter. According to the proposed method, the real-time frequency regulation capacity of WTG is quantified by optimizing the frequency regulation coefficient.
2. Frequency Regulation Strategy of WTG Based on VSG Control
2.1. VSG Control
Due to the converter control, the rotor speed of the WTG is completely decoupled from the frequency of the power system, so the WTG lacks frequency support capacity. In practice, the control technology of the WTG can be improved by simulating the characteristics of a synchronous generator so that the WTG can provide inertia and damping for the power grid. Figure 1 is the VSG control block diagram.
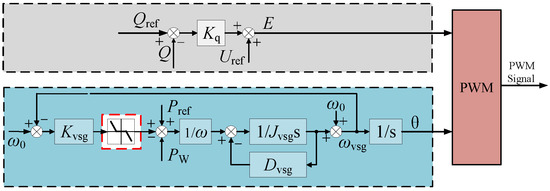
Figure 1.
VSG control block diagram.
The VSG control strategy mainly includes active power-frequency control and reactive power-voltage control. The active power-frequency control equation of VSG is shown in Equation (1) [6]:
The reactive power-voltage governing equation of VSG is shown as follows [6]:
The VSG control is applied to the frequency regulation of the WTG to improve the frequency stability of the power system.
2.2. Frequency Regulation Control Model of WTG
The WTG model controlled by the VSG includes the wind turbine model, shafting rotation model, MPPT control, and the VSG control system. If WTG works in MPPT mode, only the kinetic energy of the rotor can be used to support the system frequency. The frequency regulation control block diagram of the WTG based on VSG control is shown in Figure 2 [26].
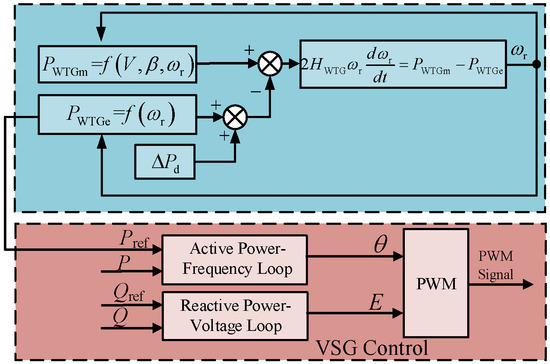
Figure 2.
Control block diagram of WTG.
When the WTG operates in MPPT mode, the output active power is only determined by the WTG rotor speed, and the output active power can be expressed as follows:
Since the frequency response expression of the system needs to be quantitatively derived in this paper, the least squares method is adopted to linearize the output active power of the MPPT control link to facilitate the subsequent calculation, which is shown in Figure 3. The minimum constraint value of the rotor speed is 0.7 pu.
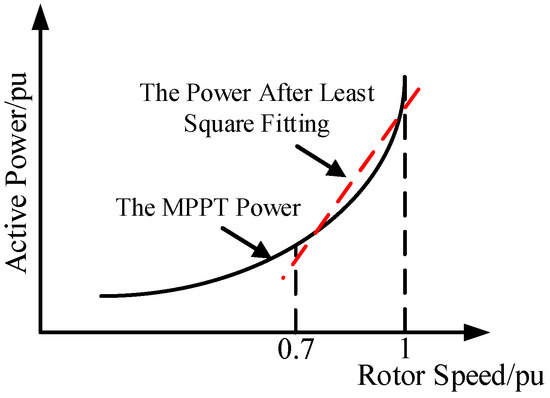
Figure 3.
Least squares fitting process.
After linearization by the least squares method, the output reference power under MPPT control is expressed in Equation (4):
where k and b are the slope and intercept of the line after linear fitting by the least squares method, respectively.
The output electromagnetic power of the WTG can be expressed as follows:
The rotor motion equation of the WTG is shown in (6):
When the WTG participates in the frequency regulation process, the rotor speed of the WTG will change, and on this time scale, the wind speed can be considered constant. Therefore, to simplify the analysis, the variation of PWTGm can be ignored, and the mechanical power of the WTG is assumed to be equal to the output active power under MPPT control. Then, when the WTG participates in the frequency regulation, the small signal equation of Equation (6) can be expressed as in (7):
Equations (4) and (5) can be substituted into (7) as follows:
3. Frequency Response Analysis Considering the PFR Dead Zone
In order to establish a frequency response model of the power grid considering the PFR dead zone, the expression of WTG in the frequency regulation process is derived first. Furthermore, the modeling of the PFR dead zone is quantified. On this basis, the frequency characteristic expressions of the whole process after power disturbance are derived, which lays the foundation for the formulation of a frequency regulation parameter in the next step.
3.1. The Expression of Frequency Response for WTG
For the WTG based on VSG control, ∆PW is related to ∆f and the change rate of frequency; therefore, ∆PW can be expressed as Equation (9):
where ∆Pref = ∆PMPPT.
In the process of PFR, the additional increment of electromagnetic power for WTG based on VSG control is shown as follows:
By substituting (10) into (8), the deviation of rotor speed for the WTG can be obtained during the PFR process:
Furthermore, by substituting (11) into (9), the variation of output power for WTG can be obtained:
3.2. The Modeling of the PFR Dead Zone
In a practical power system, the setting of the PFR dead zone of the WTG is very important, which can avoid the frequent operation of the WTG when the frequency is disturbed in a small range and reduce the equipment life.
In order to further directly analyze the influence of the PFR dead zone (d) on the frequency response characteristic of the power system, the frequency response characteristic curves under different dead zones are drawn as shown in Figure 4, according to the simulation parameters in Table 1.
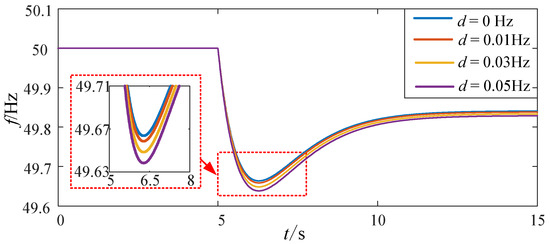
Figure 4.
The frequency response characteristic curves of the power system.

Table 1.
The parameters of simulation.
According to Figure 4, the frequency response curves of four cases are given. When there is no dead zone, the lowest frequency has the highest value, which is 49.66 Hz. When the dead zone is 0.05 Hz, the value of the lowest frequency is the smallest, which is 49.64 Hz. Compared with the response characteristic curves when considering the effect of the PFR dead zone of the WTG, the frequency response characteristic of the power system is better without the dead zone. In addition, the larger the dead zone of PFR is, the smaller the minimum value of system frequency response is.
Therefore, if the influence of the PFR dead zone is not considered in the analysis of frequency response characteristics for the power system, the frequency deviation will be smaller than the actual value of the power grid. It will seriously affect the accurate evaluation of the frequency regulation ability of WTG. In the meantime, the PFR ability of the WTG cannot be fully utilized, which is not helpful to the coordinated and stable operation of the power system. As a result, it is of great significance to quantitatively analyze the influence of the PFR dead zone on the frequency response characteristics of the power system and synthetically evaluate the frequency regulation capacity of the WTG.
When the WTG with the dead zone participates in the frequency regulation, if the frequency deviation is less than or equal to the dead zone PFR, the WTG will not participate in the PFR of the power system. On the contrary, if the frequency deviation is greater than the dead zone of PFR, the additional active power-frequency control for the WTG will be put into operation. In this case, the expression of the PFR power with a dead zone is shown in Equation (13):
The expression of the PFR power without the dead zone is shown in Equation (14):
When the frequency drop is greater than the dead zone due to the sudden increase in load, after considering the quantization and modeling of the PFR dead zone, the control block diagram of the system frequency response can be considered to add the expression, which can be represented as Kvsgd. This constant expression can be added to the transfer function block diagram as a disturbance quantity, and this disturbance quantity is in the same position as the load disturbance quantity in the block diagram.
3.3. Establishment and Quantification of a Frequency Response Model
In order to derive the analytic expression of the frequency response during the whole process, the frequency of the power system is assumed to be equal, which means that the dynamics of frequency for any node as well as the generator are the same. The topology diagram of the power system is shown in Figure 5, which includes a synchronous generator (SG), a WTG, and a load.
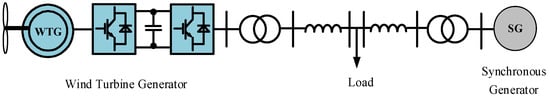
Figure 5.
The topology diagram of the power system.
In the modeling, the classical frequency response model is modified by adding the frequency regulation control of WTG. In this case, the frequency regulation control block diagram of the system can be seen in Figure 6.
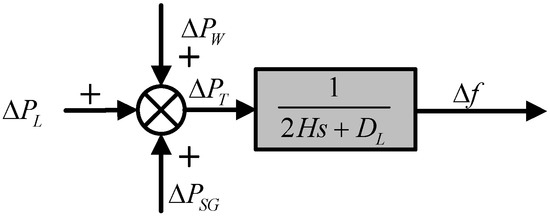
Figure 6.
The frequency response control block diagram of the system.
Assuming that the system is in normal operation before time t0, which means that the power of the SG, WTG, and load are in a balanced state. At t = t0, the load increases ∆PL, resulting in a decrease in the frequency of the power system. When the deviation in frequency (∆f) is detected, the SG and WTG will participate in the PFR. In this case, the equivalent rotor motion equation of the system is shown in (14):
For the SG, ∆PSG is proportional to ∆f; consequently, the PFR of the SG can be reduced to a first-order inertia link. Therefore, the power equation for SG is as follows:
where TG is the turbine reheat time constant and KG represents the PFR coefficient of SG.
Hence, the frequency response model of WTG based on VSG control when participating in frequency regulation of the system is shown in Figure 7. As can be seen from Figure 7, the control block diagram of the frequency response with the PFR dead zone can be considered as adding the constant number of dead zone to the input load disturbance.
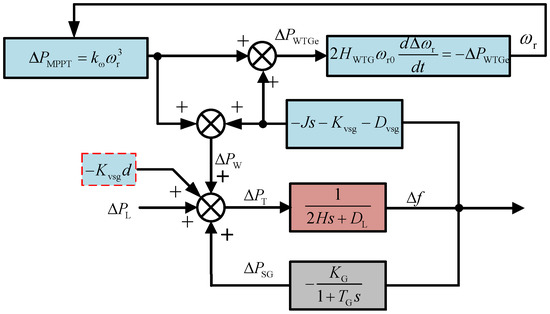
Figure 7.
The control block diagram of the frequency response of the system.
Based on the analysis of the transfer function block diagram in Figure 7, when the frequency response is disturbed by a step power (∆PL), it is set that Dp = Dvsg + Kvsg, then the expression of ∆f(s) is shown in Equation (16):
Variables in (16) are expressed as follows:
Arrange Equation (16) as follows:
Equation (17) can be decomposed into:
By comparing Equation (17) with Equation (18) and making the numerator and denominator coefficients equal, the following relation can be obtained:
Variables in (19) are expressed as follows:
By taking the inverse Laplace transform of Equation (17), Equation (21) is obtained:
where m0, m1, C1, C2, λ, λ1, and λ2 are the time-domain expression coefficients of the frequency response for the system, respectively.
Maximum frequency deviation ∆fmax and maximum frequency change rate can be obtained from the above equation, as (22) shows:
where t1 is the time corresponding to the lowest point of the frequency. Equations (21) and (22), respectively, represent the time-domain characteristics and key indicators of the frequency variation in the power system after considering the PFR dead zone. This analytical expression will lay a quantitative foundation for further optimization of the frequency regulation parameter in the following paper.
4. Trajectory Sensitivity Analysis
In order to further select the frequency regulation coefficient of WTG that plays a leading role in the frequency regulation process, the correlation degree between the frequency regulation parameters and the frequency response of the power system is studied in this section. The trajectory sensitivity of parameters Jvsg, Dvsg, Kvsg, and d will be calculated by using the differential form parameter perturbation method. Then, in the case of a certain amount of disturbance, the intensity of the influence of each parameter on the dynamic frequency process is analyzed. On this basis, the key frequency regulation parameter will be obtained. As shown in Equation (23), trajectory sensitivity reflects the change of the observed quantity e when the parameter xi changes; additionally, the observed quantity e represents the frequency response of the power system:
where Δxi is the change of the parameter of number I; m represents the total number of parameters to be analyzed.
The frequency regulation parameter corresponding to the larger trajectory sensitivity has a strong dynamic trajectory influence on the frequency response. In other words, when the value changes slightly, the dynamic trajectory of the frequency response will change greatly. On the contrary, the dynamic trajectory of frequency response will not change significantly if the frequency regulation parameter corresponding to the smaller trajectory sensitivity changes slightly. By calculating the trajectory sensitivity of frequency regulation parameters such as Jvsg, Dvsg, Kvsg, and d, the influence degree of each parameter on the dynamic trajectory in the whole frequency response process can be obtained, as shown in Figure 8.
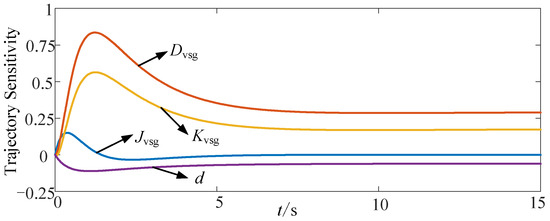
Figure 8.
Trajectory sensitivity curve.
As can be seen from the trajectory sensitivity curve of frequency response in Figure 8, the trajectory sensitivity of the virtual damping coefficient is the largest during the whole frequency regulation response process. The result shows that the virtual damping coefficient has a strong dynamic trajectory effect on the frequency response and plays a key role in the frequency regulation process.
Since the actual system is usually a discrete system, the collected observed variables are discrete, while Equation (23) is mainly used to calculate the trajectory sensitivity of continuous observed variables. By discretizing Equation (23), the average sensitivity calculation formula of discrete observed variables can be obtained, as shown in Equation (24):
where L is the total length of data.
The different discrete sensitivities calculated by Equation (24) are shown in Table 2, which can represent the sensitivities of different variables quantitatively. According to Table 2, Dvsg has the largest discrete sensitivity, which is consistent with the analysis results of the trajectory sensitivity curve.
Table 2.
Trajectory sensitivity.
Therefore, the virtual damping parameter that is most correlated with the frequency response of the system is selected for design in order to improve the dynamic performance of the frequency response more specifically.
5. Optimization of the Virtual Damping Parameter Based on the Physical Constraint Boundary of Frequency Regulation
It can be seen from the above analysis that the virtual damping coefficient is selected for parameter optimization design. Because the virtual damping coefficient directly affects the PFR output of the WTG, the fixed virtual damping parameter is not helpful to the frequency regulation effect, considering that the real-time available frequency regulation capacity of the WTG is different under different wind speed conditions.
Therefore, in order to enable WTG to make full use of rotating kinetic energy in response to the frequency change of the system, this section quantifies the frequency regulation ability of WTG according to different operating conditions and the physical constraint boundary conditions of frequency regulation and then deduces the range of virtual damping coefficients. The frequency regulation physical constraints of the WTG under different wind speed conditions are analyzed from the following two aspects: one is the speed limit of the rotor, and the other is the capacity limit of the converter.
5.1. The Speed Limit of the Rotor
Firstly, the range of the virtual damping coefficient under the speed limit of the rotor is considered, and the minimum speed should be greater than the minimum value (0.7 pu):
The upper limit of the virtual damping coefficient considering the speed limit of the rotor can be obtained by combining (13) and (25), as shown in the following equation:
In (26), ∆ωr.max represents the maximum variation of the rotor speed, dωr/dt is the rate of change of the rotor speed, ∆fmax and d∆f/dt can be calculated through (22), and other system parameters have known values. Since dωr/dt is changing constantly, in order to satisfy the change process, the relation of Equation (26) is always established, dωr/dt should be the minimum. As ωr changes from the initial value to the minimum allowable value, if ωr is at the lowest point, dωr/dt is the minimum and the value is 0. Thus, the minimum value of dωr/dt can be substituted into (26) to find the upper limit of the virtual damping coefficient satisfying the rotor speed constraint.
In the frequency response process, the greater the virtual damping coefficient within the range of frequency regulation physical constraints, the greater the rotor kinetic energy support strength, in addition to the best frequency response performance of the system. Therefore, the upper limit of the virtual damping coefficient calculated according to Equation (26) is the optimal value after considering the rotor speed constraint.
5.2. The Capacity Limit of the Converter
In addition to considering the above constraint, the capacity limit of the converter is also considered. The higher the wind speed, the closer the output active power of the WTG is to the capacity limit. In order to ensure the safe operation of the WTG, the output electromagnetic power should be less than the capacity limit of the converter during the frequency regulation process. The upper limit of the virtual damping coefficient can be obtained from the expression of the output electromagnetic power and the constraint of the converter capacity limit, as shown below:
Similarly, the upper limit of the virtual damping coefficient obtained from Equation (27) is the optimal value after considering the capacity limit of the converter.
In conclusion, the speed limit of the rotor and the power limit of the converter should be considered in the evaluation of the frequency regulation ability of the WTG. The rotor kinetic energy is large at high wind speeds, but it is easily affected by the capacity limit of the converter during frequency regulation processes. When the wind speed is low, the converter has a large capacity margin, but the low rotor speed makes it easy for it to fall below the minimum allowable value, which may cause a secondary frequency drop. Therefore, the optimal value for the virtual damping coefficient under different operating conditions should satisfy both the rotor speed constraint and the capacity constraint of the converter. The optimal value of the virtual damping parameter Dvsg.opt is the smaller value in Equations (27) and (28):
6. Simulation Results
6.1. The Simulation System
The system simulation model, as shown in Figure 5, is built in MATLAB/SIMULINK. The model consists of a synchronous generator and a wind power generation system. Their capacities are 5 MW and 2 MW, respectively. The type of WTG is a permanent magnet synchronous generator. The parameters of the wind power generation system and synchronous generator are shown in Table 3 and Table 4, respectively.
Table 3.
The parameters of a wind power generation system.
Table 4.
The parameters of a synchronous generation.
In order to analyze the effectiveness of the optimization design method proposed in this paper under different wind speeds, three typical examples are selected for simulation analysis. The wind speeds represented by low, medium, and high are selected as 9 m/s, 11 m/s, and 13 m/s, respectively, and the disturbance mode is set as a sudden increase of load in the system at 5 s. The PFR dead zone is set to a typical value of 0.03 Hz.
The figure includes the frequency of the power system, the rotor speed of the WTG, and the output power. The change in frequency in the power system can be intuitively seen from the frequency response waveform. The value of the lowest frequency is very important. If the lowest frequency is too small, it will have adverse effects on the frequency stability of the power system, and the WTG may trip off the grid. As for the response diagram of the rotor speed and active power output of the WTG, if the rotor speed of the WTG is lower than the constraint value, the frequency of the power system will be secondarily dropped. If the converter capacity is higher than the limit value, the converter will be damaged. Therefore, the paper will give the figure that includes the frequency of the power system, the rotor speed of the WTG, and the output power in the simulation results.
6.2. Case Studies
Case 1: The wind speed is 9 m/s, and the system suddenly increases the load by 0.2 MW at 5 s. Virtual damping coefficients are set as 2 pu, 4 pu, and 5.53 pu, respectively, where 5.53 pu is the result according to the design method in this paper. The simulation results are shown in Figure 9.
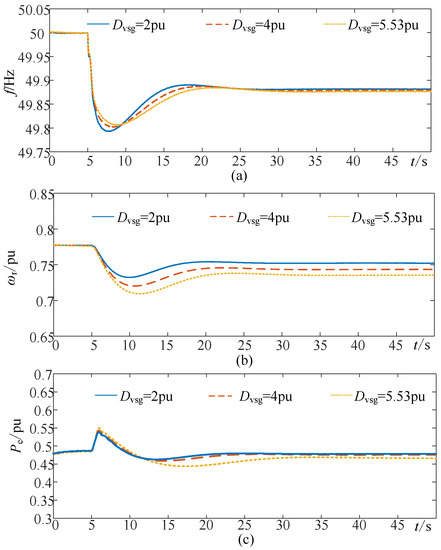
Figure 9.
The simulation results of Case 1. (a) Frequency. (b) Rotor speed. (c) Output active power of WTG.
According to Figure 9a, in the initial phase of the disturbance, the load on the power system increases and the frequency decreases. When the virtual damping coefficients are 2 pu, 4 pu, and 5.53 pu, respectively, the lowest points of frequency are 49.792 Hz, 49.808 Hz, and 49.822 Hz, respectively. When Dvsg is 2 pu, the frequency response reaches its lowest point after 2.52 s. When the Dvsg is 4 pu, the time to reach the lowest point is 3.21 s. When the Dvsg is 5.53 pu, the system frequency response drops to the lowest point after 3.92 s, indicating that the frequency change rate can be reduced during the frequency decline period when the Dvsg is 5.53 pu, as well as that the recovery rate is more stable during the frequency recovery process. The WTG based on VSG control has the ability to regulate frequency; the rotor speed of the WTG decreases in the initial stage of frequency response, and the kinetic energy of the rotor is released for frequency support. Further, the active power output of the WTG is increased to compensate for the active power shortage of the power system. Figure 9b shows that when the virtual damping coefficient is set to 5.53 pu, the minimum rotor speed is close to but not less than 0.7 pu, indicating that the proposed strategy can make full use of the rotor kinetic energy of the WTG and improve the frequency stability of the system.
Case 2: The wind speed is 11 m/s, and the load disturbance is 0.5 MW at 5 s. Virtual damping coefficients are set as 4 pu, 6 pu, and 8.05 pu, respectively, where 8.05 pu is the virtual damping coefficient optimized according to the method proposed in this paper. The simulation results are shown in Figure 10.
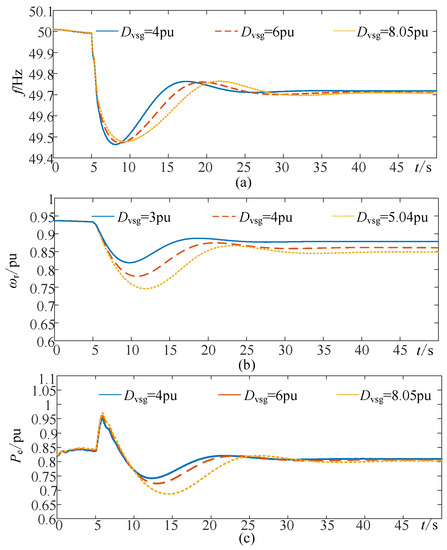
Figure 10.
The simulation results of Case 2. (a) Frequency. (b) Rotor speed. (c) Output active power of WTG.
In Figure 10a, in the initial phase of the disturbance, the unbalanced power of the system causes the frequency of the system to decrease. When the virtual damping coefficients are set as 4 pu, 6 pu, and 8.05 pu, respectively, the lowest points of frequency are 49.468 Hz, 49.476 Hz, and 49.490 Hz, respectively. In the process of PFR, when the Dvsg is 4 pu, the frequency response reaches its lowest point after 3.01 s. When the Dvsg is 6 pu, the time to reach the lowest point is 3.36 s. When the Dvsg is 8.05 pu, it drops to the lowest point after 3.78 s, representing that the frequency change rate can be reduced when the Dvsg is 8.05 pu. In the frequency recovery process, the change rate with Dvsg (8.05 pu) is more stable. The method proposed in this paper can improve the lowest frequency and the frequency change rate of the system. The WTG based on VSG control compensates for the unbalanced power of the kinetic energy of the rotor in the power system, which causes the rotor speed to decrease. In Figure 10b, when the virtual damping coefficient is set to the calculated value of the strategy proposed in this paper, the minimum rotor speed is 0.74 pu, indicating that the wind turbine unit makes full use of the available frequency regulation capacity to improve the frequency support performance of the WTG under the condition of stable wind speed. After the inertial response ends, the rotor speed of the WTG recovers, but due to the steady-state deviation of system frequency, the steady-state rotor speed of the WTG is less than the initial rotor speed.
Case 3: The wind speed is 13 m/s, and the system suddenly increases the load by 0.5 MW at 5 s. The virtual damping coefficients Dvsg are 6 pu, 7.9 pu, and 9.87 pu, respectively, of which 9.87 pu is the virtual damping coefficient designed according to the strategy proposed in this paper. The simulation results are shown in Figure 11.

Figure 11.
The results of Case 3. (a) Frequency. (b) Rotor speed. (c) Output active power of WTG.
As can be seen from Figure 11a, the increased load causes the system frequency to drop at 5 s. When the virtual damping coefficients are set as 6 pu, 7.9 pu, and 9.87 pu, respectively, the lowest points of frequency are 49.730 Hz, 49.752 Hz, and 49.773 Hz, respectively. At the same time, as the frequency drop rate is observed, it can be seen that the time to reach the lowest point is almost the same. However, when the Dvsg is 9.87 pu, the lowest point is higher than the other two values, which indicates that the frequency change rate can be reduced during the frequency drop period and the frequency recovery process is more moderate. Because the WTG is at a high wind speed, the rotor speed of the WTG does not change much. The WTG with frequency regulation ability increases the active power output and reduces the unbalanced power of the power system for frequency support. According to Figure 11c, when the virtual damping coefficient is set to 9.87 pu, the maximum active power output of the WTG is close to 1.2 pu, indicating that the proposed control strategy can make full use of the rotor kinetic energy of the WTG and satisfy the converter capacity within its limit. As a result, the frequency support capability of the WTG is improved.
By analyzing the simulation results of Case 1, Case 2, and Case 3, it can be seen that under different wind speed conditions, the optimization method of the virtual synchronous control parameter proposed in this paper can effectively use the rotor kinetic energy of the WTG for PFR. At the same time, the physical constraint boundary of the PFR is guaranteed, and the frequency stability of the system is improved.
Further, under the three cases of low wind speed, medium wind speed, and high wind speed, the proposed method is compared with the WTG without frequency regulation capability and the WTG with comprehensive inertia control [27].
Case 4: The wind speed is 9 m/s, and the system suddenly increases the load by 0.2 MW at 5 s. The strategy proposed in this paper is compared and analyzed with the WTG without frequency regulation control and the WTG with comprehensive inertia control. The simulation results are shown in Figure 12.
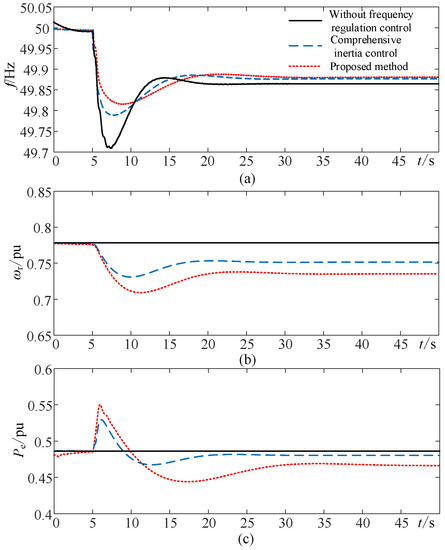
Figure 12.
Comparison results for Case 4. (a) Frequency. (b) Rotor speed. (c) Output active power of WTG.
As can be seen from the simulation results in Figure 12, compared with the comprehensive inertia control and the control without frequency regulation capability, the proposed strategy reduces the frequency deviation of the power system and slows down the frequency drop rate. It also improves the frequency stability of the system and fully releases the frequency regulation ability of the WTG. Compared with comprehensive inertia control, the proposed strategy in this paper increases the active power of the system at the initial stage of the frequency drop, which fully releases the kinetic energy of the rotor for WTG. By comparing different strategies, it can be seen that the frequency deviation of the strategy proposed in this paper is the smallest, and the lowest frequency is 49.822 Hz. Simulation results show that the proposed method can reduce the frequency deviation of the power system by 19.1% compared with comprehensive inertia control. When the WTG does not have the ability to adjust the frequency, the frequency deviation is the largest, and the lowest frequency is 49.715 Hz. The active power output of the WTG is decoupled from the system frequency and cannot respond to the frequency fluctuations of the power system, which results in the failure to excavate the frequency regulation potential of the WTG. When the strategy proposed in this paper is adopted, the lowest point of the rotor speed of the WTG is 0.711 pu, which fully releases the kinetic energy of the rotor and effectively improves the frequency regulation ability of the WTG.
Case 5: The wind speed is 11 m/s, and the load disturbance is 0.5 MW at 5 s. The strategy proposed in this paper is compared and analyzed with the WTG without frequency regulation control and the WTG with comprehensive inertia control. The simulation results are shown in Figure 13.
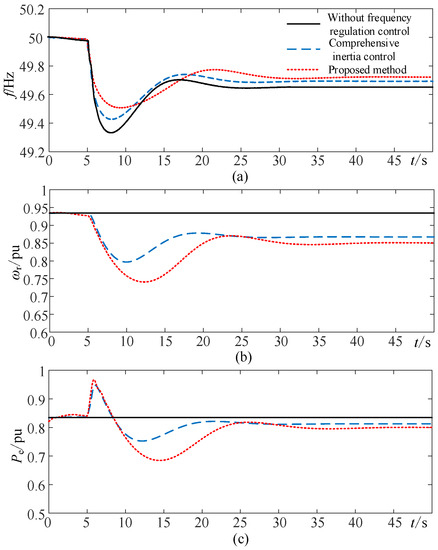
Figure 13.
Comparison results for Case 5. (a) Frequency. (b) Rotor speed. (c) Output active power of WTG.
As can be seen from the simulation results in Figure 13, when the WTG does not have frequency regulation capability, the lowest point of frequency is 49.325 Hz. When the WTG adopts the comprehensive inertia control and the strategy proposed in this paper, the lowest points of frequency are 49.440 Hz and 49.490 Hz, respectively. At the same time, the strategy proposed in this paper can slow down the frequency drop rate. It can be seen from the response of rotor speed that the lowest point of rotor speed is 0.741 pu when the strategy proposed in this paper is adopted. When comprehensive inertia control is adopted, the rotor speed of the WTG is 0.799 pu, which cannot fully release the kinetic energy of the rotor. When the WTG has no frequency control ability, the rotor speed and active power output do not change, and the kinetic energy of the rotor cannot be effectively utilized. Therefore, the proposed strategy can fully release the frequency regulation ability of WTG and effectively improve the frequency stability of the system.
Case 6: The wind speed is 13 m/s, and the system suddenly increases the load by 0.5 MW at 5 s. The strategy proposed in this paper is compared and analyzed with comprehensive inertia control and without frequency regulation. The simulation results are shown in Figure 14.
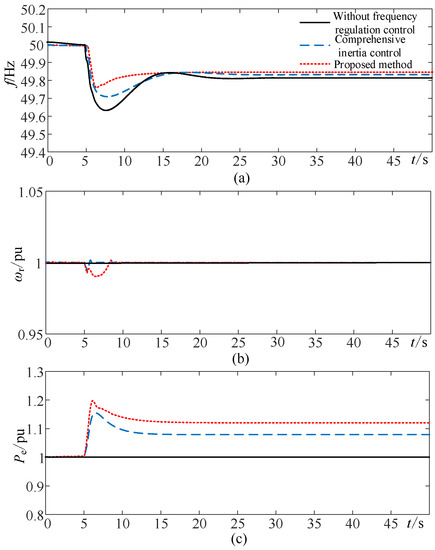
Figure 14.
Comparison results for Case 6. (a) Frequency. (b) Rotor speed. (c) Output active power of WTG.
As can be seen from the simulation results in Figure 14, the strategy proposed in this paper can effectively improve the lowest frequency of the system. When the WTG has no frequency regulation ability, the lowest point of frequency is 49.638 Hz. When the WTG adopts the comprehensive inertia control and the strategy proposed in this paper, the lowest points of frequency are 49.711 Hz and 49.773 Hz, respectively. For the rotor speed response of WTG, the rotor speed is maintained near the rated value under the high wind speed scenario, so the rotor speed does not fluctuate greatly. However, in the case of high wind speeds, the frequency regulation capacity of the WTG is easily affected by the capacity limit of the converter. When the strategy proposed in this paper is adopted, the active power output of a wind turbine is 1.192 pu. The influence of converter capacity limits is considered, and the frequency regulation capability of WTG is fully released. In general, the proposed strategy effectively improves the frequency regulation and control performance of WTG.
7. Conclusions
The optimization of frequency regulation parameters of WTG based on VSG control is investigated, which comprehensively considers the available frequency regulation capabilities under different operating states. Moreover, this paper proposes an optimization method for the VSG control parameter of WTG considering the PFR dead zone and the frequency regulation physical constraint boundary, which could improve the frequency stability of the system. The main conclusions are as follows:
- The frequency regulation capability of WTG can be evaluated more comprehensively and accurately by quantifying the influence of the PFR dead zone on the system frequency response. Additionally, the frequency response model of the WTG based on VSG control is established, and the time domain analytic expression of the whole frequency response process is obtained;
- The trajectory sensitivity of each frequency regulation parameter is calculated, and the intensity of influence for each parameter on the dynamic frequency process is analyzed. As a result, the virtual damping parameter that plays a key role in the frequency modulation process is determined;
- Considering the different operating conditions and the dynamic frequency response process comprehensively, the optimization value of the virtual damping coefficient is determined based on the constraints of rotor speed and converter capacity so that WTG can make full use of available frequency regulation capacity and improve the frequency support capability. Hence, the proposed scheme has a certain engineering value for the optimization of the frequency regulation control parameter of WTG based on VSG control.
There is still some research in this paper that needs further consideration and improvement. This paper discussed the frequency regulation control strategy of WTG, but less consideration was given to the interaction characteristics of WTG and SG during the frequency regulation process. Considering the difference in frequency regulation characteristics between WTG and SG, the collaborative frequency regulation control strategy of WTG and SG can be further studied.
Author Contributions
Conceptualization, P.S. and J.C.; data curation, Z.Q.; methodology, Z.C. and J.C.; validation, P.S., Z.C. and J.C.; formal analysis, P.S.; investigation, J.C.; project administration, P.S.; software, Z.C. and J.C.; supervision, Z.C. and Z.Q.; writing—original draft, J.C.; writing—review and editing, P.S. All authors have read and agreed to the published version of the manuscript.
Funding
This research received no external funding.
Institutional Review Board Statement
Not applicable.
Informed Consent Statement
Not applicable.
Data Availability Statement
Please contact the corresponding author for available data support.
Conflicts of Interest
The authors declare no conflict of interest.
Nomenclature
| MPPT | maximum power point tracking |
| PFR | primary frequency regulation |
| SG | synchronous generator |
| VSG | virtual synchronous generator |
| WTG | wind turbine generator |
| Pref | active power reference value (pu) |
| PW | output active power (pu) |
| PWTGe | electromagnetic power (pu) |
| PWTGm | mechanical power (pu) |
| PMPPT | output active power in MPPT mode (pu) |
| ΔPd | correction amount of electromagnetic power (pu) |
| ∆Pref | deviation of active power reference value (pu) |
| ∆Pf | output active power of PFR (pu) |
| ∆Pw | deviation of output active power (pu) |
| ∆PSG | output power variation of SG (pu) |
| ∆f | deviation of frequency (Hz) |
| Δωr | deviation of rotor speed (pu) |
| ω0 | rated angular frequency value (pu) |
| ωvsg | output angular frequency value (pu) |
| ωr | rotor speed (pu) |
| ωr0 | initial rotor speed (pu) |
| V | wind speed (m/s) |
| β | pitch angle (°) |
| Kvsg | the PFR coefficient |
| Jvsg | virtual inertia |
| Dvsg | virtual damping |
| Qref | reactive power reference value (pu) |
| Q | output reactive power (pu) |
| Uref | given value of output voltage amplitude (pu) |
| E | output voltage (pu) |
| Kq | reactive power-voltage droop regulation coefficient |
| kω | maximum power tracking coefficient |
| HWTG | inertia time constant of the WTG (s) |
| H | inertial time constant of the power system (s) |
| d | PFR dead zone (Hz) |
| DL | damping coefficient of system load |
| TG | turbine reheat time constant (s) |
| KG | PFR coefficient of SG (pu) |
References
- Singh, N.; Boruah, D.; De Kooning, J.D.M.; De Waele, W.; Vandevelde, L. Impact Assessment of Dynamic Loading Induced by the Provision of Frequency Containment Reserve on the Main Bearing Lifetime of a Wind Turbine. Energies 2023, 16, 2851. [Google Scholar] [CrossRef]
- Tu, G.; Li, Y.; Xiang, J. Coordinated Rotor Speed and Pitch Angle Control of Wind Turbines for Accurate and Efficient Frequency Response. IEEE Trans. Power Syst. 2022, 5, 3566–3576. [Google Scholar] [CrossRef]
- Ravanji, M.H.; Cañizares, C.A.; Parniani, M. Modeling and Control of Variable Speed Wind Turbine Generators for Frequency Regulation. IEEE Trans. Sustain. Energy 2020, 11, 916–927. [Google Scholar] [CrossRef]
- Zhang, X.; Lin, B.; Xu, K.; Zhang, Y.; Hao, S.; Hu, Q. An Improved Over-Speed Deloading Control of Wind Power Systems for Primary Frequency Regulation Considering Turbulence Characteristics. Energies 2023, 16, 2813. [Google Scholar] [CrossRef]
- Afifi, M.A.; Marei, M.I.; Mohamad, A.M.I. Modelling, Analysis and Performance of a Low Inertia AC-DC Microgrid. Appl. Sci. 2023, 13, 3197. [Google Scholar] [CrossRef]
- Sun, P.; Yao, J.; Zhao, Y.; Fang, X.; Cao, J.Y. Stability Assessment and Damping Optimization Control of Multiple Grid-connected Virtual Synchronous Generators. IEEE Trans. Energy Convers. 2021, 36, 3555–3567. [Google Scholar] [CrossRef]
- Australian Energy Market Operator. Update Report: Black System Event in South Australia on 28 September 2016; Australian Energy Market Operation Limited: Melbourne, Australia, 2016. [Google Scholar]
- Chen, M.; Zhou, D.; Blaabjerg, F. Active Power Oscillation Damping Based on Acceleration Control in Paralleled Virtual Synchronous Generators System. IEEE Trans. Power Electron. 2021, 8, 9501–9510. [Google Scholar] [CrossRef]
- Shadoul, M.; Ahshan, R.; AlAbri, R.S.; Al-Badi, A.; Albadi, M.; Jamil, M. A Comprehensive Review on a Virtual-Synchronous Generator: Topologies, Control Orders and Techniques, Energy Storages, and Applications. Energies 2022, 15, 8406. [Google Scholar] [CrossRef]
- Zhang, Y.; Sun, Q.; Zhou, J.; Guerrero, J.M.; Wang, R.; Lashab, A. Optimal Frequency Control for Virtual Synchronous Generator Based AC Microgrids via Adaptive Dynamic Programming. IEEE Trans. Smart Grid 2023, 14, 4–16. [Google Scholar] [CrossRef]
- Xiong, X.; Wu, C.; Hu, B.; Pan, D.; Blaabjerg, F. Transient Damping Method for Improving the Synchronization Stability of Virtual Synchronous Generators. IEEE Trans. Power Electron. 2021, 36, 7820–7831. [Google Scholar] [CrossRef]
- Zeng, X.; Liu, T.; Wang, S.; Dong, Y.; Chen, Z. Comprehensive Coordinated Control Strategy of PMSG-Based Wind Turbine for Providing Frequency Regulation Services. IEEE Access 2019, 7, 63944–63953. [Google Scholar] [CrossRef]
- Wang, S.; Tomsovic, K. Fast Frequency Support From Wind Turbine Generators with Auxiliary Dynamic Demand Control. IEEE Trans. Power Syst. 2019, 34, 3340–3348. [Google Scholar] [CrossRef]
- Cardenas, R.; Pena, R.; Alepuz, S.; Asher, G. Overview of Control Systems for the Operation of DFIGs in Wind Energy Applications. IEEE Trans. Ind. Electron. 2013, 60, 2776–2798. [Google Scholar] [CrossRef]
- Wilches-Bernal, F.; Chow, H.; Sanchez-Gasca, J. A Fundamental Study of Applying Wind Turbines for Power System Frequency Control. IEEE Trans. Power Syst. 2016, 31, 1496–1505. [Google Scholar] [CrossRef]
- Van de Vyver, J.; De Kooning, J.D.M.; Meersman, B.; Vandevelde, L.; Vandoorn, T.L. Droop Control as an Alternative Inertial Response Strategy for the Synthetic Inertia on Wind Turbines. IEEE Trans. Power Syst. 2016, 31, 1129–1138. [Google Scholar] [CrossRef]
- Ghosh, S.; Kamalasadan, S.; Senroy, N. Doubly Fed Induction Generator (DFIG)-Based Wind Farm Control Framework for Primary Frequency and Inertial Response Application. IEEE Trans. Power Syst. 2016, 31, 1861–1871. [Google Scholar] [CrossRef]
- Arani, M.F.M.; Mohamed, Y.A.R.I. Dynamic Droop Control for Wind Turbines Participating in Primary Frequency Regulation in Microgrids. IEEE Trans. Smart Grid 2018, 9, 5742–5751. [Google Scholar] [CrossRef]
- Long, B.; Liao, Y.; Chong, K.T.; Rodriguez, J.; Guerrero, J.M. Enhancement of Frequency Regulation in AC Microgrid: A Fuzzy-MPC Controlled Virtual Synchronous Generator. IEEE Trans. Smart Grid 2021, 12, 3138–3149. [Google Scholar] [CrossRef]
- Abubakr, H.; Guerrero, J.M.; Vasquez, J.C.; Mohamed, T.H.; Mahmoud, K.; Darwish, M.M.; Dahab, Y.A. Adaptive LFC Incorporating Modified Virtual Rotor to Regulate Frequency and Tie-Line Power Flow in Multi-Area Microgrids. IEEE Access 2022, 10, 33248–33268. [Google Scholar] [CrossRef]
- Abubakr, H.; Vasquez, J.C.; Mohamed, T.H.; Guerrero, J.M. The concept of direct adaptive control for improving voltage and frequency regulation loops in several power system applications. Int. J. Electr. Power Energy Syst. 2022, 140, 108068. [Google Scholar] [CrossRef]
- Li, D.; Zhu, Q.; Lin, S.; Bian, X.Y. A Self-Adaptive Inertia and Damping Combination Control of VSG to Support Frequency Stability. IEEE Trans. Energy Convers. 2017, 32, 397–398. [Google Scholar] [CrossRef]
- STyagi, S.; Das, S.; Singh, B. Coordinated Control for Seamless Integration of Wind Energy Conversion System with Small Hydrogenerator Through Modified Notch Filters. IEEE Trans. Energy Convers. 2023, 2023, 1–10. [Google Scholar] [CrossRef]
- Melhem, B.M.; Liu, S. Adaptive approach for primary frequency support by wind turbines based on grid code requirements and turbines limitations. In Proceedings of the 2023 IEEE PES Grid Edge Technologies Conference & Exposition (Grid Edge), San Diego, CA, USA, 10–13 April 2023; pp. 1–5. [Google Scholar]
- Fan, Y.; Qin, C.; Ju, P. Model Simplification and Parameter Identification of Generator Speed Governor System with Dead Zone Counting. In Proceedings of the 2022 IEEE/IAS Industrial and Commercial Power System Asia (I&CPS Asia), Shanghai, China, 6–9 July 2022. [Google Scholar]
- Huang, X.; Jin, Y.; Yan, P.; Ma, J.; Wang, C.; Ju, P. Integrated Model of DFIG and SFR for Frequency Regulation Control Research of Wind Turbine Generator. In Proceedings of the 2021 International Conference on Power System Technology (POWERCON), Haikou, China, 8–9 December 2021; pp. 57–61. [Google Scholar]
- Yu, L.; Sun, X.; Li, T.; Zhong, H.; Li, M.; Shao, Y. Virtual Inertia Control and Identification Method of Inertia Parameters for Doubly-Fed Units. In Proceedings of the 2022 4th International Conference on Smart Power & Internet Energy Systems (SPIES), Beijing, China, 27–30 October 2022; pp. 958–963. [Google Scholar]
Disclaimer/Publisher’s Note: The statements, opinions and data contained in all publications are solely those of the individual author(s) and contributor(s) and not of MDPI and/or the editor(s). MDPI and/or the editor(s) disclaim responsibility for any injury to people or property resulting from any ideas, methods, instructions or products referred to in the content. |
© 2023 by the authors. Licensee MDPI, Basel, Switzerland. This article is an open access article distributed under the terms and conditions of the Creative Commons Attribution (CC BY) license (https://creativecommons.org/licenses/by/4.0/).