


Experimental Verification and Analysis of Vibration Damping Structure of Piezoelectric Ceramic Grain Loss Sensor

Abstract
:1. Introduction
2. Working Principle
2.1. Sensor Structure
2.2. Vibration Damping Dynamics Model Analysis
3. Materials and Methods
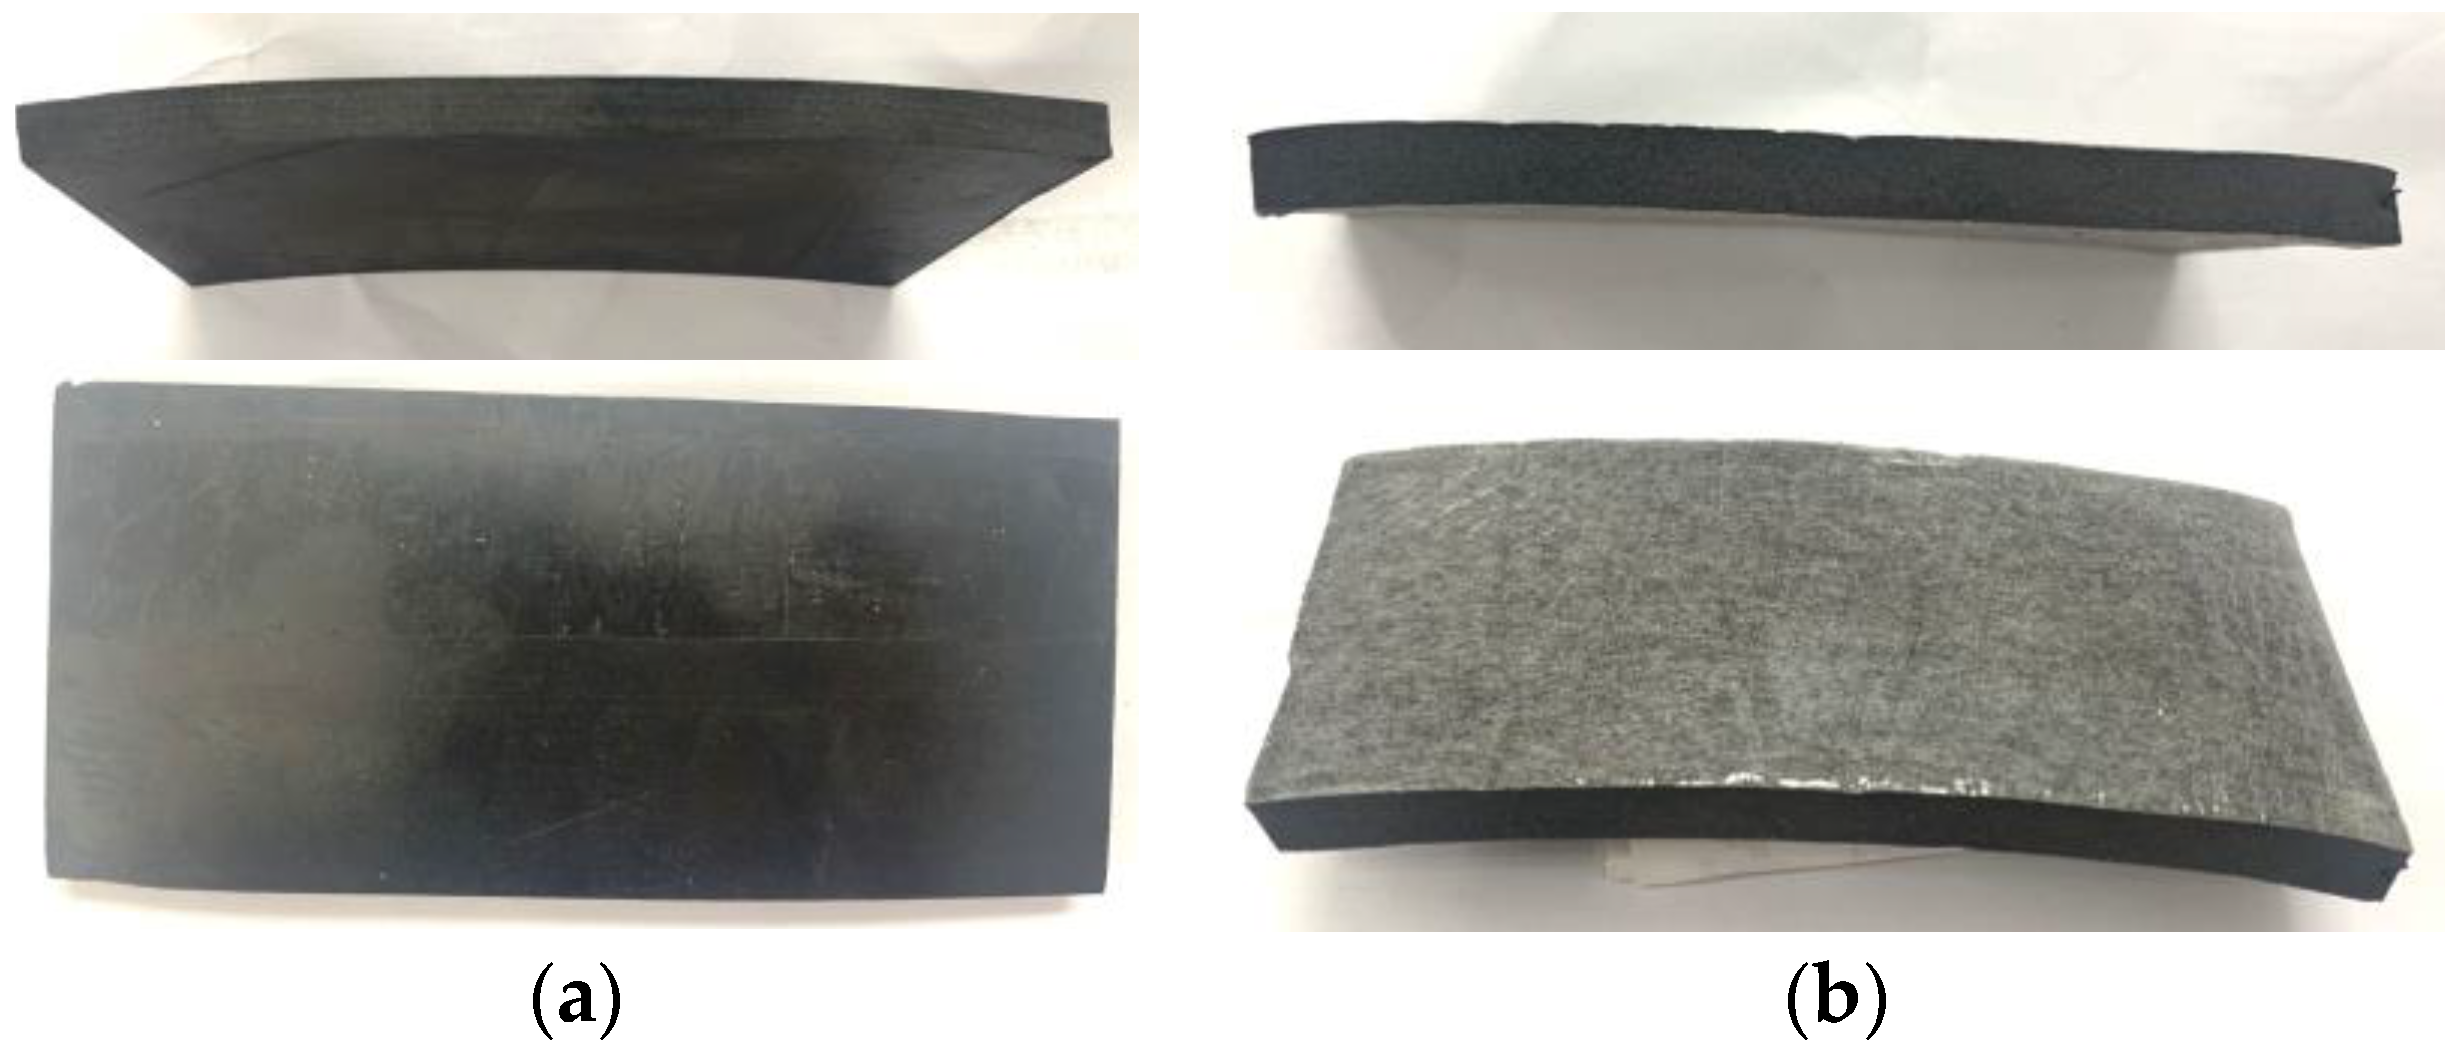
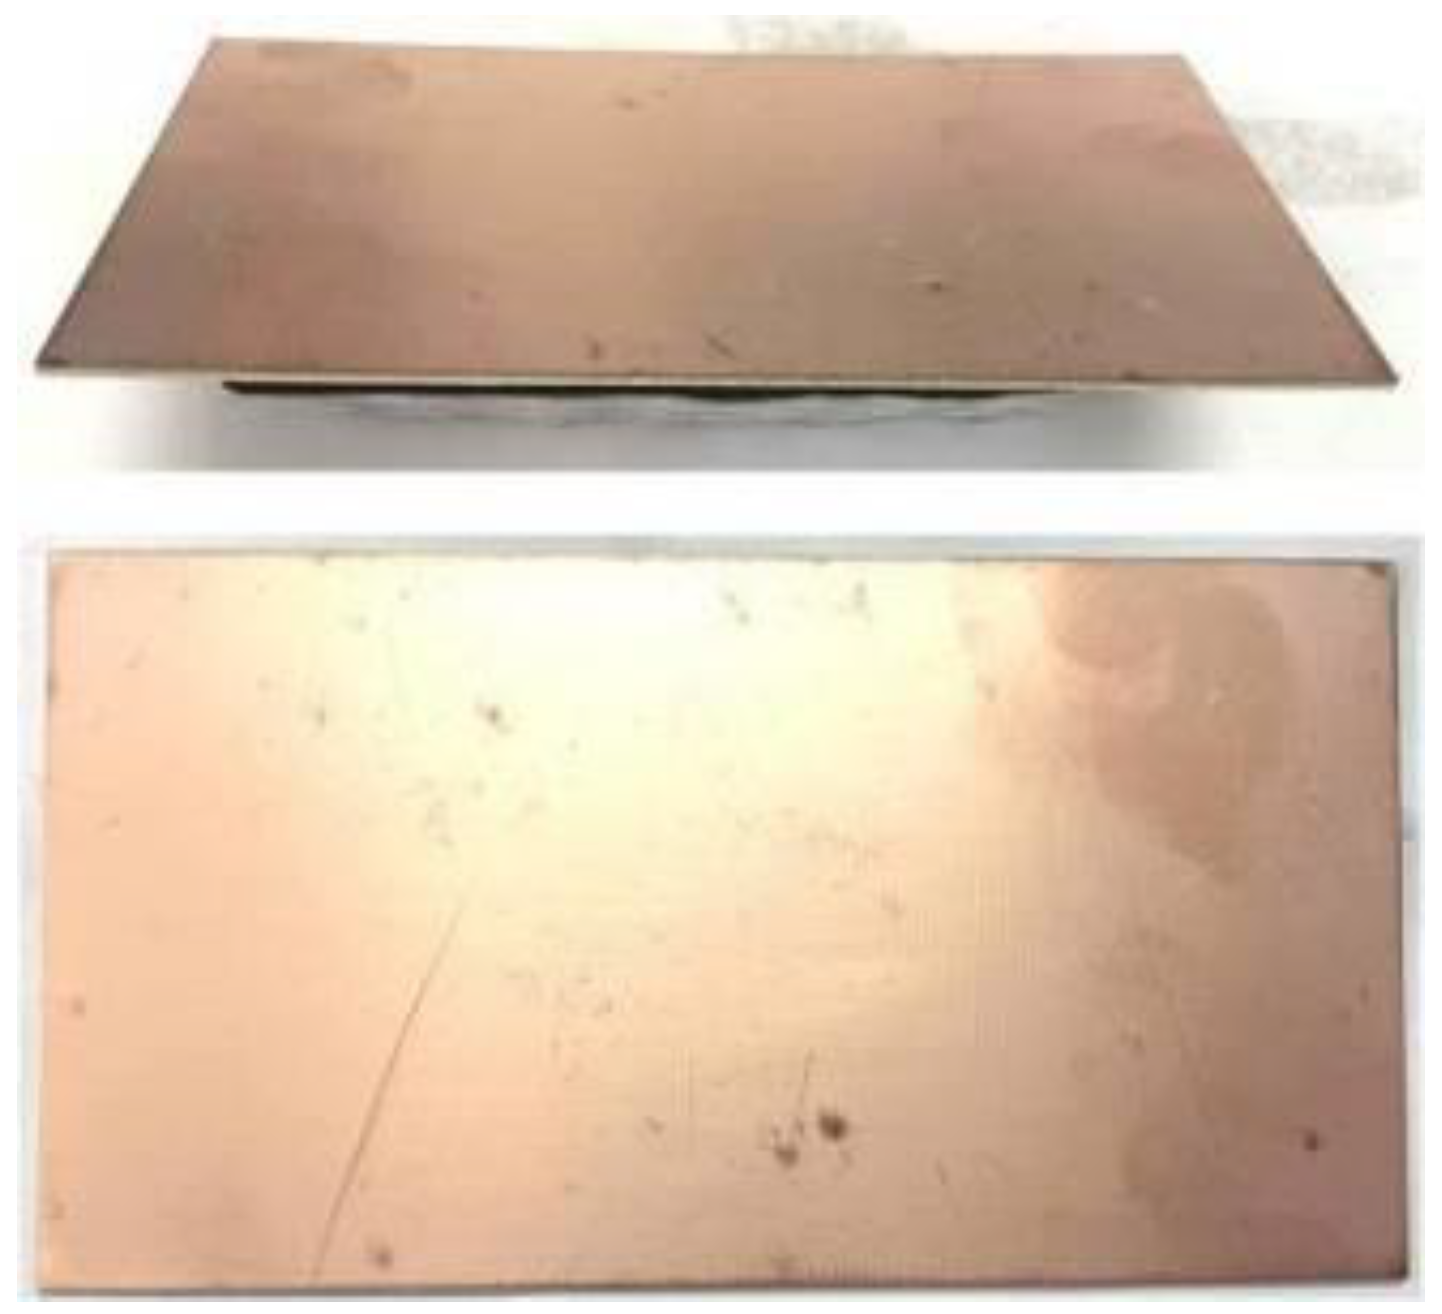
3.1. Test Materials
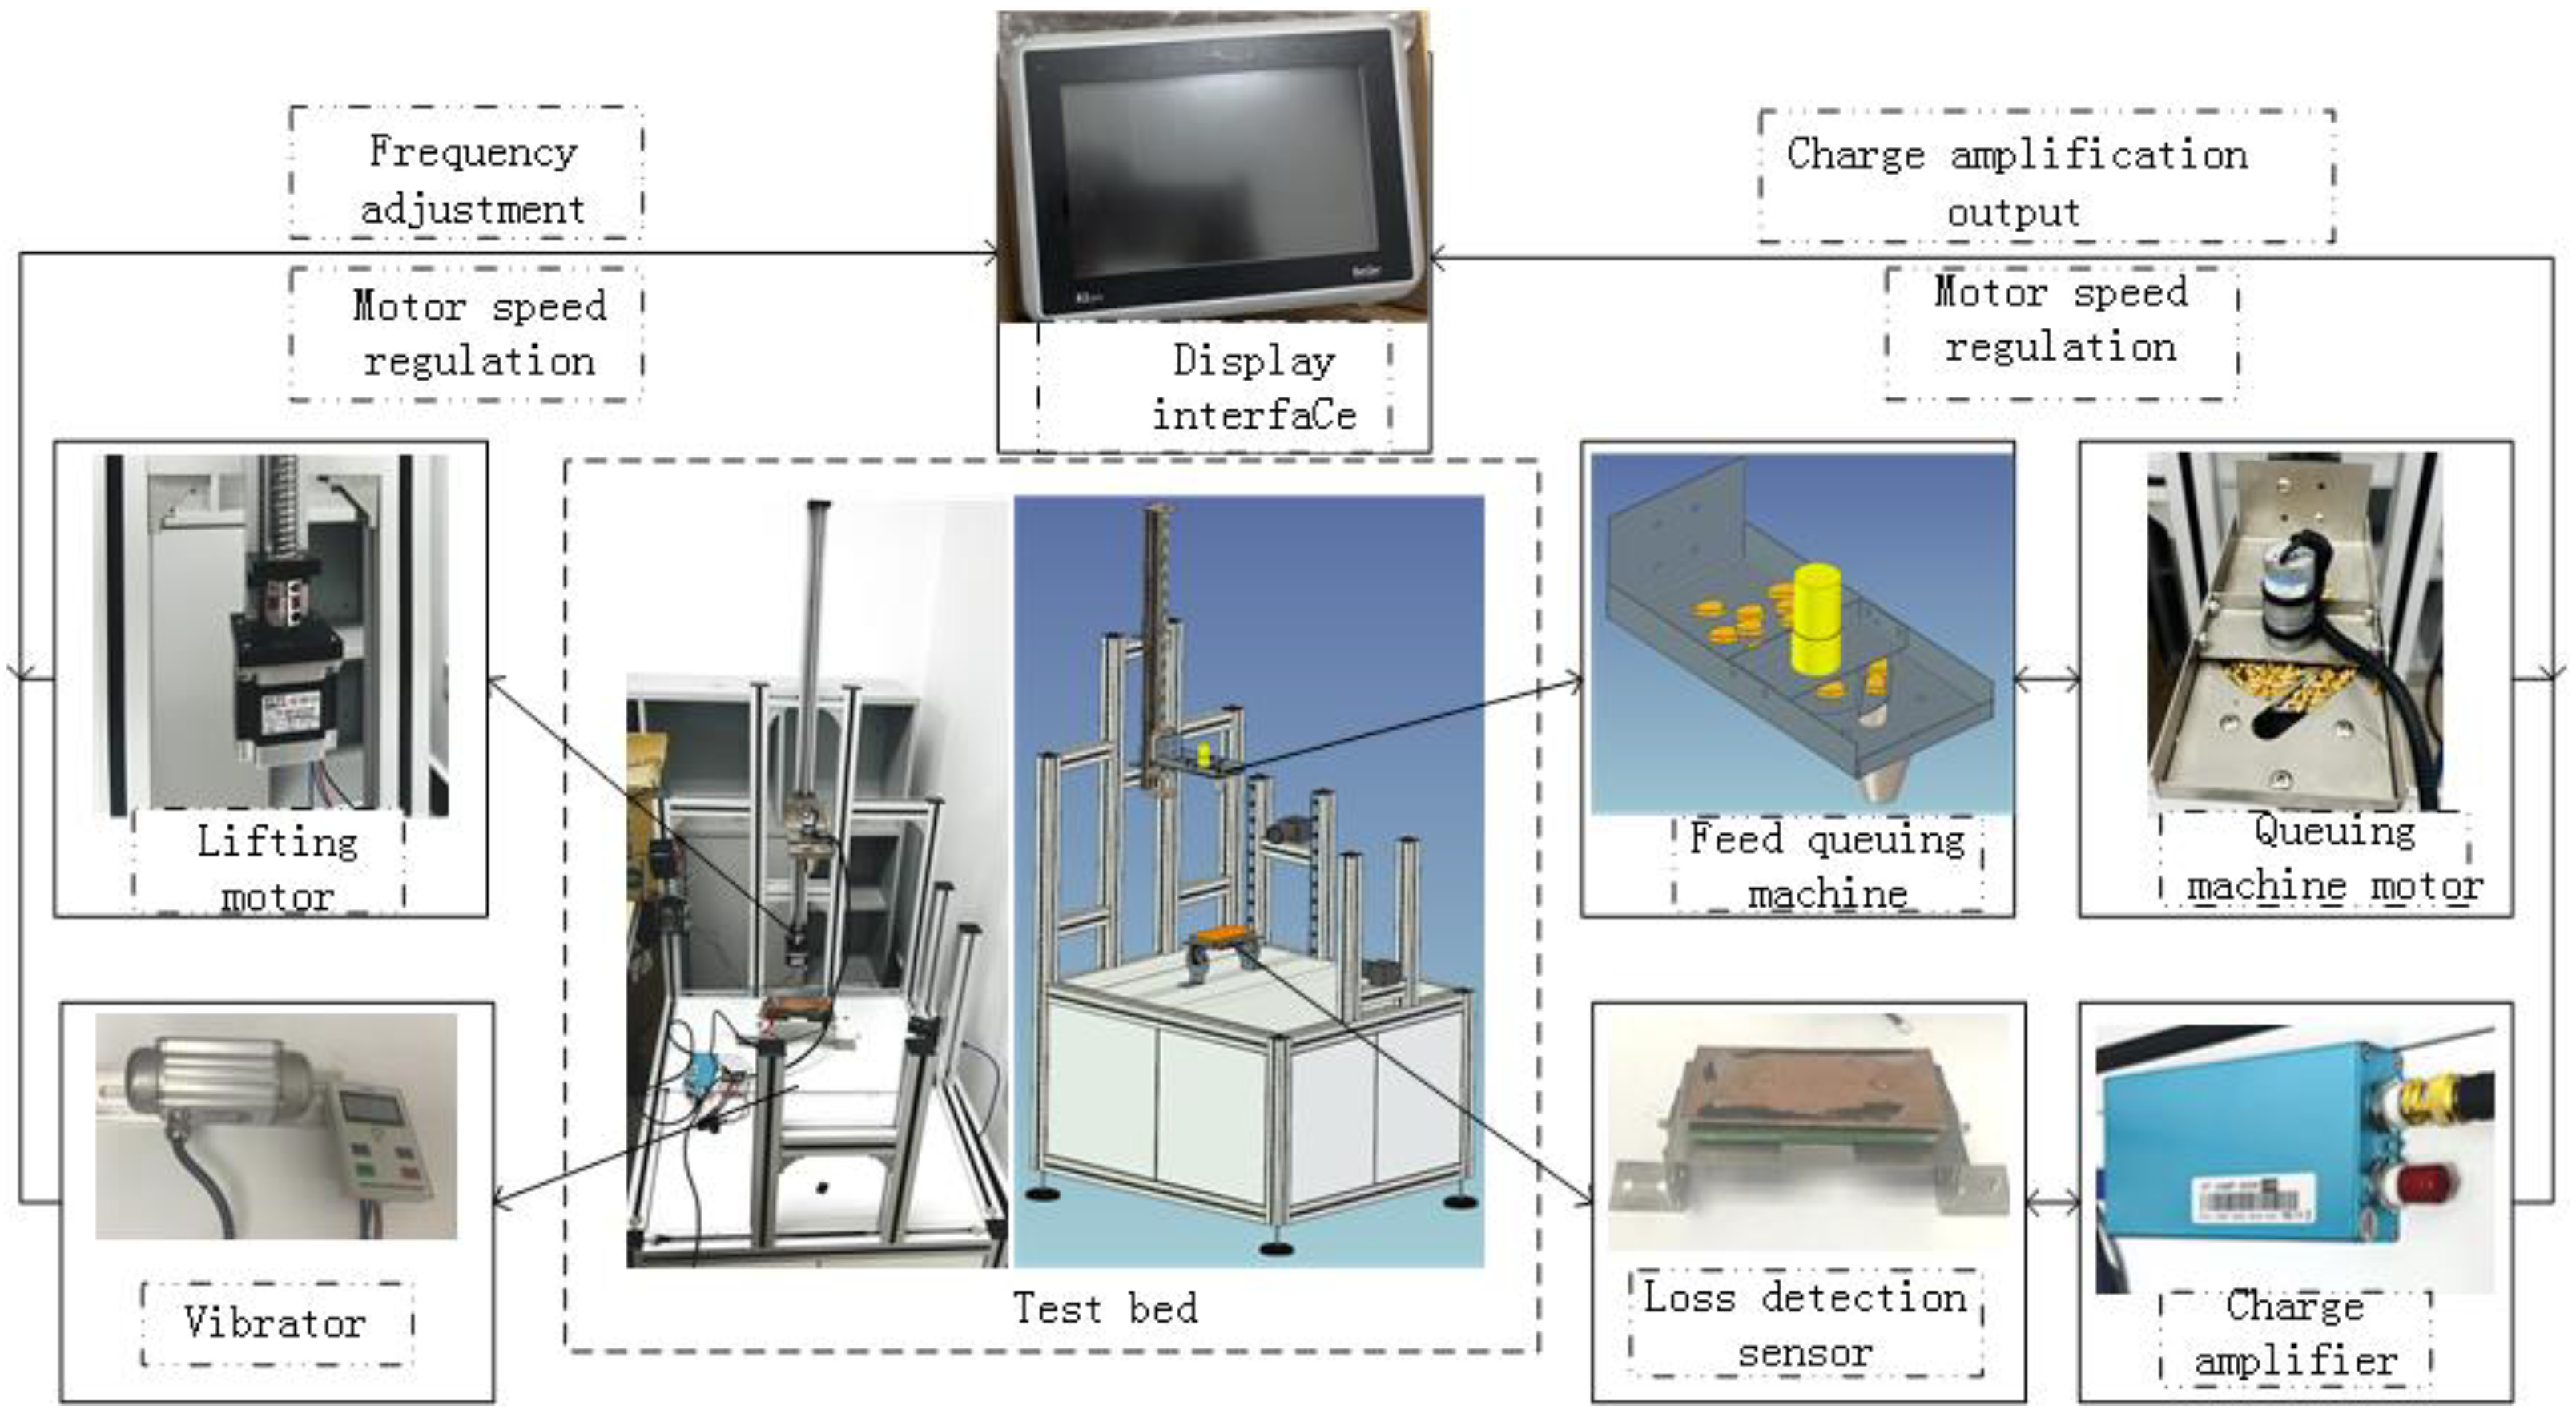
3.2. Test Device
3.3. Experimental Design
- (1)
- The impact plate of the loss detection sensor is fixed on the test bench without any damping material, and the charge amplifier is connected to the piezoelectric ceramic lead and can work normally.
- (2)
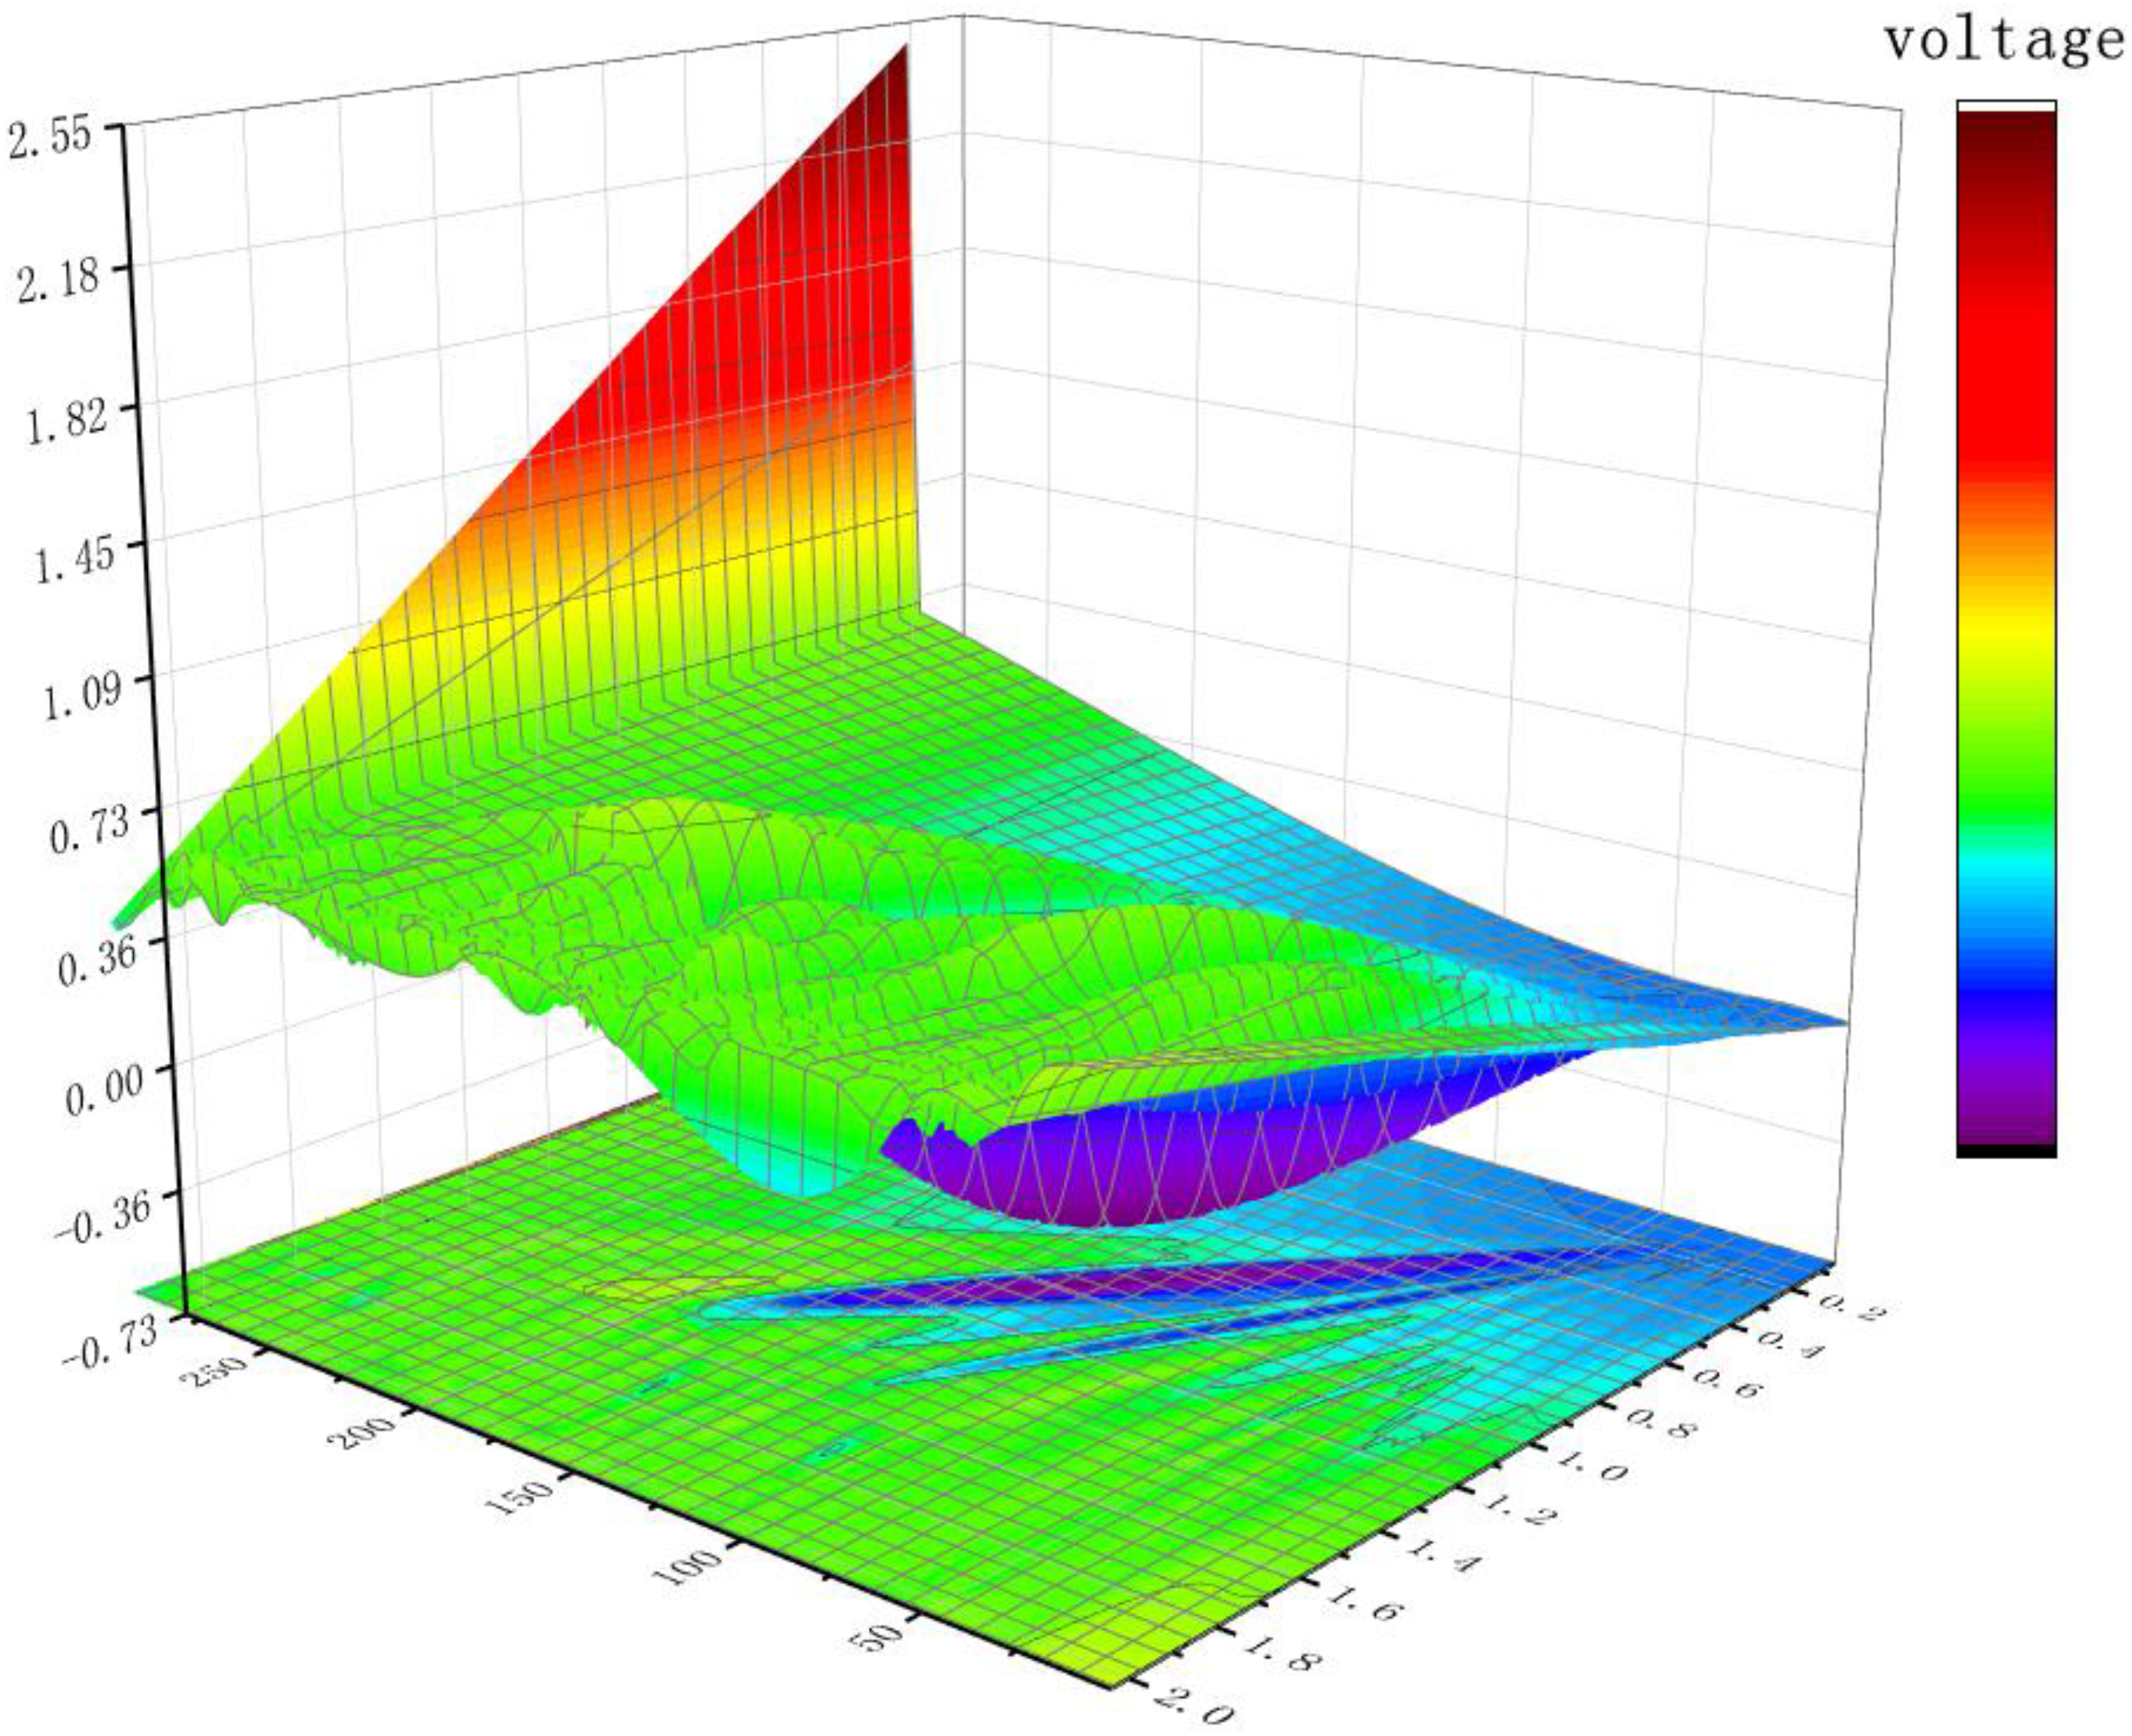
- Turn on the vibration motor, set the vibration frequency as 5 Hz, the charge amplifier collects vibration data at 30 s, and the sampling frequency as 10 Hz. A total of 300 groups of test data are collected, including voltage value and vibration amplitude value, which are recorded and saved.
- (3)
- Take the adhesive rubber material below the impact plate of the loss detection sensor as the vibration reduction material, and repeat step 2.
- (4)
- Take the EVA sponge material attached to the bottom of the impact plate of the loss detection sensor as the damping material, and repeat Step 2.
- (5)
- The three groups of test data are processed and saved, and used for vibration reduction effect analysis.
4. Evaluation and Calculation Methods
5. Results and Analysis
5.1. No Vibration Damping Material Test Analysis
5.2. Experimental Analysis Using Vibration-Damping Materials
- (1)
- On the premise of the vibration test bench as shown in Figure 7, the impact plate of the loss detection sensor is fixed on the test bench without any vibration-damping material. The charge amplifier is connected to the piezoelectric ceramic lead and can work normally.
- (2)
- Start the vibrating motor, set the vibration frequency as 4 Hz, 5 Hz, and 6 Hz respectively, and collect 100 groups of data with a sampling frequency of 10 Hz using the charge amplifier. A total of 300 groups of test data are collected, including voltage value and vibration amplitude value, which are recorded and saved.
- (3)
- Take the adhesive rubber material below the impact plate of the loss detection sensor as the vibration reduction material, and repeat step 2.
- (4)
- Take the EVA sponge material attached to the bottom of the impact plate of the loss detection sensor as the damping material, and repeat Step 2.
- (5)
- Classify the data according to frequency and do mean processing. The mean value of the obtained data is taken as the effective data under the current frequency. The processed data is shown in Table 5.
6. Conclusions
Author Contributions
Funding
Institutional Review Board Statement
Informed Consent Statement
Data Availability Statement
Conflicts of Interest
References
- Wang, Y.P.; Shen, W.; Zhang, H.; Xu, C. Vibration Reduction Design and Vibration Performance Research of Shipborne Platform Equipment. Mech. Res. Appl. 2021, 34, 24–27. [Google Scholar] [CrossRef]
- Wang, Y.P.; Xu, C.; Tang, J.S.; Gao, C.J. The Effect of Suspending Method on Modal and Transfer Characteristics of Rolling Stock Equipment. Roll. Stock 2018, 56, 1–4+55. [Google Scholar] [CrossRef]
- Ji, F.; Zhang, H.D.; Li, G.N.; Wu, M. Tests for correlation between ship vibration isolator installation parameters and vibration isolation effect. J. Vib. Shock 2018, 37, 118–123. [Google Scholar] [CrossRef]
- Yang, T.J.; Shi, H.; Li, X.H.; Wu, L.; Zhu, M.G.; Wu, G.X.; Liu, Z.G. One active isolation system for marine machine based on smart isolators. J. Vib. Eng. 2017, 30, 167–176. [Google Scholar] [CrossRef]
- Tang, X.H.; Zhao, N.; Guo, Z.; Jin, C.Q.; Yu, M.Q.; Li, J.Q.; Xu, B. Design and Test of Multi Parameter Adjustable Cleaning Loss Distribution Detection Test Bench. J. Agric. Mech. Res. 2022, 44, 148–155. [Google Scholar] [CrossRef]
- Robert, R.L.; Klee, M. Gram Loss Monitorin.g Devace. U.S. Patent 3638659 A, 1 February 1972. [Google Scholar]
- Strelioff, W.P.; Elliott, W.S.; Johnson, D. Grain Loss Momtor. U.S. Patent 3598864 A, 16 September 1977. [Google Scholar]
- Batcheller, B.D.; Gelinske, J.N.; Ferrar, L. Systemand Method for Determining Material Yield or Loss from a Harvesting Machineusing Acoustic Sensors. EP Patent 4002983 A1, 16 October 2016. [Google Scholar]
- Kotyk, W.M.; Kirk, T.G.; Wilson, R.J. Unthreshed Head GRAM Loss Monitor. U.S. Patent 04825146 A, 4 May 1989. [Google Scholar]
- Richard, R.K. Absolute Grain Ioss Monitor. U.S. Patent 4896904 A, 25 May 1982. [Google Scholar]
- Zhang, T.; Zhao, D.A.; Zhou, T. Application of Image Processing on Combine Harvester Attachment Loss. J. Agric. Mech. Res. 2009, 31, 70–72. [Google Scholar] [CrossRef]
- Wellington, C.K.; Bruns, A.J.; Sierra, V.S.; Wilson, J.N. Grain Quality Momtormg. U.S. Patent 7168451 A, 28 September 2017. [Google Scholar]
- Bischoff, L.; Phelan, J.J. Pamculate Matter Impact Sensor. EP Patent 2977735B1, 14 February 2016. [Google Scholar]
- Zhao, W.B. Research on Planter Pressure Measurement System Based on PVDF Piezoelectric Film. Master’s Thesis, Harbin Engineering University, Harbin, China, 2016. [Google Scholar] [CrossRef]
- Shivashankar, P.; Gopalakrishnan, S. Review on the use of piezoelectric materials for active vibration, noise, and flow control. Smart Mater. Struct. 2020, 29, 053001. [Google Scholar] [CrossRef]
- Rezaiee-Pajand, M.; Mokhtari, M.; Masoodi, A.R. Stability and free vibration analysis of tapered sandwich columns with functionally graded core and flexible connections. CEAS Aeronaut. J. 2018, 9, 629–648. [Google Scholar] [CrossRef]
- Giaralis, A.; Petrini, F. Wind-Induced Vibration Mitigation in Tall Buildings Using the Tuned Mass-Damper-Inerter. J. Struct. Eng. 2017, 143, 04017127. [Google Scholar] [CrossRef]
- Zhao, Z.; Li, Y.; Chen, J.; Xu, J. Grain separation loss monitoring system in combine harvester. Comput. Electron. Agric. 2011, 76, 183–188. [Google Scholar] [CrossRef]


| No. | Item | Parameter |
|---|---|---|
| 1 | Piezoelectric strain coefficient (P/N) | 300 |
| 2 | Dielectric loss tg δ | ≤0.5% |
| 3 | Resonance frequency (KHz) | 80 ± 5% |
| 4 | Resonance impedance (Ω) | ≤5 |
| 5 | Diameter and thickness (mm) | 20 ± 0.1; 1 ± 0.05 |
| Time (ms) | Vibration Amplitude (mm) | Voltage (V) | Frequency (HZ) |
|---|---|---|---|
| 150 | 1.56 | 2.62 | 5 |
| 151 | 1.92 | 2.62 | 5 |
| 152 | 1.92 | 2.83 | 5 |
| 153 | 1.92 | 2.89 | 5 |
| 154 | 1.90 | 2.69 | 5 |
| 155 | 1.92 | 2.46 | 5 |
| 156 | 1.92 | 2.36 | 5 |
| 157 | 1.92 | 2.98 | 5 |
| 158 | 1.90 | 2.62 | 5 |
| 159 | 1.86 | 2.69 | 5 |
| 160 | 1.93 | 2.78 | 5 |
| 161 | 1.56 | 2.76 | 5 |
| 162 | 1.92 | 2.96 | 5 |
| 163 | 1.92 | 2.99 | 5 |
| 164 | 1.92 | 3.03 | 5 |
| 165 | 1.90 | 3.00 | 5 |
| 166 | 1.86 | 2.46 | 5 |
| 167 | 1.93 | 2.44 | 5 |
| 168 | 1.92 | 2.29 | 5 |
| 169 | 1.92 | 2.59 | 5 |
| 170 | 1.92 | 2.96 | 5 |
| 171 | 1.90 | 2.89 | 5 |
| 172 | 1.86 | 2.96 | 5 |
| 173 | 1.93 | 2.98 | 5 |
| 174 | 1.56 | 2.62 | 5 |
| 175 | 1.56 | 2.69 | 5 |
| 176 | 1.56 | 2.99 | 5 |
| 177 | 1.92 | 2.75 | 5 |
| 178 | 1.92 | 3.01 | 5 |
| 179 | 1.92 | 2.83 | 5 |
| Time (ms) | Vibration Amplitude (mm) | Voltage (V) | Frequency (HZ) |
|---|---|---|---|
| 150 | 1.29 | 2.29 | 5 |
| 151 | 1.49 | 2.36 | 5 |
| 152 | 1.55 | 2.56 | 5 |
| 153 | 1.56 | 2.59 | 5 |
| 154 | 1.34 | 2.31 | 5 |
| 155 | 1.26 | 2.29 | 5 |
| 156 | 1.36 | 2.46 | 5 |
| 157 | 1.27 | 2.39 | 5 |
| 158 | 1.29 | 2.29 | 5 |
| 159 | 1.49 | 2.36 | 5 |
| 160 | 1.55 | 2.56 | 5 |
| 161 | 1.56 | 2.58 | 5 |
| 162 | 1.53 | 2.54 | 5 |
| 163 | 1.52 | 2.56 | 5 |
| 164 | 1.46 | 2.49 | 5 |
| 165 | 1.55 | 2.59 | 5 |
| 166 | 1.56 | 2.58 | 5 |
| 167 | 1.32 | 2.22 | 5 |
| 168 | 1.36 | 2.21 | 5 |
| 169 | 1.35 | 2.21 | 5 |
| 170 | 1.46 | 2.49 | 5 |
| 171 | 1.55 | 2.59 | 5 |
| 172 | 1.56 | 2.58 | 5 |
| 173 | 1.55 | 2.60 | 5 |
| 174 | 1.53 | 2.54 | 5 |
| 175 | 1.55 | 2.56 | 5 |
| 176 | 1.56 | 2.59 | 5 |
| 177 | 1.34 | 2.31 | 5 |
| 178 | 1.26 | 2.29 | 5 |
| 179 | 1.36 | 2.46 | 5 |
| Time (ms) | Vibration Amplitude (mm) | Voltage (V) | Frequency (HZ) |
|---|---|---|---|
| 150 | 0.54 | 1.06 | 5 |
| 151 | 0.53 | 1.08 | 5 |
| 152 | 0.50 | 1.00 | 5 |
| 153 | 0.49 | 0.98 | 5 |
| 154 | 0.48 | 0.89 | 5 |
| 155 | 0.68 | 1.17 | 5 |
| 156 | 0.63 | 1.12 | 5 |
| 157 | 0.55 | 1.09 | 5 |
| 158 | 0.54 | 1.06 | 5 |
| 159 | 0.53 | 1.08 | 5 |
| 160 | 0.50 | 1.00 | 5 |
| 161 | 0.67 | 1.18 | 5 |
| 162 | 0.72 | 1.22 | 5 |
| 163 | 0.59 | 1.09 | 5 |
| 164 | 0.68 | 1.16 | 5 |
| 165 | 0.67 | 1.13 | 5 |
| 166 | 0.70 | 1.17 | 5 |
| 167 | 0.70 | 1.16 | 5 |
| 168 | 0.73 | 1.20 | 5 |
| 169 | 0.69 | 1.18 | 5 |
| 170 | 0.66 | 1.16 | 5 |
| 171 | 0.68 | 1.17 | 5 |
| 172 | 0.63 | 1.12 | 5 |
| 173 | 0.55 | 1.09 | 5 |
| 174 | 0.54 | 1.06 | 5 |
| 175 | 0.53 | 1.08 | 5 |
| 176 | 0.50 | 1.00 | 5 |
| 177 | 0.49 | 0.98 | 5 |
| 178 | 0.48 | 0.89 | 5 |
| 179 | 0.47 | 0.99 | 5 |
| Damping Material | Vibration Source Frequency (HZ) | Vibration Frequency of the Impact Plate (HZ) | Impact Plate Amplitude (mm) | Charge Voltage Value (V) |
|---|---|---|---|---|
| No material | 4 | 3.90 | 1.86 | 2.91 |
| 5 | 5.06 | 2.01 | 3.01 | |
| 6 | 5.96 | 1.86 | 2.83 | |
| rubber | 4 | 3.70 | 1.34 | 2.31 |
| 5 | 4.84 | 1.56 | 2.59 | |
| 6 | 5.78 | 1.32 | 2.22 | |
| EVA sponge | 4 | 3.54 | 0.47 | 0.95 |
| 5 | 4.49 | 0.68 | 1.18 | |
| 6 | 5.58 | 0.54 | 1.06 |
Disclaimer/Publisher’s Note: The statements, opinions and data contained in all publications are solely those of the individual author(s) and contributor(s) and not of MDPI and/or the editor(s). MDPI and/or the editor(s) disclaim responsibility for any injury to people or property resulting from any ideas, methods, instructions or products referred to in the content. |
© 2023 by the authors. Licensee MDPI, Basel, Switzerland. This article is an open access article distributed under the terms and conditions of the Creative Commons Attribution (CC BY) license (https://creativecommons.org/licenses/by/4.0/).
Share and Cite
Wang, J.; Wang, F.; Zhang, W.; Liu, Y.; Zhao, B.; Fang, X. Experimental Verification and Analysis of Vibration Damping Structure of Piezoelectric Ceramic Grain Loss Sensor. Appl. Sci. 2023, 13, 5477. https://doi.org/10.3390/app13095477
Wang J, Wang F, Zhang W, Liu Y, Zhao B, Fang X. Experimental Verification and Analysis of Vibration Damping Structure of Piezoelectric Ceramic Grain Loss Sensor. Applied Sciences. 2023; 13(9):5477. https://doi.org/10.3390/app13095477
Chicago/Turabian StyleWang, Jizhong, Fengzhu Wang, Weipeng Zhang, Yangchun Liu, Bo Zhao, and Xianfa Fang. 2023. "Experimental Verification and Analysis of Vibration Damping Structure of Piezoelectric Ceramic Grain Loss Sensor" Applied Sciences 13, no. 9: 5477. https://doi.org/10.3390/app13095477
APA StyleWang, J., Wang, F., Zhang, W., Liu, Y., Zhao, B., & Fang, X. (2023). Experimental Verification and Analysis of Vibration Damping Structure of Piezoelectric Ceramic Grain Loss Sensor. Applied Sciences, 13(9), 5477. https://doi.org/10.3390/app13095477