Featured Application
Sustainable Development and Conservation of Marine Environment and Fisheries Resources in the Central and Western South China Sea.
Abstract
The west-central South China Sea upwelling event is a critical process that regulates the climate and marine ecosystem in the region. In this study, we used sea surface temperature (SST) satellite data from 2000 to 2018 to analyze the spatial and temporal characteristics of upwelling in the west-central South China Sea and combined the wind field data to investigate the effects of wind direction and speed on upwelling. We divided the upwelling sea area into three regions based on the different shoreline angles along the eastern coast of the South China Peninsula: OU_1, OU_2, and OU_3. Our results showed that the upwelling events occurred mainly from May to September in the OU_1 and OU_2 waters. The empirical orthogonal function (EOF) decomposition of the monthly mean SST moment level field indicated a cyclical interannual variation of upwelling in the west-central South China Sea. The correlation analysis showed that wind direction changes have a significant impact on the upwelling intensity center, with the upwelling intensity center moving towards high latitudes and away from the coast when the wind direction changes from north to east. When the wind direction changes from east to south, the upwelling intensity center moves towards low latitudes and near the coast. The average lag time of upwelling events to the wind field in the central and western South China Sea was 38.9 h, with OU_2 showing a longer response time than the other seas. Our study provides important insights into the mechanisms governing upwelling in the west-central South China Sea, which can effectively promote the rational use of ecological resources and provide a scientific basis for marine ecological protection in the region.
1. Introduction
Upwelling as a mesoscale physical phenomenon in the ocean significantly impacts the distribution of marine fishery resources [1,2]. The fishing grounds in the west-central South China Sea are essential for the development of China’s South China Sea fisheries. They represent a crucial upwelling region in the South China Sea, which is a mesoscale physical process that affects oceanic circulation, water temperature, and wind stress. Upwelling plays a significant role in regulating the growth and distribution of marine life, and understanding the mechanisms of upwelling in the fishing grounds is vital for the sustainable management of marine resources and the protection of marine ecosystems. Therefore, investigating the relationship between upwelling and the fishing grounds in the west-central South China Sea is a crucial research topic in oceanography and marine ecology [3,4].
The discovery of upwelling events in the South China Sea was initially based on limited navigational data, which identified two distinct upwelling regions in the northwestern part of Luzon Island and the central-western part of the South China Sea [5,6]. However, traditional ship-measured data are prone to local area influences, resulting in data contingency and resource consumption [7]. With the development of remote sensing technology, large-scale marine remote sensing data are now used to study upwelling events in the central and western South China Sea [8,9]. While manual visual interpretation of remote sensing images is used to determine the occurrence of upwelling events, it is subjective in nature. Therefore, calculating the difference in SST between the target and peripheral waters to detect upwelling solves the uncertainty of manual identification but does not consider the difference in solar radiation by latitude. Kuo analyzed the upwelling region in the west-central South China Sea using SST data from the summer of 1996–1997 and found that upwelling in this area mainly occurred in June-September, reaching its peak in August. An anomalous cold water mass was observed along the coast of the Central South Peninsula in the summer, evolving into a cold water tongue that extended eastward along 11° N by mid-August 1997. This confirms the existence of an upwelling event in the west-central Sea in a short time series [10]. In contrast, Yang used the Comprehensive Ocean Atmospheric Data Set (COADS) data from 1950 to 1995, combined with remotely sensed sea surface temperature data, to calculate the surface heat storage in this upwelling sea area and confirmed the existence of upwelling events in a long-term series [11].
An empirical orthogonal function (EOF) analysis was applied to study the spatial and temporal distribution of upwelling events in the South China Sea. The spatial and temporal characteristics of upwelling events off the coast of Vietnam in 1997–1998 were derived, but the data span was short and did not reflect the superiority of the EOF method in the analysis of the periodic interannual variability. Wind fields can influence the variations of the sea surface temperature and upwelling events. Digna discovered a negative correlation between wind speed and sea surface temperature in the upwelling region while studying the upwelling system in the southern Caribbean [12]. García-Reyes conducted a study on the variation of coastal upwelling in central California from 1982 to 2008 using ocean buoy data. The research found that there is a positive correlation between wind speed and the strength of upwelling events. Additionally, wind speed has a certain influence on the latitudinal distribution of upwelling events, demonstrating that upwelling events are closely related to atmospheric circulation [13].
This paper proposes the use of SST data and IFREMER CERSAT global mixed mean wind field data, based on previous studies, to explore the spatial and temporal distribution characteristics of upwelling in the central and western South China Sea. To achieve this, we apply the upwelling auto-check method and EOF decomposition. Moreover, we investigate the influence of the wind field on upwelling in the region by calculating the upwelling intensity index based on the wind field characteristics combined with the correlation analysis.
2. Data and Methods
2.1. Study Area Data
The focus of this study is on the central and western waters of the South China Sea, which have a notable tropical maritime climate characterized by high temperatures throughout the year, with an annual average temperature around 26 °C. The region experiences a southwest monsoon period from May to September, followed by a northeast monsoon period from October to April, as reported by Kajikawa and Wang [14]. The upwelling sea in this region is a significant source of fishery resources, with an annual average catch of 340,000 tons. The coastline angle is a crucial factor that affects the wind-induced upwelling intensity, as highlighted by Healy [15]. Based on the varying shoreline angles, the upwelling region is divided into three sub-regions: OU_1 (10–12° N), OU_2 (12–14° N), and OU_3 (14–15.5° N), as depicted in Figure 1.
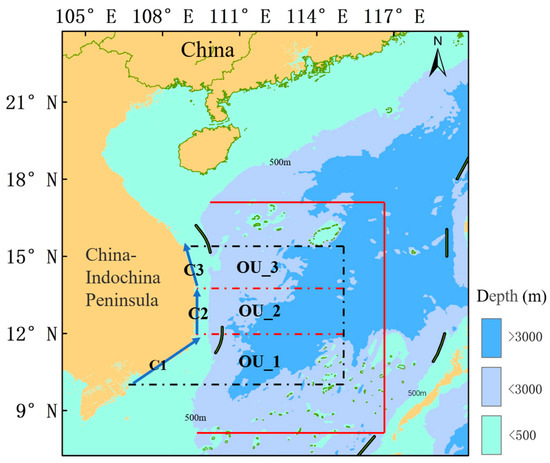
Figure 1.
Division of upwelling areas.
The sea surface temperature data set utilized in this study was obtained from the high-resolution SST data set (https://psl.noaa.gov/data/ (accessed on 1 January 2022)) provided by the National Oceanic and Atmospheric Administration (NOAA). The data set has a spatial resolution of 0.25° × 0.25°, a temporal resolution of 1 day, and was selected based on its reliability and accuracy [16]. The wind field data used in this study were sourced from the IFREMER CERSAT Global Hybrid Mean wind field data set (https://resources.marine.copernicus.eu/ (accessed on 1 January 2022)), provided by Copernicus-Marine Environmental Monitoring Service (CMEMS). The data set has a spatial resolution of 0.25° × 0.25° and a temporal resolution of 6 h. The data used in this study used in this study has undergone a thorough data quality assessment, which has ensured that it is suitable for our analysis [16,17,18,19].
2.2. Methods
2.2.1. Identification Method of Upwelling
To determine the specific time and frequency of an upwelling occurrence in the central and western South China Sea, we utilized an automatic upwelling identification method based on the monthly mean sea surface temperature map of the study area. This approach allowed us to accurately determine the life cycle of upwelling events in the central and western South China Sea. Specifically, we extracted the latitudinal mean sea surface temperature, , of the upwelling region and the mean sea surface temperature, , of the adjacent open sea area. The difference between the mean sea surface temperature of the two sea areas was then calculated.
served as the reference temperature threshold, and the detection algorithm returned a True value if the temperature difference exceeds , indicating the presence of upwelling at that latitude. The coordinates of the upwelling center were determined as the latitude and longitude of the lowest temperature value among all latitudes where the algorithm returned True. This method enabled an accurate determination of the specific time and frequency of upwelling events in the central and western South China Sea.
2.2.2. Empirical Orthogonal Function Decomposition (EOF)
The EOF method has been widely used in the spatial and temporal analysis of marine variables [20,21]. In this study, we employed the EOF method to investigate the spatial and temporal characteristics of multi-year monthly mean sea surface temperature anomalies in the central and western South China Sea. Specifically, we first calculated the multi-year monthly mean moment level values of SST in the study area, and then applied the EOF method to obtain the spatial modes and temporal coefficients of the monthly mean sea surface temperature anomalies from 2000 to 2018. Finally, we calculated the variance contribution of each mode to better understand the underlying variability in the data.
The variance contribution of the kth mode is represented by , where is the mode number. The spatial point or grid point is denoted by , while denotes the number of eigenvectors. The eigenvalue of the ith mode is represented by .
2.2.3. Wind-Based Upwelling Index
This paper aims to explore the impact of the wind field on upwelling in the central and western South China Sea by evaluating the upwelling index using wind field conditions. The Ekman transport refers to the horizontal fluid motion caused by the combined action of the surface winds and the Coriolis force. According to the Ekman transport principle, the intensity of the upwelling, WUI, is defined as the Ekman transport per unit length perpendicular to the coastline [22].
The angle, , represents the angle between the landward side of the coastline and the due east direction, with the value of varying between 29° and 122° depending on the angle of the eastern coastline of the Central South Peninsula. and represent the latitudinal and longitudinal components of the Ekman transport, respectively. They characterize the directional components of the Ekman transport flow on the Earth’s surface, which is closely related to the formation of wind-driven upwelling. A positive (negative) value of WUI indicates favorable (unfavorable) wind field conditions for upwelling. The seawater density in the study area is 1.025 × 10³ kg/m3. The wind stress component in the meridional direction is represented by (), and denotes the Coe-style parameter [23].
2.2.4. Correlation Analysis
In this study, we utilize the method of time-lag intercorrelation to examine the lagged response of the upwelling phenomenon to the local wind field. The cross-correlation function (CCF) serves to represent the correlation degree between two time series, specifically the signals and , at two distinct moments, and . Through this correlation function, we can identify the degree of lag when the sequence may be correlated with the past lag of the sequence . The mutual correlation functions of the upward flow intensity, , and the wind field characteristics, , at moments and , are defined as:
The time series of upwelling intensity and wind field characteristics are denoted as and , respectively, and n represents the time lag distance [24].
3. Results
3.1. Spatial and Temporal Characteristics of Upwelling in the West-Central South China Sea
To study the overall variation of the upwelling events in the central and western South China Sea on a large time scale, monthly averaged sea surface temperature data and wind field data were selected to analyze the upwelling events in the central and western South China Sea. Figure 2 illustrates the distribution of SST and wind field for each month. In May, the monsoon alternation period in the west-central South China Sea, the southwest wind dominated the northern sea, but the wind speed remained low, with a monthly average wind speed ranging from 4.6 to 4.9 m/s. At this time, no apparent temperature anomaly area was observed. In June, the southwest monsoon began to prevail, and the frequency of westerly and southerly winds exceeded 60%, with a monthly average wind speed of 6.8 m/s. The temperature anomaly sea area appeared in the range of 10–12° N, 109–110° E, and spread to the eastern sea area. In July and August, the wind field intensity further increased, with the monthly average wind speed reaching 7.2 m/s. The sea surface temperature anomaly area expanded and further spread to the eastern sea area. In September, the north wind began to appear in the northern sea, while the southwest wind still dominated the southern sea. However, the overall wind speed decreased, with a monthly average wind speed of 6.1 m/s. The low-temperature center strength weakened and the SST anomaly was reduced. In October, the study area’s northeast wind in the northern sea dominated, and the wind speed gradually increased. The southern sea wind speed remained minor. The SST anomalies in the central and western parts of the South China Sea occurred from June to September. These anomalies were characterized by significantly low temperatures, approximately one degree Celsius lower than the surface water temperature at the same latitude. The upwelling phenomenon brang deep low-temperature water to the surface layer, causing low-temperature areas on the sea surface. However, the existence of upwelling events could not be determined, and the identification of upwelling events in May and October are analyzed subsequently.
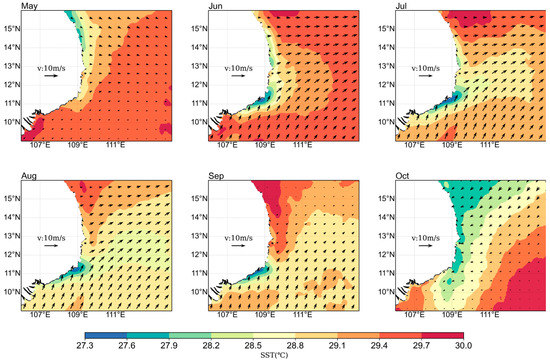
Figure 2.
Multi-year monthly mean SST (°C) distribution and wind speed and direction from January to December 2000–2018.
Figure 3 demonstrates that the monthly mean upwelling frequency displays a general trend from low to high-low on the time scale. On the spatial scale, areas with high frequencies of monthly mean upwelling were mainly located in the middle and low latitude waters (OU_1, OU_2) and were less frequent in the high latitude waters (OU_3). The frequency of upwelling events in the west-central part of the South China Sea exhibited a low frequency from January to April and increased from May onwards. In May, the average frequency of the upwelling events was 35.6%, mainly in the OU_3 area, which may be attributed to the dominance of the southwest monsoon in the OU_3 area during the monsoon transition period in May. The average frequency of upwelling events gradually increased in June (57.6%), which may be associated with the prevalence of southwest monsoons during this period. The average frequency of upwelling in July and August was the highest (85%), indicating that the mature period of upwelling events occurred mainly from July to August. In September, the average upwelling frequency was 59.8%, with a decreasing trend compared to July and August, and was mainly concentrated in the OU_1 area. The average upwelling frequency in October was 29.3%, mainly concentrated in OU_3, which may be related to the dominance of northeasterly winds in OU_3 in October and the gradual increase in wind speed, which led to the diffusion of high-latitude low-temperature sea surface water to lower latitudes, resulting in an increase in the frequency of cold water masses in OU_3. The identification results indicated that the primary life cycle of upwelling events in the central and western South China Sea occurred in May each year, peaked in July to August, and ended around the end of September to the beginning of October. Therefore, this paper identified the months of upwelling in the central and western South China Sea as May–September.
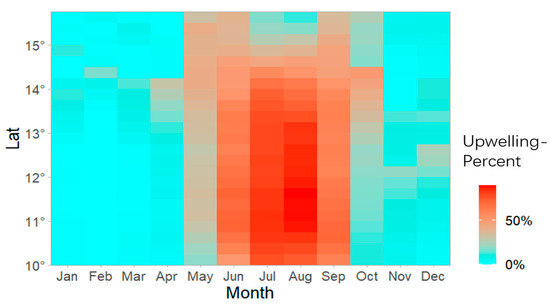
Figure 3.
Heat map of upwelling by month and latitude (2000–2018).
The upwelling phenomenon in the central and western South China Sea is directly influenced by the sea surface temperature (SST), which displays prominent spatial and temporal distribution characteristics during upwelling events. To further investigate the spatiotemporal characteristics of the upwelling events, an EOF decomposition of the SST field in the central and western South China Sea was conducted to obtain the spatial and temporal modes of the SST variance variation. The eigenvalues and their errors were calculated for each mode, and the eigenvalues and errors of the first three modes of the EOF analysis were 2480.88 ± 232.36, 297.87 ± 27.89, and 182.19 ± 17.06, respectively. This calculation result indicated that there was no information overlap among the modes. The variance contribution rates of the first three modes were 69.46%, 8.34%, and 5.1%, respectively. The cumulative explained variance of the first three modes was 82.9%. The variance contribution rates of the subsequent modes were low and could not reflect the sample characteristics; hence, they were not analyzed in this study. In order to further investigate the spatial and temporal characteristics of upwelling events in the central and western South China Sea, an EOF decomposition of the multi-year monthly mean SST field was performed, yielding spatial and temporal modes of SST variance variation. Figure 4 displays the spatial and temporal distribution of each mode. The first mode, which explains 69.46% of the total variance, was decisive. As shown in Figure 4a, the temperature trend of the first mode was positive in the coastal waters of the Central South Peninsula, with zero contours located near the 109.5° E diameter line and shifted toward the eastern waters with the increasing latitude. The negative area was located in the east-central part of the study area, with a negative central area in the sea near 10.5–14.3° N, 111.2–113.8° E, indicating opposite trends of the sea surface temperature changes in the two regions. Figure 4b displays the time coefficient of the first mode, and a positive time coefficient demonstrates an increase in the sea surface temperature in the coastal waters of the Central South Peninsula and a decrease in the sea surface temperature in the central-eastern part. A negative time coefficient indicates a decrease in the sea surface temperature in the coastal waters of the South China Sea and an increase in the sea surface temperature in the east central Sea. In the summer, the time coefficients were predominantly positive, indicating the presence of upwelling events in the range of 10.5–14.3° N, 111.2–113.8° E, resulting in lower sea surface temperatures in the upwelling waters in the South China Sea during the summer, when the overall sea surface temperature is increasing. The time coefficients of the first mode maintained an interannual variability cycle of 2–2.5 years, with oscillations generally showing an increased trend, which may be related to global warming factors. The second mode, explaining 8.34% of the total variance, exhibited a spatial distribution similar to that of the first mode. The temporal coefficients were opposite to the first mode, reflecting the latitudinal distribution of temperature field variation characteristics in the central and western South China Sea, subject to latitudinal and seasonal variations. The sea surface temperature tended to increase with decreasing latitude. The third mode explained 5.1% of the total variance, and the negative spatial coefficients were primarily found in the coastal waters of the Central South Peninsula. The SST fluctuated with the year and no significant pattern was observed.
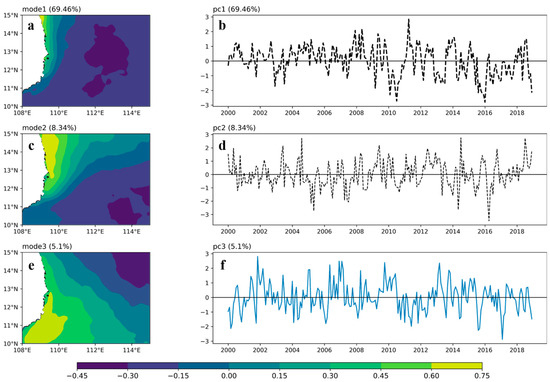
Figure 4.
Spatial distribution and temporal coefficients of multi-year monthly mean sea surface temperature EOF decomposition (2000–2018). (a) Spatial coefficient of the mode 1. (b) Principal components of the mode 1. (c) Spatial coefficient of the mode 2. (d) Principal components of the mode 2. (e) Spatial coefficient of the mode 3. (f) Principal components of the mode 3.
3.2. Effect of Wind Fields on Upwelling
Figure 5 presents the monthly mean sea surface temperature and wind direction of the wind field in the upwelling waters of the west-central South China Sea from 2000 to 2018. The figure reveals that the monsoon season shifted from the northeast to the southwest monsoon in May, causing the wind direction to change accordingly. As a result, the average temperature of the sea area in the west-central South China Sea decreased to varying degrees.
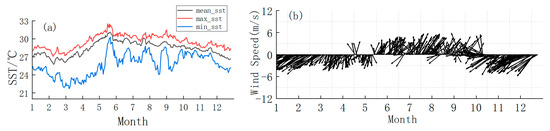
Figure 5.
Monthly mean sea surface temperature and wind field wind direction in the mid-western South China Sea upwelling waters from 2000 to 2018. (a) Monthly average sea surface temperature from 2000 to 2018. (b) Monthly average wind speed and direction from 2000 to 2018.
During the formation of upwelling, there was a general decreasing trend in the SST. The correlation coefficient between the sea surface temperature and wind direction was 0.352 during the upwelling months (May–September) in the west-central South China Sea. As the wind direction angle increased (decreased), the sea surface temperature increased (decreased) to different degrees. Moreover, the correlation coefficients between the sea surface temperature and wind speed, and wind stress were −0.612 and −0.624, respectively. This indicates that the sea surface temperature increased (decreased) as the wind speed and wind stress increased (decreased) in the central and western parts of the South China Sea. Therefore, the SST time series plot showed alternating local peaks and troughs with the dynamic changes in the wind field of the study area.
Figure 6 presents the monthly average upwelling strength index and wind direction characteristics of the wind field. The average upwelling index of the OU_1 sea area was 1477.43, with an average wind speed of 7.12 m/s. The average upwelling index of the OU_2 sea area was 1965.43, with an average wind speed of 7.78 m/s. Meanwhile, the average upwelling index of the OU_3 sea area was 809.91, with an average wind speed of 6.37 m/s. Among them, the upwelling index of OU_2 was the highest, and the average wind speed was greater than the other two sub-regions (Figure 6b). The upwelling index of OU_1 was lower than that of OU_2 but much higher than that of OU_3, indicating that upwelling mainly occurred in OU_1 and OU_2 in the central and western South China Sea. The upwelling index was only one-half of the average in OU_1 and OU_2, and the monsoon turned southwest later in OU_3 than in OU_1 and OU_2 (Figure 6b). This may be the primary reason for the low upwelling index in OU_3. The findings presented here provide critical insights into the spatial and temporal dynamics of upwelling in the South China Sea, which is essential for understanding the biogeochemical processes and fisheries production in the region.
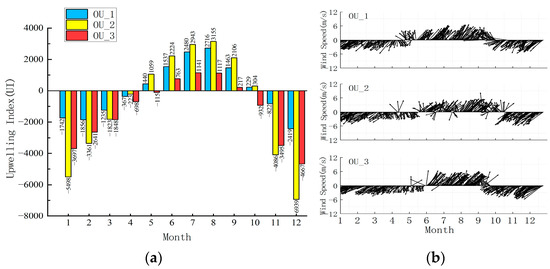
Figure 6.
Monthly average upwelling index and wind direction map of upwelling in the central and western parts of the South China Sea from 2000 to 2018. (a) Monthly Mean Upwelling Index from 2000 to 2018 (Subregion). (b) Monthly average wind speed and direction from 2000 to 2018 (Subregion).
The upwelling index, which is computed monthly, displays a trend line based on three sub-area ranges (OU_1, OU_2, OU_3), as depicted in Figure 7. It was observed that the upwelling intensity in mid- and low-latitude seas was greater than that in high-latitude seas. The trend line reveals that the upwelling index of the OU_1 region exhibited a pattern of being low in the middle and high at both ends throughout the entire study period. Between 2003 and 2015, the index displayed a gradual decline, followed by a subsequent recovery in the following years. The upwelling index in the OU_2 waters was generally stable, with an annual average upwelling index higher than that of the OU_1 and OU_3 seas, except for 2000, 2001, and 2018. Conversely, the upwelling index of the OU_3 waters was consistently low, revealing a stable low index state. Between 2000 and 2002, the upwelling index in the central and western parts of the South China Sea was high, indicating an intense upwelling event. However, from 2003 to 2015, the upwelling index remained generally low. After 2016–2018, the upwelling index began to rise. During the strong upwelling years, the upwelling intensity centers were primarily concentrated in low-latitude seas (OU_1), whereas during the ordinary upwelling years, the upwelling intensity centers were mainly distributed in the mid-latitude seas (OU_2).
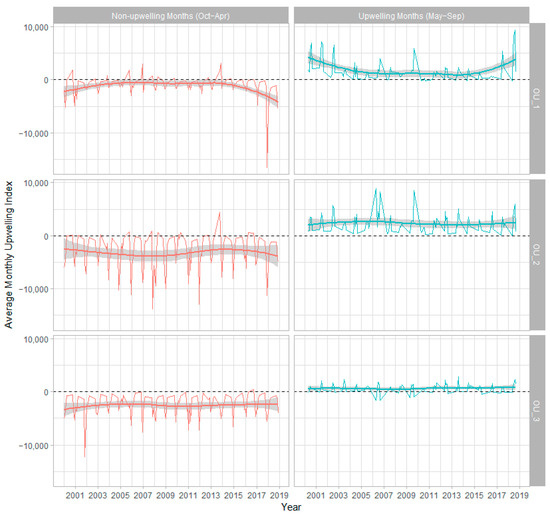
Figure 7.
Monthly average upwelling index and trend direction for 2000–2018 (by latitude range).
The upwelling center in the central and western parts of the South China Sea was primarily concentrated in the OU_1 and OU_2 seas. Its position change was mainly influenced by the southwest monsoon. During the southwest monsoon, the central position of the upwelling was related to the wind speed, wind direction, and wind stress. The correlation analysis between the wind speed and the upwelling center latitude and longitude is presented in Table 1.

Table 1.
Correlation analysis of wind field characteristics with annual mean SST and upwelling center coordinates.
The wind speed was negatively correlated with the latitude of the upwelling center and positively correlated with the longitude of the upwelling center. The average wind speed of the wind farm in the study area increased, the annual average upwelling intensity center moved to the offshore low latitude, and, when the wind speed decreased, the annual average upwelling center moved to the nearshore high latitude. The correlation coefficients between the radial wind speed and the latitude of the upwelling center, the correlation coefficient between the latitudinal wind speed and the upwelling center latitude, and the correlation coefficient with the longitude of the upwelling center were −0.309, 0.181, and 0.248, respectively, all of which showed weak positive correlations.
The influence of wind direction on the coordinates of the upwelling intensity center was estimated to be carried out within the range of 0–180°. In the range of 0–90°, as the wind direction of the wind field increased, the radial wind speed decreased, the latitudinal wind speed increased, and the upwelling intensity center moved offshore towards high latitudes. In the range of 90–180°, as the wind direction of the wind field increased, the radial wind speed increased, the latitudinal wind speed decreased, and the upwelling intensity center moved towards the low latitude nearshore direction.
The intensity and movement of upwelling in the central and western parts of the South China Sea were affected by various local wind field elements [25]. The surge rate and duration of upwelling were determined by the wind field elements, indicating a significant lag in the impact of the southwest monsoon on the movement of upwelling in the central and western South China Sea [3,26,27]. The wind stress curl, which promotes wind-induced upwelling, was a crucial factor in this process. To explore the lag effect of upwelling on the local wind field changes, the interrelationship between the upwelling intensity and the corresponding wind stress curl of the same period was studied. The response time of the upwelling currents to the change of local wind field was found to vary with latitude in the central and western South China Sea. The annual average time for the upwelling to respond to the local wind field changed in the central and western South China Sea is 38.9 h, as shown in Figure 8. The response time was longer in the OU_1 sea area, with an average of 39.2 h, while in the OU_2 and OU_3 waters the average response times were 63.4 h and 14.2 h, respectively. The OU_1 sea area had a higher sensitivity to the local wind field changes and the response time was lower than in the OU_2 sea area. The OU_3 sea area had the lowest intensity of upwelling events and its structural stability was weak, making it more susceptible to external environmental factors. Its sensitivity to local wind field changes was high, resulting in a shorter response time. The response time of upwelling currents in the central and western South China Sea to local wind field changes varied with latitude. The response time was longest in the central sea area (OU_2), and then it decreased with the change of latitude. The response time shortened slowly as the sea’s latitude decreased, with a decrease of 12.1 h for a latitude decrease of 1°. In contrast, the response time shortened rapidly as the sea’s latitude increased by 1°, with a reduction of 24.6 h.
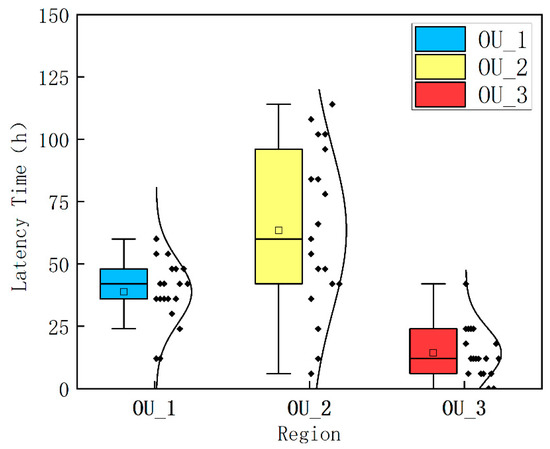
Figure 8.
Response time of the west-central South China Sea upwelling to changes in wind field characteristics after 2000–2018.
In conclusion, the intensity and movement of upwelling in the central and western South China Sea were primarily influenced by the local wind field elements, including wind speed, direction, and stress curl. The lag effect of upwelling on the local wind field changes varied with the region, with the OU_1 sea area showing the highest sensitivity to local wind field changes and the OU_3 sea area being the most susceptible to external environmental factors. The response time of upwelling currents to local wind field changes varied with latitude, with the response time shortening rapidly as the latitude increased.
4. Conclusions
Based on sea surface temperature and wind field data from 2000 to 2018, this paper divides upwelling waters in the central and western parts of the South China Sea into three regions: OU_1, OU_2, and OU_3, based on the different shoreline angles of the eastern coast of the Indochina Peninsula. The spatiotemporal distribution characteristics of upwelling in the central and western parts of the South China Sea were explored using the upwelling automatic detection method and EOF decomposition. The influence of the wind fields on upwelling in the central and western parts of the South China Sea was discussed using the upwelling intensity index based on wind field characteristics and correlation analysis. The main conclusions are as follows.
The results of the upwelling detection showed that upwelling in the central and western waters of the South China Sea occurred from May to September, with the highest frequency in May and June (35.6% and 57.6%, respectively). In July and August, the monthly average upwelling frequency reached over 85%, with a high percentage of the upwelling areas concentrated in OU_2 and OU_1 (11–13.5° N). The monthly average upwelling frequency in September decreased to 59.8%, and the upwelling event entered the recession period. The trend line of upwelling intensity showed that the upwelling events were stronger in the OU_1 and OU_2 waters during the same period, with the intensity of upwelling gradually decreasing with increasing latitude. The variance contributions of the first three modes of the EOF decomposition were 69.46%, 8.34%, and 5.1%, respectively, with a cumulative explained variance of 82.9%. The zero contours of the spatial coefficient were located near the 109.5° E diameter line and shifted towards the eastern sea with increasing latitude. Upwelling events occurred in the range of 10.5–14.3° N, 111.2–113.8° E, which maintained an interannual variation cycle of 2–2.5 years, and the oscillation amplitude generally showed an increasing trend, which may be related to global warming factors. The effect of wind fields on the upwelling intensity center was divided into two zones. When the wind direction was in the range of 0° to 90°, the radial wind speed decreased, the latitudinal wind speed increased, and the upwelling intensity center moved towards the high-latitude offshore direction. When the wind direction was in the range of 90° to 180°, the radial wind speed increased, the latitudinal wind speed decreased, and the upwelling intensity center moved towards the low-latitude nearshore direction. The correlation analysis showed that the average response time of the west-central South China Sea upwelling to the local wind field was 38.9 h, and the response times of the OU_1, OU_2, and OU_3 seas to local wind field changes were 39.2 h, 63.4 h, and 14.2 h, respectively. This indicated a long response time in the central sea and a shortened response time in the upper and lower sides of the sea. The response time was shortened by 12.1 h (24.6 h) when the latitude decreased (increased) by 1.
Overall, this study provided valuable insights into the spatiotemporal distribution characteristics of upwelling in the central and western parts of the South China Sea and the influence of wind fields on upwelling intensity. The findings could be useful for understanding the mechanisms driving the variability of upwelling in this region and for the development of more accurate models for predicting upwelling events. At the same time, we should also be aware that it is necessary to combine artificial intelligence to further study the upwelling events for higher spatiotemporal resolution data, providing new research directions for our subsequent studies [28,29].
Author Contributions
Conceptualization, J.S. and H.H.; methodology, J.S.; program, D.F.; validation, B.X., Y.X., and J.Z.; formal analysis, Y.X.; investigation, J.Z.; resources, J.S.; data curation, J.S.; writing—original draft preparation, J.S.; writing—review and editing, H.H.; visualization, D.F.; supervision, B.X.; project administration, H.H.; funding acquisition, H.H. All authors have read and agreed to the published version of the manuscript.
Funding
This research was funded by the Basic Scientific Research Ability Improvement Project for Young and Middle-aged Teachers of Universities in Guangxi (2021KY0255),the Natural Science Foundation of Guangxi Province (CN) (2022GXNSFBA035637), and the ‘Ba Gui Scholars’ program of the provincial government of Guangxi.
Institutional Review Board Statement
Not applicable.
Informed Consent Statement
Informed consent was obtained from all subjects involved in the study.
Data Availability Statement
Not applicable.
Acknowledgments
Thank you to all the authors and peer reviewers for their valuable contributions to this paper. We also express our gratitude to the reviewers and editors for their valuable comments and feedback, which helped the authors improve the paper. Finally, we would like to express our sincere appreciation to the editorial team of Applied Sciences.
Conflicts of Interest
The authors declare no conflict of interest.
References
- Narvekar, J.; Roy Chowdhury, R.; Gaonkar, D.; Kumar, P.K.D.; Prasanna Kumar, S. Observational evidence of stratification control of upwelling and pelagic fishery in the eastern Arabian Sea. Sci. Rep. 2021, 11, 7293. [Google Scholar] [CrossRef] [PubMed]
- Schroeder, I.D.; Santora, J.A.; Mantua, N.; Field, J.C.; Wells, B.K.; Hazen, E.L.; Jacox, M.; Bograd, S.J. Habitat compression indices for monitoring ocean conditions and ecosystem impacts within coastal upwelling systems. Ecol. Indic. 2022, 144, 109520. [Google Scholar] [CrossRef]
- Hu, J.Y.; Wang, X.H. Progress on upwelling studies in the China seas. Rev. Geophys. 2016, 54, 653–673. [Google Scholar] [CrossRef]
- Xu, L.Q.; Ji, C.; Kong, D.M.; Guo, M. Abrupt change in Vietnam coastal upwelling as a response to global warming. J. Quat. Sci. 2021, 36, 488–495. [Google Scholar] [CrossRef]
- Wyrtki, K. Physical Oceanography of the Southeast Asian Waters; University of California, Scripps Institution of Oceanography: La Jolla, CA, USA, 1961; Volume 2. [Google Scholar]
- Kuo, N.-J.; Zheng, Q.; Ho, C.-R. Satellite observation of upwelling along the western coast of the South China Sea. Remote Sens. Environ. 2000, 74, 463–470. [Google Scholar] [CrossRef]
- Hu, C.; Feng, L.; Lee, Z. Uncertainties of SeaWiFS and MODIS remote sensing reflectance: Implications from clear water measurements. Remote Sens. Environ. 2013, 133, 168–182. [Google Scholar] [CrossRef]
- Groom, S.; Sathyendranath, S.; Ban, Y.; Bernard, S.; Brewin, R.; Brotas, V.; Brockmann, C.; Chauhan, P.; Choi, J.-k.; Chuprin, A. Satellite ocean colour: Current status and future perspective. Front. Mar. Sci. 2019, 6, 485. [Google Scholar] [CrossRef]
- Akhir, M.F.; Daryabor, F.; Husain, M.L.; Tangang, F.; Qiao, F. Evidence of upwelling along Peninsular Malaysia during southwest monsoon. Open J. Mar. Sci. 2015, 5, 273–279. [Google Scholar] [CrossRef]
- Kuo, N.J.; Zheng, Q.; Ho, C.R. Response of Vietnam coastal upwelling to the 1997-1998 ENSO event observed by multisensor data. Remote Sens. Environ. 2004, 89, 106–115. [Google Scholar] [CrossRef]
- Yang, H.J.; Liu, Q.Y.; Jia, X.J. On the upper oceanic heat budget in the South China Sea: Annual cycle. Adv. Atmos. Sci. 1999, 16, 619–629. [Google Scholar]
- Rueda-Roa, D.T.; Muller-Karger, F.E. The southern Caribbean upwelling system: Sea surface temperature, wind forcing and chlorophyll concentration patterns. Deep Sea Res. Part I Oceanogr. Res. Pap. 2013, 78, 102–114. [Google Scholar] [CrossRef]
- García-Reyes, M.; Largier, J. Observations of increased wind-driven coastal upwelling off central California. J. Geophys. Res. Ocean. 2010, 115. [Google Scholar] [CrossRef]
- Kajikawa, Y.; Wang, B. Interdecadal Change of the South China Sea Summer Monsoon Onset. J. Clim. 2012, 25, 3207–3218. [Google Scholar] [CrossRef]
- Healy, T.R. Coastal Wind Effects. In Encyclopedia of Coastal Science; Schwartz, M.L., Ed.; Springer: Dordrecht, The Netherlands, 2005; pp. 312–313. [Google Scholar]
- Reynolds, R.W.; Smith, T.M.; Liu, C.; Chelton, D.B.; Casey, K.S.; Schlax, M.G. Daily high-resolution-blended analyses for sea surface temperature. J. Clim. 2007, 20, 5473–5496. [Google Scholar] [CrossRef]
- Huang, B.; Liu, C.; Freeman, E.; Graham, G.; Smith, T.; Zhang, H.-M. Assessment and intercomparison of NOAA daily optimum interpolation sea surface temperature (DOISST) version 2.1. J. Clim. 2021, 34, 7421–7441. [Google Scholar] [CrossRef]
- Bentamy, A.; Piolle, J.; Prevost, C. Product User Manual for Wind Product WIND_GLO_WIND_L4_REP_OBSERVATIONS_012_006; Copernicus Marine Service: Toulouse, France, 2018; Volume 1, p. 26. [Google Scholar]
- Bentamy, A. Quality Information Document for Wind Product WIND_GLO_WIND_L4_REP_OBSERVATIONS_012_006; Copernicus Marine Service: Toulouse, France, 2021. [Google Scholar]
- Tao, S.Q.; Liu, J.T.; Wang, A.J.; Blattmann, T.M.; Yang, R.J.; Lee, J.; Xu, J.J.; Li, L.; Ye, X.; Yin, X.J.; et al. Deciphering organic matter distribution by source-specific biomarkers in the shallow Taiwan Strait from a source-to-sink perspective. Front. Mar. Sci. 2022, 9, 969461. [Google Scholar] [CrossRef]
- Alvarez, A.; Lopez, C.; Riera, M.; Hernandez-Garcia, E.; Tintore, J. Forecasting the SST space-time variability of the Alboran Sea with genetic algorithms. Geophys. Res. Lett. 2000, 27, 2709–2712. [Google Scholar] [CrossRef]
- Gomez-Gesteira, M.; Moreira, C.; Alvarez, I.; DeCastro, M. Ekman transport along the Galician coast (northwest Spain) calculated from forecasted winds. J. Geophys. Res. Ocean. 2006, 111. [Google Scholar] [CrossRef]
- Ngo, M.H.; Hsin, Y.C. Impacts of Wind and Current on the Interannual Variation of the Summertime Upwelling Off Southern Vietnam in the South China Sea. J. Geophys. Res. Ocean. 2021, 126, e2020JC016892. [Google Scholar] [CrossRef]
- Xi, C.P.; Zhang, S.N.; Gang, X.; Zhao, H.C.; Yang, Y.H. Two-dimensional multifractal cross-correlation analysis. Chaos Solitons Fractals 2017, 96, 59–69. [Google Scholar] [CrossRef]
- Wang, D.X.; Shu, Y.Q.; Xue, H.J.; Hu, J.Y.; Chen, J.; Zhuang, W.; Zu, T.T.; Xu, J.D. Relative contributions of local wind and topography to the coastal upwelling intensity in the northern South China Sea. J. Geophys. Res. -Ocean. 2014, 119, 2550–2567. [Google Scholar] [CrossRef]
- Barlow, D.R.; Klinck, H.; Ponirakis, D.; Garvey, C.; Torres, L.G. Temporal and spatial lags between wind, coastal upwelling, and blue whale occurrence. Sci. Rep. 2021, 11, 6915. [Google Scholar] [CrossRef]
- Jing, Z.Y.; Qi, Y.Q.; Du, Y.; Zhang, S.W.; Xie, L.L. Summer upwelling and thermal fronts in the northwestern South China Sea: Observational analysis of two mesoscale mapping surveys. J. Geophys. Res. -Ocean. 2015, 120, 1993–2006. [Google Scholar] [CrossRef]
- Fu, B.; He, X.; Yao, H.; Liang, Y.; Deng, T.; He, H.; Fan, D.; Lan, G.; He, W. Comparison of RFE-DL and stacking ensemble learning algorithms for classifying mangrove species on UAV multispectral images. Int. J. Appl. Earth Obs. Geoinf. 2022, 112, 102890. [Google Scholar] [CrossRef]
- Fu, B.; Sun, J.; Wang, Y.; Yang, W.; He, H.; Liu, L.; Huang, L.; Fan, D.; Gao, E. Evaluation of LAI Estimation of Mangrove Communities Using DLR and ELR Algorithms With UAV, Hyperspectral, and SAR Images. Front. Mar. Sci. 2022, 9. [Google Scholar] [CrossRef]


Disclaimer/Publisher’s Note: The statements, opinions and data contained in all publications are solely those of the individual author(s) and contributor(s) and not of MDPI and/or the editor(s). MDPI and/or the editor(s) disclaim responsibility for any injury to people or property resulting from any ideas, methods, instructions or products referred to in the content. |
© 2023 by the authors. Licensee MDPI, Basel, Switzerland. This article is an open access article distributed under the terms and conditions of the Creative Commons Attribution (CC BY) license (https://creativecommons.org/licenses/by/4.0/).