Article

Evaluation of Measurement Strategy for Track Side Monitoring of Railway Wheels

Division of Operation and Maintenance Engineering, Luleå University of Technology, 97187 Lulea, Sweden
*
Author to whom correspondence should be addressed.
Appl. Sci. 2023, 13(9), 5382; https://doi.org/10.3390/app13095382
Submission received: 15 March 2023 / Revised: 24 April 2023 / Accepted: 24 April 2023 / Published: 25 April 2023

Abstract

:
Wheelsets form an indispensable part of the railway rolling stock and need to be periodically inspected to ensure stable, safe, reliable, and sustainable rail operation. Wheel profiles are usually inspected and measured in a workshop environment using handheld equipment or by utilizing wayside measuring equipment. A common practice for both methods is to measure the wheel profile at one position along the circumference of the wheel, resulting in a one-slice measurement strategy, based on the assumption that the wheel profile has the same shape independent of the measurement position along the wheel. In this article, the representability of a one-slice measurement strategy with respect to the wheel profile parameters is investigated using handheld measurement equipment. The calculated range of standard deviation of the parameters estimated such as flange height, flange width, flange slope, and hollow wear from the measurements shows a spread in the parameter value along the circumference of the wheel. As an initial validation of the results, measurements from the wayside monitoring systems were also investigated to see if a similar spread was visible. The spread was significantly higher for flange height, flange width, and flange slope estimated from wayside measurement equipment than for the same parameters estimated using the handheld measurement equipment.

1. Introduction

Rail transport has emerged as a significant and sustainable mode of transportation, forming a key enabler of the socioeconomic development of modern society through passenger and freight services. To reduce the carbon emission arising from the transport sector, the European commission aims to shift 50% of medium-distance passenger and freight transports from road transportation to railway and waterborne transport by 2050 [1]. In Sweden, the use of rail transport has increased significantly over the last 26 years, with passenger-kilometer doubled and a 12% increase in freight traffic [2]. An average annual growth of 3% of passenger traffic and 1% of freight traffic is estimated in Sweden up to the year 2050 [3,4]. This growing demand has put a certain strain on the Swedish railway network in terms of operational capacity and service quality. With the rapid development of railway transportation, maintenance and renewal process have become the important factors to ensure a high quality of service (i.e., punctuality, comfort, and safety) [5].
The wheel–rail interface plays a crucial role in the performance of the railway system, and to ensure a high quality of service it needs to be managed well and treated as a system [5,6]. In addition to the rail and wheel, other factors such as track curvature, wheel and rail profiles, friction, and the status of the track and wheel themselves have significant influence on the wheel–rail interface [7]. In Sweden, the track and its components are measured on a regular basis according to internal regulations of the Swedish Transport Administration [3,6,8], and hence infrastructure managers usually have good knowledge of rail status. However, an infrastructure manager’s knowledge of the wheel in service is limited and has become an issue of great relevance in Sweden, as the ownership of the infrastructure and rolling stock is divided.
The wheelset is one of the most important and costly on-maintenance components [9] in the rolling stock, and the health status of the same can be related to operation safety, stability, and noise emission [10]. Wheels are subject to numerous defects that influence their smooth revolutions, and these defects can be broadly classified into four categories: surface defects (flatness, spalling, shelling), profile defects, polygonization (corrugation, roughness, etc.), and subsurface defects [11,12,13,14]. The presence of such defects on the wheel can also lead to high-impact forces in the wheel–rail interface, which can subsequently induce damage on the rail and other track components. Further, the presence of such damages can reduce the service life of a wheel, leading to accelerated deterioration and excessive costs. The presence of such damages on wheels can lead to unplanned maintenance activities that are a major source of train delays [15]. Thus, early detection and prediction of wheel defects are essential to reduce systemwide maintenance cost, reduce delays due to unplanned maintenance activities, and ensure safe train operations [16].
The condition assessment of a dynamic system such as a railway wheel can be carried out using various methods: statistical modelling, physical modelling, or condition monitoring. For an in-service train with multiple wheels, the wheel fatigue parameters and wheel wear, and consequently the degradation rate, depend on various factors including varying environmental and operational conditions (speed, axle load, rail profile, etc.). Further, the wheel–rail interaction and the degradation pattern vary between the right and left wheels of an axle, the back and front axles in a bogie, and from bogie to bogie [17,18,19]. These varying factors hinder the use of numerical, statistical, and analytical models for condition assessment of an in-service wheel. Accordingly, condition monitoring techniques can be considered as the best plausible tool for condition assessment for an in-service wheel.
An imperative step in any condition monitoring process is data acquisition. Assessment of the present condition and forecasting of the future condition of the wheelset strongly relies on the measurement stage, and hence selecting an adequate sensor type for measurement purposes is crucial. For railway wheelset monitoring, the data acquisition approach can be broadly classified into two types of measurement: in-workshop measurement, when the wheels are idle, and in-service measurement, when the wheels are in motion. In-service measurements can be further divided into two types based on the position of the data acquisition sensor: onboard measurements and wayside measurements. Ultrasonic techniques [20,21], infrared camera [22], and magnetic techniques [23,24,25] are commonly used monitoring tools used during in-workshop measurements of rail wheels. Acoustic techniques [26,27], ultrasonic technique [28], vibration measurements [29,30], and magnetic techniques [31,32] are common types of monitoring techniques used for in-service and onboard inspections of rail wheels. The in-service and wayside inspection of rail wheels commonly makes use of monitoring systems such as strain gauges [33,34], Fibre Bragg grating sensors [35,36], ultrasonic techniques [37,38], vibration technique [39,40], acoustic technique [41], and laser-air hybrid ultrasonic techniques [42]. Most of the studies using the abovementioned techniques have been carried out to detect wheel flats, surface defects, and subsurface defects. However, abnormalities on the profiles of the wheel such as asymmetrically worn wheel and hollow wear are understudied [6,43].
Train wheelsets are subjected to constant wear mainly due to the friction arising during the contact between the wheel and the rail. Once the wear on the wheelset exceeds the safety limit, the wheelsets need to be reprofiled or replaced, otherwise normal wheel–rail interaction will be restricted and can ultimately lead to derailment. Further, asymmetrically worn and hollow-worn wheels can also lead to significant damages on the rail head and in switches and crossings, thus increasing the time and cost for maintenance activities. Hence timely assessment of the wheel profile using suitable condition monitoring techniques is crucial for infrastructure managers to ensure safety and high quality of service. A general criticism of measurement systems, especially the ones used for condition monitoring, is that they do not always produce reliable data [19]. Instead, they can give measurement values with huge discrepancies from the actual value due to errors or to unreliable measurement patterns [44]. Such a scenario can lead to incorrect assessment resulting in unwanted interventions and wrong or no actions being taken, thus increasing the risk of catastrophic failures and adding to the cost paid by the infrastructure owners. Thus, it is crucial to ensure that the measured data are reliable and of high quality, since the management decisions based on the information derived from the data are only as decisive as the data themselves.
Wheel profiles are usually inspected and measured in a workshop environment using a handheld measurement device, measuring the wheel profile at one position of a non-rotating wheel. Over the past decade, the wayside monitoring of wheel profiles has gained significant importance for monitoring wheel profiles [4,13]. During the wayside inspection, the wayside equipment measures the passing train, resulting in a one-slice measurement strategy [4,6,18]. Typically, during wheel profile inspection (both in-workshop and wayside inspection) the profile is measured only at a specific position of the wheel, the so- called ‘one-slice’ approach. This ‘one-slice’ approach is carried out on the basis of the assumption that the wheel profile has the same shape independent of the measurement position along the circumference of the wheel. However, to ensure that reliable information is derived from the measurements, multiple measurements need to be conducted to ensure a reliable representative measure of the wheel profile along the circumference of the wheel. This paper presents a study of the representability of a one-position or one-slice measurement strategy with respect to the wheel parameters from measurements carried out during in-workshop inspection and utilizing wayside monitoring systems to validate the same. The aim of this study is also to improve the possibility of classifying wheels that are in operation with respect to the standard wheel parameters. An improved classification could result in better ride comfort, less wheel and rail wear, and lower maintenance cost for both infrastructure managers and rolling stock owners/operators. The main aspect investigated in this study is the possibility of using single-wheel profile measurements from wayside measurement stations giving one-slice measures of the wheel profile for calculating the standard wheel parameters.
The remainder of this paper is structured as follows. Section 2 introduces the technical background of wheel profiles and standard wheel parameters. Section 3 elaborates the methodology followed for this study. The results and analysis are explained in Section 4, and the conclusions and future work are discussed in Section 5.

2. Wheel Profiles and Wheel Parameters

A railway wheelset consists of an axel fixed to two sets of wheels. For the rolling stock vehicles on the track there are numerous different wheel profiles in use, and the nominal wheel shape is adapted depending on the application concerned [6]. For instance, iron ore wagon wheels used along the Iron Ore Line in Sweden are subjected to large axle loads, and the wheels generally have a profile which provides a larger contact area, thus giving a wider pressure distribution between the wheel and the rail. On the other hand, passenger trains have a particular profile which is crafted to meet the requirements for stability at higher speed. There are also different limitations for the wheel profiles depending on certain factors such as maximum allowed speed, wheel diameter, maximum allowed load, etc. Further, the wheel measures are also controlled by mandatory requirements for high and low thresholds [45].
Figure 1 depicts the wheel profile for a new wheel (marked with a blue line) and a worn wheel (marked with a red dashed line). The wheel profile is commonly divided into two main parts: the flange and the tread. The wheel profile parameters are used to describe the condition of the wheel, and the standard wheel profile parameters are depicted in Figure 1. Flange height (Sh), flange width (Sd), flange slope (qR), and tread hollowing (Th) are the widely established wheel profile parameters in the railway industry and are described below:
  • Flange height Sh: vertical distance (in mm) from the nominal running circle (70 mm from the flange back) to the top of the flange
  • Flange width Sd: lateral distance (in mm) between the flange back and the flange face measured at a height of 10 mm up from the nominal running circle
  • Flange slope qR: lateral distance between the flange face position measured at a height of 10 mm up to 2 mm below the top of the flange
  • Tread hollowing: difference in radius between the smallest radius of the tread (close to the running band) and the largest radius close to the field side
Measurements of these wheel parameters are essential, as they describe different aspects of the wheel profile and give insights to the status of the wheel with respect to different requirements. For instance, the flange height cannot be too low (to avoid derailment) and cannot be too high (to avoid damages to other track components). Similarly, the flange cannot be too thin (to avoid flange failure and derailments). Measures of these parameters are hence used for maintenance decisions in the railway sector.
In the railway sector, these parameters generally have both maintenance and safety limits, and when some of the measurements pass a high or low threshold of these limits or when a wheel failure occurs, the wheel needs to be reprofiled or replaced accordingly. The intervals between the reprofiling vary significantly depending on the application; for instance, the wheels of lighter trains usually have longer intervals between reprofiling than the wheels of trains with a large axle load.

3. Methodology

This section describes the methodology used in this study. As discussed earlier, the goal of this study is to investigate the representability of a single ‘one-slice measurement’ of a wheel profile carried out during both in-workshop inspection and wayside monitoring. The representability study was carried out for both newly grinded wheels and for wheels with different operating hours. The in-workshop inspection and the wayside monitoring approaches used for this study are briefly described below.

3.1. In-Workshop Measurements

For the manual measurements, wheel profiles were measured along the circumference of the wheel during in-workshop inspections using a handheld measurement system. The measurement system used for this study is a laser-based equipment CALIPRI manufactured by the NEXTSENSE company, Austria. The accuracy of the measurement equipment is <±80 µm, and the repeatability is <±35 µm. The manual measurements of the wheel were performed at a workshop owned by the operator of the iron ore traffic in northern Sweden, LKAB Malmtrafik, Sweden.
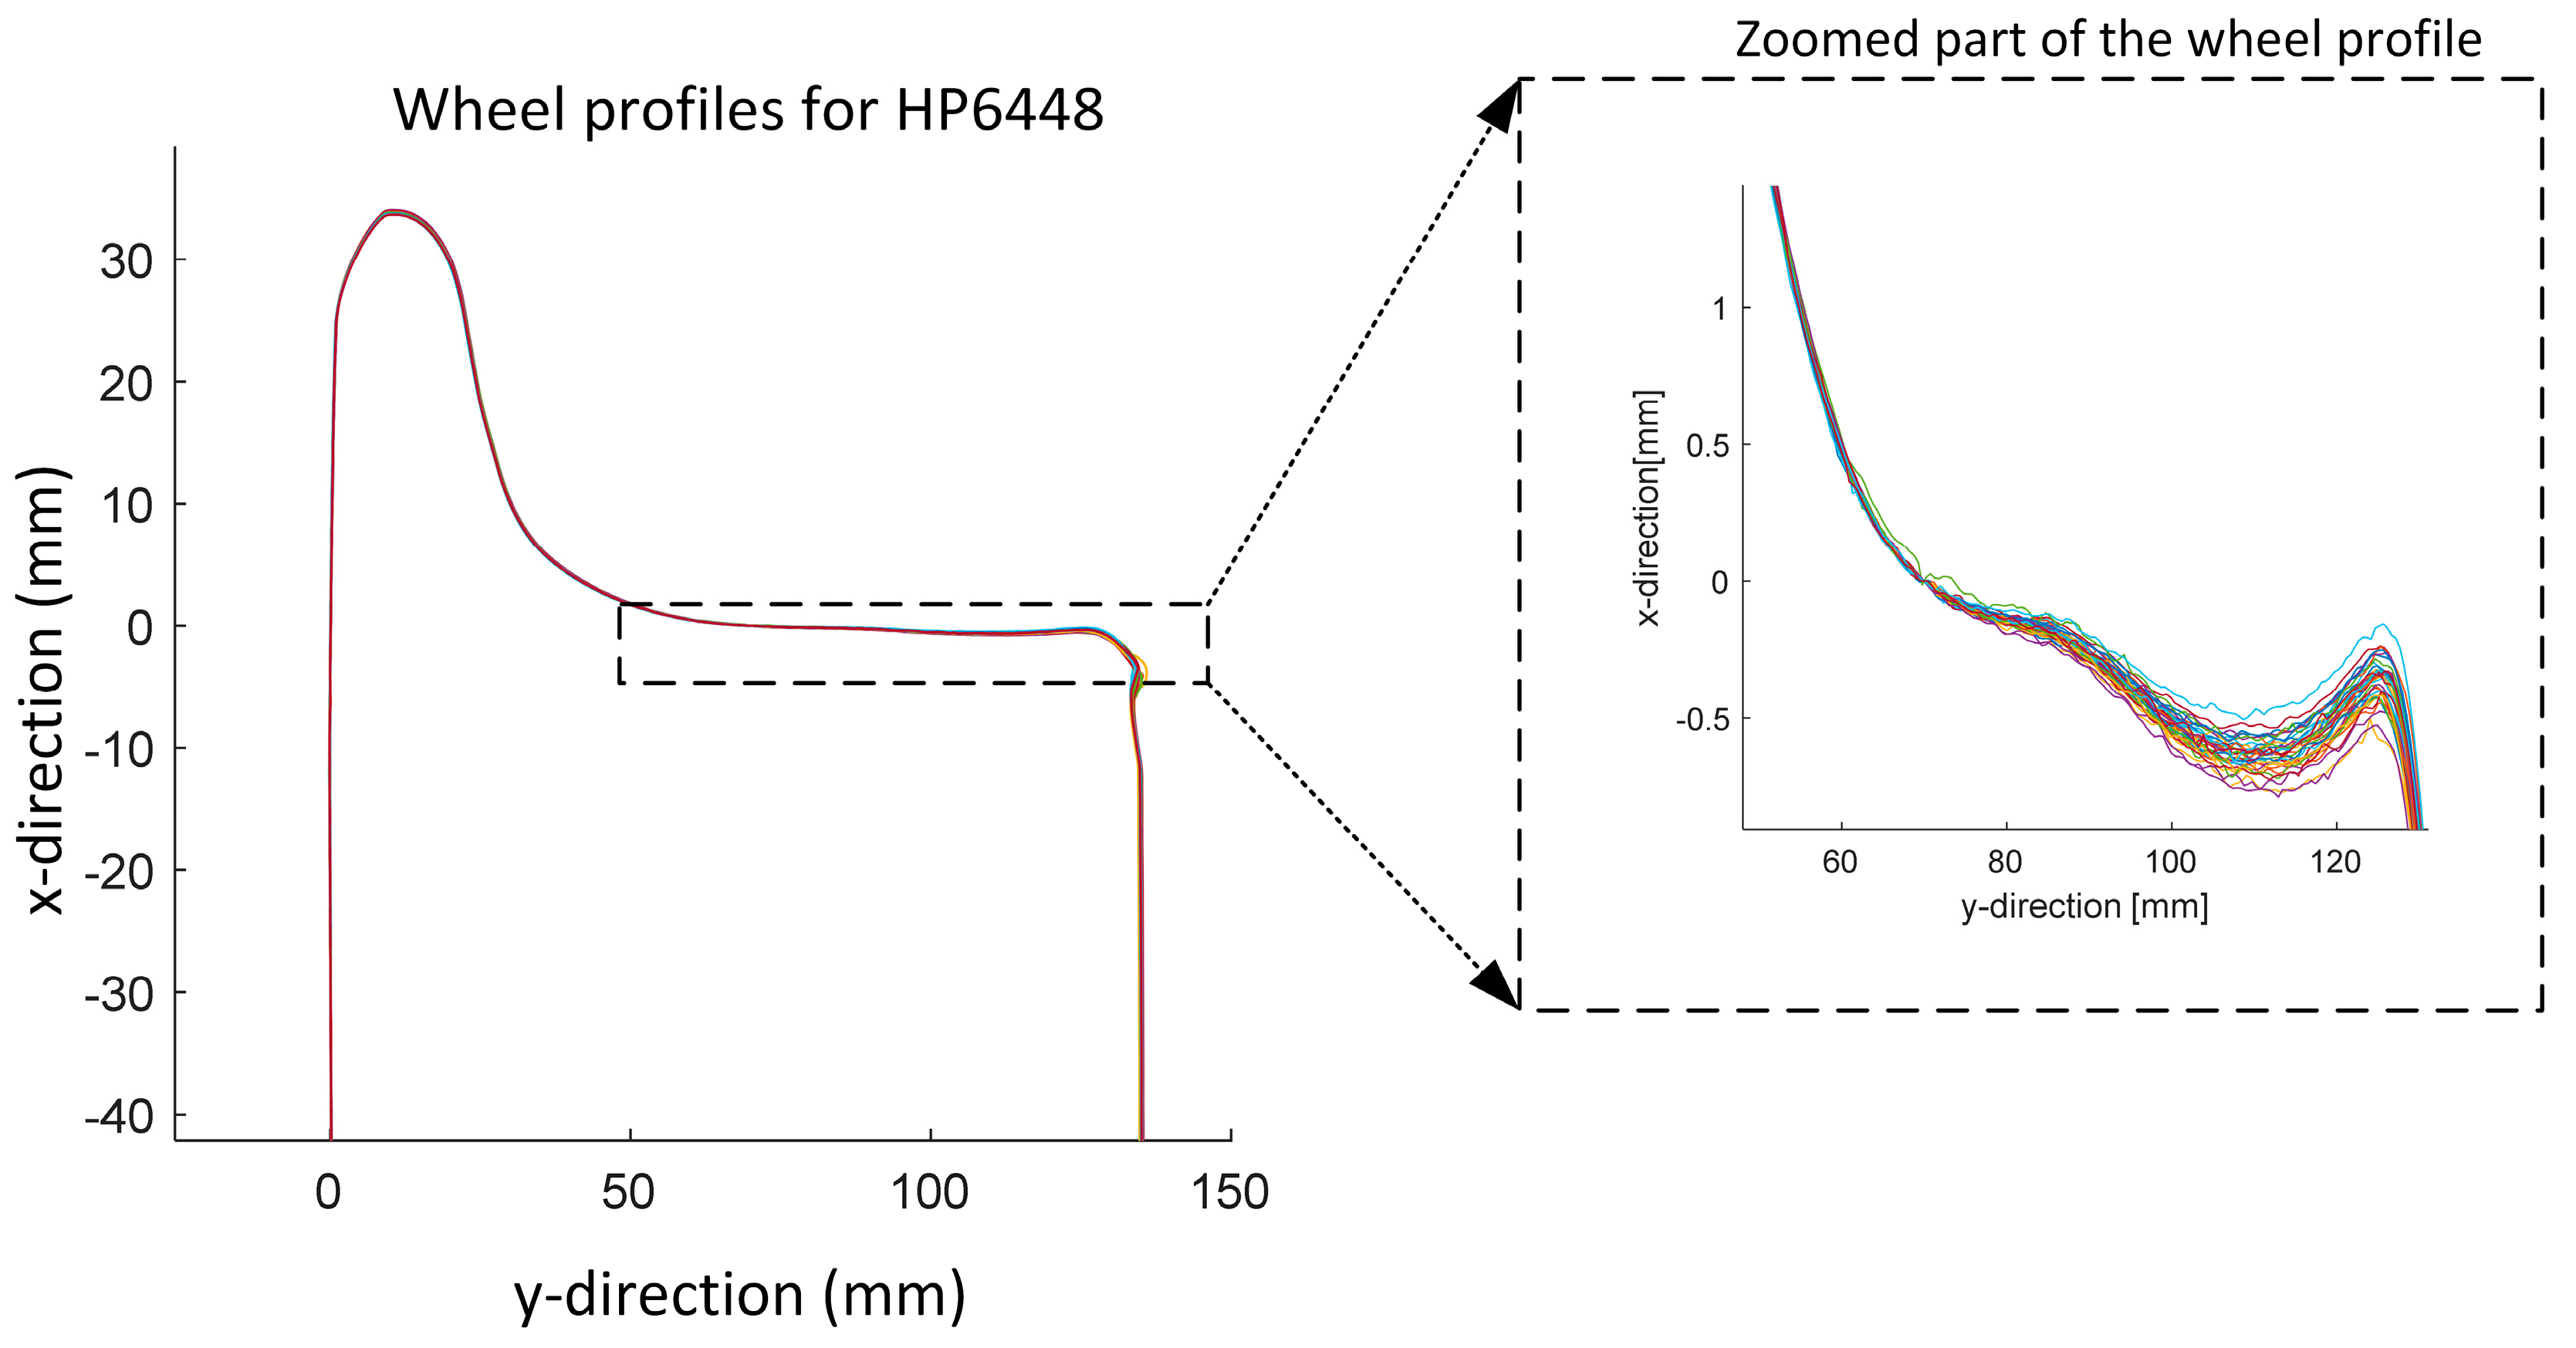
Seven wheels were measured using the handheld laser-based equipment with a resolution of 35 measurement points equally spaced along the circumference of each of the wheels, giving approximately 100 mm between the measurement points. Table 1 shows the manually measured wheels in the workshop along with the information regarding the age of the wheel in terms of distance travelled in km. Figure 2 depicts the profiles plotted along the circumference of the wheel (HP6448) illustrating the different measurement positions for that wheel.
For the in-workshop measurements, both the reproducibility and the representability of the wheel profile measurements were tested. The reproducibility of the measurements was tested by comparing two operators performing the same measurement task on the same wheel using the same measurement device. The reproducibility was analysed with the wheel profile parameters. The representability was tested for both newly grinded wheels and wheels with different operating hours. For the representability test, measurements carried out by only one of the operators were used. The representability was also analysed with respect to wheel profile parameters.

3.2. Wayside Measurements

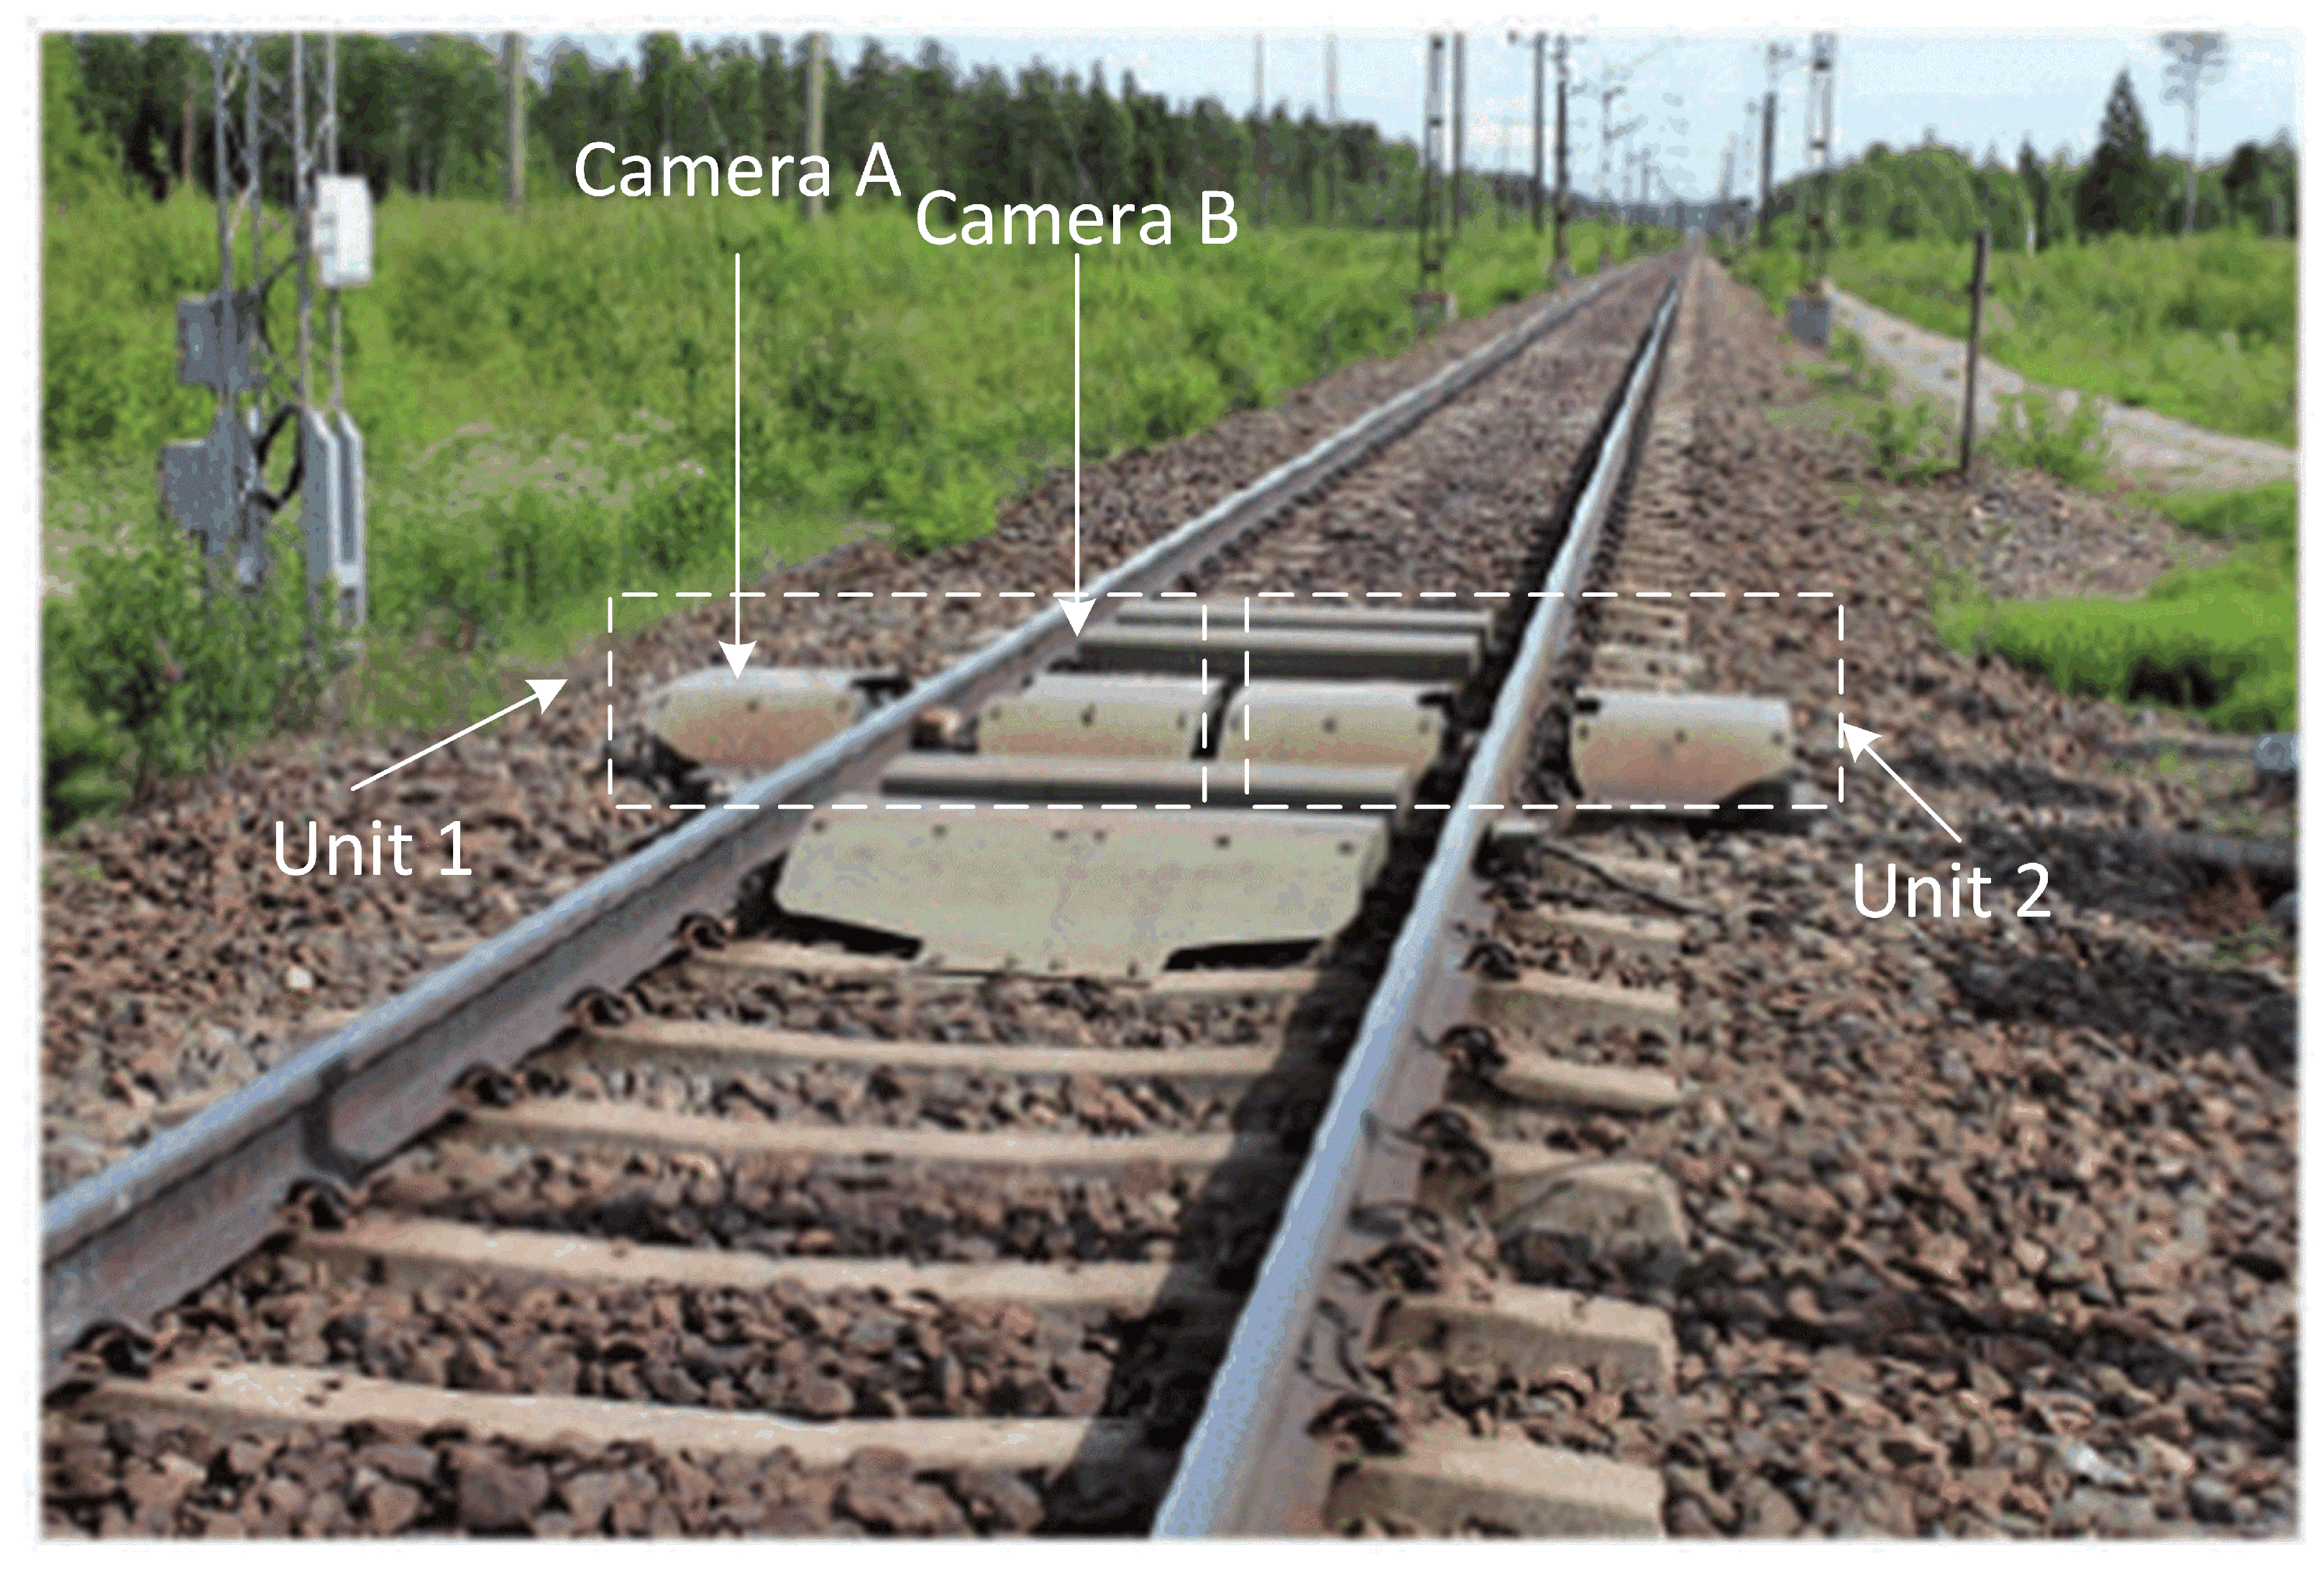
Wayside measurements of the wheel profile parameters were performed using a commercial laser-based automatic wheel profile measurement system developed by Beena Vision, USA. The automatic monitoring system is located at the track section situated in the southernmost part of the Iron Ore Line in Sweden. The automatic wheel profile measurement system is depicted in Figure 3, and the system consists of two main units. The first wheel triggers a sensor when a train passes the boxes housing the measurement units and the protective cover opens. The laser beams activate and project laser lines onto the surface of the passing wheels, and the camera captures pictures of this. Each unit consists of two cameras (depicted in Figure 3) and three lasers that produce two images, one for each flange and tread side of the wheel. The two images are merged to form one image of the wheel profile, from which the wheel profile parameters are estimated (refer Figure 1).
During the wayside measurement, eight different wheels were measured, and the wheel profile parameters were estimated for each reading. To reduce the effect of wheel wear influencing the study, the wheels were measured during a time span of ten days. During this period, each wheel passed the measurement system ten times, resulting in a set of ten measures for each wheel. Between each measurement, the travel distance of the wheel was approximately 800 km. Depending on the direction of the train, the right or left system was used to measure the wheel profile parameters. Due to measurement errors for some wheels, some measurements had to be discarded. The measurement error involved those sequences where the camera failed to capture and save the images of the wheel. Table 2 depicts the number of measurements recorded for each individual wheel.

4. Results and Discussion

Table 3 depicts the results of the reproducibility measurement where the manual measurement system was tested by two different operators on wheel HP6448. The average value of the mean and the standard deviation for both operators is presented as  μ 3  and  σ 3 , respectively, in the rightmost column. From the table below it is evident that the mean value of all four parameters calculated for the measurements carried out by the two operators was similar, with a standard deviation of 0.6. The repeatability of the handheld equipment is well in accordance with the manufacturer value. For further studies only the measurements carried out by one of the operators were used.
Figure 4 depicts the wheel profile measurement performed using the handheld measurement system along the circumference of the wheel HP6448 by one of the operators. The right graph shows a zoomed part of the wheel profile where the difference between the individual measurements is clearly visible.
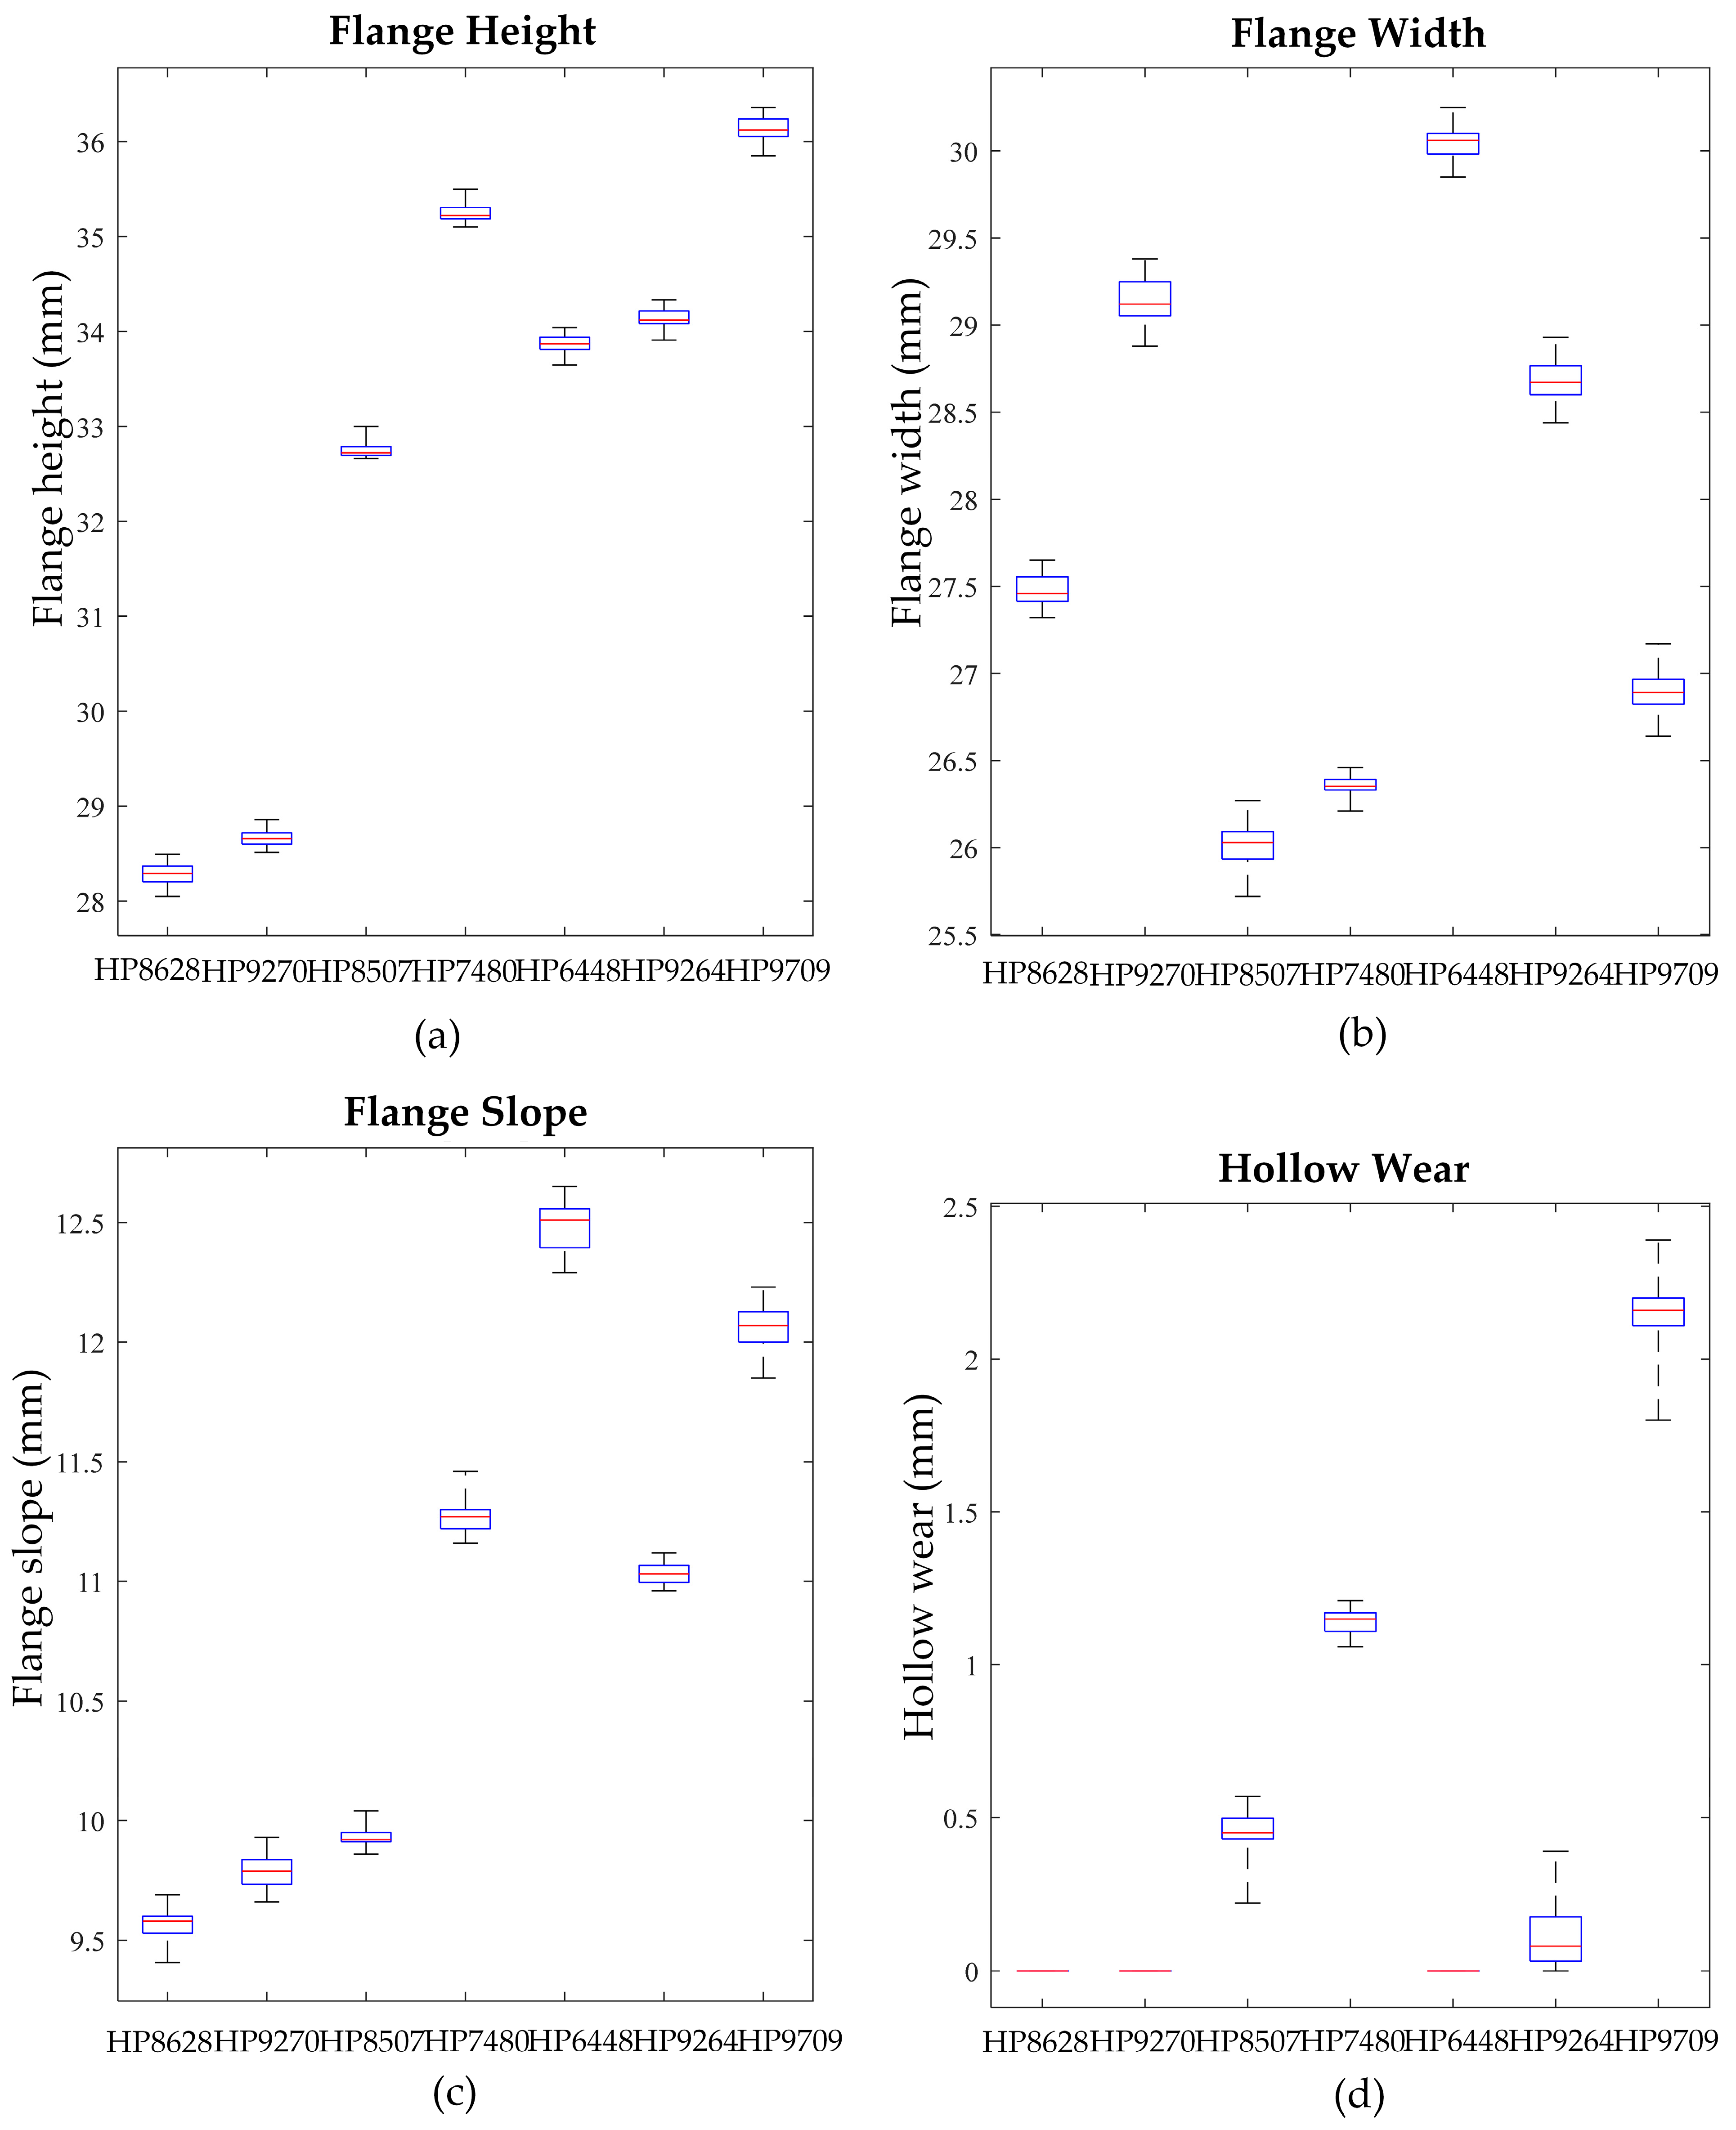
Figure 5 depicts the box plot, and Table 4 represents the statistical parameters such as mean, standard deviation, and range for the four-wheel parameters estimated for different wheels. Each wheel was measured at 35 different positions along the wheel circumference by the same operator with a gap of 100 mm between each position. The mean value for flange height increased with respect to the running distances of the wheel (running distances of the wheels are depicted in Table 1). Wheel HP9709 with an age of over 400,000 km (running distance) exhibited higher values of flange height, flange slope, and hollow wear than when compared to the relatively new wheel HP8628. The box plot shows that there are variations in all four estimated parameters when measured at different positions within the same wheel. The spread in the parameter was comparatively smaller for relatively newer wheels.
The highest mean value, standard deviation, and range for flange height (Sh) was observed for wheel HP9709, which had the highest running distance, over four hundred thousand kilometers. The average standard deviation of flange height over all the wheels recorded was 0.1 mm around the mean value, and the average range (difference between maximum and minimum value) was 0.4 mm. The highest mean value for flange width (Sd) was found to be associated with wheel HP6448, and the largest standard deviation for the estimated flange width was found to be for wheel HP9270. The highest range (0.580 mm) for the flange width was observed for wheel HP7480. The average standard deviation for flange width for the measurements across all the wheels in the study was 0.1 mm around their mean value with an average range of 0.48 mm. The highest mean value for flange slope (qR) and the largest standard deviation of the same was associated with wheel HP6448. The range for estimated flange slope was largest for wheel HP9709 with a value of 0.38 mm. The average standard deviation and average range of the estimated flange slope across all the wheels were 0.067 mm and 0.27 mm, respectively. The hollow wear or the tread hollow (Th) was zero for three of the wheels studied (two wheels being new). The highest mean value, standard deviation, and range for hollow wear/tread hollowing (Th) were observed for wheel HP9709, which had the highest running distance among all the wheels observed in this study. The average standard deviation and average range of hollow wear across all the wheels that exhibited hollow wear were observed to be 0.08 mm and 0.4325 mm, respectively. These statistics indicate that there are variations in the estimated wheel parameters for different measurement positions within the same wheel.
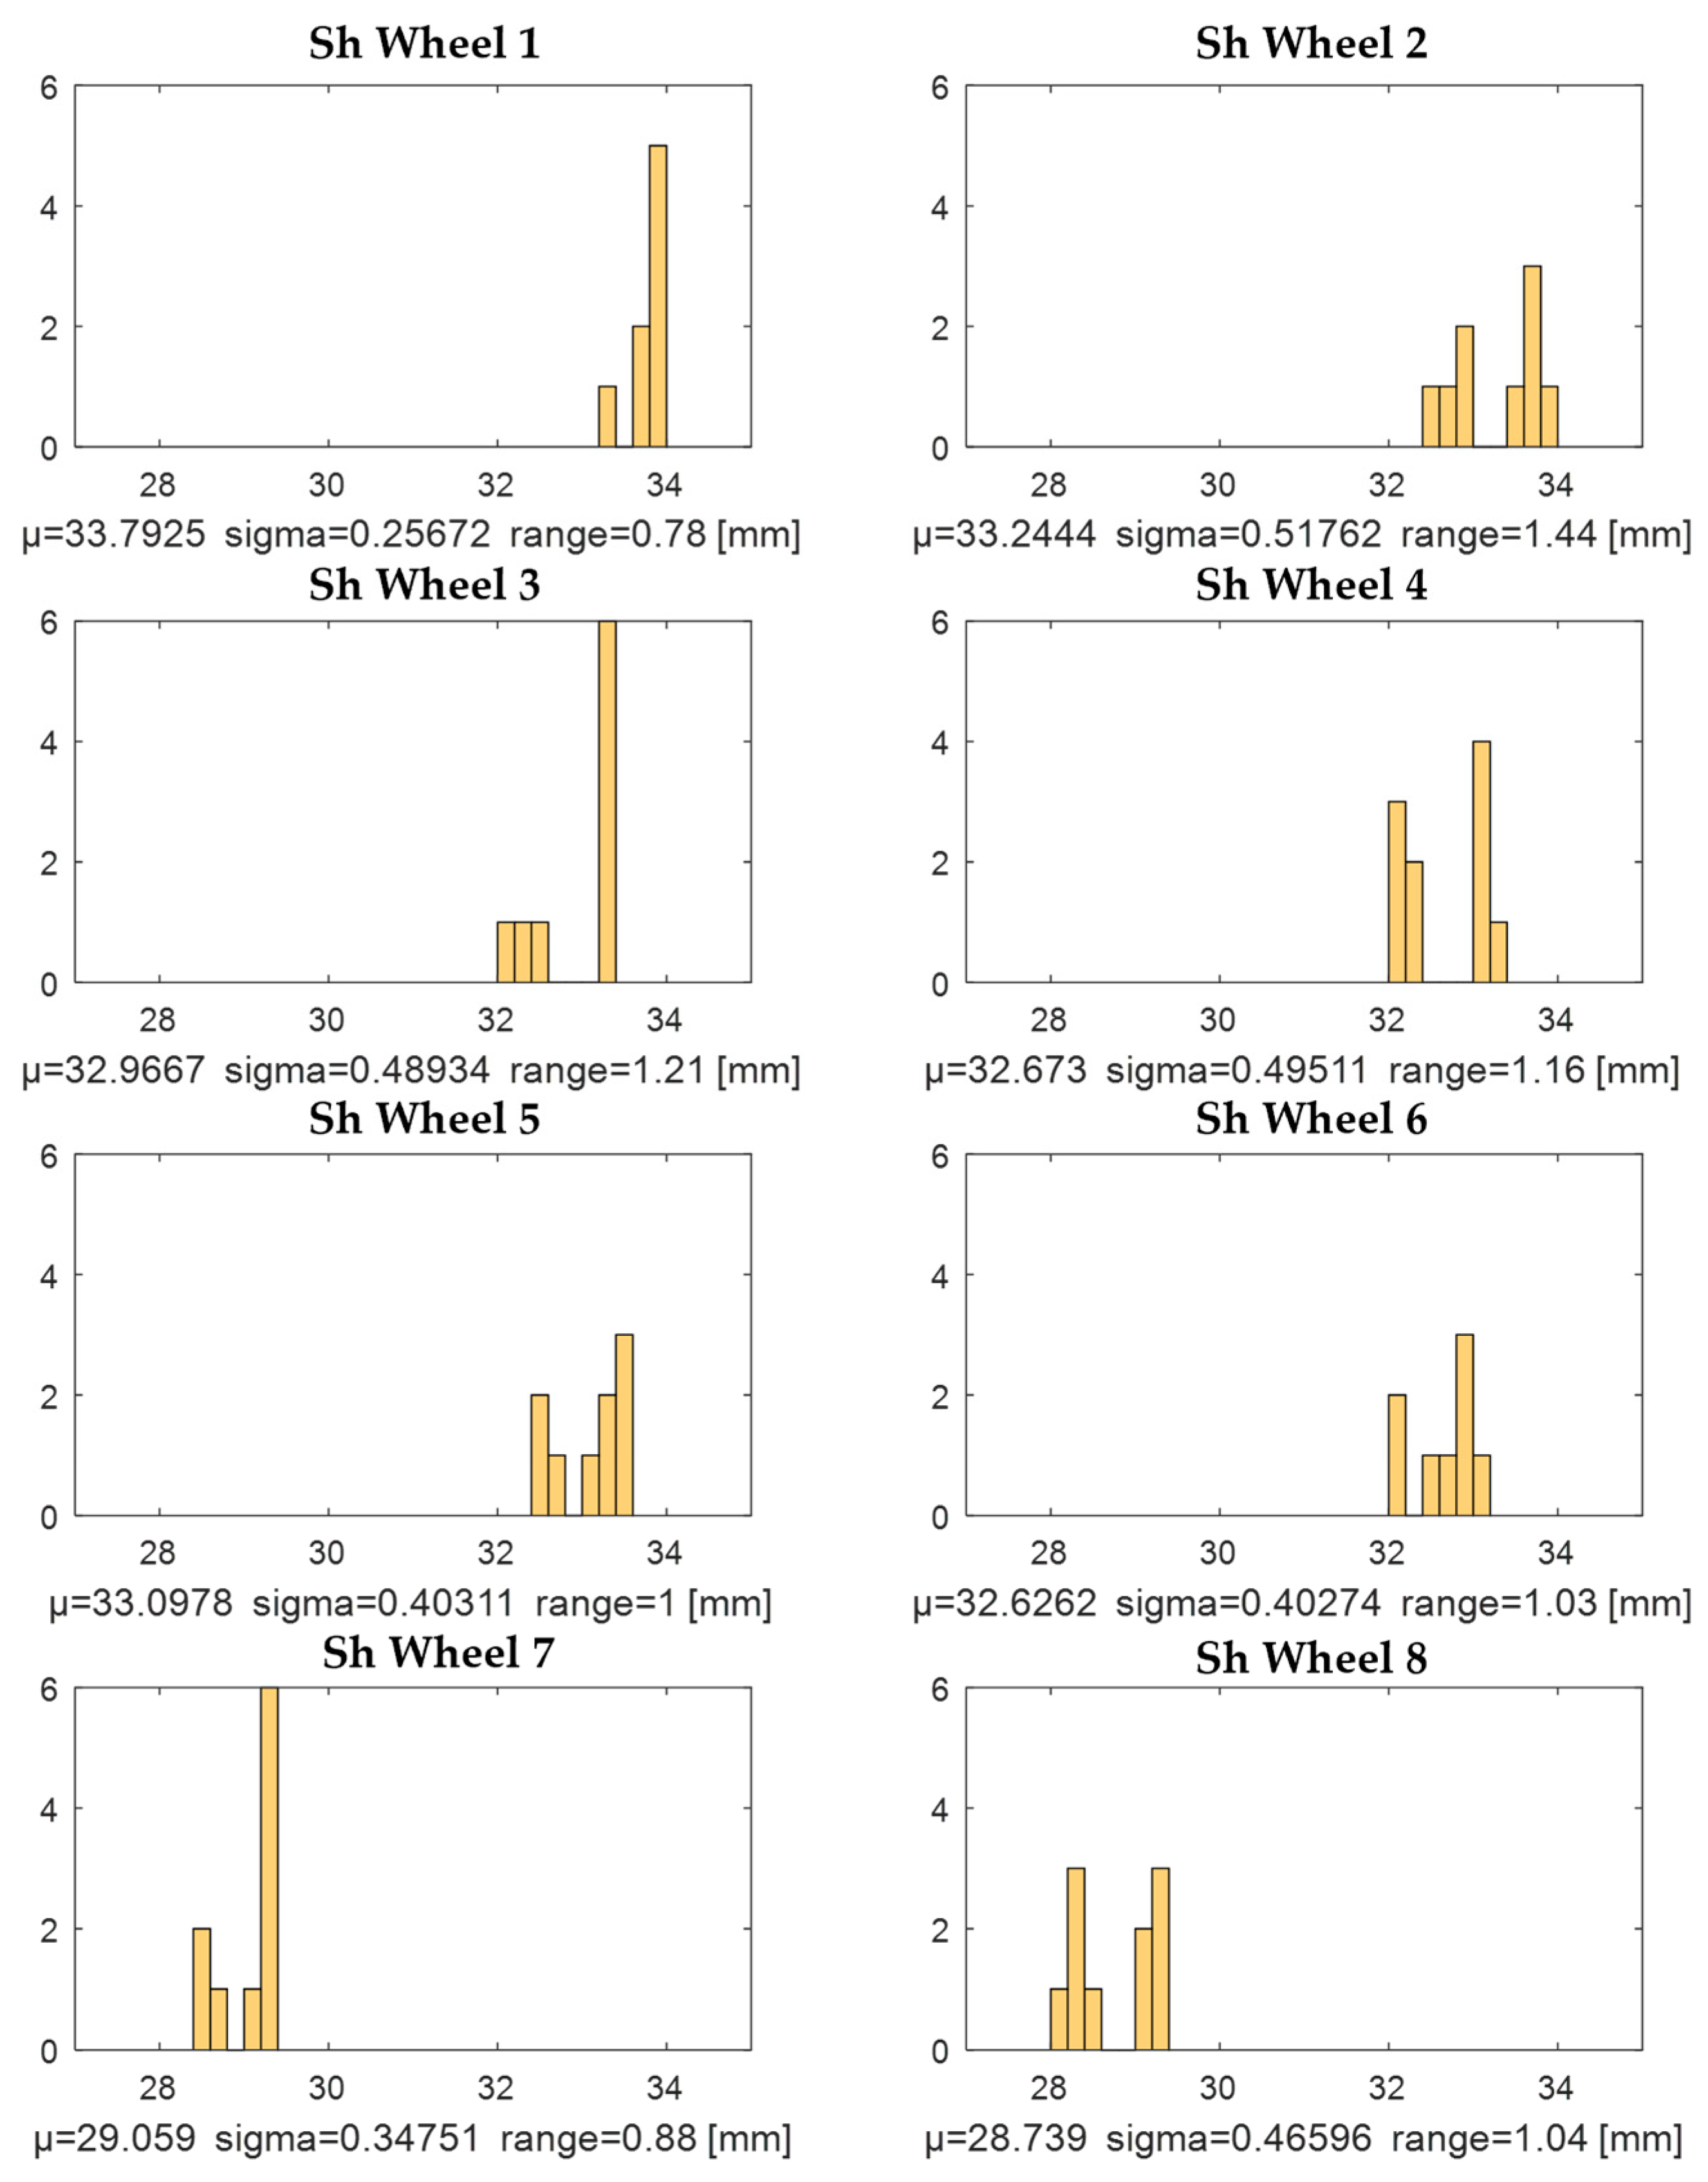
Figure 6 depicts a histogram plot of flange height measured for eight different wheels. The highest average mean flange height value was associated with wheel 1 (measured 8 times). The largest standard deviation around the mean value (0.517 mm) and the largest range (1.44 mm) for the flange height was found to be for wheel 2. The average standard deviation across all the wheels for the estimated flange height was 0.422 mm, and the average range was 1.07 mm. The average standard deviation of flange height estimated using the wayside measurements was over four times higher than when using the handheld equipment, and the average range was over two times.
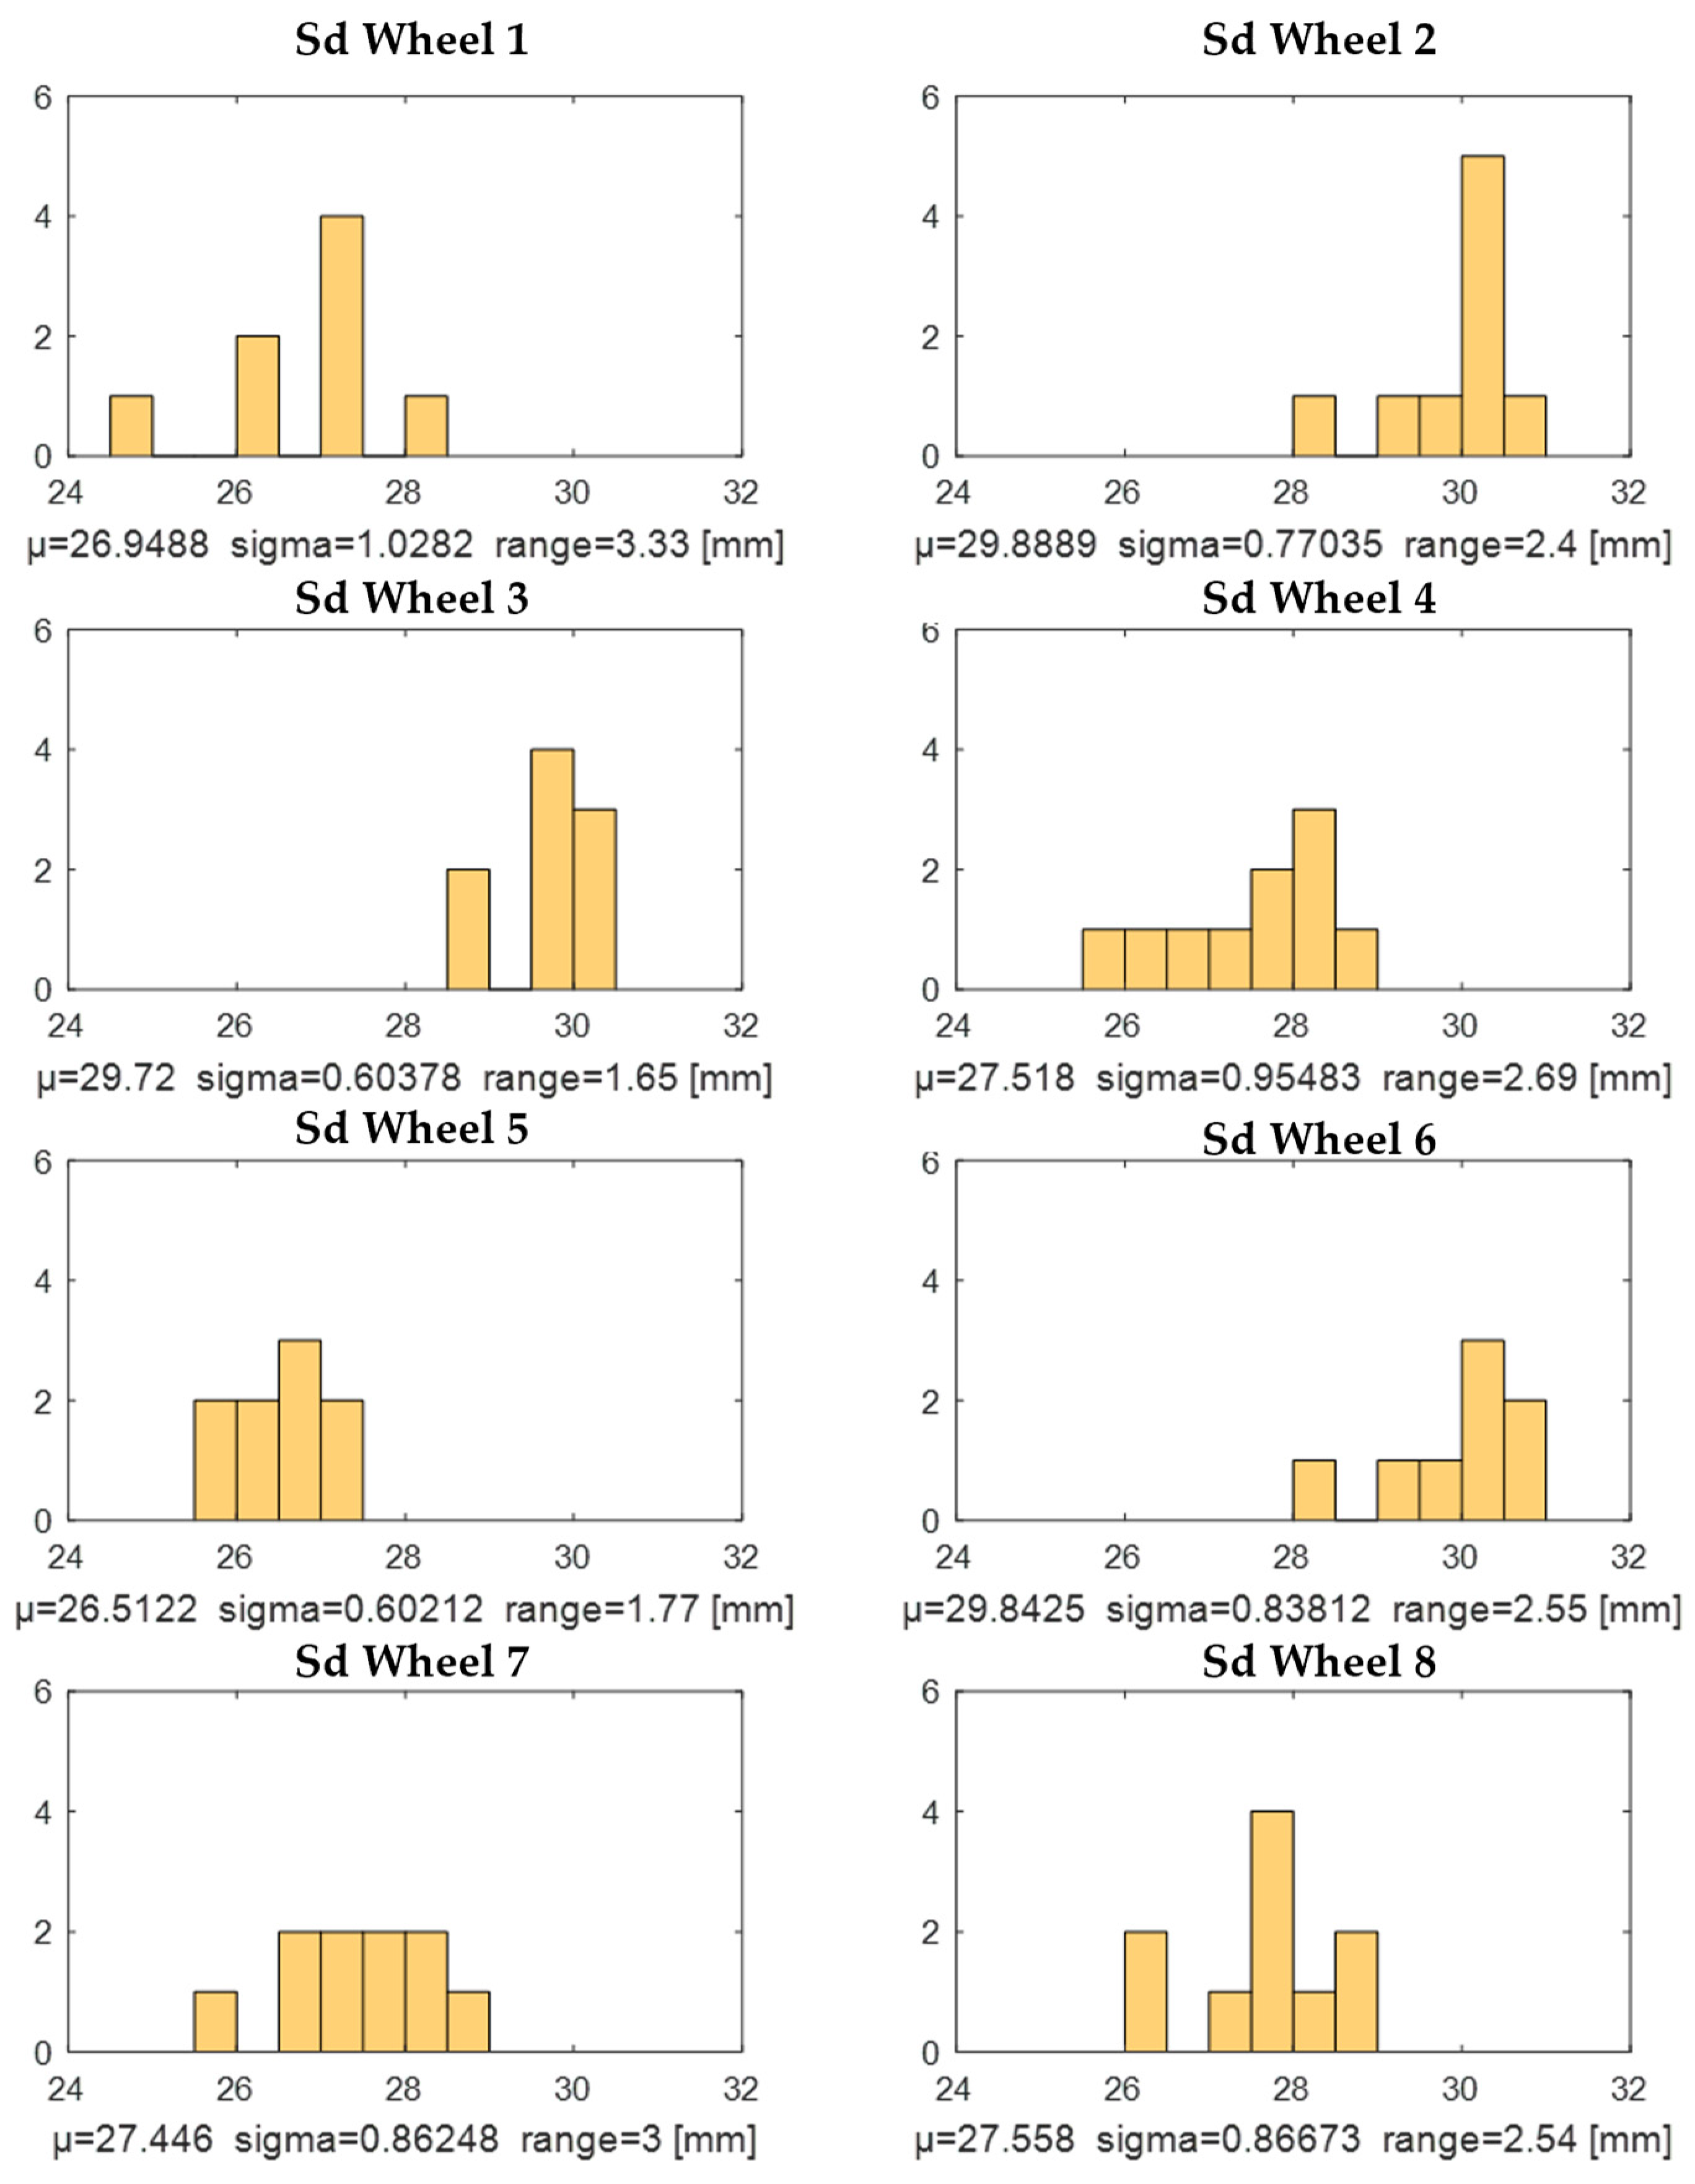
Figure 7 depicts the histogram plot of the flange width measured for eight different wheels. The highest mean value for the flange width was observed for wheel 2 with a value of 29.88 mm. The largest standard deviation around the mean value (1.028 mm) and the largest range (3.33 mm) for the estimated flange width was found to be for wheel 1. From the histogram plot, the spread in the flange width values is quite significant. The average standard deviation across all the wheels for the estimated flange width was 0.815 mm, and the average range was 2.5 mm. The average standard deviation of flange width estimated using the wayside measurements was over eight times higher than when using the handheld equipment, and the average range was over five times.
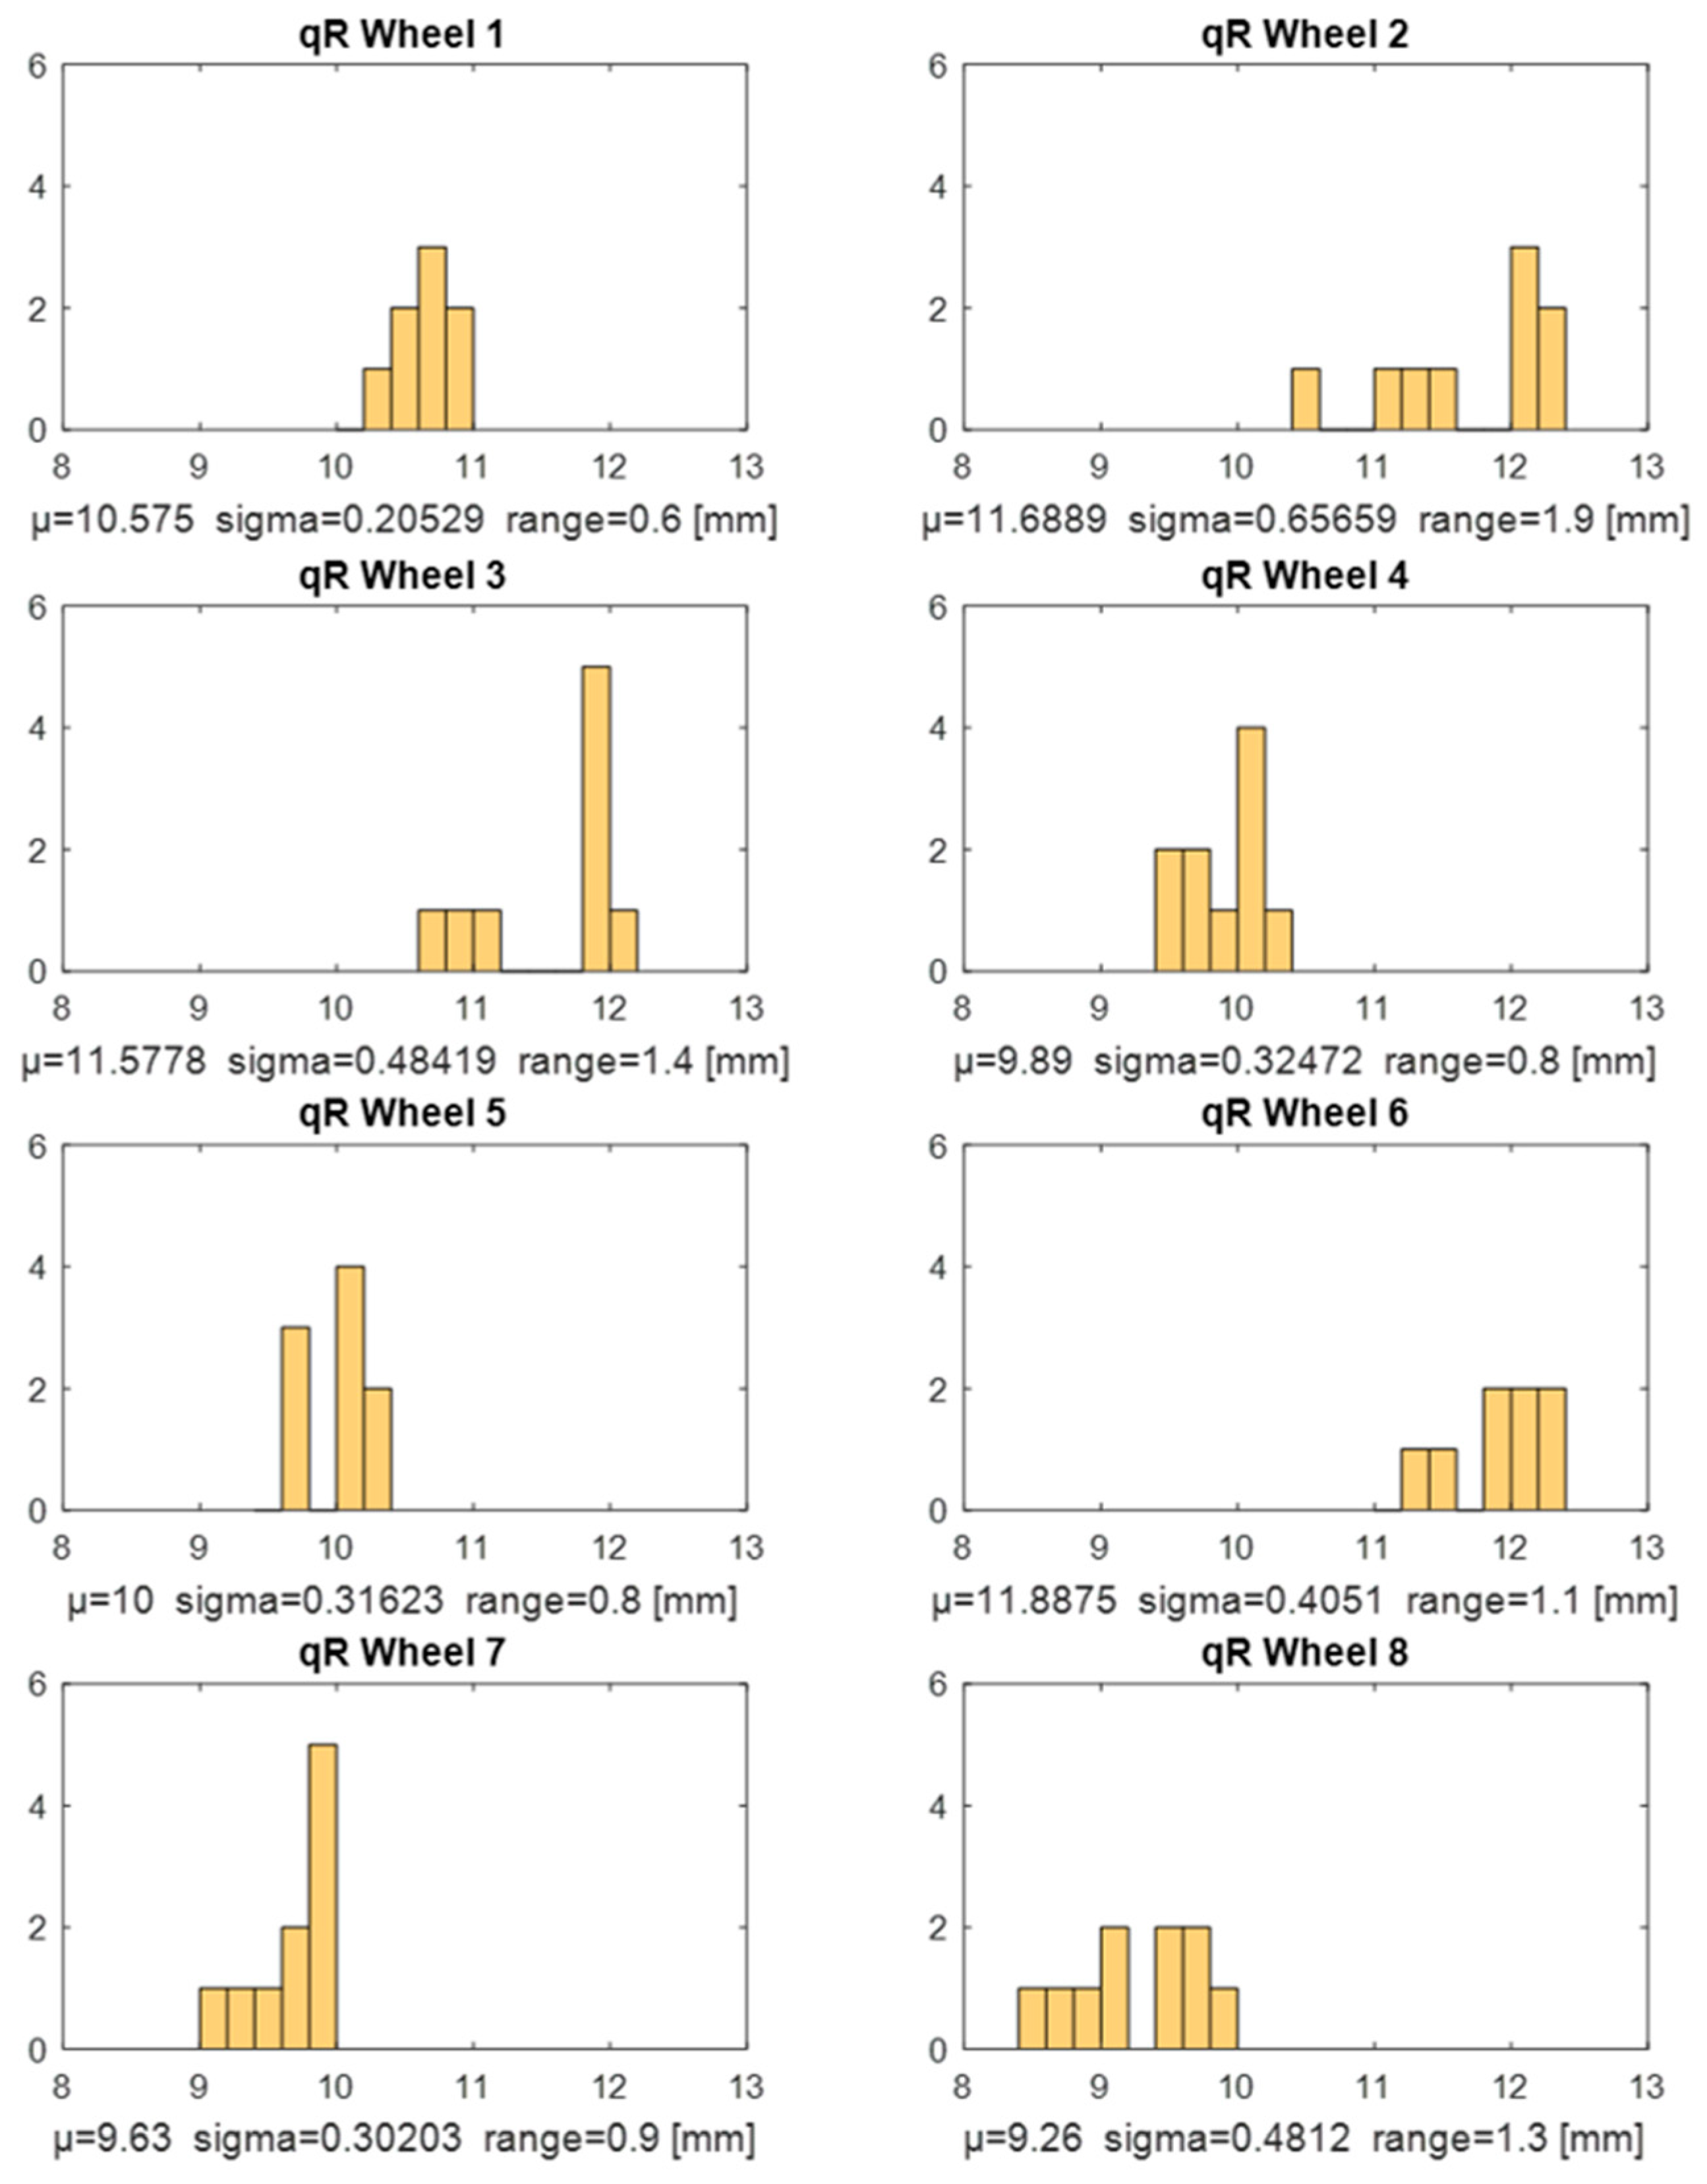
Figure 8 depicts the histogram plot of the flange slope measured for eight different wheels. The highest mean value for the flange slope was observed for wheel 6 with a value of 11.887 mm. The largest standard deviation around the mean value (0.656 mm) and the largest range (1.9 mm) for the estimated flange slope was found to be for wheel 2. The average standard deviation across all wheels for the estimated flange slope was 0.397 mm and the average range for the same was 1.1 mm. The average standard deviation of flange slope estimated using the wayside measurements was around six times higher than when using the handheld equipment and the average range was over four times for the same.
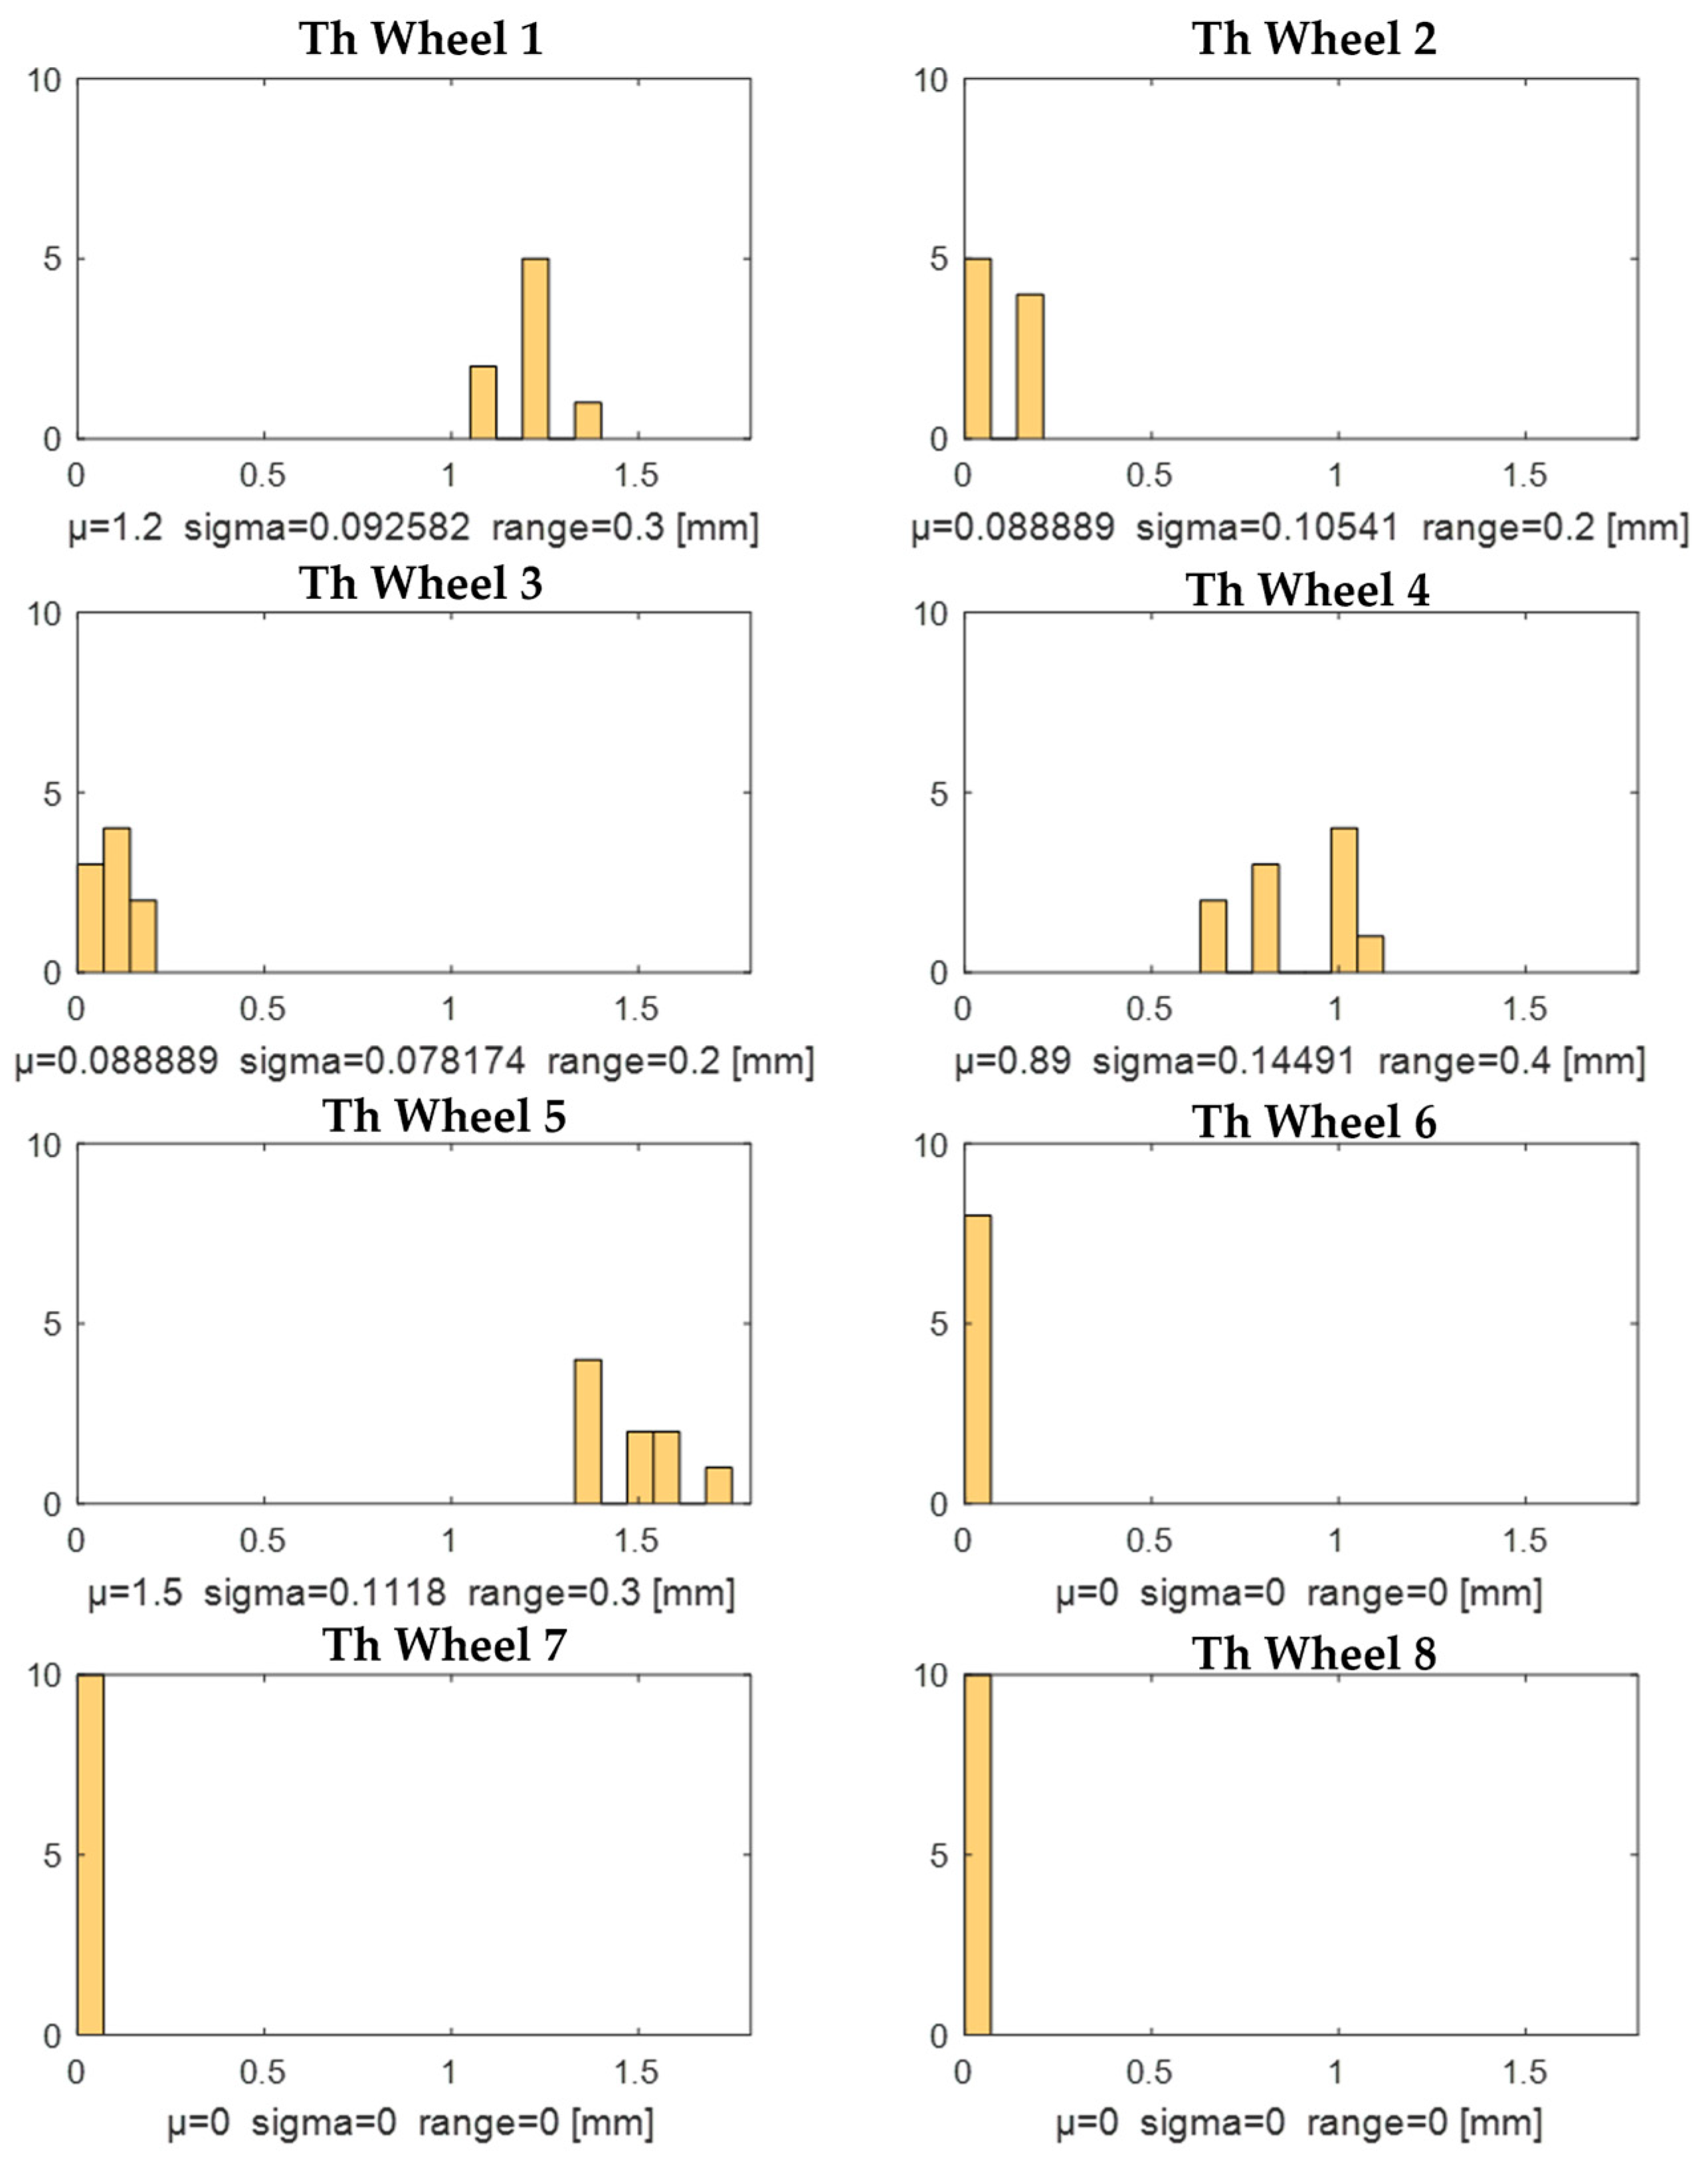
Figure 9 depicts the histogram plot of the tread hollow measured for eight different wheels. Wheels 6, 7, and 8 did not have any hollow wear recorded from over eight or more measurements for each wheel. For wheels 1 to 5, the highest mean value for the tread hollow was observed for wheel 5, with a value of 1.5 mm. The largest standard deviation around the mean value (0.145 mm) and the largest range (0.4 mm) for the estimated flange slope was found to be for wheel 4. The average standard deviation across the five wheels that exhibited hollow wear was 0.106 mm, and the average range for the same was 0.28 mm. The average standard deviation of hollow wear estimated using the wayside measurements was around one and half times higher than when using the handheld equipment, and the average range was similar for both cases.

5. Conclusions

Rail wheels are crucial components in the railway infrastructure that need to be periodically monitored to ensure safe and reliable operation. The goal of this study was to investigate the representability of a one-slice measurement strategy for railway wheel profiles with respect to wheel profile parameters. Four wheel parameters were estimated on the basis of the measurements recorded: flange height (Sh), flange width (Sd), flange slope (qR), and tread hollow (Th). There were variations in all the estimated parameters for different positions measured within the same wheel, indicating the spread of wheel profile parameters along the circumference of the wheel. In order to exclude the dependency of the measurement operator, the results of the two operators were compared and the difference between the operator dependency was low compared to the studied effect of the position along the circumference. As an initial validation of the results, measurements from a wayside monitoring system were investigated in order to see if a similar spread was visible for multiple measurements.
On comparing the calculated range of standard deviation of the parameters estimated from measurements using handheld equipment to the same parameters measured by wayside measurement equipment, it can be concluded that the wayside measurements show a larger spread along the circumference of the wheel. A similar spread from both the measurements was observed only for the hollow-wear parameter. Based on the wheels analysed in this study, the one-slice measurement strategy of a wayside wheel profile measurement system may not be adequate to estimate the wheel profile parameters for condition monitoring purposes. Multiple measurements are required to represent the parameters along the circumference of the wheel for reliable condition monitoring of the wheels. Future studies will investigate the one-slice measurement strategy from the wayside measurement system to estimate high-level parameters such as the equivalent conicity of the wheel. This study was carried out only on wheels of a particular wagon type (iron ore wagon); future studies will focus also on wheels of other wagon types including high-speed and passenger trains. In addition, the future studies will examine the evolution of the spread in wheel profile parameters with respect to wheel age.

Author Contributions

Conceptualization, M.R., P.C., F.T. and J.O.; methodology, M.R., P.C., F.T., U.K. and J.O.; software, M.R., P.C., F.T., C.G. and M.A.; validation, M.R., P.C., F.T. and J.O.; formal analysis, M.R., P.C., F.T. and J.O.; investigation, M.R., C.G., M.A., P.C. and F.T.; resources, M.R., M.A., U.K. and J.O.; data curation, M.R., P.C., F.T., C.G. and M.A.; writing—original draft preparation, P.C., M.R. and F.T.; writing—review and editing, M.R., P.C., F.T. and J.O.; visualization, M.R., P.C. and F.T.; supervision, M.R., U.K. and J.O. All authors have read and agreed to the published version of the manuscript.

Funding

This study was supported and funded by the Luleå Railway Research Centre (JVTC) and Trafikverket (Swedish Transport Administration). The study has been carried out within the strategic innovation program InfraSweden2030, supported by Vinnova, Formas, and Energimyndigheten, and the Shift2Rail project IN2SMART.

Institutional Review Board Statement

Not applicable.

Informed Consent Statement

Not applicable.

Data Availability Statement

The data presented in this study are available on request from the corresponding author.

Conflicts of Interest

The authors declare no conflict of interest.

References

  1. European Commission. Roadmap to a Single European Transport Area: Towards a Competitive and Resource Efficient Transport System: White Paper; European Commission: Brussels, Belgium, 2011. [Google Scholar]
  2. European Commission. Transport in the European Union: Current Trends and Issues; Directorate-General for Mobility and Transport (DG MOVE) Mobility and Transport March 2019; European Commission: Brussels, Belgium, 2018. [Google Scholar]
  3. Trafikverket. The Swedish Transport Administration Annual Report; Swedish Transport Administration: Borlänge, Sweden, 2016. [Google Scholar]
  4. Asplund, M. Wayside Condition Monitoring System for Railway Wheel Profiles. Ph.D. Thesis, Luleå University of Technology, Lulea, Sweden, 2016. [Google Scholar]
  5. Söderholm, P.; Norrbin, P. Risk-based dependability approach to maintenance performance measurement. J. Qual. Maint. Eng. 2013, 19, 316–329. [Google Scholar] [CrossRef]
  6. Asplund, M.; Rantatalo, M. Evaluation of wheel profile measurements by means of the contact-point function for the wheel–rail interface. Proc. Inst. Mech. Eng. Part F J. Rail Rapid Transit 2017, 232, 1225–1239. [Google Scholar] [CrossRef]
  7. Lewis, R.; Olofsson, U. Wheel-Rail Interface Handbook; Elsevier: Amsterdam, The Netherlands, 2009. [Google Scholar]
  8. Chandran, P. Train Based Automated Inspection for Railway Fastening System. Ph.D. Thesis, Luleå University of Technology, Lulea, Sweden, 2022. [Google Scholar]
  9. Ward, C.P.; Goodall, R.M.; Dixon, R. Wheel-rail profile condition monitoring. In Proceedings of the UKACC International Conference on Control 2010, Coventry, UK, 7–10 September 2010. [Google Scholar]
  10. Chen, Y.; Li, Y.; Niu, G.; Zuo, M. Offline and Online Measurement of the Geometries of Train Wheelsets: A Review. IEEE Trans. Instrum. Meas. 2022, 71, 1–15. [Google Scholar] [CrossRef]
  11. Nielsen, J.; Johansson, A. Out-of-round railway wheels—A literature survey. Proc. Inst. Mech. Eng. Part F J. Rail Rapid Transit 2000, 214, 79–91. [Google Scholar] [CrossRef]
  12. Peng, J.; Gao, X.; Zhang, Y.; Wang, Z.; Peng, C.; Tan, Y.; Yang, K.; Zhao, B. An ultrasonic technology study for subsurface defect in railway wheel tread. In Proceedings of the 11th European Conference on Non-Destructive Testing (ECNDT), Prague, Czech Republic, 6–10 October 2014. [Google Scholar]
  13. Asplund, M.; Palo, M.; Famurewa, S.M.; Rantatalo, M. A study of railway wheel profile parameters used as indicators of an increased risk of wheel defects. Proc. Inst. Mech. Eng. Part F J. Rail Rapid Transit 2014, 230, 323–334. [Google Scholar] [CrossRef]
  14. Polach, O. Wheel profile design for target conicity and wide tread wear spreading. Wear 2011, 271, 195–202. [Google Scholar] [CrossRef]
  15. Chandran, P.; Thierry, F.; Odelius, J.; Famurewa, S.M.; Lind, H.; Rantatalo, M. Supervised machine learning approach for detecting missing clamps in rail fastening system from differential eddy current measurements. Appl. Sci. 2021, 11, 4018. [Google Scholar] [CrossRef]
  16. Chandran, P.; Thiery, F.; Odelius, J.; Lind, H.; Rantatalo, M. Unsupervised Machine Learning for Missing Clamp Detection from an In-Service Train Using Differential Eddy Current Sensor. Sustainability 2022, 14, 1035. [Google Scholar] [CrossRef]
  17. Palo, M.; Schunnesson, H.; Kumar, U.; Larsson-Kråik, P.-O.; Galar, D. Rolling stock condition monitoring using wheel/rail forces. Insight Non-Destr. Test. Cond. Monit. 2012, 54, 451–455. [Google Scholar] [CrossRef]
  18. Lin, J.; Asplund, M.; Parida, A. Reliability analysis for degradation of locomotive wheels using parametric bayesian approach. Qual. Reliab. Eng. Int. 2013, 30, 657–667. [Google Scholar] [CrossRef]
  19. Alemi, A.; Corman, F.; Lodewijks, G. Condition monitoring approaches for the detection of railway wheel defects. Proc. Inst. Mech. Eng. Part F J. Rail Rapid Transit 2016, 231, 961–981. [Google Scholar] [CrossRef]
  20. Pau, M. Ultrasonic waves for effective assessment of wheel-rail contact anomalies. Proc. Inst. Mech. Eng. Part F J. Rail Rapid Transit 2005, 219, 79–90. [Google Scholar] [CrossRef]
  21. Pohl, R.; Erhard, A.; Montag, H.-J.; Thomas, H.-M.; Wüstenberg, H. NDT techniques for railroad wheel and gauge corner inspection. NDT E Int. 2004, 37, 89–94. [Google Scholar] [CrossRef]
  22. Verkhoglyad, A.G.; Kuropyatnik, I.N.; Bazovkin, V.M.; Kuryshev, G.L. Infrared diagnostics of cracks in railway carriage wheels. Russ. J. Nondestruct. Test. 2008, 44, 664–668. [Google Scholar] [CrossRef]
  23. Kwon, S.J.; Seo, J.W.; Lee, D.H.; You, W.J. Detection of sub-surface crack in railway wheel using a new sensing system. In Proceedings of the Nondestructive Characterization for Composite Materials, Aerospace Engineering, Civil Infrastructure, and Homeland Security 2011, San Diego, CA, USA, 7–10 March 2011. [Google Scholar]
  24. Żurek, Z.H. Magnetic monitoring of the fatigue process of the rim material of railway wheel sets. NDT E Int. 2006, 39, 675–679. [Google Scholar] [CrossRef]
  25. Hwang, J.; Lee, J.; Kwon, S. The application of a differential-type Hall sensors array to the nondestructive testing of express train wheels. NDT E Int. 2009, 42, 34–41. [Google Scholar] [CrossRef]
  26. Frankenstein, B.; Hentschel, D.; Pridoehl, E.; Schubert, F. Hollow shaft integrated health monitoring system for railroad wheels. In Proceedings of the Advanced Sensor Technologies for Nondestructive Evaluation and Structural Health Monitoring, San Diego, CA, USA, 8–10 March 2005. [Google Scholar]
  27. Liang, B.; Iwnicki, S.; Zhao, Y.; Crosbee, D. Railway wheel-flat and rail surface defect modelling and analysis by time–frequency techniques. Veh. Syst. Dyn. 2013, 51, 1403–1421. [Google Scholar] [CrossRef]
  28. Dwyer-Joyce, R.S.; Yao, C.; Lewis, R.; Brunskill, H. An ultrasonic sensor for monitoring wheel flange/rail gauge corner contact. Proc. Inst. Mech. Eng. Part F J. Rail Rapid Transit 2013, 227, 188–195. [Google Scholar] [CrossRef]
  29. Liang, B.; Iwnicki, S.; Ball, A.E.; Young, A. Adaptive noise cancelling and time–frequency techniques for rail surface defect detection. Mech. Syst. Signal Process. 2014, 54–55, 41–51. [Google Scholar] [CrossRef]
  30. Jia, S.; Dhanasekar, M. Detection of rail wheel flats using wavelet approaches. Struct. Health Monit. 2007, 6, 121–131. [Google Scholar] [CrossRef]
  31. Matsumoto, A.; Sato, Y.; Ohno, H.; Tomeoka, M.; Matsumoto, K.; Kurihara, J.; Ogino, T.; Tanimoto, M.; Kishimoto, Y.; Sato, Y.; et al. A new measuring method of wheel–rail contact forces and related considerations. Wear 2008, 265, 1518–1525. [Google Scholar] [CrossRef]
  32. Matsumoto, A.; Sato, Y.; Ohno, H.; Shimizu, M.; Kurihara, J.; Saitou, T.; Michitsuji, Y.; Matsui, R.; Tanimoto, M.; Mizuno, M.-A. Actual states of wheel/rail contact forces and friction on sharp curves—Continuous monitoring from in-service trains and numerical simulations. Wear 2014, 314, 189–197. [Google Scholar] [CrossRef]
  33. Stratman, B.; Liu, Y.; Mahadevan, S. Structural health monitoring of railroad wheels using wheel impact load detectors. J. Fail. Anal. Prev. 2007, 7, 218–225. [Google Scholar] [CrossRef]
  34. Johansson, A.; Nielsen, J. Out-of-round railway wheels—Wheel-rail contact forces and track response derived from field tests and numerical simulations. Proc. Inst. Mech. Eng. Part F J. Rail Rapid Transit 2003, 217, 135–146. [Google Scholar] [CrossRef]
  35. Wei, C.; Xin, Q.; Chung, W.H.; Liu, S.-Y.; Tam, H.-Y.; Ho, S.L. Real-time train wheel condition monitoring by fiber Bragg grating sensors. Int. J. Distrib. Sens. Netw. 2011, 8, 409048. [Google Scholar] [CrossRef]
  36. Filograno, M.L.; Corredera, P.; Gonzalez-Herraez, M.; Rodríguez-Plaza, M.; Andrés-Alguacil, A. Wheel flat detection in high-speed railway systems using fiber Bragg gratings. IEEE Sens. J. 2013, 13, 4808–4816. [Google Scholar] [CrossRef]
  37. Brizuela, J.; Fritsch, C.; Ibáñez, A. Railway wheel-flat detection and measurement by ultrasound. Transp. Res. Part C Emerg. Technol. 2011, 19, 975–984. [Google Scholar] [CrossRef]
  38. Salzburger, H.J.; Schuppmann, M.; Li, W.; Xiaorong, G. In-motion ultrasonic testing of the tread of high-speed railway wheels using the inspection system AUROPA III. Insight Non-Destr. Test. Cond. Monit. 2009, 51, 370–372. [Google Scholar] [CrossRef]
  39. Belotti, V.; Crenna, F.; Michelini, R.C.; Rossi, G.B. Wheel-flat diagnostic tool via wavelet transform. Mech. Syst. Signal Process. 2006, 20, 1953–1966. [Google Scholar] [CrossRef]
  40. Lee, M.L.; Chiu, W.K. Determination of railway vertical wheel impact magnitudes: Field trials. Struct. Health Monit. 2007, 6, 49–65. [Google Scholar] [CrossRef]
  41. Thakkar, N.; Steel, J.A.; Reuben, R.; Knabe, G.; Dixon, D.; Shanks, R. Monitoring of Rail-Wheel Interaction Using Acoustic Emission (AE). Adv. Mater. Res. 2006, 13–14, 161–168. [Google Scholar] [CrossRef]
  42. Kenderian, S.; Djordjevic, B.B.; Cerniglia, D.; Garcia, G. Dynamic railroad inspection using the laser-air hybrid ultrasonic technique. Insight Non-Destr. Test. Cond. Monit. 2006, 48, 336–341. [Google Scholar] [CrossRef]
  43. Frohling, R.D. Analysis of asymmetric wheel profile wear and its consequences. Veh. Syst. Dyn. 2006, 44, 590–600. [Google Scholar] [CrossRef]
  44. Al-Refaie, A.; Bata, N. Evaluating measurement and process capabilities by GR&R with four quality measures. Measurement 2010, 43, 842–851. [Google Scholar] [CrossRef]
  45. SS-EN 15313; Railway Applications-In-Service Wheelset Operation Requirements-In-Service and Off-Vehicle Wheelset Maintenance. European Committee for Standardization: Brussels, Belgium, 2010.
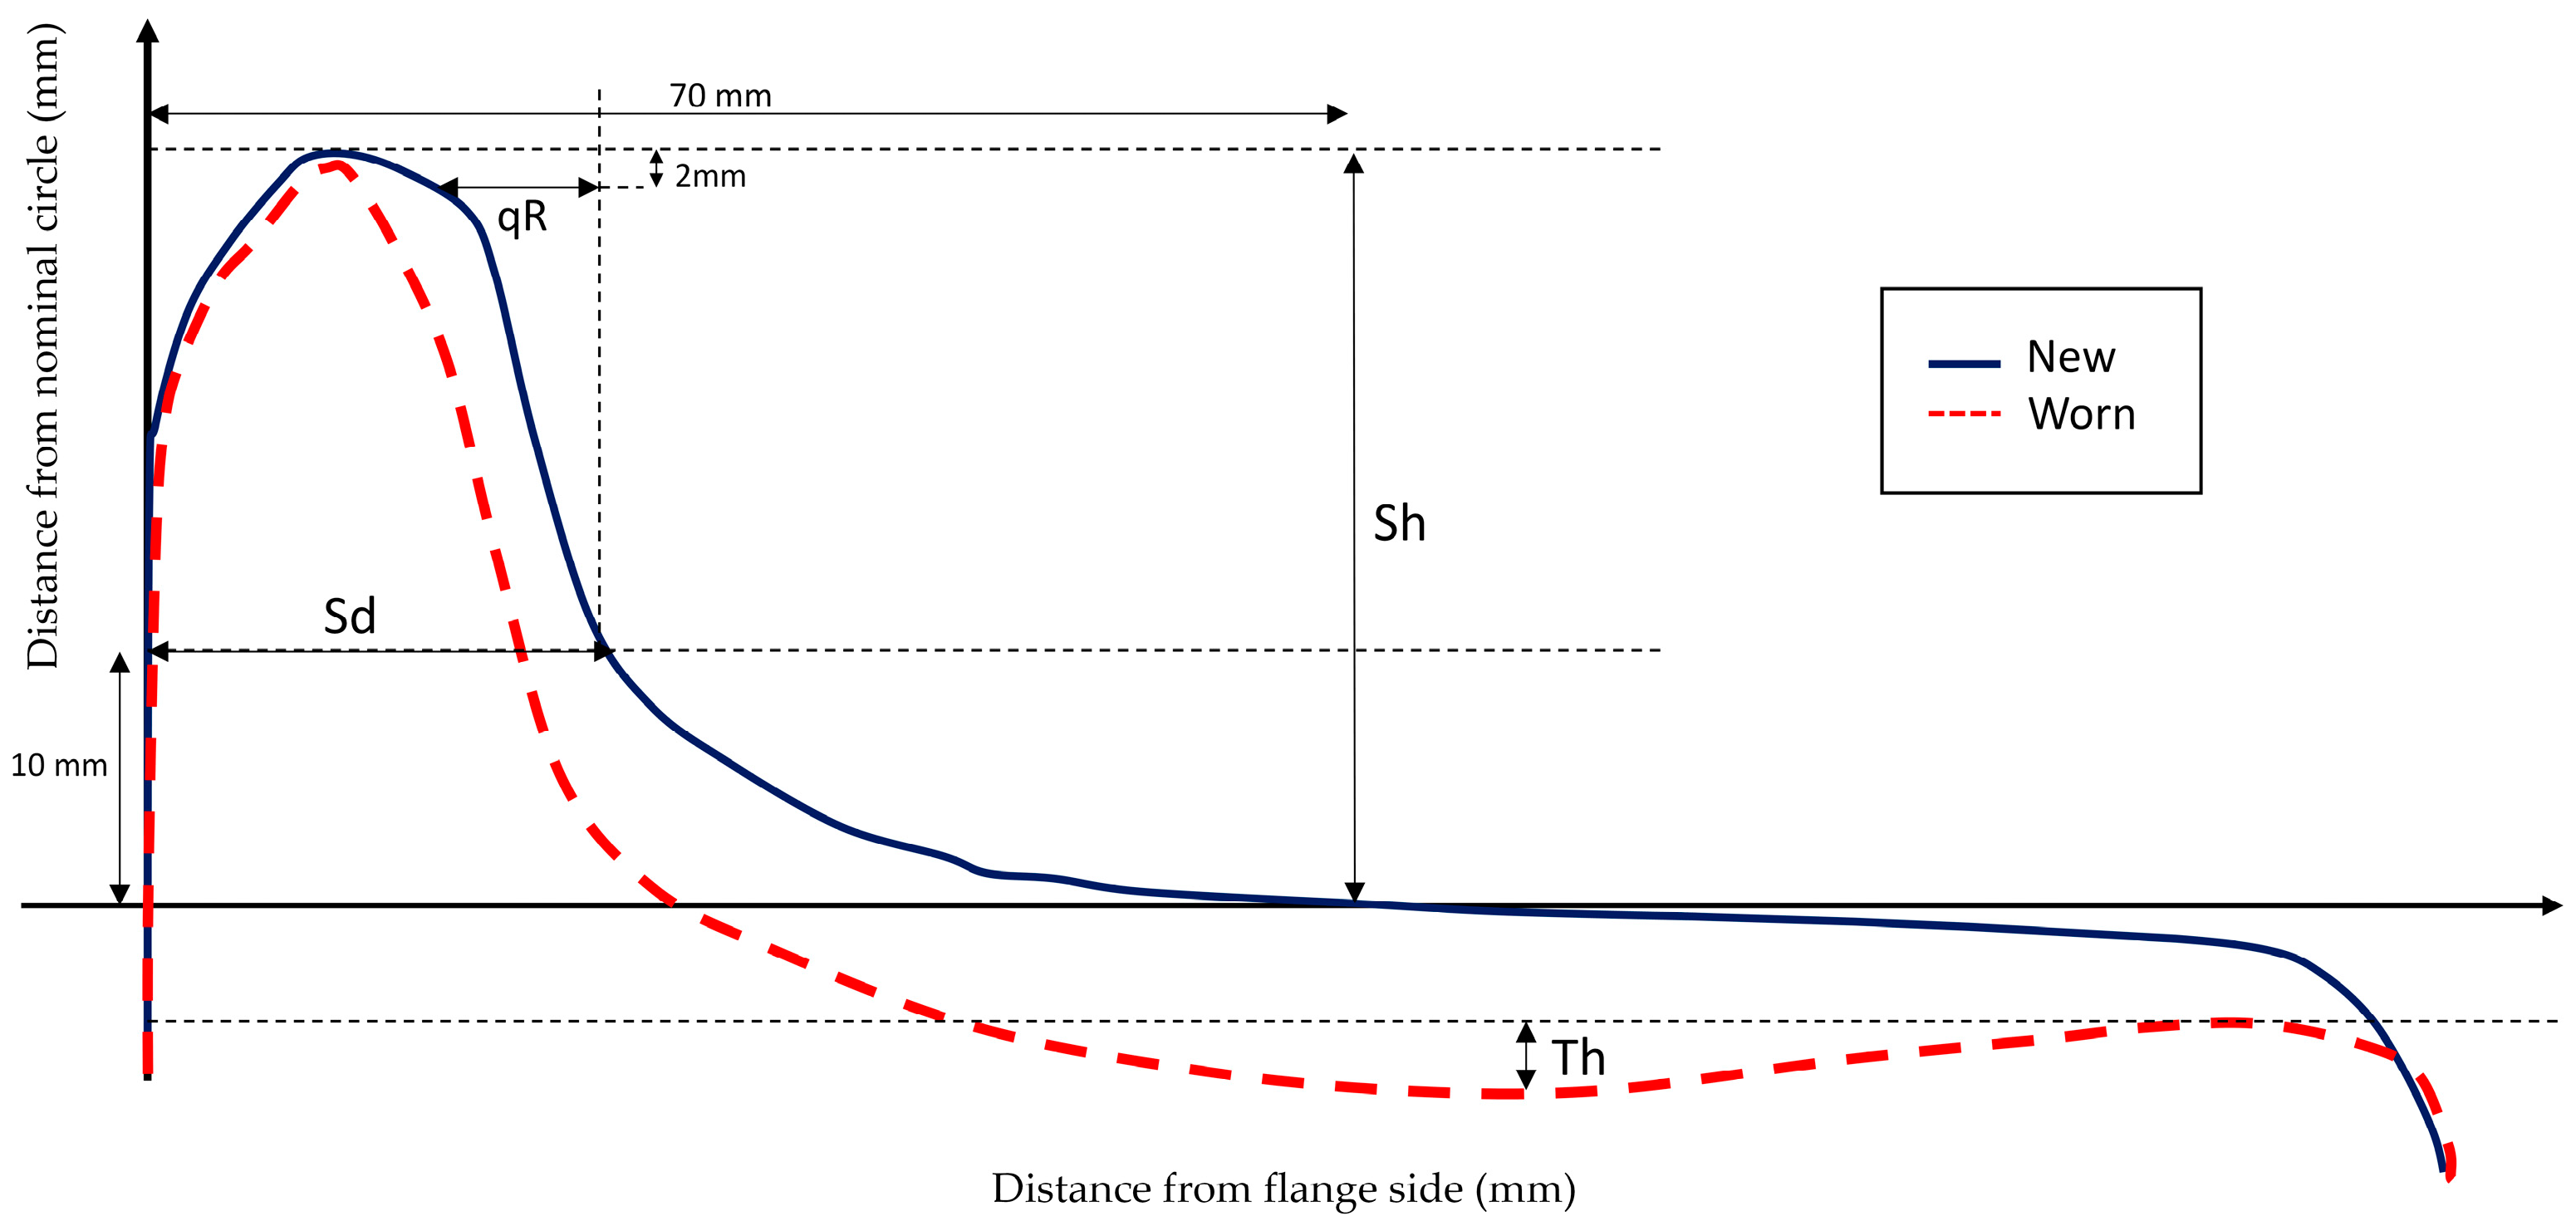
Figure 1. Original and worn wheel profiles, with the wheel profile parameters. qR: flange slope; Sd: flange width; Sh: flange height; Th: tread hollowing.
Applsci 13 05382 g001
Figure 2. Wheel profiles plotted along the circumference of the wheel using the different measurement positions for the wheel id HP6448.
Applsci 13 05382 g002
Figure 3. The automatic wheel profile measurement system with its two units located in the southern part of the Iron Ore Line in Sweden.
Applsci 13 05382 g003
Figure 4. Wheel profile plots of 35 measurements for wheel HP6448.
Applsci 13 05382 g004
Figure 5. Box plot for the four parameters for different wheels measured using the handheld equipment: (a) flange height, (b) flange width, (c) flange slope, (d) hollow wear. The X-axis for all four plots shows the wheel ID for the studied wheel.
Applsci 13 05382 g005
Figure 6. Histogram of flange height (Sh) for eight different wheels measured by the wayside wheel profile measurement system. X-axis represents the flange height in mm and Y-axis represents the number of measurements recorded. The mean, standard deviation, and range of the measurements for each wheel are described below the plot.
Applsci 13 05382 g006
Figure 7. Histogram of flange width (Sd) for eight different wheels measured by the wayside wheel profile measurement system. X-axis represents the flange width in mm, and Y-axis represents the number of measurements recorded. The mean, standard deviation, and range of the measurements for each wheel are described below the plot.
Applsci 13 05382 g007
Figure 8. Histogram of flange slope (qR) for eight different wheels measured by the wayside wheel profile measurement system. X-axis represents the flange slope in mm, and Y-axis represents the number of measurements recorded. The mean, standard deviation, and range of the measurements for each wheel are described below the plot.
Applsci 13 05382 g008
Figure 9. Histogram of Tread Hollow (Th) for eight different wheels measured by the wayside wheel profile measurement system. X-axis represents the tread hollow in mm, and Y-axis represents the number of measurements recorded. The mean, standard deviation, and range of the measurements for each wheel are described below the plot.
Applsci 13 05382 g009
Table 1. Wheel profiles and their relative age with respect to distance, used for manual measurements.
Wheelset IDAge (km)Measurements
HP8628035
HP9270035
HP8507237,83235
HP7480315,74035
HP6448317,12535
HP9264409,52235
HP9709409,52235
Table 2. Number of wheel profile measurements used for each wheel captured using automatic wheel profile measurement system.
Wheel NumberMeasurements
Wheel 18
Wheel 29
Wheel 39
Wheel 410
Wheel 59
Wheel 69
Wheel 710
Wheel 810
Table 3. Mean values and standard deviations of measured wheel parameters (wheel HP6448) for two different measurement operators.
ParameterOperator 1Operator 2Operator 1 and 2
µ1
(mm)
σ1
(mm)
µ2
(mm)
σ2
(mm)
µ3
(mm)
σ3
(mm)
100 × 3/µ3
Sh35.1220.00299635.0390.00140935.08050.002200.00628
Sd26.3480.00187626.2930.00268126.32050.002280.00866
qR11.1970.00092111.1590.00078911.17800.000860.00765
Th1.1810.0004591.1950.0008451.18800.000650.05488
Table 4. Mean, standard deviation, and range of the calculated wheel parameters for different wheels, measured using the handheld equipment. All measurements are in mm.
Wheel IdMean (mm)Standard Deviation (mm)Range (mm)
ShSdqRThShSdqRThShSdqRTh
HP862828.28327.4869.56400.1140.0910.05900.4400.3300.2800
HP927028.26729.1429.78300.0860.1310.062800.3500.5000.2700
HP850732.75726.0139.9340.4500.0850.1100.0410.0670.3400.5500.1800.350
HP748035.24326.35211.2671.1440.0880.0570.0630.0430.4400.5800.3000.400
HP644833.86730.05212.47900.0940.0930.10400.3900.4000.3600
HP926434.14128.68411.0330.1180.1000.0990.0440.1020.4200.4900.1600.390
HP970936.13826.89312.0652.1480.1210.1210.0920.1050.5100.5300.3800.590
Disclaimer/Publisher’s Note: The statements, opinions and data contained in all publications are solely those of the individual author(s) and contributor(s) and not of MDPI and/or the editor(s). MDPI and/or the editor(s) disclaim responsibility for any injury to people or property resulting from any ideas, methods, instructions or products referred to in the content.