1. Introduction
Slope erosion is the result of an interactive process between slope water flow and soil, leading to erosion, transportation, and removal of soil from the slope surface under the influence of water. This phenomenon results in soil fertility decline, soil erosion, and slope damage. Numerous studies have demonstrated that the hydraulic characteristics of slopes are the primary factors that influence slope erosion [
1] with rainfall intensity and slope gradient being the most crucial [
2,
3]. Changes in these factors can significantly alter slope runoff affecting sediment transport capacity and erosion rate [
4,
5]. Additionally, the effect of slope runoff on erosion varies depending on soil type. Therefore, understanding the hydraulic characteristics of slope erosion is crucial for preventing and managing slope erosion.
To better understand the hydraulic characteristics of slope runoff, scholars have utilized indoor rainfall simulation tests to investigate the mechanisms [
6] of slope erosion by varying rainfall intensity and slope gradient [
7,
8]. Extensive research has indicated a positive correlation between slope runoff velocity and both rainfall intensity and slope gradient [
9,
10]. As rainfall intensity increases, the water content in slope runoff also increases, while an increase in slope gradient accelerates the runoff’s speed under gravity, leading to heightened impact and erosion on the soil surface. Dong et al. [
11] studied the soil accumulation on highway slopes and found that sediment yield increases with increasing rainfall intensity. Niu et al. [
12] conducted indoor experiments on different slope ratios and initial seepage fields under rainfall infiltration to investigate the failure mechanism and pattern of fly ash dam slopes under rainfall influence. Yan et al. [
13] conducted simulated rainfall experiments under various typical underlying surface conditions to study the runoff characteristics and mechanisms under different rainfall intensities and durations. In addition, researchers have also studied thin-layer water flow on slopes [
14,
15,
16]. Yang et al. [
17] conducted artificial rainfall simulation experiments under varying slope gradients and rainfall intensities to determine the velocity law of thin-layer water flow. Various hydraulic parameters, including Reynolds number, Froude number, Manning coefficient, and hydraulic power, have been applied to slope erosion research [
18,
19]. Yuan et al. [
20] studied the soil erosion and hydraulic characteristics of the loess slope in Beijing and found that mean flow velocity is the most closely related hydraulic parameter to sediment concentration in runoff.
Slope erosion, a vital aspect of soil erosion, has garnered significant attention in China. Nevertheless, the patterns of erosion differ considerably among various soil types. Presently, research on slope erosion of diverse soil types focuses mainly on the Northwest loess region [
21,
22] and southern red soil region [
23,
24]. In the loess region, the loose soil texture and high porosity render it vulnerable to wind and water erosion [
25,
26], leading to severe slope erosion. Zhao et al. [
27] calculated the slope, aspect, and channel network of loess slopes in different evolution stages and analyzed the relationship between variation characteristics and erosion and evolution processes of the slopes. In the southern red soil region, the red soil in the Jiangnan hilly area and Nanling Mountains are the primary research objects [
28,
29]. Red soil is characterized by high fertility, loose structure, and sensitivity to erosion [
30,
31], making it susceptible to rainfall erosion. Feng et al. [
32] studied the impacts of rainfall intensity, slope gradient, and surface cover on the erosion process of granite red soil slopes and concluded that the impact of slope gradient on sediment yield increases with increasing rainfall intensity. However, in granite regions, erosion characteristics and mechanisms vary due to differences in granite weathering degree, resulting in limited applicability of slope management measures [
33,
34,
35].
The northeast of Longling County in Yunnan Province is a distribution area of completely weathered granite and also an operating area of oil and gas pipelines. The oil and gas pipelines pass through the distribution area of completely weathered granite. To lay the pipelines, grooves need to be dug and then the completely weathered granite excavated from the grooves is backfilled. However, the backfill soil containing completely weathered granite has high sand content, low clay content, loose structure, poor physical and mechanical parameters, and low fertility. As a result, the working slope surface is exposed, leading to poor corrosion resistance. Under heavy rainfall conditions, the working slope is prone to erosion by slope runoff, resulting in slope collapse, surface water and soil loss, and other disasters. These problems result in pipeline exposure and suspension, which substantially impact the normal functioning of pipelines. However, traditional management methods have often proved insufficient, emphasizing the urgency of responding to pipeline safety challenges and ensuring the continuous operation of pipelines. It is crucial to conduct focused research on the completely weathered granite area, which involves determining the erosion characteristics and patterns of completely weathered granite slopes at a certain slope gradient and rainfall intensity. In addition, it is necessary to determine the spatiotemporal variation properties of flow velocity and hydraulic laws under different circumstances. This will ultimately provide a theoretical basis for soil erosion management of completely weathered granite slopes.
2. Materials and Methods
2.1. Experimental Design
According to the analysis of rainfall data in the Longling area, three rainfall intensity levels were selected for the experiments: 50, 80, and 110 mm/h (50, 80, and 110 mm/h are the average value of the maximum single-point rainstorm in the past 10 years, the calculated single-point rainstorm value in 10 years and the single-point rainstorm value in 100 years. As well, the rainfall device can be set at a level of 20–240 mm/h). Under each of these three rainfall intensity levels, four slope gradients (10°, 20°, 30°, and 40°) were experimentally evaluated resulting in a total of 12 test configurations. During each experiment, the erosion process of the simulated slope surface was monitored in real-time using a digital pan-tilt camera until the slope was damaged. The soil moisture contents and bulk densities were measured by drying methods before filling. The soil dry densities were controlled between 1.3 and 1.5 g/cm3, and the soil moisture contents were approximately 10% (Near natural state values). The test soil was naturally dried and passed through a 10 mm sieve to remove stones and weeds. The filling thickness was 50 cm, paved, and compacted to reduce the influence of the boundary effect. After the filling was complete, the soil surface was scraped with a wooden board to create a certain surface roughness. The soil bulk density of the slope was measured using the ring knife method to verify that it reached the experimental design level. Each experiment lasted 1 h.
2.2. Test Materials and Devices
The soil used in this experiment was trench backfill soil taken from the completely weathered granite distribution area of the Longling section of the China-Myanmar oil and gas pipeline in Longling County, Baoshan City, Yunnan Province. The sampling time was July 2020.
For simulated rainfall experiments, a down-spraying ZYJY-DZ02 system was used. The rainfall source was 5.0 m, and the rainfall source was pure, non-polluted water. The adjustable-slope steel groove used in the simulated rainfall experiments was 3 m in length, 0.5 m in width, and 0.5 m in height. A V-shaped collecting port was placed at the tail of the soil bin to collect runoff and sediment samples generated by the simulated rainfall. The rainfall intensity could be controlled within the range of 20–270 mm/h using a switch in the control room, and the rainfall uniformity remained above 85%. The rainfall amount and duration could be controlled using a combination of the pressure pump and nozzle. Thus, the experimental rainfall system met the requirements for our experiments. The test device is shown in
Figure 1.
2.3. Test Procedure
The experiments were conducted in the Soil and Water Conservation Laboratory of Kunming University of Science and Technology from August to October 2020. After the rain begins, the initial runoff time of each test was recorded, and the erosion process was observed. Each rainfall event lasted 60 min, The flow rate was measured every 3 min and a 1 L container was used to collect runoff sediment samples every 2 min (for a total of 30 samples in each test). After the slope flow became stable, a tracer method based on red ink was used to measure the slope runoff velocity. The entire test process was recorded using a high-speed camera, and the flow velocity was calculated from the recorded images. Measurements of flow velocity should consider different slope sections. The 3 m soil trough was measured from the top of the slope to the foot of the slope at 0.5–1.5 m and 1.5–2.5 m from the top of the slope. After the rainfall test, the volume of the sample in the container was measured. After the sample was allowed to stand for 24 h to settle, the supernatant was poured off, and all the sediment in the container was transferred to a disposable paper cup for drying to determine the dry weight of the sediment.
2.4. Test Data Analysis
The hydrodynamic parameters of the slope runoff were determined as follows.
- (1)
The runoff yield rate
N (mL/s) was calculated as
where
q is the runoff (mL) in a single simulated rainfall event, and
t is the single sampling time (s).
- (2)
The sediment yield rate
M (g/s) was calculated as
where
M′ is the sediment yield in a single sampling time (g), and
t is the single sampling time (min).
- (3)
The Reynolds number
Re was calculated as
where
v is the flow rate (m/s),
R is the hydraulic radius (m), and
µ is the viscosity coefficient of water flow (Based on the field test, the water temperature is 16–18 °C,
µ = 1.061–1.115).
- (4)
The Froude number
Fr was calculated as
where
g is the acceleration due to gravity (m/s
2) (Based on the test site,
g = 9.79), and
h is the water depth (m).
- (5)
The resistance coefficient
f was calculated as
where
g is the acceleration due to gravity (m/s
2),
h is the water depth (m), and
J is the hydraulic break (
J =
sinβ, where
β is the slope gradient).
- (6)
The Manning coefficient
n was calculated as
where
R is the hydraulic radius (m),
S is the slope gradient (radians), and
V is the average velocity (m/s).
3. Results and Analysis
This section may be divided into subheadings. It should provide a concise and precise description of the experimental results, their interpretation, as well as the experimental conclusions that can be drawn.
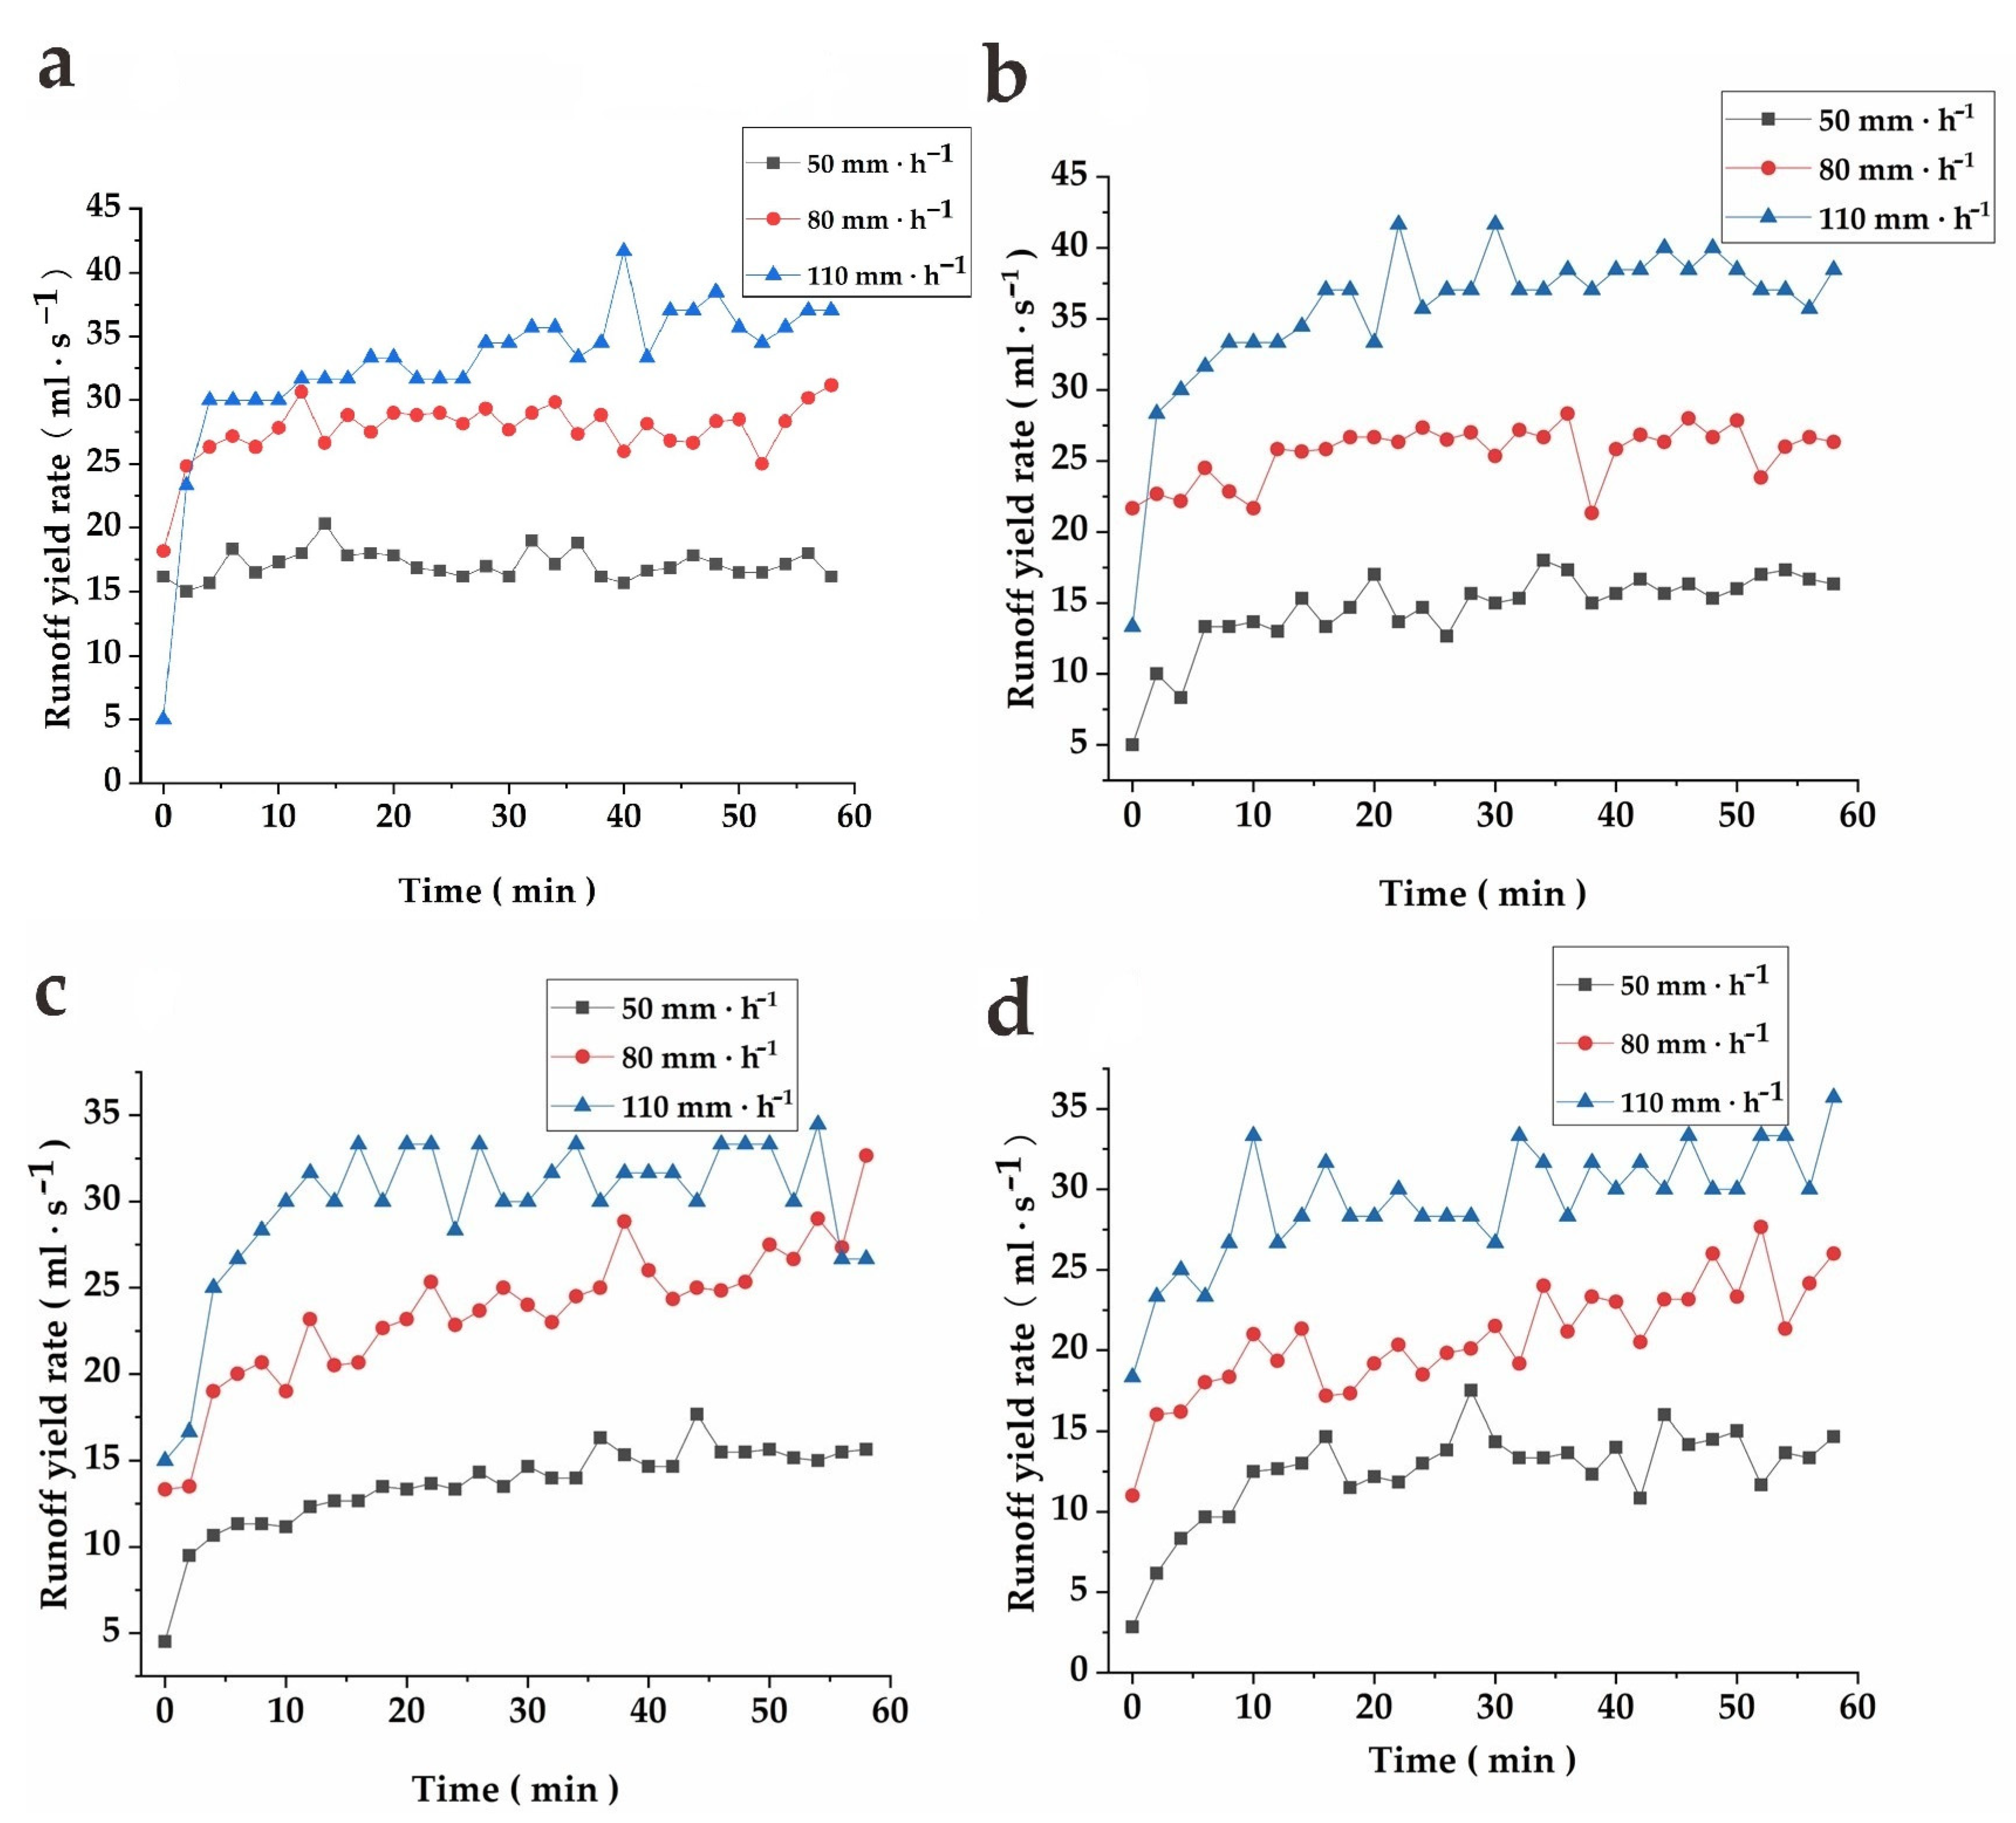
3.1. Process of Runoff Formation
As shown in
Figure 2, a higher intensity of precipitation results in a more pronounced surge in the runoff rate. Taking a slope gradient of 10° as an instance, the peak runoff rates achieve at precipitation intensities of 50, 80, and 110 mm/h are 16.3, 31.2, and 38.5 mL/s, respectively, with corresponding average runoff rates of 13.6, 27.7, and 32.7 mL/s. Notably, the augmentation of both peak and average runoff rates is substantial when the precipitation intensity increases from 50 to 80 mm/h. However, this enhancement is not linear, and the peak runoff rate experiences only a 23% surge, while the average runoff rate increases by less than 20% as the precipitation intensity elevates from 80 to 110 mm/h.
It is also worth mentioning that, for a fixed precipitation intensity, the impact of slope gradient on the runoff rate is relatively minor. Specifically, when the precipitation intensity is 110 mm/h, the average runoff rate undergoes a modest 19% escalation as the slope gradient rises from 20° to 30°. Subsequently, as the slope gradient increases from 30° to 40°, the minimum increase in average runoff rate (8%) is observed. Consequently, it can be inferred that the rise in runoff rate with increasing slope gradient diminishes substantially once the slope gradient exceeds 30°.
For a given slope gradient, the runoff rates associated with distinct rainfall intensities exhibit a descending order of 110 mm/h > 80 mm/h > 50 mm/h. Specifically, the runoff rate initially rises as rainfall intensity grows, followed by a stabilization of the runoff rate. This phenomenon is attributed to the low soil water content during the initial rainfall stage, leading to the transformation of rainfall into seepage. As the soil water content gradually increases, the slope water content approaches saturation, and the rainfall is converted into slope runoff.
Compared to the slope gradient, rainfall intensity has a more significant effect on the runoff rate. Specifically, the escalation of rainfall intensity leads to an augmented amount of precipitation on the slope, leading to a corresponding increase in the runoff volume. In contrast, a rise in the slope gradient alters the slope’s shape, resulting in greater downward acceleration and flow velocity of the water traveling down the slope.
3.2. Sediment Production Process
As shown in
Figure 3, an evident rise in the sediment yield rate occurs with an increase in the rainfall intensity for the same slope gradient. For instance, at a slope gradient of 40°, the peak sediment yield rates attained at rainfall intensities of 50, 80, and 110 mm/h are 0.81, 1.47, and 3.07 g/s, respectively, with corresponding average sediment yield rates of 0.24, 0.81, and 2.25 g/s, respectively. When the rainfall intensity elevates from 50 to 80 mm/h, the peak sediment yield rate experiences an 81% surge, and the average sediment yield rate increases by 235%. Similarly, when the rainfall intensity grows from 80 to 110 mm/h, the peak sediment yield rate undergoes a 107% rise, and the average sediment yield rate increases by 178%.
Under uniform rainfall intensity, a minor elevation in the slope gradient leads to a slight rise in the sediment yield rate. The most significant increment in peak sediment yield rate with increasing slope is detected under the rainfall intensity of 110 mm/h, with a substantial surge observed as the slope gradient escalates from 30° to 40°. Conversely, the most trivial rise in peak sediment yield rate occurs at the rainfall intensity of 80 mm/h, with only a modest increase detected as the slope gradient increases from 10° to 20°. The maximal increment in the average sediment yield rate transpires when the rainfall intensity is 110 mm/h, with a notable rise observed as the slope gradient increases. When the slope gradient increases from 30° to 40°, the average sediment yield rate undergoes a substantial escalation of 269%. In contrast, the most minor augmentation in average sediment yield rate is recorded when the rainfall intensity is 80 mm/h; with only a modest increment of 8% detected as the slope gradient elevates from 10° to 20°. For insignificant slope gradients and rainfall intensities, the effect of slope gradient on sediment yield rate is not apparent. However, as the slope gradient and rainfall intensity increase, the sediment yield rate also rises, with the slightest growth rate observed under the slope gradient of 20° and the rainfall intensity of 80 mm/h. Based on these observations, it can be speculated that a critical point exists at or near these conditions.
Elevating either the rainfall intensity or slope gradient induces an augmentation in sediment yield to a certain extent. Raising the slope gradient diminishes the stability of the slope. Meanwhile, alterations in rainfall intensity modify the intensity and erosive force of slope flow, with augmented runoff leading to heightened sediment yield. The simultaneous effect of increased slope and rainfall intensity accelerates the slope erosion process, giving rise to rills and depressions on the slope surface and collapses in areas with the most severe erosion. Augmentations in both rainfall intensity and slope gradient also abbreviate the time taken to reach the peak sediment yield.
Under the same slope gradient, the sediment yield rate initially rises with the intensifying rainfall intensity, subsequently declines, and ultimately stabilizes. This occurs because as the slope surface experiences erosion, forming rills, the quantity of sediment transported escalates. When the slope morphology is disrupted, a sudden collapse triggers a massive volume of sediment to be carried away by the slope flow, reaching the peak sediment yield rate. Following the initial significant damage, the slope morphology rapidly achieves stability; during this phase, the slope flow is inadequate to inflict secondary damage on the slope, causing the sediment yield rate to diminish and stabilize.
3.3. Spatial and Temporal Differences in Flow Velocity
As shown in
Figure 4, Under the examined slope gradients, the escalation in rainfall intensity leads to substantial growth in flow rate. Using the 40° slope gradient as an example, with rainfall intensities of 50, 80, and 110 mm/h, the mean flow velocities are 0.15, 0.18, and 0.26 m/s, while the peak flow velocities are 0.17, 0.23, and 0.32 m/s, respectively. As the rainfall intensity rises from 50 to 80 mm/h, the average flow velocity experiences a 23% enhancement, and the peak velocity shows a 35% expansion. When the rainfall intensity climbs from 80 to 110 mm/h, the average flow velocity exhibits a 35% increment, and the peak velocity demonstrates a 40% amplification. Hence, the upsurge in rainfall intensity has a notable impact on the flow velocity.
The maximum flow velocity reaches 0.32 m/s, while the minimum flow velocity is a mere 0.09 m/s. The timing of the peak flow velocity does not coincide with the timing of runoff and sediment production. This is due to the formation of rills on the slope during erosion by overland flow, which alters the slope’s shape, rendering it uneven and causing the overland flow to deviate from uniform laminar flow. The impact of rills on overland flow is multifaceted. Runoff within rills can continuously affect their inner walls, making them smoother, thereby diminishing resistance and augmenting flow velocity. Simultaneously, rills may also evolve along the cross-section, raising the height difference between the rill and the original slope, consequently generating a height drop in the slope flow and diminishing the flow velocity.
During simulated rainfall, the flow velocity on the slope exhibits fluctuations with a general upward tendency. The flow velocity demonstrates a significant positive correlation with both slope gradient and rainfall intensity. As the flow velocity escalates, the slope flow intensifies the erosion of the slope, and the continuous erosion of the slope surface by runoff leads to the emergence of rills on the slope surface. Rills predominantly appear in the middle section of the slope, while their presence in the upper and lower sections is scarce. This can be ascribed to the flow velocity and slope strength. The flow velocity in the upper part of the slope is comparatively low, and the volume of runoff is relatively small; as a result, the erosive force is insufficient to erode the slope. The flow velocity in the middle section is relatively high, and the volume of runoff is larger. In this scenario, the erosive force on the slope is relatively significant, culminating in the formation of rills of varying sizes in the middle section of the slope under the action of erosion from runoff. Although the flow velocity in the lower slope section is relatively substantial, the slope strength exceeds that of other sections. Consequently, the volume of runoff in the lower section of the slope is larger than in the upper section but smaller than in the middle section.
3.4. Hydraulic Characteristics of Slope Runoff
As shown in
Table 1,
Re elevates with the intensification of slope gradient and rainfall intensity. The value of
Re yields a result lower than 500; therefore, despite the evident rise in
Re, the flow of the slope runoff remains laminar. The mean value of Fr exceeds 1 signifying rapid overland flow that escalates with the augmentation of slope gradient and rainfall intensity. The resistance coefficient
f diminishes with the amplification of slope gradient and rainfall intensity, which also elucidates why enhancing the slope gradient or rainfall intensity leads to greater slope runoff velocity. The Manning coefficient
n reflects the roughness of the slope surface. The greater the slope gradient, the greater the rainfall intensity, and the erosion of slope runoff, the easier it is to make the slope surface appear depressed and promote the formation of rills. The more complex the slope morphology, the greater the
n.
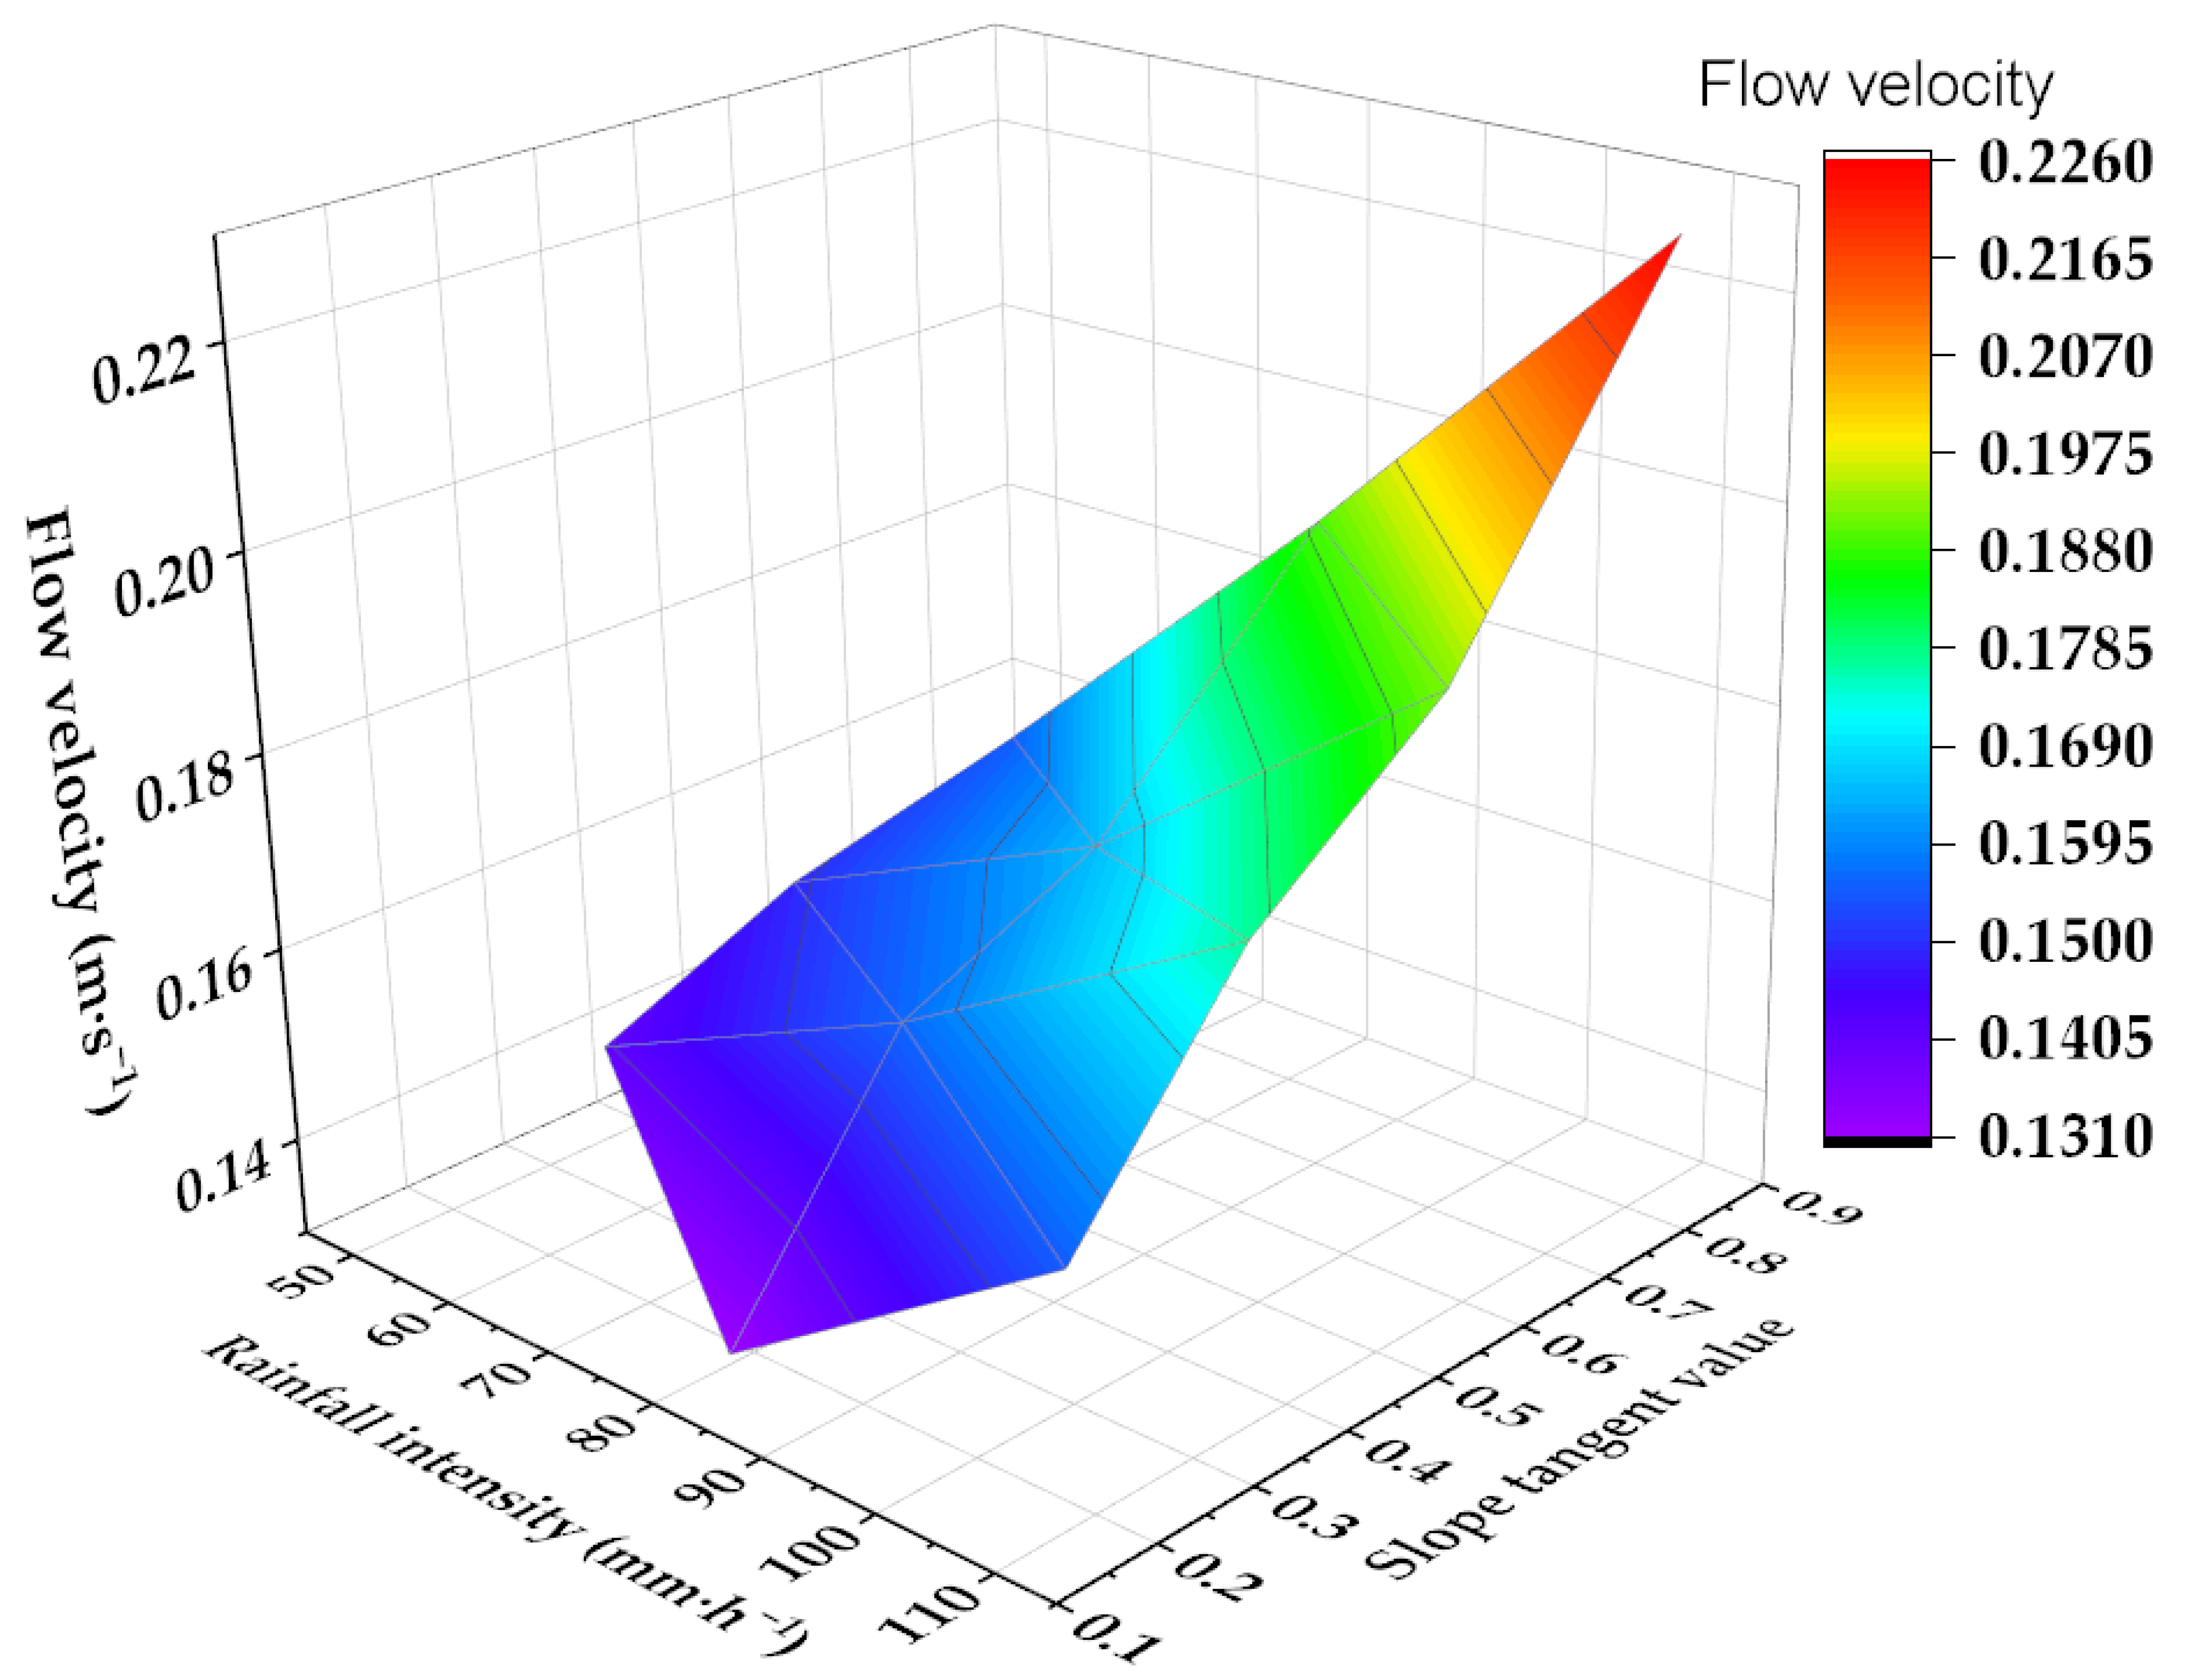
3.5. Slope Flow Velocity, Rainfall Intensity, and Slope Gradient Fitting Equation
An intensification of precipitation strength results in an expansion of surface water flow volume, subsequently accelerating the flow velocity of slope runoff. An increase in slope magnitude signifies a greater inclination of the terrain, which, under the influence of gravitational forces, amplifies the energy of water traversing the slope and further accelerates the flow velocity of slope runoff. The combined action and mutual constraints of these factors ultimately impact the velocity of water flow along the slope. To delve deeper into the impact of rainfall intensity and slope gradient on slope flow velocity, the rainfall intensity and slope gradient tangent values were denoted as X and Y, respectively. A binary fitting analysis of the rainfall intensity and slope gradient tangent value was subsequently conducted. The fitted surface is illustrated in
Figure 5, and the fitting equation is as follows:


