Abstract
Terrestrial vegetation, a critical component of the Earth’s land surface, directly impacts the planet’s material and energy balance. This study investigated the dynamics of terrestrial vegetation in China from 2000 to 2019 using three remote sensing products (NDVI, EVI, and SIF) and explored the driving mechanisms behind these changes. We considered three meteorological factors, nine land use types, and two socio-economic factors while employing mathematical models to analyze the data. Additionally, we used the CA–Markov model to predict the spatial distribution of vegetation remote sensing products for 2020–2025. Our findings indicate the following: (1) Throughout the study period, the vegetation indices, NDVI, EVI, and SIF, all exhibited increasing trends. The SIF showed a more direct response to vegetation cover changes and was less influenced by other driving factors. The SIF outperforms the NDVI and EVI in detecting vegetation trend changes, particularly regarding sensitivity. (2) Vegetation cover changes are driven by multiple meteorological factors, such as temperature, precipitation, and relative humidity. These factors exhibit a strong spatial correlation with the distribution of vegetation remote sensing products. Among these factors, the SIF shows a higher sensitivity to temperature compared to the NDVI and EVI, while the NDVI and EVI display greater sensitivity to precipitation and relative humidity. (3) Within the study area, land use types reveal a gradient from northwest to southeast, which is consistent with the spatial distribution of the vegetation remote sensing products. For green vegetation types, the three remote sensing products exhibit varying sensitivity levels, with the SIF demonstrating the highest sensitivity to green vegetation types. (4) Overall, the future vegetation outlook in China is promising, especially in the southeastern regions where significant vegetation improvement trends are evident. However, the vegetation conditions in some northwestern areas remain less favorable, necessitating the reinforcement of ecological construction and improvement measures. Additionally, a significant positive correlation exists between population size, GDP, and vegetation remote sensing products. This study highlights the variability in the dynamics and driving mechanisms of terrestrial vegetation remote sensing products in China and employs the CA–Markov model for predicting future vegetation patterns. Our research contributes to the theoretical and technical understanding of remote sensing for terrestrial vegetation in the Chinese context.
1. Introduction
Vegetation is a crucial component of terrestrial ecosystems, connecting elements such as the atmosphere, water, biology, rocks, and soil. It is the most critical component of ecosystems, and all organisms depend on it [1,2,3]. Changes in ecosystems significantly affect the type, quantity, and quality of vegetation [4]. In particular, global warming has led to alterations in vegetation phenology events [5,6]. The increased frequency of extreme climate events has resulted in severe negative impacts on agriculture, water resources, ecosystems, and socio-economic aspects [7]. Therefore, the long-term monitoring, research, and management of vegetation change are of great value [8].
Ecological problems frequently occur, especially in northern latitudes [9,10]. As a result of economic and population growth, over half of the world’s ecosystems have degraded. China, especially in the north, faces ecological issues such as land degradation, soil erosion, and desertification [11]. China has extensive latitude and longitude spans, rich vegetation, and abundant natural resources. Assessing the dynamic changes in vegetation, understanding the spatial heterogeneity of vegetation change and its interaction with extreme climate and various land use types, and predicting future vegetation development are essential.
The Normalized Difference Vegetation Index (NDVI), Enhanced Vegetation Index (EVI), and Solar-Induced Chlorophyll Fluorescence (SIF) are three remote sensing products that provide valuable information about vegetation dynamics. The NDVI and EVI are closely related to vegetation cover, leaf area index, biomass, and land use, while the SIF directly reflects plant photosynthesis dynamics [12,13,14]. Given the importance of understanding vegetation dynamics in the context of climate change and ecological challenges, our study aims to assess the dynamic changes, driving mechanisms, and spatial model predictions via remote sensing of terrestrial vegetation in China using these three indices. We hypothesize that by combining these three indices, we can obtain a more accurate and comprehensive understanding of vegetation change and its driving factors.
Traditional spatial prediction models, such as regression analysis, often have limited predictive power regarding the spatial distribution of remote vegetation sensing [15]. Moreover, while more studies are utilizing machine learning for spatial distribution prediction, these methods often need more explanation regarding the underlying physical mechanisms [16]. Notably, physical models can offer advantages in mechanism studies and yield better prediction results. In response to the need for more accurate and comprehensive vegetation monitoring and prediction, we propose using a physical model, the CA–Markov model, for predicting the spatial distribution of vegetation remote sensing products. The CA–Markov model combines the long-term prediction advantages of the Markov model with the ability of cellular automata to simulate spatial changes in complex systems, making it effective at analyzing and acting on land use changes [17]. However, few studies have employed this model to make predictions with vegetation remote sensing products, especially the EVI and SIF.
Our study aims to assess the dynamic changes, driving mechanisms, and spatial model predictions of the remote sensing of terrestrial vegetation in China using the NDVI, EVI, and SIF. We will analyze the dynamic changes of these indices in China with a focus on exploring their relationships with meteorological, land use, and socio-economic factors to reflect the variability of vegetation growth characteristics and driving mechanisms more accurately. Our research will employ the CA–Markov model to simulate and forecast using the three vegetation remote sensing products (NDVI, EVI, and SIF) from 2020 to 2025, contributing to China’s theoretical and technical system of terrestrial vegetation remote sensing. This comprehensive approach will help provide an essential scientific basis and decision-making reference for environmental protection departments when formulating policies.
2. Material and Methods
2.1. Studied Area
China (Figure 1), situated at the junction of Asia and Europe, spans a land area of 9.6 million square kilometers and encompasses 34 provincial administrative regions. This study focuses on 32 of these regions, excluding Hong Kong and Macao. The southeastern region of China features semi-humid and humid climates, while the northwestern region is characterized by arid and semi-arid conditions. The eastern region experiences a monsoon climate, the northwestern region has a temperate continental climate, and the southwestern part of the Qinghai–Tibet Plateau has an alpine environment. With a distinct gradient of dry to wet conditions from east to west, China’s climate results in a three-stage terrain gradient that features increasing rainfall and air temperature from west to east. Vegetation follows a similar pattern, gradually increasing from northwest to southeast.
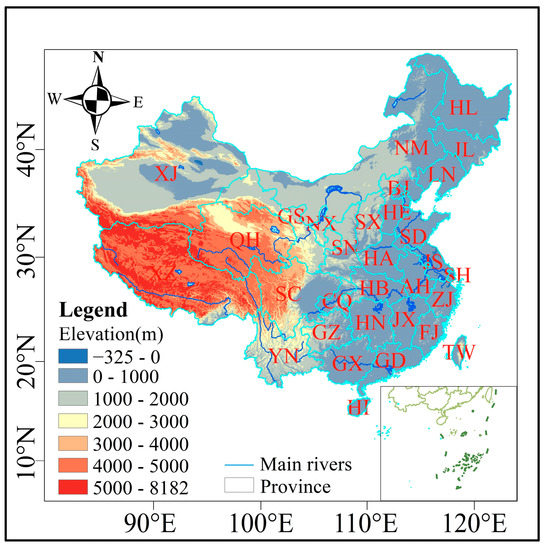
Figure 1.
Location of the study area and its basic geomorphology. BJ: BeiJing; TJ: Tianjing; HE: HeiBei; SX: ShanXi; NM: NeiMengGu; LN: LiaoNing; JL: JiLin; HL: HeiLongJiang; SH: ShangHai; JS: JiangSu; ZJ: ZheJiang; AH: AnHui; FJ: FuJian; JX: JiangXi; SD: ShanDong; HA: HeiNan; HB: HuBei; HN: HuNan; GD: GuangDong; GX: GuangXi; HI: HaiNan; CQ: ChongQing; SC: SiChuan; GZ: GuiZhou; YN: YunNan; XZ: XiZang; SN: ShanXi; GS: GanSu; QH: QingHai; NX: NingXia; XJ: XinJiang; TW: TaiWan.
2.2. Data
2.2.1. Vegetation and Chlorophyll Fluorescence Data
We acquired annual vegetation index data, including from the Normalized Difference Vegetation Index (NDVI) and MODIS-Enhanced Vegetation Index (EVI), for China from 2000 to 2019. NDVI data were sourced from the Resource Environment Science Data Registration and Publication System, and EVI data were obtained from the GEE cloud platform. Both datasets were preprocessed and classified based on their respective index values. Additionally, Solar-Induced Chlorophyll Fluorescence (SIF) data were provided by the National Tibetan Plateau Science Data Center. We selected 4-day resolution SIF data from 2000 to 2019 and synthesized the maximum values of the annual SIF datasets.
2.2.2. Other Data
The CRU TS v.4.05 dataset was sourced from the British National Center for Atmospheric Science (https://crudata.uea.ac.uk, accessed on 1 April 2022). The 1 km resolution monthly precipitation data location in China (2000–2020) and the 1 km resolution monthly average relative humidity dataset in China (2000–2020) were obtained from the National Earth System Science Data Center (http://www.geodata.cn, accessed on 7 April 2022). China’s land type dataset was derived from the 30 m annual land cover product of China made by Wuhan University [18].
2.3. Methods
2.3.1. Annual Average Values of NDVI, EVI, and SIF, and Land Use Type Extraction and Classification
The annual NDVI, EVI, and SIF data were processed into an overall 20-year average using the maximum synthesis method for temporal and spatial analysis. In addition, yearly data were analyzed temporally using the NDVI, EVI, and SIF averages from raster images. Additionally, land use types were classified into nine categories: tree cropland, woodland, shrub, grassland, water body, snow/ice, wasteland, impervious surface, and wetland.
2.3.2. Spatial Trend Analysis Methods
A one-dimensional linear regression model was employed to analyze vegetation cover trends in China from 2000 to 2019 using the following calculation:
The slope of the trend line represents changes in NDVI, EVI, and SIF values over a 20-year observation period. A positive slope (S > 0) indicates increasing vegetation cover, while a negative slope (S < 0) signifies decreasing vegetation cover.
2.3.3. Correlation Analysis
This study employed a correlation analysis to examine the relationships between the NDVI, EVI, and SIF with regard to climate factors, the nine land use types, and socio-economic factors across China from 2000 to 2019. The interannual correlations were calculated accordingly. They were calculated as follows:
In the formula, represents the correlation coefficient between x and y, with coefficient values ranging between −1 and 1, and n denotes the research period. Variables x and y correspond to temperature, precipitation, relative humidity, land use types (9 categories), and human activity factors (population density and GDP). The variable i represents the annual values of NDVI, EVI, and SIF. The symbols and respectively represent the mean values of x and y. A positive correlation is indicated by R > 0, while a negative correlation is represented by R ≤ 0.
2.3.4. CA–Markov Model
This study classified the vegetation indices (NDVI, EVI, and SIF) into five categories based on their values and employed Markov chains for predicting changes in these indices. In this paper, the number of vegetation index change type areas in 2005 and the size of vegetation index change types in 2010 were constructed as a Markov transfer matrix. The models were used to forecast NDVI, EVI, and SIF distributions for 2015, 2018, and 2025–2030.
3. Results
3.1. Spatial and Temporal Variation of NDVI, EVI, and SIF
Figure 2 shows the temporal changes of the three vegetation remote sensing products from 2000 to 2019. The material transformations of the NDVI, EVI, and SIF all show an increasing trend. The temporal changes of the NDVI and EVI are similar, but there are significant differences in the SIF, and the fluctuation magnitude is also different. The differences are reflected in the decreasing trend of the NDVI and EVI until 2005 and 2010, respectively, and the increasing trend afterward, while the SIF shows a growing trend. This difference is because the NDVI and EVI are based on greenness and reflect vegetation cover, which is influenced by more drivers. In contrast, the SIF is based on photosynthetic changes that provide feedback on vegetation cover, which is influenced by fewer drivers directly. Therefore, the temporal variation (Figure 2) shows that the fluctuations in the NDVI and EVI are more significant than those in the SIF. It is also evident that the SIF responds more directly to vegetation cover changes and is less influenced by other drivers than the NDVI and EVI in terms of temporal variation.
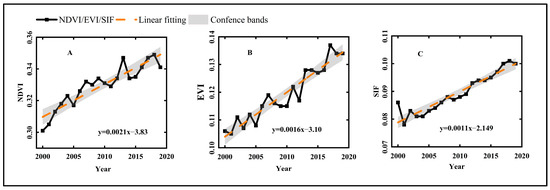
Figure 2.
Line chart of the time change of China’s annual average NDVI, EVI, and SIF from 2000 to 2019. (A): Time variation of NDVI; (B): Time variation of EVI; (C): Time variation of SIF.
Figure 3A–C shows the spatial changes of the remote sensing products for three vegetation types from 2000 to 2019. The results demonstrate that vegetation in China increases from the northwest to the southeast. This finding further confirms our description of the “study area” in the Materials and Methods section. Low values in the northwest (such as in Xinjiang, Tibet, and Qinghai) and high values in the south-central and coastal areas (Yunnan, Guangxi, Guangdong, etc.) indicate that the main factors affecting vegetation growth in different regions vary. The natural environment in the northwest primarily affects foliage, while human factors in the southeast mainly influence vegetation. We also found that the differences between the NDVI and EVI mainly exist at high and low values, the differences between the NDVI and SIF primarily exist at high values, and the differences between the EVI and SIF mainly exist at low and high values. This difference demonstrates that the response of the NDVI and EVI to extreme vegetation cover is inferior to that of the SIF and further supports the necessity of selecting multiple vegetation remote sensing products to explore dynamic changes in vegetation in China.
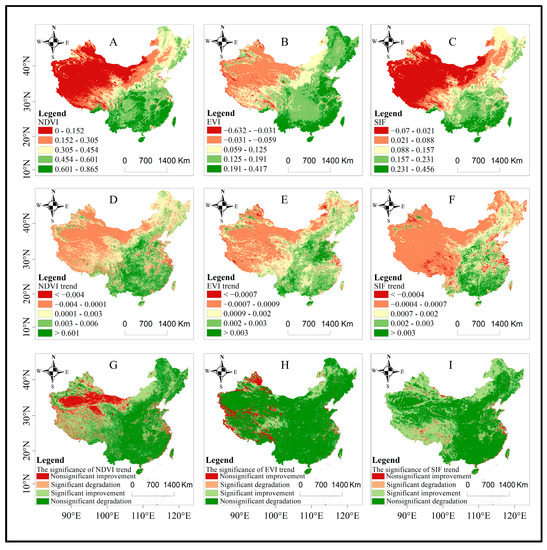
Figure 3.
Spatial distribution of interannual NDVI trends, EVI trends, and SIF trends and significance. (A): Spatial variation of NDVI values; (B): Spatial variation of EVI values; (C): Spatial variation of SIF values; (D): Trend changes in NDVI; (E): Trend changes in EVI; (F): Trend changes in SIF; (G): NDVI significance test; (H): EVI significance test; (I): SIF significance test.
Figure 3D–F shows the spatial trends of the NDVI, EVI, and SIF regression equations. The spatial direction of China’s vegetation changes from northwest to southeast, which is consistent with the spatial distribution of vegetation. The differences between the NDVI, EVI, and SIF are also evident in the northwest and southeast. There are some differences in the spatial trends of the NDVI and EVI, and there are significant differences between the NDVI, EVI, and SIF. The differences between the NDVI and EVI are significantly improved in the region, whereas the differences between the NDVI and SIF are in slightly degraded areas. The differences between the EVI and SIF are in slightly soiled areas and significantly improved areas. These differences are due to the distinct responses of different vegetation remote sensing products to the changes in spatial vegetation trends. The traditional vegetation indices, NDVI and EVI, have a poor reaction to spatial distribution and an inadequate response to the shift in the spatial direction. This also further proves that the SIF, as a direct probe of photosynthesis, is sensitive to changes in spatial vegetation trends. Figure 3G–I shows the spatial significance of the NDVI, EVI, and SIF. In most parts of China, the NDVI, EVI, and SIF are significant and still exhibit an increase from the northwest to the southeast. The spatial significance difference between the NDVI and EVI is in the northwest, whereas the distribution of the NDVI and SIF is similar, and the main difference is in the northwest.
Figure 4 presents the spatial distribution, spatial trend distribution, and significance ratio of the three vegetation remote sensing products. More than 60% of the NDVI annual average is below 0.454, with the higher (0.454–0.601) and highest (0.601–0.865) values accounting for 19.3% and 14.4%, respectively. For the EVI annual values, 48.4% are below 0.125, with the higher (0.125–0.191) and highest (0.191–0.417) values accounting for 18.7% and 32.9%, respectively. More than 70% of the SIF annual values are below 0.231, with the higher (0.157–0.231) and highest (0.231–0.456) values accounting for 18.2% and 8.9%, respectively.
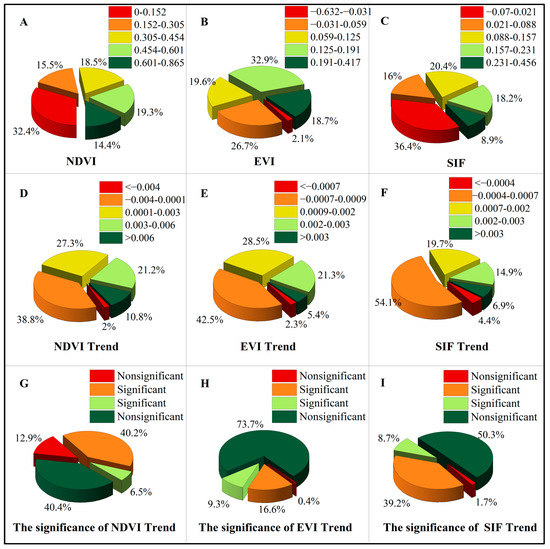
Figure 4.
Pie chart of NDVI value, EVI value, and SIF value and its change trend, the proportion of significant spatial distribution change. (A): Pie chart of NDVI value; (B): Pie chart of EVI value; (C): Pie chart of SIF value; (D): Pie chart of NDVI trend; (E): Pie chart of EVI trend; (F): Pie chart of SIF trend; (G): Pie chart of NDVI significance test; (H): Pie chart of EVI significance test; (I): Pie chart of SIF significance test.
The spatial trend distribution ratios of the NDVI and EVI (Figure 4D,F) are similar, with significant degradation types accounting for 2% and 2.1%. Consequential degradation types comprise 4.4% of the spatial trend distribution ratio for the SIF (Figure 4F). As seen when combined with Figure 3A–C, the SIF is more sensitive to vegetation degradation than the NDVI and EVI. In contrast, its sensitivity to vegetation improvements is considerably weaker than the NDVI and EVI. Fortunately, the analysis of the three planting areas reveals that the proportion of sites with significant vegetation degradation in China is less than 3%, while the proportion of areas with substantial improvements is more than 5%.
The significance ratios of the NDVI and EVI spatial trends (Figure 4G,H) are primarily evident in two extreme situations, accounting for 53.3% and 74.1%. The significance ratio of the SIF spatial trend (Figure 4I) is 52% in extreme cases, which is less than those of the NDVI and EVI. This difference demonstrates the inaccuracy of the NDVI and EVI concerning vegetation trend changes in extreme situations from the perspective of specific values.
3.2. Variability of NDVI, EVI, and SIF in Driving Factors
3.2.1. Effects of Air Temperature, Precipitation, and Relative Humidity on NDVI, EVI, and SIF
Figure 5 presents the temporal changes in China’s air temperature, precipitation, and relative humidity from 2000 to 2019. Air temperature, precipitation, and relative humidity all exhibit increasing trends, with the most pronounced increase observed in relative humidity, which also implies increasing warming in China. In 2005, the three vegetation remote sensing products showed a decreasing trend (Figure 2); air temperature decreased, while precipitation and relative humidity increased. In 2010, the three vegetation remote sensing products exhibited a decreasing trend; air temperature and relative humidity decreased, and precipitation increased. In 2015, the three vegetation remote sensing products showed an increasing trend; air temperature, precipitation, and relative humidity all displayed increasing trends. When vegetation cover changes, transpiration changes and the way in which the leaf stomata close and open changes, which in turn, leads to alterations in vegetation foliar temperature. Air temperature is susceptible to this thermal response, resulting in a positive correlation between air temperature and vegetation over time. Both excessive and insufficient precipitation and relative humidity affect vegetation cover changes, resulting in a difference in their temporal correlation with vegetation. This observation suggests that a combination of meteorological factors drives changes in vegetation cover.
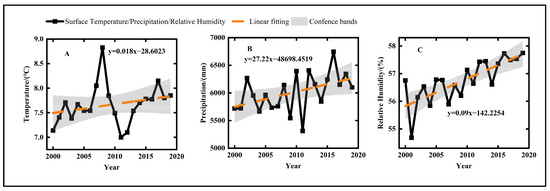
Figure 5.
Interannual timeline chart of average air temperature, precipitation, and relative humidity. (A): Time variation of temperature; (B): Time variation of precipitation; (C): Time variation of relative humidity.
Figure 6 displays the spatial distribution of air temperature, precipitation, and relative humidity. Air temperature, precipitation, and relative humidity show an increasing trend from northwest to southeast. Their spatial distributions exhibit a high degree of similarity with those of the three vegetation remote sensing products. The spatial distribution of air temperature (Figure 6A) is higher in some parts of northwest China, which is inconsistent with our discussion on how air temperature and vegetation remote sensing products have a specific positive temporal correlation. Although air temperature and the three vegetation remote sensing products positively correlate with material changes, some parts of northwest China are plateau and Gobi Desert areas. The combined effect of low precipitation and relative humidity causes air temperature and the three vegetation remote sensing products to show some negative correlation. This phenomenon further indicates that vegetation cover change is driven by multiple meteorological factors rather than a single driver.
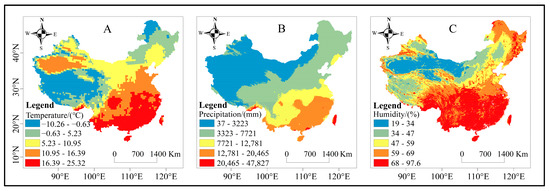
Figure 6.
The spatial distribution of mean air temperature, precipitation, and relative humidity in China from 2000 to 2019 with NDVI, EVI, and SIF. (A): Spatial distribution of temperature. (B): Spatial distribution of precipitation. (C): Spatial distribution of relative humidity.
Figure 7 illustrates the spatial correlations of the three vegetation remote sensing products with air temperature, precipitation, and relative humidity. The NDVI, EVI, and SIF values display positive spatial correlations with air temperature, precipitation, and relative humidity, and negative temporal correlations with relative humidity (Table 1). The spatial correlation coefficients between the SIF and air temperature are more consistent with the spatial distribution of the SIF (Figure 3C), while the spatial correlation coefficients between the NDVI and EVI are more consistent with the spatial distribution of precipitation and relative humidity (Figure 3A,B). However, the spatial correlation coefficients of the SIF and precipitation (Table 1) are more significant than those of the NDVI and EVI.
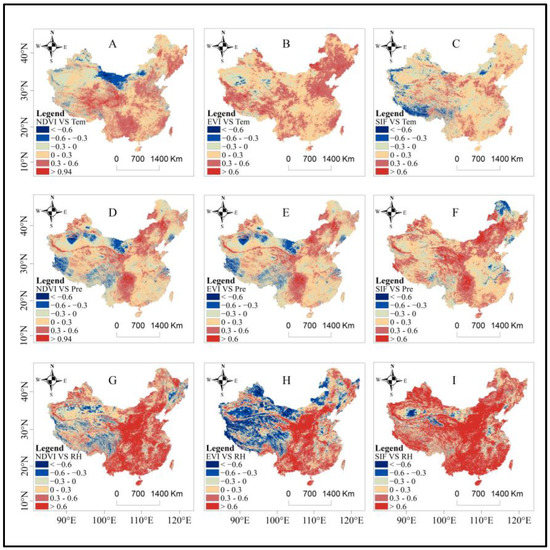
Figure 7.
Spatial distribution of mean air temperature, precipitation, and relative humidity in China from 2000 to 2019 and their correlation with NDVI, EVI, and SIF. (A): the partial correlation coefficient between NDVI and temperature; (B): the partial correlation coefficient between EVI and temperature; (C): the partial correlation coefficient between SIF and temperature; (D): the partial correlation coefficient between NDVI and precipitation; (E): the partial correlation coefficient between EVI and precipitation; (F): the partial correlation coefficient between SIF and precipitation; (G): the partial correlation coefficient between NDVI and relative humidity; (H): the partial correlation coefficient between EVI and relative humidity; (I): the partial correlation coefficient between SIF and relative humidity.

Table 1.
Correlation of interannual variation of the NDVI with air temperature, precipitation, and relative humidity.
The NDVI, EVI, and SIF show negative correlations with air temperature in many areas in Figure 7A–C, such as the northern Inner Mongolia desert region and some Gobi Desert lands in the northwest. This area is primarily in the plateau zone and has low precipitation and relative humidity. At the same time, the spatial distribution of the NDVI and EVI correlation is not consistent with the spatial distribution increasing from the northwest to the southeast, indicating that the response of the SIF to air temperature is more sensitive than that of the NDVI and EVI. The differences in the spatial distributions of the NDVI, EVI, and SIF correlations with precipitation, as shown in Figure 7D–F, are in the negatively correlated areas. We hypothesize that the reason for these differences is that although the response of the SIF to photosynthesis is more direct, there is a certain spatial lag in the effect of precipitation on the SIF, resulting in a negative correlation between the NDVI and EVI and precipitation in more areas. It also indicates that the NDVI and EVI are more sensitive to precipitation. The negative correlations between the EVI and relative humidity, as shown in Figure 7G–I, are apparent in the northwest, and the positive correlations are evident in the southeast. Although the EVI and relative humidity displayed negative spatial correlations in more northwestern regions, their spatial correlation distribution and spatial distribution (Figure 3B) both showed an increasing trend from northwestern to southeastern areas. In contrast, the spatial correlation distribution and spatial distribution of the SIF exhibited a significant difference, indicating that the NDVI and EVI were more sensitive to a relative humidity response than the SIF.
3.2.2. Effect of Land Use Type on NDVI, EVI, and SIF
Figure 8 and Figure 9 display the spatial and temporal distribution of land use types from 2000 to 2019. Land use types in China primarily consist of grassland, cropland, forest land, and wasteland. The spatial distribution of land use types (vegetation) shows an increasing trend from the northwest to the southeast region, consistent with the spatial distribution of the NDVI, EVI, and SIF (Figure 3A–C). A large amount of wasteland and grassland exists in the northwest, and a large amount of forest land and arable land exists in the southeast. China’s overall trend related to arable land has been decreasing in recent years. However, the arable land in the east-central area has been increasing, and these regions have implemented the policy of changing from “nomadic” to “semi-agricultural and semi-pastoral” areas. This is inconsistent with the fact that the total arable land in China decreased by 50,529 Km2 from 2000 to 2019 (Figure 9A), and we believe that many other arable lands have been converted into lands with other vegetation types. Arable land is followed by grassland and woodland, with the three types accounting for 73.2% of the total regional area. Woodland–grassland is mainly distributed in the southeast. The land types closely associated with grassland conversion are cropland, woodland, and unused land. Nevertheless, grassland areas have decreased by 46,877 Km2 in the last 20 years (Figure 9D), followed by a decrease in wasteland (Figure 9G) and wetland (Figure 9I). Although the total water area of China’s inland water bodies has increased significantly by 13,598 Km2 over the past 20 years (Figure 9E), the situation is not optimistic, as the increase in the total water area of natural lakes is dominated by the rapid expansion of brackish lakes on the Qiangtang Plateau, while the area of natural freshwater lakes is shrinking due to human activities. In the past 20 years, although China’s forest land has mainly been increasing (Figure 9B), this is primarily due to the reforestation of cultivated land and grassland and afforestation activities. According to Table 2, China’s three vegetation remote sensing products showed some correlations with land use types over time. The NDVI, EVI, and SIF showed negative correlations with cropland, shrubs, grassland, wasteland, and wetland; additionally, they showed positive correlations with woodland, water bodies, impervious surface, and snow/ice. Although wetland types had high negative correlations with the NDVI, EVI, and SIF, the small and more dispersed areas of wetlands relative to other land use types had a weaker effect on vegetation. There are some differences in the sensitivity of land use types to the NDVI, EVI, and SIF [19]. The sensitivity of the SIF is stronger than that of the NDVI and EVI when the land use type is green vegetation (woodland, shrubs, grassland, and wasteland) and more robust than the SIF when the land use type is another type (snow/ice, water bodies, and wetlands). Especially in cropland types, the sensitivity of the NDVI and EVI is more robust, which also proves that the sensitivity of the NDVI and EVI to greenness-based sensitivity was more substantial than that of the SIF.
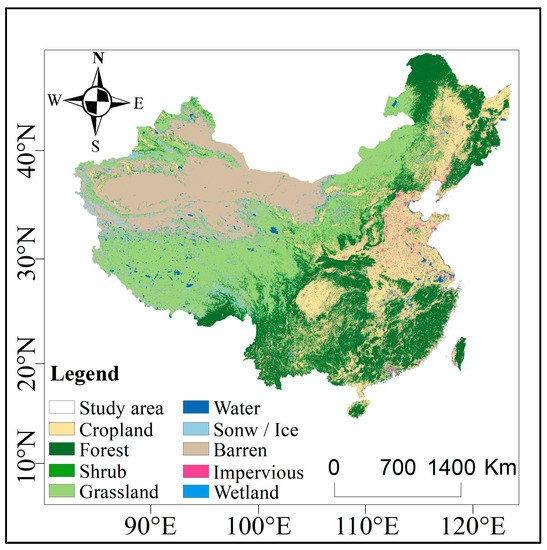
Figure 8.
Spatial distribution map of average annual land use.
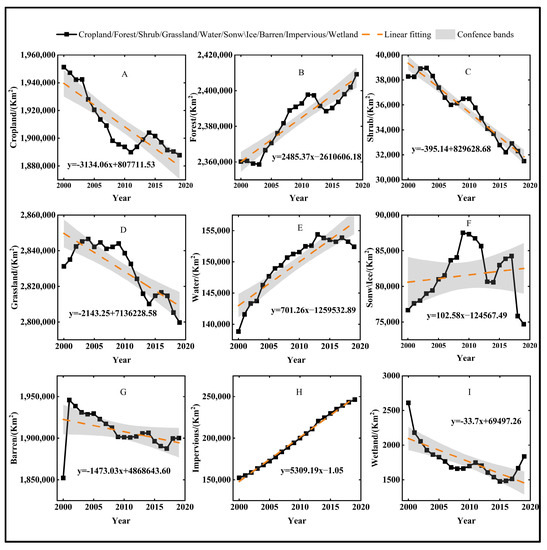
Figure 9.
Interannual timeline change in land use type. (A): Time variation of cropland; (B): Time variation of forest; (C): Time variation of shrub; (D): Time variation of grassland; (E): Time variation of water; (F): Time variation of snow/ice; (H): Time variation of barren; (I): Time variation of impervious; (G): Time variation of wetland.

Table 2.
Correlation between NDVI, EVI, and SIF and land use type in China from 2000 to 2019.
3.2.3. Impact of Socio-Economic Factors on NDVI, EVI, and SIF
As shown in Table 3, the p-values of the NDVI, EVI, and SIF correlations with population size and GDP are less than 0.01, indicating that the two factors significantly correlate with the NDVI, EVI, and SIF. Population size (=0.926, 0.95, and 0.941) and GDP (=0.574, 0.595, and 0.501) were significantly and positively correlated with the NDVI, EVI, and SIF, and the correlation of population size was more significant than that of GDP.

Table 3.
Correlation between NDVI, EVI, and SIF and human factors in China from 2000 to 2019.
3.3. NDVI, EVI, and SIF Simulation and Prediction
Figure 10 displays the comparison results of the simulated predictions for the NDVI, EVI, and SIF for 2015 and 2018 (A, B, and C are the original images, and A1, B2, and C3 are the predicted images). Based on the regional NDVI, EVI, and SIF data in 2005 and 2010, the probability transfer matrix for each type of NDVI, EVI, and SIF from 2005 to 2010 was obtained under the IDRISI platform, and the CA–Markov model was applied to generate the suitability profiles to obtain the simulated data in 2015 and 2018. The decomposition results of the NDVI, EVI, and SIF for 2015 and 2018 were compared with the simulation results, and the simulation results were verified using kappa coefficients. The predicted kappa coefficient values of the NDVI, EVI, and SIF for 2015 were 0.8631, 0.8864, and 0.9041, and for 2018 were 0.848, 0.8516, and 0.8928, respectively (generally, when the kappa coefficient is greater than or equal to 0.75, the simulation prediction accuracy is considered high [20], and thus, the simulation of the NDVI, EVI, and SIF changes passed the accuracy test).
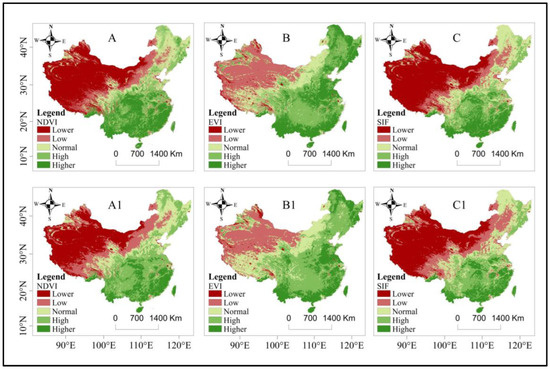
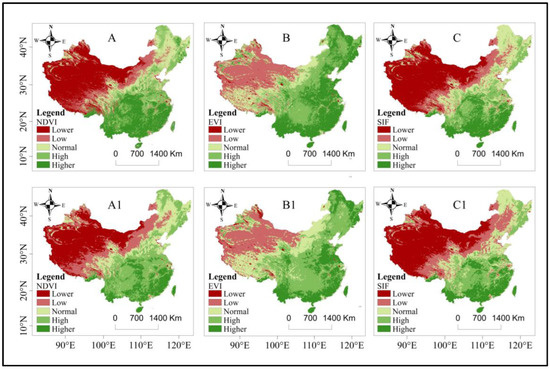
Figure 10.
The graph at the top shows the forecast results for NDVI, EVI, and SIF in 2015, while the chart at the bottom shows the forecast results for the same indices in 2018. (A): Original NDVI images in 2015 and 2018; (B): Original EVI images in 2015 and 2018; (C): Original SIF images in 2015 and 2018; (A1): Predicted NDVI images in 2015 and 2018; (B1): Predicted EVI images in 2015 and 2018; (C1): Predicted SIF images in 2015 and 2018.
Figure 11 presents the simulation projection results of the NDVI, EVI, and SIF for 2020–2025. The future vegetation in China still offers a better form overall, especially in the southeast region where the vegetation improvement trend is significant. However, it still needs to be improved in some areas such as the northwest, where it is necessary to strengthen the ecological environment construction. By combining the results from Table 4, Table 5 and Table 6, it can be seen that the NDVI, EVI, and SIF lower types decreased by 0.3%, 0.2%, and 0.5%. Still, the NDVI lower types increased by 0.4% in 2022, which occurred mainly in the northwest region and can be attributed to the more severe natural environment in 2022 in the northwest region. Common types differ significantly, with the EVI and SIF higher types increasing by 1.9% and 1.3%, the low types decreasing by 1.4% and 0.5%, and the NDVI remaining essentially unchanged. The response of the NDVI to vegetation could have been better and fluctuated insignificantly when NDVI values were lower and higher. Although the EVI was an improved version of the NDVI, its effect was still insignificant at lower EVI values. In contrast, the variation in the SIF is still very significant at its lower and higher values, which confirms from a new perspective that the response effect of the SIF on vegetation is higher than that of the traditional NDVI and EVI.
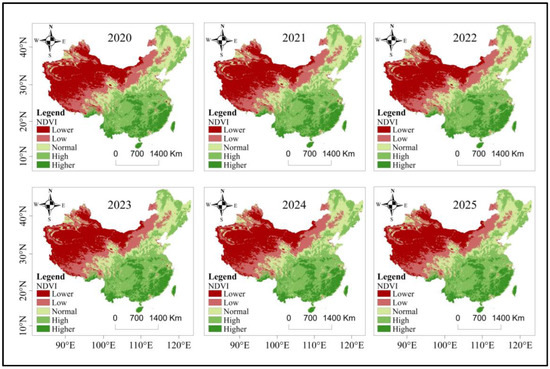
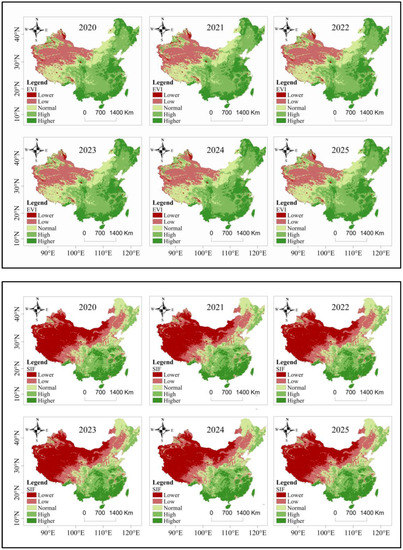
Figure 11.
Spatial distribution of NDVI, EVI, and SIF forecast results in 2020–2025.

Table 4.
NDVI distribution percentage results for 2020–2025.

Table 5.
EVI distribution percentage results for 2020–2025.

Table 6.
SIF distribution percentage results for 2020–2025.
4. Discussion
4.1. Temporal and Spatial Distribution of Normalized Difference Vegetation Index, Enhanced Vegetation Index, and Sun/Solar-Induced Chlorophyll Fluorescence
Examining changes in vegetation dynamics in China is crucial for enhancing ecological vulnerability assessments, particularly in the context of climate change [21,22,23]. In this study, we considered not only the NDVI and EVI, which primarily represent structural information such as vegetation cover and greenness, but also the SIF, which accurately reflects the physiological activities of vegetation. This approach allowed us to comprehensively investigate the dynamic changes in Chinese vegetation from multiple perspectives.
Evidence suggests that vegetation cover in China has increased over the past two decades (Figure 2 and Figure 3), which is consistent with the findings of previous related studies [24,25]. Our results indicated that, according to the NDVI (as well as the EVI and SIF), China’s vegetation area increased by approximately 13.3% to 26.5%. Most of the upward trend occurred in the southeast and east-central regions. We observed that the spatial distribution pattern of the NDVI (as well as the EVI and SIF) trends aligned with the overall spatial distribution pattern.
Moreover, we found significant differences in the NDVI, EVI, and SIF trends in southeastern Tibet and western Sichuan, where the NDVI and EVI declined while the SIF improved. Unlike the vegetation degradation in northwest China caused by harsh natural environments, the NDVI and EVI degradation in southeastern Tibet and western Sichuan may be attributed to the influence of human activities. As a result, the greenness-based vegetation indices, NDVI and EVI, provide more direct feedback on the impact of human activities, and the vegetation response is influenced by a greater number of drivers (Figure 5).
4.2. Analysis of Driving Factors of NDVI, EVI, and SIF
This study discovered that climate change and land use types can both hinder the increase in vegetation cover and even cause a more noticeable degradation trend in some regions of China. Notably, climate change negatively affects vegetation change in parts of northwest and northeast China. The degradation of vegetation in certain areas of northeast China might be related to the rapid decline in air temperature and precipitation since 2000 [26], while the arid climate in northwest China, which is situated on a plateau, could worsen water shortages in some regions, limiting vegetation growth [27].
Moreover, land use type changes positively influence vegetation recovery in specific areas [28]. On a regional scale, Shandong, Henan, and Hebei provinces, which are central agricultural regions in China, exhibited a slight enhancement in vegetation cover. These regions have transitioned from “nomadic” to “semi-agricultural and semi-pastoral” areas, with some nomadic areas being converted into arable land. However, more arable land has also been transformed concurrently. Prior studies have shown that more arable land has been converted into land with natural attributes instead of being restored with social features, primarily due to reforestation, grass restoration, and urban expansion [29].
We also observed differences in the NDVI, EVI, and SIF responses based on the woodland land use type. The SIF demonstrated a weaker correlation with forests than the NDVI and a stronger correlation than the EVI. We attribute this to the diversity of woodland styles (including non-green vegetation) causing some discrepancy in the sensitivity between the NDVI and woodland. Concurrently, the EVI is a vegetation index product based on the NDVI that was improved for forests. Therefore, the impacts of climate change and land use type complexities have a crucial effect on the spatial distribution of the NDVI, EVI, and SIF changes in Chinese vegetation.
It is also essential to mention that the NDVI, EVI, and SIF have strong correlations with population size and even stronger correlations with GDP. The influence of population density on vegetation is predominant in densely populated regions, cities, and peri-urban areas. China’s balanced population growth exceeded 20% over the last 20 years. The ongoing increase in economic growth and urban population has led to the expansion of metropolitan construction land area, resulting in a decreasing trend of vegetation cover in some locations. However, the overall correlation remained significantly positive with the NDVI due to the concentrated distribution of population growth in the study area. This finding suggests that improvements in socio-economic conditions can contribute to the year-on-year enhancement of natural vegetation cover and vice versa.
In conclusion, our temporal correlation analysis used a mathematical model (Pearson correlation) to provide insight into the relationship between vegetation and drivers, though some errors exist. The driver analysis of vegetation determined with NDVI, EVI, and SIF further emphasized the differences between traditional vegetation indices and the SIF. Consequently, future research should investigate how to analyze vegetation drivers by examining the response speed of various vegetation remote sensing products to additional drivers.
4.3. Analysis of NDVI, EVI, and SIF Simulation and Prediction Results
Presently, CA–Markov models are predominantly employed for simulating and predicting land use patterns [30,31], highlighting the need for more research on simulating and predicting with vegetation remote sensing products. This study examined the dynamics of terrestrial vegetation remote sensing products in China over an extended time series, using NDVI, EVI, and SIF datasets. The CA–Markov prediction model was applied to forecast the spatial and quantitative changes in vegetation remote sensing products in China from 2020 to 2025. These findings offer technical support and references for efficient land use, spatial planning and layout, regional ecological security, and sustainable regional socio-economic development [32].
When implementing the CA–Markov model in the simulation process, the impact of natural, social, and economic factors on vegetation cover change should be comprehensively considered, given the complexity of the model transformation rules [33,34]. However, during the study, it was observed that the model needed to accurately represent anthropogenic factors such as population, economy, and policies, which significantly influence town centers, as crucial factors in addition to the changes in vegetation cover. Consequently, future research should continuously improve the cell transformation laws of the CA–Markov model and consider combining various models to achieve higher precision and accuracy in predicting vegetation change.
The process of vegetation change is complex and influenced by numerous factors. Different regions experience distinct vegetation changes, which reflect various ecological methods and are attributed to their unique environmental significance. Nonetheless, only a limited number of studies have investigated the multiple vegetation remote sensing products considered in this research. As a result, further investigation is required to adjust model parameters based on a comprehensive analysis of diverse factors. Future studies should perform more in-depth and extensive analyses of vegetation change to explore a more comprehensive and targeted reflection of regional vegetation change characteristics. This would provide valuable references and suggestions for the feasibility of vegetation ecological construction in China.
5. Summary and Conclusions
This paper used the 2000–2019 datasets from vegetation remote sensing products to explore vegetation dynamics in China from different perspectives. It explored the variability of the drivers of vegetation by applying regression equation models and by considering air temperature, precipitation, relative humidity, and nine land use type factors. In addition, the spatial distribution of vegetation remote sensing products in 2020–2025 was predicted using the CA–Markov model. The main findings are as follows:
- Throughout the study period, the vegetation indices, NDVI, EVI, and SIF, all exhibited increasing trends. The SIF demonstrated a more direct response to vegetation cover changes and was less influenced by other driving factors. The SIF outperformed the NDVI and EVI in detecting vegetation trend changes, particularly regarding sensitivity.
- Vegetation cover changes are driven by multiple meteorological factors, such as temperature, precipitation, and relative humidity. These factors exhibited a strong spatial correlation with the distribution of the vegetation remote sensing products. Among these factors, the SIF showed a higher sensitivity to temperature compared to the NDVI and EVI, while the NDVI and EVI displayed greater sensitivity to precipitation and relative humidity.
- Within the study area, land use types revealed a gradient from northwest to southeast, which is consistent with the spatial distribution of the vegetation remote sensing products. For green vegetation types, the three remote sensing products exhibited varying sensitivity levels, with the SIF demonstrating the highest sensitivity to green vegetation types.
- Overall, the future vegetation outlook in China is promising, especially in the southeastern regions where significant vegetation improvement trends are evident. However, the vegetation conditions in some northwestern areas remain less favorable, necessitating the reinforcement of ecological construction and improvement measures. Additionally, a significant positive correlation exists between population size, GDP, and vegetation remote sensing products.
Author Contributions
Data curation, Y.H.; formal analysis, Y.H. and Z.C.; investigation, Y.H.; software, Y.H.; writing—original draft, Y.H. and P.Z.; writing—review and editing, Y.H., Y.L. and P.Z.; methodology, Y.L. and P.Z.; resources, Y.L., P.Z. and J.D.; supervision, Y.L., P.Z. and J.D.; funding acquisition, Y.L.; conceptualization, P.Z.; visualization, Z.C., J.W. and K.Y.; validation, J.W. and K.Y.; All authors have read and agreed to the published version of the manuscript.
Funding
This research was funded by the National Natural Science Foundation of China (Grant No. 41761081), the Basic Research Program of Yunnan Province (Grant No. 202201AU070112), the Kunming University of Science Technology introduced talent research start-up fund project (Grant No. KKZ3202021055), and the Yunnan Province Philosophy and Social Science Planning Project (Grant No. PY202129).
Institutional Review Board Statement
Not applicable.
Informed Consent Statement
Not applicable.
Data Availability Statement
Not applicable.
Acknowledgments
The authors would like to thank the researchers who have provided the open-source algorithms, which have been extremely helpful to the research in this paper.
Conflicts of Interest
The authors declare no conflict of interest.
References
- Zhu, H. A Biogeographical Comparison Between Yunnan, Southwest China, and Taiwan, Southeast China, with Implications for the Evolutionary History of the East Asian Flora. Ann. Mo. Bot. Gard. 2016, 101, 750–771. [Google Scholar] [CrossRef]
- Xiao, J.Y.; Wang, S.J.; Bai, X.Y.; Zhou, D.Q.; Tian, Y.C.; Li, Q.; Wu, L.H.; Qian, Q.H.; Chen, F.; Zeng, C. Determinants and spatial-temporal evolution of vegetation coverage in the karst critical zone of South China. Acta Ecol. Sin. 2018, 38, 8799–8812. [Google Scholar]
- Hédl, R.; Bernhardt-Römermann, M.; Grytnes, J.; Jurasinski, G.; Ewald, J. Resurvey of historical vegetation plots: A tool for understanding long-term dynamics of plant communities. Appl. Veg. Sci. 2017, 20, 161–163. [Google Scholar] [CrossRef]
- Lu, Q.Q.; Jiang, T.; Liu, D.L.; Liu, Z.Y. The response characteristics of NDVI with different vegetation cover types to temperature and precipitation in China. Ecol. Environ. 2020, 29, 23–34. [Google Scholar]
- Huang, W.; Ge, Q.; Wang, H.; Dai, J. Effects of multiple climate change factors on the spring phenology of herbaceous plants in Inner Mongolia, China: Evidence from ground observation and controlled experiments. Int. J. Climatol. 2019, 39, 5140–5153. [Google Scholar] [CrossRef]
- Liu, Y.; Wang, J.; Dong, J.; Wang, S.; Ye, H. Variations of vegetation phenology extracted from remote sensing data over the tibetan plateau hinterland during 2000–2014. J. Meteorol. Res. 2020, 34, 786–797. [Google Scholar] [CrossRef]
- Diffenbaugh, N.S.; Pal, J.S.; Trapp, R.J.; Giorgi, F. Fine-scale processes regulate the response of extreme events to global climate change. Proc. Natl. Acad. Sci. USA 2005, 102, 15774–15778. [Google Scholar] [CrossRef]
- Tong, L.J.; Liu, Y.Y.; Wang, Q.; Zhang, Z.Y.; Li, J.L.; Sun, Z.G.; Muhammad, K. Relative effects of climate variation and human activities on grassland dynamics in Africa from 2000 to 2015. Ecol. Inform. 2019, 53, 100979. [Google Scholar] [CrossRef]
- Tucker, C.J.; Slayback, D.A.; Pinzon, J.E.; Los, S.O.; Myneni, R.B.; Taylor, M.G. Higher northern latitude normalized difference vegetation index and growing season trends from 1982 to 1999. Int. J. Biometeorol. 2001, 45, 184–190. [Google Scholar] [CrossRef]
- Myneni, R.B.; Keeling, C.D.; Tucker, C.J.; Asrar, G.; Nemani, R.R. Increased plant growth in the northern high latitudes from 1981 to 1991. Nature 1997, 386, 698–702. [Google Scholar] [CrossRef]
- Wang, T.; Zhu, Z.; Wu, W. Sandy desertification in the north of China. Sci. China Ser. D Earth Sci. 2002, 45, 23–34. [Google Scholar] [CrossRef]
- Zhou, P.; Zhao, D.; Liu, X.; Duo, L.; He, B.J. Dynamic Change of Vegetation Index and Its Influencing Factors in Alxa League in the Arid Area. Front. Ecol. Evol. 2022, 10, 922739. [Google Scholar] [CrossRef]
- Kawamura, K.; Akiyama, T.; Yokota, H.O.; Tsutsumi, M.; Yasuda, T.; Watanabe, O.; Wang, S. Comparing MODIS vegetation indices with AVHRR NDVI for monitoring the forage quantity and quality in Inner Mongolia grassland, China. Grassl. Sci. 2010, 51, 33–40. [Google Scholar] [CrossRef]
- Cao, J.J.; An, Q.; Zhang, X.; Xu, S.; Si, T.; Niyogi, D. satellite Sun-Induced Chlorophyll Fluorescence more indicative than vegetation indices under drought condition. Sci. Total Environ. 2021, 792, 148396. [Google Scholar] [CrossRef] [PubMed]
- Marzieh, M.; Minh, P.T. CA-Markov model application to predict crop yield using remote sensing indices. Ecol. Indic. 2022, 139, 108952. [Google Scholar]
- Li, D.; Miao, Y.; Gupta, S.K.; Rosen, C.J.; Yuan, F.; Wang, C.; Wang, L.; Huang, Y. Improving Potato Yield Prediction by Combining Cultivar Information and UAV Remote Sensing Data Using Machine Learning. Remote Sens. 2021, 13, 3322. [Google Scholar] [CrossRef]
- Sun, C.; Bao, Y.; Vandansambuu, B.; Bao, Y. Simulation and Prediction of Land Use/Cover Changes Based on CLUE-S and CA-Markov Models: A Case Study of a Typical Pastoral Area in Mongolia. Sustainability 2022, 14, 15707. [Google Scholar] [CrossRef]
- Yang, J.; Huang, X. The 30 m annual land cover dataset and its dynamics in China from 1990 to 2019. Earth Syst. Sci. Data 2021, 13, 3907–3925. [Google Scholar] [CrossRef]
- Wang, Z.; Yan, W.D.; Liu, S.G.; Gao, C.; Chen, X.Y. Spatial-temporal characteristics of three main land-use types in China based on MODIS data. Acta Ecol. Sin. 2017, 37, 3295–3301. [Google Scholar]
- Pan, Y.; Yu, D.; Wang, X. Prediction of land use landscape pattern based on CA-Markov model. Soils 2018, 50, 391–397. (In Chinese) [Google Scholar]
- Fernández, G.; María, E.; Baival, B.; Batjav, B. Cross-boundary and cross-level dynamics increase vulnerability to severe winter disasters (dzud) in Mongolia. Global Environ. Change 2012, 22, 836–851. [Google Scholar] [CrossRef]
- Wang, R.; Cherkauer, K.A.; Bowling, L.C. Corn Response to Climate Stress Detected with Satellite-Based NDVI Time Series. Remote. Sens. 2016, 8, 269. [Google Scholar] [CrossRef]
- Min, S.K.; Son, S.W.; Seo, K.H.; Kug, J.-S.; An, S.-I.; Choi, Y.-S.; Jeong, J.-H.; Kim, B.-M.; Kim, J.-W.; Kim, Y.-H.; et al. Changes in weather and climate extremes over Korea and possible causes: A review. Asia-Pac. J. Atmos. Sci. 2015, 51, 103–121. [Google Scholar] [CrossRef]
- Li, M.; Yin, L.; Zhang, Y.; Su, X.; Liu, G.; Wang, X.; Au, Y.; Wu, X. Spatio-temporal dynamics of fractional vegetation coverage based on MODIS-EVI and its driving factors in Southwest China. Acta Ecol. Sin. 2021, 41, 1138–1147. [Google Scholar]
- Yan, Z.; Liu, L.; Jing, X. Spatiotemporal Variations of Satellite-based SIF and Its Climate Response in China from 2007 to 2018. Remote Sens. Technol. Appl. 2022, 37, 702–712. (In Chinese) [Google Scholar]
- Jin, K.; Wang, F.; Yu, Q.; Gou, J.; Liu, H. Varied degrees of urbanization effects on observed surface air temperature trends in China. Clim. Res. 2018, 76, 131–143. [Google Scholar] [CrossRef]
- Luo, Z.; Song, Q.; Wang, T.; Zeng, H.; He, T.; Zhang, H.; Wu, W. Direct Impacts of Climate Change and Indirect Impacts of Non-Climate Change on Land Surface Phenology Variation across Northern China. ISPRS Int. J. Geo Inf. 2018, 7, 451. [Google Scholar] [CrossRef]
- Zhao, A.; Zhang, A.; Liu, X.; Cao, S. Spatiotemporal changes of normalized difference vegetation index (NDVI) and response to climate extremes and ecological restoration in the Loess Plateau, China. Theor. Appl. Climatol. 2018, 132, 555–567. [Google Scholar] [CrossRef]
- He, C.; Li, J.; Zhang, X.; Liu, Z.; Zhang, D. Will rapid urban expansion in the drylands of northern China continue: A scenario analysis based on the Land Use Scenario Dynamics-urban model and the Shared Socioeconomic Pathways. J. Clean. Prod. 2017, 165, 57–69. [Google Scholar] [CrossRef]
- Xu, D.H.; Zhang, K.; Cao, L.; Guan, X.; Zhang, H. Driving forces and prediction of urban land use change based on the geodetector and CA-Markov model: A case study of Zhengzhou, China. Int. J. Digit. Earth 2022, 15, 2246–2267. [Google Scholar] [CrossRef]
- Luan, Y.; Huang, G.; Zheng, G. Spatiotemporal evolution and prediction of habitat quality in Hohhot City of China based on the InVEST and CA-Markov models. J. Arid Land 2023, 15, 20–33. [Google Scholar] [CrossRef]
- Fu, F.; Liu, W.; Wu, D.; Deng, S.; Bai, Z. Research on the Spatiotemporal Evolution of Land Use Landscape Pattern in a County Area Based on CA-Markov Model. Sustain. Cities Soc. 2022, 80, 103760. [Google Scholar] [CrossRef]
- Zhang, C.; Lu, D.; Chen, X.; Zhang, Y.; Maisupova, B.; Tao, Y. The spatiotemporal patterns of vegetation coverage and biomass of the temperate deserts in Central Asia and their relationships with climate controls. Remote Sens. Environ. 2016, 175, 271–281. [Google Scholar] [CrossRef]
- Bai, Y.; Li, S. Growth peak of vegetation and its response to drought on the Mongolian Plateau. Ecol. Indic. 2022, 141, 109150. [Google Scholar] [CrossRef]
Disclaimer/Publisher’s Note: The statements, opinions and data contained in all publications are solely those of the individual author(s) and contributor(s) and not of MDPI and/or the editor(s). MDPI and/or the editor(s) disclaim responsibility for any injury to people or property resulting from any ideas, methods, instructions or products referred to in the content. |
© 2023 by the authors. Licensee MDPI, Basel, Switzerland. This article is an open access article distributed under the terms and conditions of the Creative Commons Attribution (CC BY) license (https://creativecommons.org/licenses/by/4.0/).