Abstract
Barely explored in the prior literature, ruby chocolate was investigated in this study to explore its thermal properties. The fatty acid composition of ruby chocolate (RC) fat was determined using gas chromatography. Differential scanning calorimetry (DSC) was successfully used to determine the melting behavior and polymorphic forms of the cocoa fat and milk fat present in the RC. The oxidative stability of the fat extracted from the RC was studied with the use of pressurized differential scanning calorimetry (PDSC). The thermal behavior of the chocolate and the fat were investigated using thermogravimetry (TGA). The thermal profile and characteristics of the RC showed how the parameters compared with those of dark and milk chocolate. The melting temperature of the RC obtained by DSC was more similar to that of milk chocolate than to that of dark chocolate. Regression analysis of the PDSC data for the fat extracted from the RC was characterized by very high correlation coefficients (>0.99). It was noticed there was no statistically significant difference between the values of the activation energy (Ea) of the oxidation process for the fat extracted from the RC, obtained by the means of maximum temperature (dynamic mode) and maximum induction time (isothermal mode).
1. Introduction
The chocolate industry is one of the most prosperous branches of the food industry. Chocolate consumption and competition in its production process increase year by year. There is also a growing public awareness about the quality of chocolate. Customers have a large choice of products, but they are used to a few basic types of chocolate, i.e., milk, dark and white [1].
The appearance of RC in stores has aroused widespread curiosity. Barry Callebaut has patented [2] the production process of a new type of chocolate with a specific color and fruit flavor. Emerging news in the media suggested a new variety of cocoa beans from which ruby chocolate was produced. However, there is no scientific confirmation for the existence of a new variety of cocoa beans. Traditionally, chocolate is made from fermented, roasted cocoa beans.
What happens during fermentation is still not entirely clear. There are two main methods of fermentation: beans are either placed in piles and covered with banana leaves, or placed in wooden boxes with holes or slits. The process in both cases takes from 5–6 days, and the length is actualized according to experience [3]. The fermentation and subsequent roasting are used to change the taste of the cocoa beans, to protect the beans microbiologically and also to change the color of naturally purple beans. All types of chocolate are produced from the beans of the same plant, Theobroma cacao L. species; types of chocolate may differ, among other aspects, in appearance, bitterness and the composition of fatty acids. Ruby chocolate is made from beans that have either not been fermented or in which the fermentation process has been significantly reduced [2]. For this reason, the beans retain their natural pink color.
The producer uses organic or inorganic acid to maintain the color and appropriate acidity. However, the detailed procedure remains the manufacturer’s secret. Regardless of the type of chocolate, similar attributes drive consumers’ interest.
The color of RC and its taste, which is very different from that of traditional chocolate, can distract customers from other important indicators of chocolate quality, such as the composition of fatty acids or the melting temperature [4]. The elimination of fermentation and roasting provides a simpler infrastructure and reduces the cost of obtaining the raw material. Additionally, the general features that define a good quality of cocoa can be ignored because they are, in any event, imperceptible in RC. Hence, RC is expected to have slightly different structure and thermal properties. Each type of chocolate, especially milk chocolate, contains a very complex mixture of ingredients [5]. Based on the list of ingredients, the qualities of RC should be closer to those of the milk chocolate category than to those of dark chocolate.
Therefore, thermal techniques, such as DSC and TGA, are highly recommended during RC analysis and they have many advantages over traditional analysis. DSC can provide information about processes such as crystallization and oxidative stability by applying isothermal or non-isothermal conditions, respectively [6,7,8]. TGA indicates which endothermic event corresponds to mass loss. TGA has been successfully used to determine the composition of dark and milk chocolate and consequently to control the quality of that product [9,10].
The purpose of this work was to use TGA to determine the composition of RC, as well as to use DSC and PDSC to both characterize the melting profile and to measure the oxidative stability of the fat extracted from RC.
2. Materials and Methods
2.1. Materials
Ruby chocolate (47.3% cocoa liquor) was purchased in a confectionary shop. The ingredients (according to the manufacturer’s declaration) of the chocolate were sugar, cocoa butter, skimmed milk powder, full milk powder, cocoa mass, soy lecithin, citric acid and natural vanilla extract. The average nutritional value per 100 g was as follows: sugar content 50%, fat content 36% (the content of cocoa butter and cocoa mass was 47.3% (minimum)), protein 9.3% and salt 0.26%.
2.2. Fat Extraction from Ruby Chocolate
The RC was ground before extraction. The fat was extracted according to the procedure depicted by Boselli et al. [11] and Dolatowska-Żebrowska et al. [7].
2.3. Fatty Acid Composition/GC Analysis
The fatty acid composition of the fat extracted from the RC was determined as fatty acid methyl esters, according to the ISO method [12]. The determination was carried out according to the procedure described by Bryś et al. [13,14].
2.4. DSC Oxidative Stability Measurements for the Fat Extracted from Ruby Chocolate
The calorimetric measurements were performed with a Q200 DSC (TA Instruments, New Castle, DE, USA). The procedure for the determination of oxidative stability is described by Dolatowska-Żebrowska et al. [7], Ostrowska-Ligęza et al. [15] and Wirkowska–Wojdyła et al. [16].
2.5. DSC Measurements of Melting of Ruby Chocolate and Fat Extracted from Ruby Chocolate
The DSC measurements of the melting characteristics were obtained using a Q200 DSC (TA Instruments, New Castle, DE, USA).
The measurements were carried out according to the method described by Wirkowska et al. [17] and Tapia-Ledesma [18].
2.6. PDSC Induction Time Measurements for Fat Extracted from Ruby Chocolate
The oxidative stability of the fat extracted from the RC was determined using a DSC Q20 TA Instruments coupled with a high-pressure cell.
The procedure for the determination of PDSC induction time was described by Wirkowska-Wojdyła et al. [16] and Symoniuk et al. [19].
2.7. Thermogravimetry Analysis for Ruby Chocolate and Fat Extracted from Ruby Chocolate
The thermogravimetric study was performed using a Discovery TGA (TA Instruments) analyzer. The thermogravimetry analysis for Ruby chocolate and fat extracted from Ruby chocolate was implemented according to the procedure described by Dolatowska-Żebrowska et al. [7] and Materazzi et al. [9]. The uncertainty during the experiments did not exceed 2%.
2.8. Statistical Analysis
The data were presented as the mean ± standard deviation. One-way ANOVA was performed using Statgraphics Plus, version 13.1 (Statistical Graphics Corporation, Warrenton, VA, USA). Tukey’s multiple range test was used to consider whether differences were significant at a p-value of 0.05. The experimental design was established with a minimum of three replications.
3. Results
3.1. Fatty Acid Composition and Their Positional Distribution
The fatty acid composition of the RC is in agreement with the expectation for milk chocolate. It can be stated that the main fatty acids are C18:0, C18:1n9c and C16:0 in the proportions of 34.08%, 31.60% and 25.38%, respectively (Table 1). These fatty acids are also present in milk powder, which is used in the production of milk chocolate. In ruby chocolate, short-chain and medium-chain fatty acids like caproic, caprylic, capric, lauric and myristic acids were also found. These fatty acids are also typical for milk fat. Due to its origin, chocolate is not expected to contain polyunsaturated fatty acids in significant concentrations [20]. The content of linoleic and α-linolenic acids is determined at levels of 3.49% and 0.30%, respectively. Our results are in agreement with those obtained by Susin et al. [20] and De Olivera et al. [21] for milk chocolate.

Table 1.
Fatty acid composition (%) of fats extracted from ruby chocolate.
The positional distribution of the fatty acids between the triacylglycerol positions is typical for cocoa butter (Figure 1). Saturated palmitic and stearic acids are predominantly esterified in the sn-1 and sn-3 positions of the triacylglycerol. The percentage of these fatty acids in the sn-2 position reaches 24.57% for C16:0 and 17.05% for C18:0.
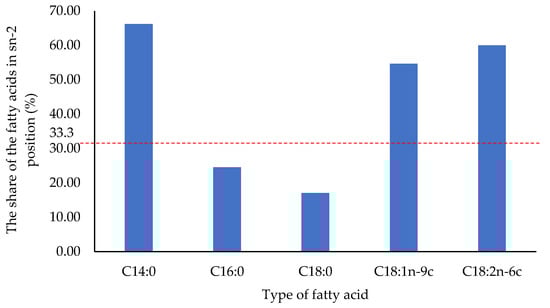
Figure 1.
Distribution of fatty acids between triacylglycerol positions of fat extracted from ruby chocolate.
The share of unsaturated oleic and linoleic acids in the sn-2 position of the triacylglycerol is 54.64 and 59.98%, respectively, which means that these fatty acids are mainly located in the internal position.
3.2. Melting Characteristics Measured by DSC
Ruby chocolate is gaining more popularity among consumers. During its production, the appropriate proportion between the solid fat ingredients, as well as the size of the crystals, determine the melting behavior of the final product and consumer satisfaction [22]. DSC has been applied to analyze changes in chocolate melting profiles and to determine the content of each crystalline form. Cocoa butter (CB), produced from traditionally processed cocoa beans, exhibits six polymorphic forms that melt in characteristic temperature ranges [23]. There are no scientific reports about the polymorphic forms of the cocoa butter obtained from unfermented cocoa beans. Therefore, it is assumed that cocoa butter can crystallize in six polymorphic forms. Fat is the most influential ingredient of each type of chocolate. In the case of RC, the fat is referred to as a mixture of cocoa butter and milk fat (MF). As a consequence of a long mixing process called conching, the MF and CB should produce a eutectic mixture that melts slowly in the mouth. CB and MF are compatible up to a limit of about 30% milk fat [24]. MF does not affect the polymorphism of CB; however, the melting point of each polymorph is lower when blended, due to the complex lipid structure of MF [25].
The melting profile of the RC is presented in Figure 2. The melting curve of the RC is characterized by two endothermic peaks. The first peak, which is wide and mild, was observed at a maximum temperature of 26.75 °C, and presents melting of form IV of the CB. The melting of form IV takes place in the temperature range of 26–28 °C [26]. The second peak, which is sharp and distinct, was observed at a maximum of 32.61 °C.
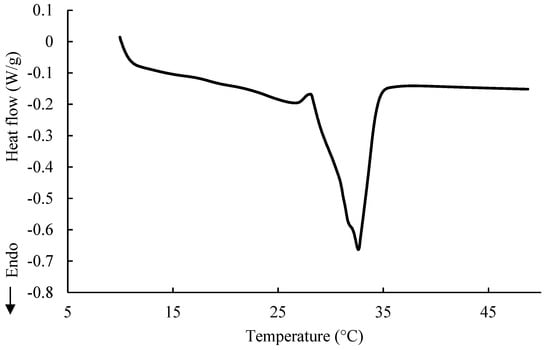
Figure 2.
DSC curve of melting of ruby chocolate.
This peak is visibly a result of two overlapping peaks and it represents the most desirable form V (mp = 33.8 °C) of CB, affected by the presence of MF and other ingredients in the chocolate mixture. Both peaks present on the DSC curve of the RC indicate that the tempering process was carried out properly.
The melting points of two types of milk chocolate (31.49 and 31.20 °C) obtained by Ostrowska-Ligęza et al. [10], were also close, but were 2 °C lower than the melting point of polymorphic form V. In chocolate, which comprises very complex mixtures, there are many interactions between the ingredients that can affect the final melting point. In addition to the influence of the milk fat on the melting behavior of chocolate, as mentioned above, there are sugar crystals that can absorb an excess of water accumulated as a result of a poorly conducted conching process and emulsifiers that reduce the interaction between the surface of the fat and the sugar: both these phenomena may provide quicker melting. For goat milk chocolate, the melting profile was also characterized by two endothermic peaks at 27.68 and 34.05 °C, referring to the melting point of polymorph IV and V [7]. However, goat milk fat triglycerides, with a domination of saturated fatty acids, are characterized by a different crystalline structure rather than by corresponding amounts of SFA (palmitic and stearic acids), which are present in cocoa butter [27]. Therefore, the melting point of goat milk chocolate was slightly higher for both existing polymorphs.
In comparison to cocoa butter, milk fat is more sensitive to oxidation and tends to decrease shelf life [28]. The most desirable polymorphic form of cocoa butter in chocolate is form V, which melts in a temperature range of 32–34 °C. The maximum melting temperature of the RC was noticed to be similar to the melting temperature of form V of cocoa butter. Hence, there are two conclusions. First, the contribution of milk fat is rather minor. Second, the curve of melting suggests a well-conducted tempering process, not disturbed by the presence of large amounts of sugar in the RC. Figure 3 presents the DSC curve of the melting of the fat extracted from the RC. It is characterized by three endothermic peaks. The first peak is very broad and mild and starts at about −60 °C, reaching a maximum at −11.30 °C. This indicates the presence of long-chain unsaturated fatty acids of a low melting temperature.
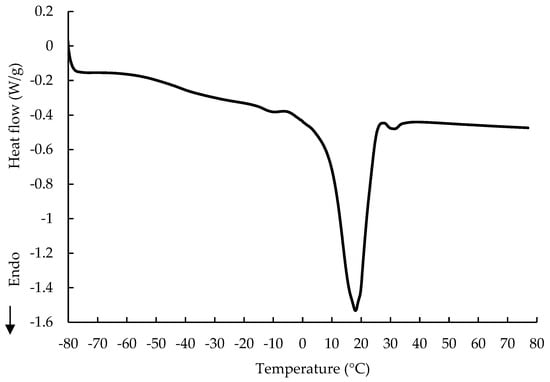
Figure 3.
Melting profile of fat extracted from ruby chocolate.
Pure milk fat has a very wide melting temperature range from −40 to 80 °C and a very diverse fatty acid profile [20]. Its addition to chocolate makes the product more prone to oxidation and blooming [29] due to its natural tendency to physical fractionation, which is a consequence of the melting points of different triacylglycerols [30].
The second peak, sharp and significant, was observed at a maximum temperature of 17.77 °C. This may indicate the melting of the first polymorphic form of cocoa butter (form γ—17.3 °C), and the melting of one or more polymorphic forms of milk fat. Form γ of cocoa butter is formed in cases of fast cooling, e.g., by putting the fat into the freezer. The characteristic peaks for milk fat, with a maximum at 14 °C obtained by Kim et al. [31] and with a maximum at 11.48 °C obtained by Ostrowska-Ligeza et al. [10], were not present on the DSC curve of the fat extracted from the RC. Milk fat is mainly liquid at room temperature, and, therefore, it affects the chocolate texture, slows down the rearrangement of fatty acid chains and inhibits the fat blooming effect [32]. The third and last melting event, barely visible, has a maximum at 31.10 °C, which is close to polymorph V of cocoa butter. The significant shift towards lower melting temperatures was observed due to the contribution of the milk fat. A fraction of the high-melting triacylglycerols present in milk fat analyzed by Ostrowska-Ligęza et al. [10] produced two peaks at 26.05 and 39.41 °C, which were not detected on the DSC curve of the fat extracted from the RC. Wang et al. [33] investigated cocoa butter, milk fat and cocoa butter mixtures and also noticed that blending cocoa butter with milk fat resulted in decreasing the melting point of the mixture and changing the shape of the curve significantly.
3.3. Oxidative Stability Measuring by PDSC
Although several methods have been used to analyze and monitor lipid oxidation [34], oxidation reactions cannot be measured by a single method due to their complexity. The history of food preparation—thermal history in the case of fats—may be crucial in understanding thermal stability. RC is produced from cocoa butter pressed from cocoa beans that have not previously been fermented nor roasted. Therefore, the melanoidins produced during the Maillard reaction, assumed by some researchers to have antioxidant properties [35], are rather of minor occurrence and may influence the induction time of the oxidation of the fat present in RC.
Table 2 presents the onset and maximum induction time (τon, τmax) values obtained during the oxidation of the fat extracted from the RC in non-isothermal mode.
Table 2.
DSC onset and maximum induction time at different temperatures (τon and τmax) for the fat extracted from ruby chocolate.
The higher the rate of heating of the samples, the bigger the onset temperature of oxidation (Figure 4).
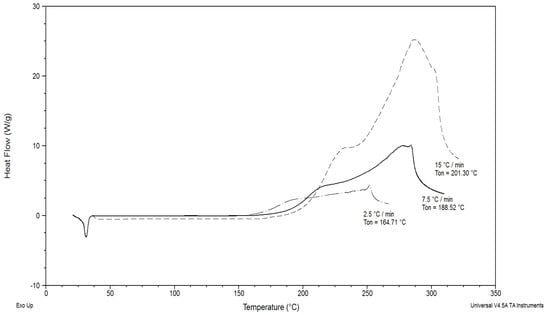
Figure 4.
DSC curves of thermal-oxidative decomposition of fat isolated from ruby chocolate; heating rates: 2.5, 7.5 and 15 °C/min.
At slow heating rates, products with a low molecular mass and intermediate oxidation are formed as a result of the oxidation reaction between the primary oxidation products (hydroperoxides) with an excess of oxygen. These compounds can accelerate the degradation process. At fast heating rates, as a result of evaporation, these intermediate products are not available in the reaction with the lipids. As a consequence, the threshold DSC signal is shifted to a high value [36].
In the non-isothermal oxidation of lipids, performed with a constant flow rate (>25 mL/min), oxygen is generated to a large excess. This allows the creation of peroxides independently of the oxygen concentration. Such a process of autooxidation can be considered as a first-order reaction [37]. This allows calculation of the kinetic parameters (Ea, Z) using Equations (1)–(4). A commonly used iso-conversion method is the Ozawa–Flynn–Wall method.
where a and b are adjustable coefficients [38]. Linear correlations were found between the logarithm of the heating rate (β) and the inverse temperature (1/T) (Equation (1)) and between the logarithm of the induction time and the inverse temperature (Equation (2)).
The related regression parameters are listed in Table 3 and Table 4, respectively.
where R is a gas constant and Z is a pre-exponential factor.
Table 3.
Regression analysis of the DSC data for the fat extracted from ruby chocolate—activation energies (Ea) and pre-exponential factors (Z) at onset and maximum temperatures (Ton and Tmax).
Table 4.
Regression analysis of the DSC data for the fat extracted from ruby chocolate—activation energies (Ea) and pre-exponential factors (Z) based on onset and maximum induction time (τon and τmax).
The results given in Table 3 show that the fat extracted from the RC is characterized by high values of activation energy of the oxidation process, 82.54 and 80.45 kJ/mol, and high pre-exponential factor Z, both calculated regarding onset and maximum temperatures, respectively. For pure milk fat, Ostrowska-Ligęza et al. [39] obtained similar but lower values of Ea (80.58 and 73.89 kJ/mol) and Z (9.52 × 10⁸ and 1.33 × 10⁷) characterizing the oxidation process, calculated for the onset and maximum temperatures, respectively.
The value of activation energy Ea and pre-exponential factor Z for the oxidation of pure cocoa butter analyzed by Cifti et al. [40] were 106.2 kJ/mol and 5.6 × 10¹⁰, respectively, regarding Ton values. Based on the Arrhenius theory, the oxidation process in the case of oil with a high Ea value is faster at high temperatures, whereas for oil with a low Ea value the process is faster at low temperatures. Activation energy should not be considered as the only parameter used to assess the oxidative stability of lipid products. [36]. In the anhydrous milk fat dynamic oxidation process, the starting temperature of oxidation is shifted to lower values with the increasing ratio of unsaturated/saturated fatty acids [37].
More importantly, the calculated kinetics parameters (Ea, Z and k) are also decreased.
Both CB and MF represent fats with a significant majority of saturated fatty acids (SFA). However, MF is a source of short fatty acids such as caproic, caprylic, lauric or myristic acid, which are more prone to oxidation than palmitic or stearic acid, typical cocoa butter ingredients. Even though cocoa butter is also a good source of oleic acid, it is predominantly composed of symmetrical triacylglycerols with oleic acid in the 2-position (POP, POS, SOS). This position of the oleic acid should not diminish the good oxidative resistance of cocoa butter [29]. Overall, it can be concluded that the presence of a small amount of MF in ruby chocolate has a noticeable influence on decreasing the oxidative resistance of the fat extracted from RC when compared with pure cocoa butter. In the second experimental procedure, the oxidative stability of the fat extracted from the ruby chocolate was assessed by measuring onset and maximum oxidation induction time (OIT) in isothermal mode (Table 4).
The values of Ea and Z of the oxidation process, calculated using regression (Equations (1)–(5) of the onset and maximum induction time for each temperature, are presented in Table 3. The higher the oxidation temperature, the shorter time needed to reach full fat sample oxidation. There is no published data for the induction time of pure cocoa butter at T = 120 °C. However, considering the high values of Ea and Z, it can be expected that pure cocoa butter has a very large OIT. The OIT measured at T = 120 °C for the fat extracted from the ruby chocolate is 61.65 min, which suggests it has a higher thermal stability than goat milk fat (OIT120°C = 21.95 min) and a comparable thermal stability to that of the fat extracted from goat milk chocolate (62.89 min) [6] and pure milk fat (OIT120°C = 51 min) [41].
3.4. Thermogravimetric Characterization
TGA is a method for the analysis of ingredients and their thermal characteristics. The results for the fat extracted from the RC, presented in Figure 5, were obtained by the use of TGA and DTG in nitrogen (a) and oxygen (b). Ostrowska-Ligęza et al. [10] studied milk fat and cocoa butter in nitrogen flow and observed one transition for each in the ranges 245–420 °C and 290–460 °C, respectively. In the RC, there was a mixture of CB and MF.
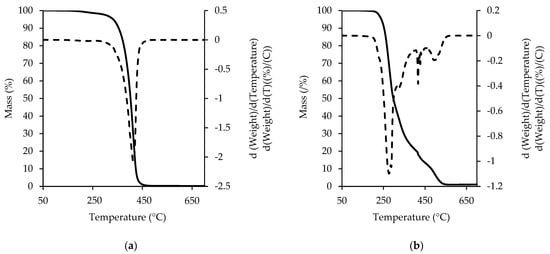
Figure 5.
TGA and DTG curve of fat extracted from ruby chocolate in nitrogen (a) and oxygen (b).
Hence, the TGA curve of the fat extracted from the RC in nitrogen (Figure 5a) gives a clear qualitative profile and shows one step of transition within the range 275–475 °C. The presence of polymorphic forms of either milk fat or cocoa butter was not observed on the TGA and DTG curves recorded in nitrogen. The presence of oxygen during the TGA analysis simulates the natural conditions that would affect the sample in the atmosphere. The oxygen affects not only the number of events but also the first release, shifting it to a lower temperature. This phenomenon can be due to quick production of the primary oxidation products, which enhance further decomposition. The TGA and DTG of the oxygen flow for the fat extracted from the RC, presented in Figure 5b, can be divided into three stages. The exact temperature ranges of the thermal events for the decomposition of the fat extracted from the RC in the oxygen flow are presented in Table 5. The first stage is considered to be the most important, and corresponds to the initial phase of the triacyloglycerol transitions. Szabo et al. [42] analyzed the oxidation behaviour of vegetable and animal fats and suggested that the first stage of thermal decay was the decomposition and oxidation of the mono- and polyunsaturated fatty acids (MUFA and PUFA) as well as the short chains of saturated fatty acids (SFA), which, in the case of the fat extracted from the RC, could especially come from milk fat [43]. The next two stages of the curve represent the decomposition of the trans isomers of fatty acids (more common for milk fat than for cocoa butter) and the saturated fatty acids (SFA). There is a noticeable but not sharp border between the second and third stages of the fat decomposition due to many secondary oxidation products and carbonization processes.
Table 5.
Temperature ranges of major transitions and mass loss [%] of components in the fat extracted from RC, as recorded in oxygen flow (25 mL /min), based on TGA/DTG curve [42].
The TGA/DTG curves of the RC in nitrogen (a) and oxygen (b) are presented in Figure 6. The measurements of the initial materials (sugar, milk fat, cocoa butter, cocoa liquor), preceding the chocolate measurements, allow the matching of the individual thermal events with specific chocolate ingredients [9,39]. The first stage of decomposition in the nitrogen flow starts at 100 °C and is related to the loss (<1%) of either citric acid (being added as acidity regulator) or of a small amount of the proteins present in the cocoa liquor. The second mass loss taking place in the range 150–250 °C is related to small molecular mass polysaccharides. The third one, in the range 250–700 °C, is the broadest and relates to all the fatty components (cocoa butter, milk fat and cocoa liquor) and the non-organic components. Slightly different thermal characteristics in the nitrogen flow were observed for milk, dark and goat milk chocolate [7,44]. The TGA/DTG curve for goat milk chocolate in nitrogen showed three stages (50–250 °C, 250–350 °C and 350–700 °C) and formed the biggest contribution to the third mass loss event in the whole chocolate. Milk and dark chocolate decomposed similarly in three stages; however, this occurred in different temperatures of 50 to 210 °C, 210 to 350 °C and 350 to 700 °C, respectively [44]. The mass loss within the first stage of decomposition was bigger for the milk and white chocolate than for the dark and goat milk chocolate. With reference to the mass loss related to sugar and fat fractions, the RC showed a decomposition pattern that was the most similar to milk chocolate.
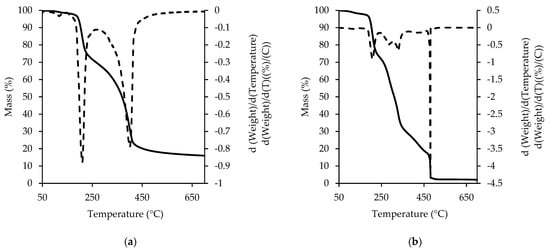
Figure 6.
TGA and DTG curve of ruby chocolate in nitrogen (a) and oxygen (b).
When the milk, dark and goat milk chocolate decompositions were studied using TGA in the oxygen flow, many differences were found between the different types of chocolate [7,44]. A minimum of three mass-loss events, sharper than in the case of the nitrogen flow, were detected on the TGA/DTG curves for all the types of chocolate except goat milk chocolate, which was characterized by two thermal events ranging within 184.67 to 230.49 °C (sugars) and 243.73 to 313.42 °C (cocoa liquor). The decomposition of goat milk chocolate finished very rapidly, below 350 °C, and this suggests a smaller oxidative stability of the fat fraction. The most distinct peak on the DTG curve of milk chocolate, with a maximum range of 211–214 °C, was sugar melting and decomposition. On the other hand, the most characteristic peak on the DTG curve of dark chocolate, representing cocoa liquor, reached a maximum within the range of 291–294 °C. The peaks characterizing fat and cocoa liquor in milk chocolate were either not present or were characterized by less intensity. Therefore, it is evident that the different processing stages required in the preparation of each type of chocolate and the different contributions of the basic ingredients affect significantly the thermal parameters of the final product.
The RC DTG curve in the oxygen purging flow showed three thermal events. The first mass loss (24.68 ± 0.58%) was observed within the range 173–240 °C and was related to the decomposition of small molecular mass polysaccharides, the most popular sugars added to chocolate. The second stage of decomposition, which ranged from 240–370 °C, was related the release of the cocoa butter (the first section of the peak with a maximum at 290 °C) and milk fat together with the fatty part of the cocoa liquor (the second section of the peak with a maximum at 330 °C). The mass loss in the second stage of decomposition was broad due to the milk fat and cocoa butter contribution (42.22 ± 0.07% to the mass of the sample) which form a eutectic mixture in the production process. The transition within this temperature range is much sharper and narrow-ranged for dark chocolate.
The third thermal event, equal to 13.33 ± 1.57% of mass loss, took place within the temperature range 455–482 °C. It was characterized by a very sharp and distinct peak and was related to the decomposition of cocoa liquor fractions and sugars. This thermal characteristic was more in agreement with milk chocolate rather than with dark chocolate.
4. Conclusions
The use of methods such as DSC, PDSC, TGA and DTG allowed us to successfully characterize a new type of chocolate—ruby chocolate. Based on the fatty acid composition, it can be concluded that RC was comparable to milk chocolate. The results obtained using isothermal and dynamic differential scanning calorimetry proved a high oxidative stability of the fats in the RC. The melting behavior of the chocolate was influenced by appropriate proportions between the solid fat ingredients, as well as the many interactions between the ingredients. The shape of the DTG curve in a nitrogen atmosphere did not indicate a cocoa liquor presence in the RC. The same phenomena were noted for the milk chocolate. The DTG curve of the fat extracted from the RC in oxygen allowed us to confirm the presence of individual groups of fatty acids. The DSC, TGA and DTG analysis may be potentially used in the process of quality assessment and the determination of possible adulterations in chocolate composition.
Author Contributions
Conceptualization, K.D.-Ż. and E.O.-L.; methodology, E.O.-L., K.D.-Ż., I.P. and R.B.; investigation, K.D.-Ż., J.B., M.W.-W. and A.G.; formal analysis, E.O.-L., A.G., M.W.-W., I.P. and R.B.; writing—original draft preparation, E.O.-L. and K.D.-Ż.; writing—review and editing, E.O.-L., A.G. and M.W.-W. All authors have read and agreed to the published version of the manuscript.
Funding
The study was financially supported by sources of the Ministry of Education and Science within funds of the Institute of Food Sciences of Warsaw University of Life Sciences (WULS), for scientific research.
Institutional Review Board Statement
Not applicable.
Informed Consent Statement
Not applicable.
Data Availability Statement
The data generated or analyzed during this study are available from the corresponding author on reasonable request.
Conflicts of Interest
The authors declare no conflict of interest.
References
- Del Prete, M.; Samoggia, A. Chocolate Consumption and Purchasing Behaviour Review: Research Issues and Insights for Future Research. Sustainability 2020, 12, 5586. [Google Scholar] [CrossRef]
- Dumarche, A.; Troplin, P.; Bernaert, H.; Lechvalier, P.; Beerens, H.; Landuyt, A. Swiss Process for Making Red or Purple Cocoa Material. Patent WO 2009/093030 Al, 22 January 2009. [Google Scholar]
- Beckett, S.T. The Science of Chocolate, 1st ed.; The Royal Society of Chemistry: Cambridge, UK, 2000; pp. 61–79. [Google Scholar]
- Šeremet, D.; Mandura, A.; Vojvodić Cebin, A.; Oskomić, M.; Champion, E.; Martinić, A.; Komes, D. Ruby chocolate—Bioactive potential and sensory quality characteristics compared with dark, milk and white chocolate. Food Health Dis. 2019, 8, 89–96. [Google Scholar]
- Bolenz, S.; Holm, M.; Langkrär, C. Improving particle size distribution and flow properties of milk chocolate produced by ball mill and blending. Eur. Food Res. Technol. 2014, 238, 139–147. [Google Scholar] [CrossRef]
- Bernardes, C.E.S.; Joseph, A.; da Piedade, M.E.M. Some Practical Aspects of Heat Capacity Determination by Differential Scanning Calorimetry. Thermochim. Acta 2020, 687, 178574. [Google Scholar] [CrossRef]
- Dolatowska-Żebrowska, K.; Ostrowska-Ligęza, E.; Wirkowska-Wojdyła, M.; Bryś, J.; Górska, A. Characterization of thermal properties of goat milk fat and goat milk chocolate by using DSC, PDSC and TGA methods. J. Therm. Anal. Calorim. 2019, 138, 2769–2779. [Google Scholar] [CrossRef]
- Rahman, M.S.; Al-Hakmani, H.; Al-Alawi, A.; Al-Marhubi, I. Thermal characteristic of freeze-dried camel milk and its major components. Thermochim. Acta 2012, 549, 116–123. [Google Scholar] [CrossRef]
- Materazzi, S.; De Angelis Curtis, S.; Vecchio Ciprioti, S.; Risoluti, R.; Finamore, J. Thermogravimetric characterization of dark chocolate. J. Therm. Anal. Calorim. 2014, 116, 93–98. [Google Scholar] [CrossRef]
- Ostrowska-Ligęza, E.; Marzec, A.; Górska, A.; Wirkowska-Wojdyła, M.; Bryś, J.; Reich, A.; Czarkowska, K. A comparative study of thermal and textural properties of milk, white and dark chocolates. Termochim. Acta 2019, 671, 60–69. [Google Scholar] [CrossRef]
- Boselli, E.; Velazco, V.; Caboni, M.F.; Lercker, G. Pressurized liquid extraction of lipids for the determination of oxysterols in egg containing food. J. Chromatogr. A 2001, 917, 239–244. [Google Scholar] [CrossRef] [PubMed]
- ISO. Animal and Vegetable Fats and Oils—Preparation of Methyl esters of Fatty Acids; International Organization for Standardization: Geneva, Switzerland, 2001; Volume 5509. [Google Scholar]
- Wirkowska-Wojdyła, M.; Bryś, J.; Ostrowska-Ligęza, E.; Górska, A.; Chmiel, M.; Słowiński, M.; Piekarska, J. Quality and oxidative stability of model meat batters as affected by interesterified fat. Int. J. Food Prop. 2019, 22, 607–617. [Google Scholar] [CrossRef]
- Bryś, J.; Vaz Flores, I.F.; Wirkowska-Wojdyła, M.; Górska, A.; Ostrowska-Ligęza, E.; Bryś, A. Use of GC and PDSC methods to characterize human milk fat substitutes obtained from lard and milk thistle oil mixtures. J. Therm. Anal. Calorim. 2017, 130, 319–327. [Google Scholar] [CrossRef]
- Ostrowska-Ligeza, E.; Wirkowska, M.; Kowalski, B. Thermokinetic analysis of corn grain fat by differential scanning calorimetry. Zywn-Nauk Technol. Ja. 2009, 1, 128–139. (In Polish) [Google Scholar]
- Wirkowska-Wojdyła, M.; Bryś, J.; Górska, A.; Ostrowska-Ligęza, E. Effect of enzymatic interesterification on physiochemical and thermal properties of fat used in cookies. LWT-Food Sci. Technol. 2016, 74, 99–105. [Google Scholar] [CrossRef]
- Wirkowska, M.; Ostrowska-Ligęza, E.; Górska, A.; Koczoń, P. Thermal properties of fats extracted from powdered baby formulas. J. Therm. Anal. Calorim. 2012, 110, 137–143. [Google Scholar] [CrossRef]
- Tapia-Ledesma, C.; Araujo-Diaz, S.B.; Dibildox-Alvarado, E.; Ornelas-Paz, J.J.; Perez-Martinez, J.D. Phase diagrams of mixtures of n-hentriacontane and saturated monoacid triacylglycerols. Thermochim. Acta 2020, 683, 178455. [Google Scholar] [CrossRef]
- Symoniuk, E.; Ratusz, K.; Krygier, K. Comparison of the oxidative stability of linseed (Linum usitatissimum L.) oil by pressure differential scanning calorimetry and Rancimat measurements. J. Food Sci. Technol. 2016, 53, 3986–3995. [Google Scholar] [CrossRef] [PubMed]
- Susin, R.C.; Mior, R.; da Costa Dias, V.M. Fatty acid and sodium contents of commercial milk chocolate—Analytical aspects and nutritional information. Braz. J. Food Technol. 2015, 18, 121–127. [Google Scholar] [CrossRef]
- de Oliveira, L.N.; de Jesus Coelho Castro, R.; de Oliveira, M.A.L.; de Oliveira, L.F.C. Lipid Characterization of White, Dark, and Milk Chocolates by FT-Raman Spectroscopy and Capillary Zone Electrophoresis. J. AOAC Int. 2015, 98, 1598–1607. [Google Scholar] [CrossRef] [PubMed]
- Afoakwa, E.; Paterson, A.; Fowler, M.; Vieira, J. Characterization of melting properties in dark chocolates from varying particle size distribution and composition using differential scanning calorimetry. Food Res. Int. 2008, 41, 751–757. [Google Scholar] [CrossRef]
- Lipp, M.; Simoneau, C.; Ulberth, F.; Anklam, E.; Crews, C.; Brereton, P.; De Greyt, W.; Schwack, W.C.; Wiedmaier, C. Composition of genuine cocoa butter and cocoa butter equivalents. J. Food Compos. Anal. 2001, 14, 399–408. [Google Scholar] [CrossRef]
- Chapman, G.M.; Akehurst, E.E.; Wright, W.B. Cocoa butter and confectionery fats. Studies using programmed temperature X-ray diffraction and differential scanning calorimetry. J. Am. Oil Chem. Soc. 1971, 48, 824–830. [Google Scholar] [CrossRef]
- Metin, S.; Hartel, R.W. Crystallization behavior of blends of cocoa butter and milk fat or milk fat fractions. J. Therm. Anal. 1996, 47, 1527–1544. [Google Scholar] [CrossRef]
- Glicerina, V.; Balestra, F.; Dall Rosa, M.; Romani, S. Rheological, textural and calorimetric modifications of dark chocolate during process. J. Food Eng. 2013, 119, 173–179. [Google Scholar] [CrossRef]
- Haylock, S.J.; Dodds, T.M. Ingredients from milk. In Industrial Chocolate Manufacture and Use; Beckett, S.T., Ed.; Blackwell Science: Oxford, UK, 1999; pp. 137–152. [Google Scholar]
- Afoakwa, E.; Paterson, A.; Fowler, M. Factors influencing rheological and textural qualities in chocolate a review. Trends Food Sci. Technol. 2007, 18, 290–298. [Google Scholar] [CrossRef]
- Wang, F.; Liu, Y.; Shan, L.; Jin, Q.; Wang, X.; Li, L. Blooming in Cocoa Butter Substitutes Based Compound Chocolate: Investigations on Composition, Morphology and Melting Behavior. J. Am. Oil Chem. Soc. 2010, 87, 1137–1143. [Google Scholar] [CrossRef]
- Antila, V. Milk Industry. 1979; 81, 17. [Google Scholar]
- Kim, E.; Chen, X.; Pearce, D. Surface composition of industrial spray-dried milk powders. 3.Changes in the surface composition during long-term storage. J. Food. Eng. 2009, 94, 182–191. [Google Scholar] [CrossRef]
- German, J.B.; Dillard, C.J. Fractionated milk fat. Food Technol. 1998, 52, 33–37. [Google Scholar]
- Wang, F.; Liu, Y.; Jin, Q.; Meng, Z.; Wang, X. Characterization of cocoa butter substitutes, milk fat and cocoa butter mixtures. Eur. J. Lipid Sci. Technol. 2011, 113, 1145–1151. [Google Scholar] [CrossRef]
- Kamal-Eldin, A.; Pokorn, J. Lipid oxidation products and methods used for their analysis. In Analysis of Lipid Oxidation; Kamal-Eldin, A., Pokorny, J., Eds.; AOCS Publishing: Urbana, IL, USA, 2005; ISBN 978-1-4398-2239-5. [Google Scholar]
- Morales, F.J.; Jimenez-Perez, S. Peroxyl radical scavenging activity of melanoidins in aqueous systems. Eur. Food Res. Technol. 2004, 218, 515–520. [Google Scholar] [CrossRef]
- Saldaña, M.D.; Martínez-Monteagudo, S.I. Oxidative Stability of Fats and Oils Measured by Differential Scanning Calorimetry for Food and Industrial Applications. In Applications of Calorimetry in a Wide Context—Differential Scanning Calorimetry, Isothermal Titration Calorimetry and Microcalorimetry; Elkordy, A.A., Ed.; licensee InTech: London, UK, 2013. [Google Scholar] [CrossRef]
- Martínez-Monteagudo, S.I.; Saldaña, M.D.; Kennelly, J.J. Kinetics of non-isothermal oxidation of anhydrous milk fat rich conjugated linoleic acid using differential scanning calorimetry. J. Therm. Anal. Calorim. 2012, 107, 973–981. [Google Scholar] [CrossRef]
- Wirkowska-Wojdyła, M.; Bryś, J.; Górska, A.; Ostrowska-Ligęza, E. Oxidation kinetics and melting profiles of the structured lipids used in infant cookies. Eur. J. Lipid Sci. Technol. 2014, 116, 1546–1552. [Google Scholar] [CrossRef]
- Ostrowska-Ligęza, E.; Wirkowska, M.; Górska, A. Thermal analysis of milk fat with a use of differential scanning calorimetry. Zesz. Probl. Postępów Nauk. Rolniczych 2011, 558, 171–185. (In Polish) [Google Scholar]
- Cifti, O.N.; Kowalski, B.; Gogus, F.; Fadiloglu, S. Effect of the addition of a cocoa butter-like fat enzymatically produced from olive pomace oil on the oxidative stability of cocoa butter. J. Food Sci. 2009, 74, 184–190. [Google Scholar] [CrossRef]
- Bryś, J.; Wirkowska, M.; Górska, A.; Ostrowska-Ligęza, E.; Żubrżycka, K. Characteristic of structure lipids derived by interestrification of milk fat and fish oil concentrate. Bromat. Chem. Toksykol. 2012, 3, 477–481. (In Polish) [Google Scholar]
- Szabo, M.; Chambre, D.; Iditoiu, C. TG/DTG/DTA for the oxidation behaviour characterization of vegetable and animal fats. J. Therm. Anal. Calorim. 2012, 110, 281–285. [Google Scholar] [CrossRef]
- Lipp, M.; Anklam, E. Review of cocoa butter and alternative fats for use in chocolate—Part A. Composition of data. Food Chem. 1998, 62, 73–97. [Google Scholar] [CrossRef]
- Ostrowska-Ligęza, E.; Górska, A.; Wirkowska-Wojdyła, M.; Bryś, J.; Dolatowska-Żebrowska, K.; Shamilowa, M.; Ratusz, K. Thermogravimetric characterization of dark and milk chocolates at different processing stages. J. Therm. Anal. Calorim. 2018, 134, 623–631. [Google Scholar] [CrossRef]
Disclaimer/Publisher’s Note: The statements, opinions and data contained in all publications are solely those of the individual author(s) and contributor(s) and not of MDPI and/or the editor(s). MDPI and/or the editor(s) disclaim responsibility for any injury to people or property resulting from any ideas, methods, instructions or products referred to in the content. |
© 2023 by the authors. Licensee MDPI, Basel, Switzerland. This article is an open access article distributed under the terms and conditions of the Creative Commons Attribution (CC BY) license (https://creativecommons.org/licenses/by/4.0/).