
An Analysis of Artificial Intelligence Techniques in Surveillance Video Anomaly Detection: A Comprehensive Survey

 ,
, 
 , , and
Abstract
1. Introduction
- A comprehensive survey of state-of-the-art AI approaches for SVAD was conducted. This analysis thoroughly examined the current research in the field, highlighting the most-popular techniques and methodologies used in SVAD.
- The commonly used datasets, needs, and issues of SVAD were explored in depth. This examination provides insight into the challenges faced by researchers in this field and the specific requirements of the datasets used for SVAD.
- The trade-offs in SVAD are discussed from the viewpoint of the performance of approaches that use AI techniques. This analysis provides a nuanced understanding of the trade-offs between performance and other factors, such as computational complexity and scalability.
- Areas of application, challenges, and possible future work in the field of AI for SVAD are presented. This examination provides a comprehensive overview of the potential applications of SVAD and the challenges that must be overcome to realize AI’s potential in this field.
2. Related Works
- Point anomalies: These occur when only the entity’s data behave somewhat irregularly compared to the rest of the data. Most research on anomaly identification focuses on this form of anomaly because it is the most basic. A car in the middle of the road can be termed a point anomaly.
- Contextual anomalies: These occur when a data value behaves irregularly compared to the rest of the data in a particular context. The context includes the observer’s subjectivity and overall perception of the situation. Parking a passenger car in a bus-only car park can be considered a contextual anomaly.
- Collective anomalies: These occur when a collection of data samples is considered abnormal compared to the real data. A group of people gathered at the exit of a door can be called a collective anomaly.
Existing AI Techniques in SVAD
3. Analysis of AI Techniques in SVAD
3.1. Learning
3.1.1. Supervised Learning
3.1.2. Unsupervised Learning
3.1.3. Semi-Supervised Learning
3.1.4. Supervised vs. Unsupervised vs. Semi-Supervised
3.2. Algorithms
3.2.1. Statistics-Based Algorithms
3.2.2. Classification-Based Algorithms
3.2.3. Reconstruction-Based Algorithms
3.2.4. Prediction-Based Algorithms
3.2.5. Other Algorithms
3.2.6. Analysis of Algorithms
4. Analysis of the Existing Datasets
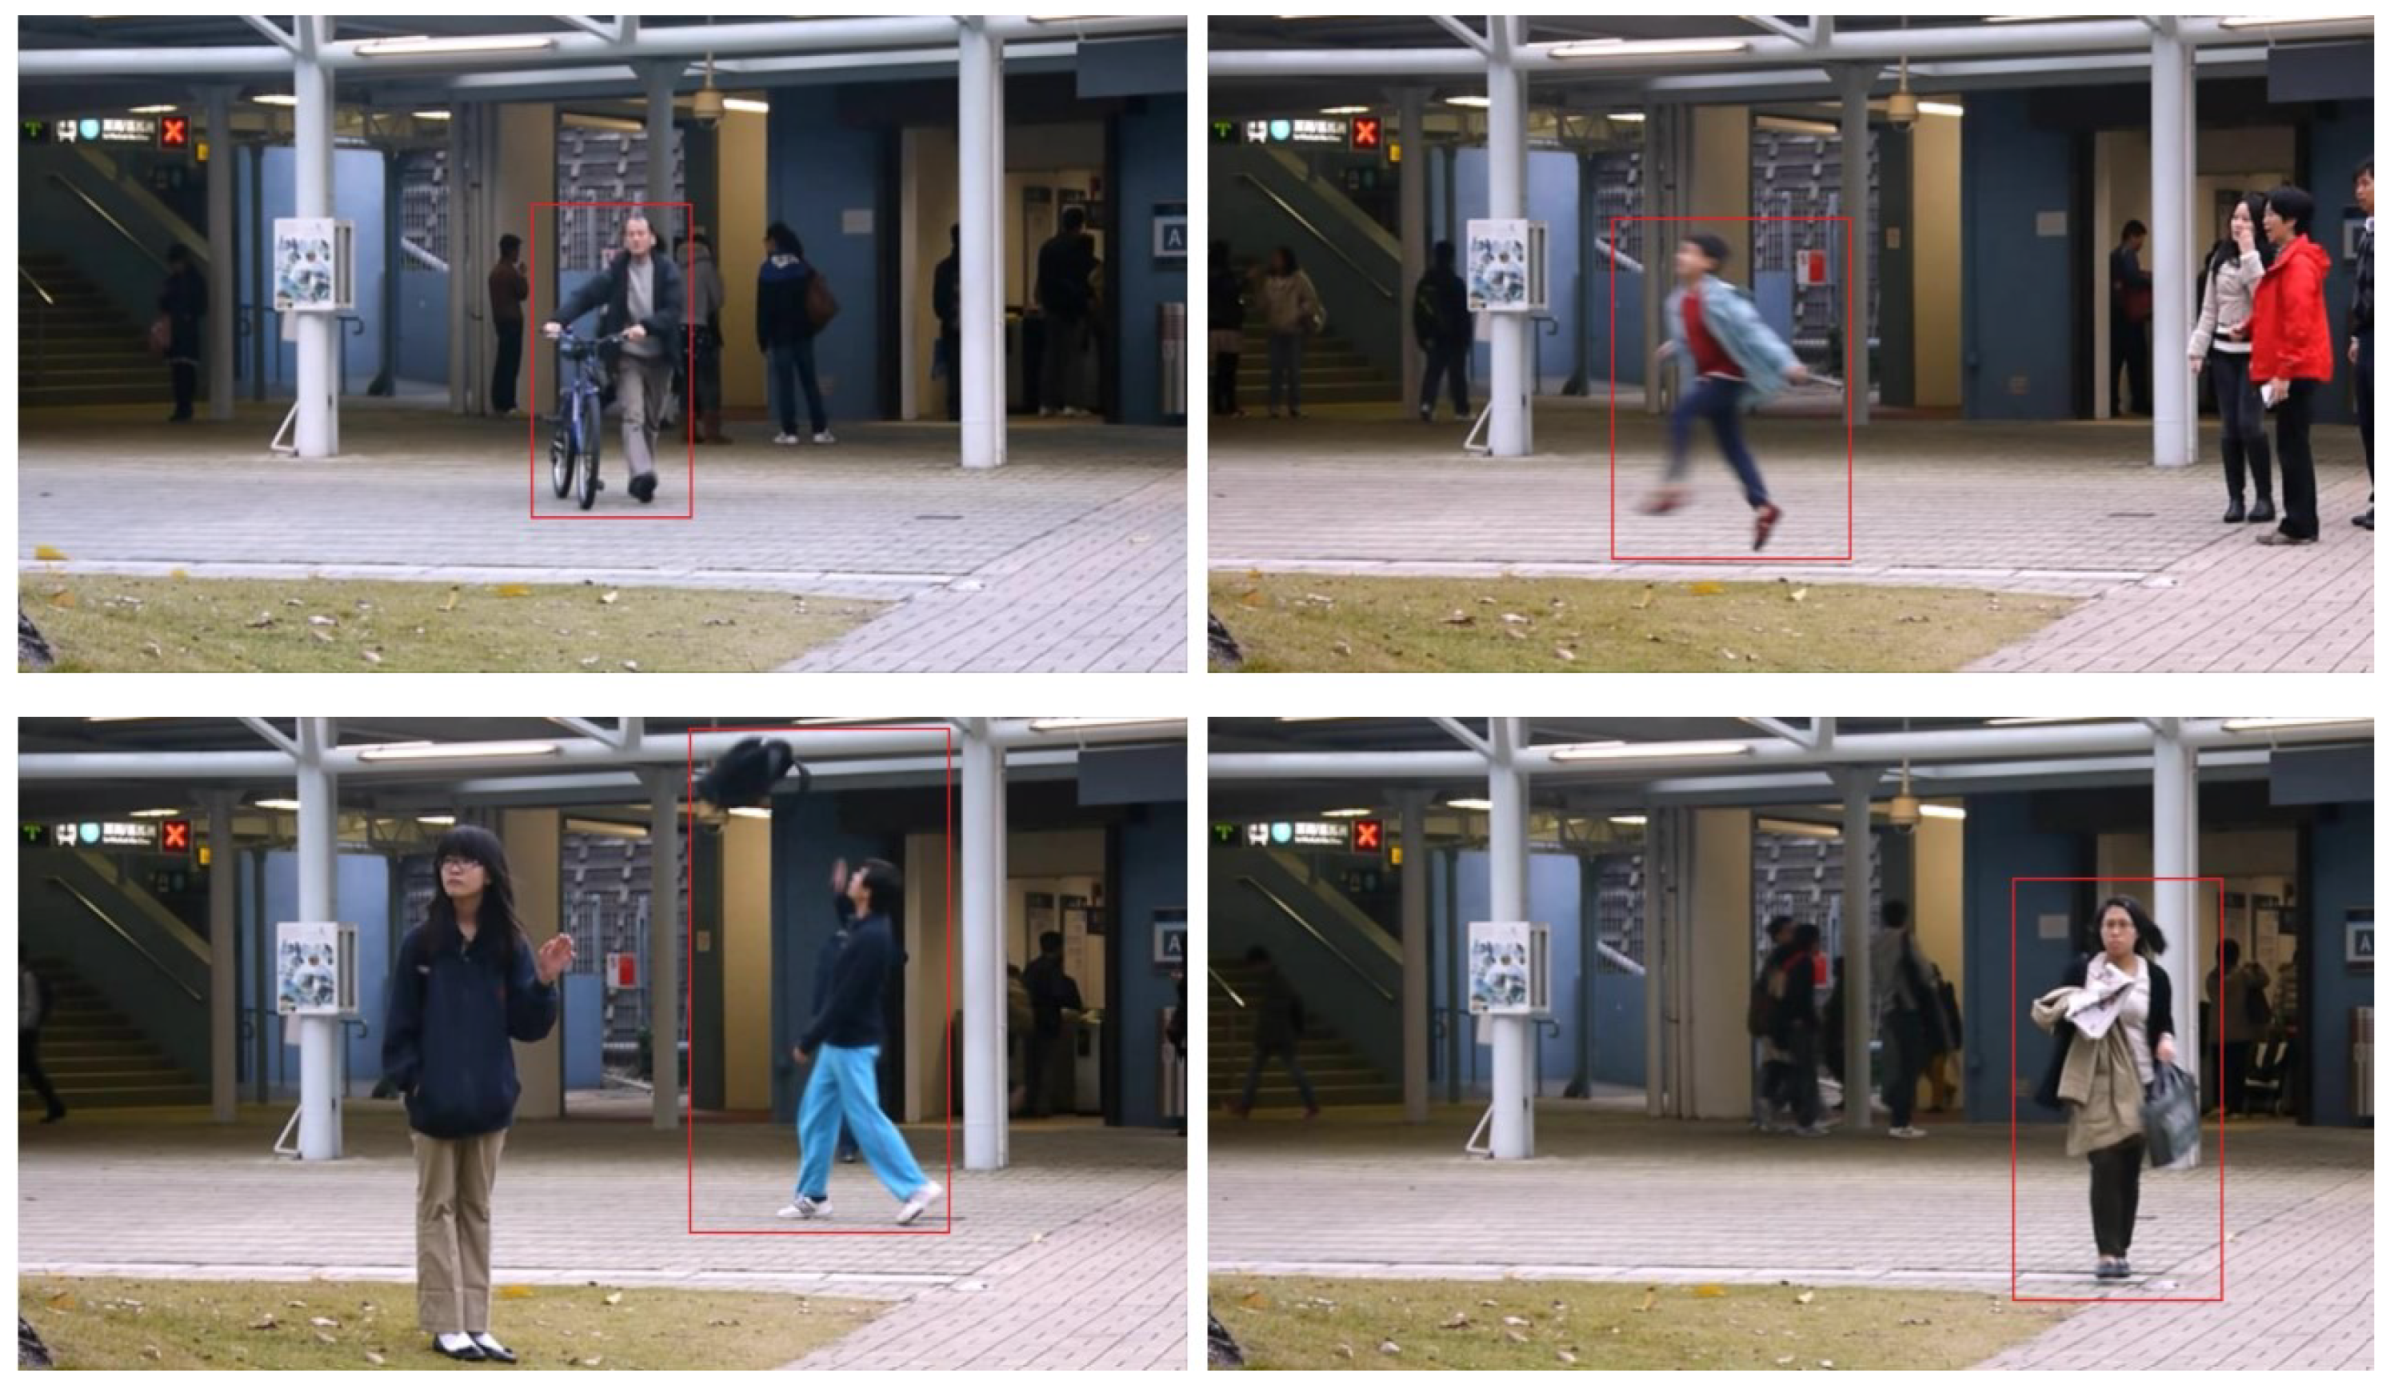
4.1. CUHK Avenue Dataset
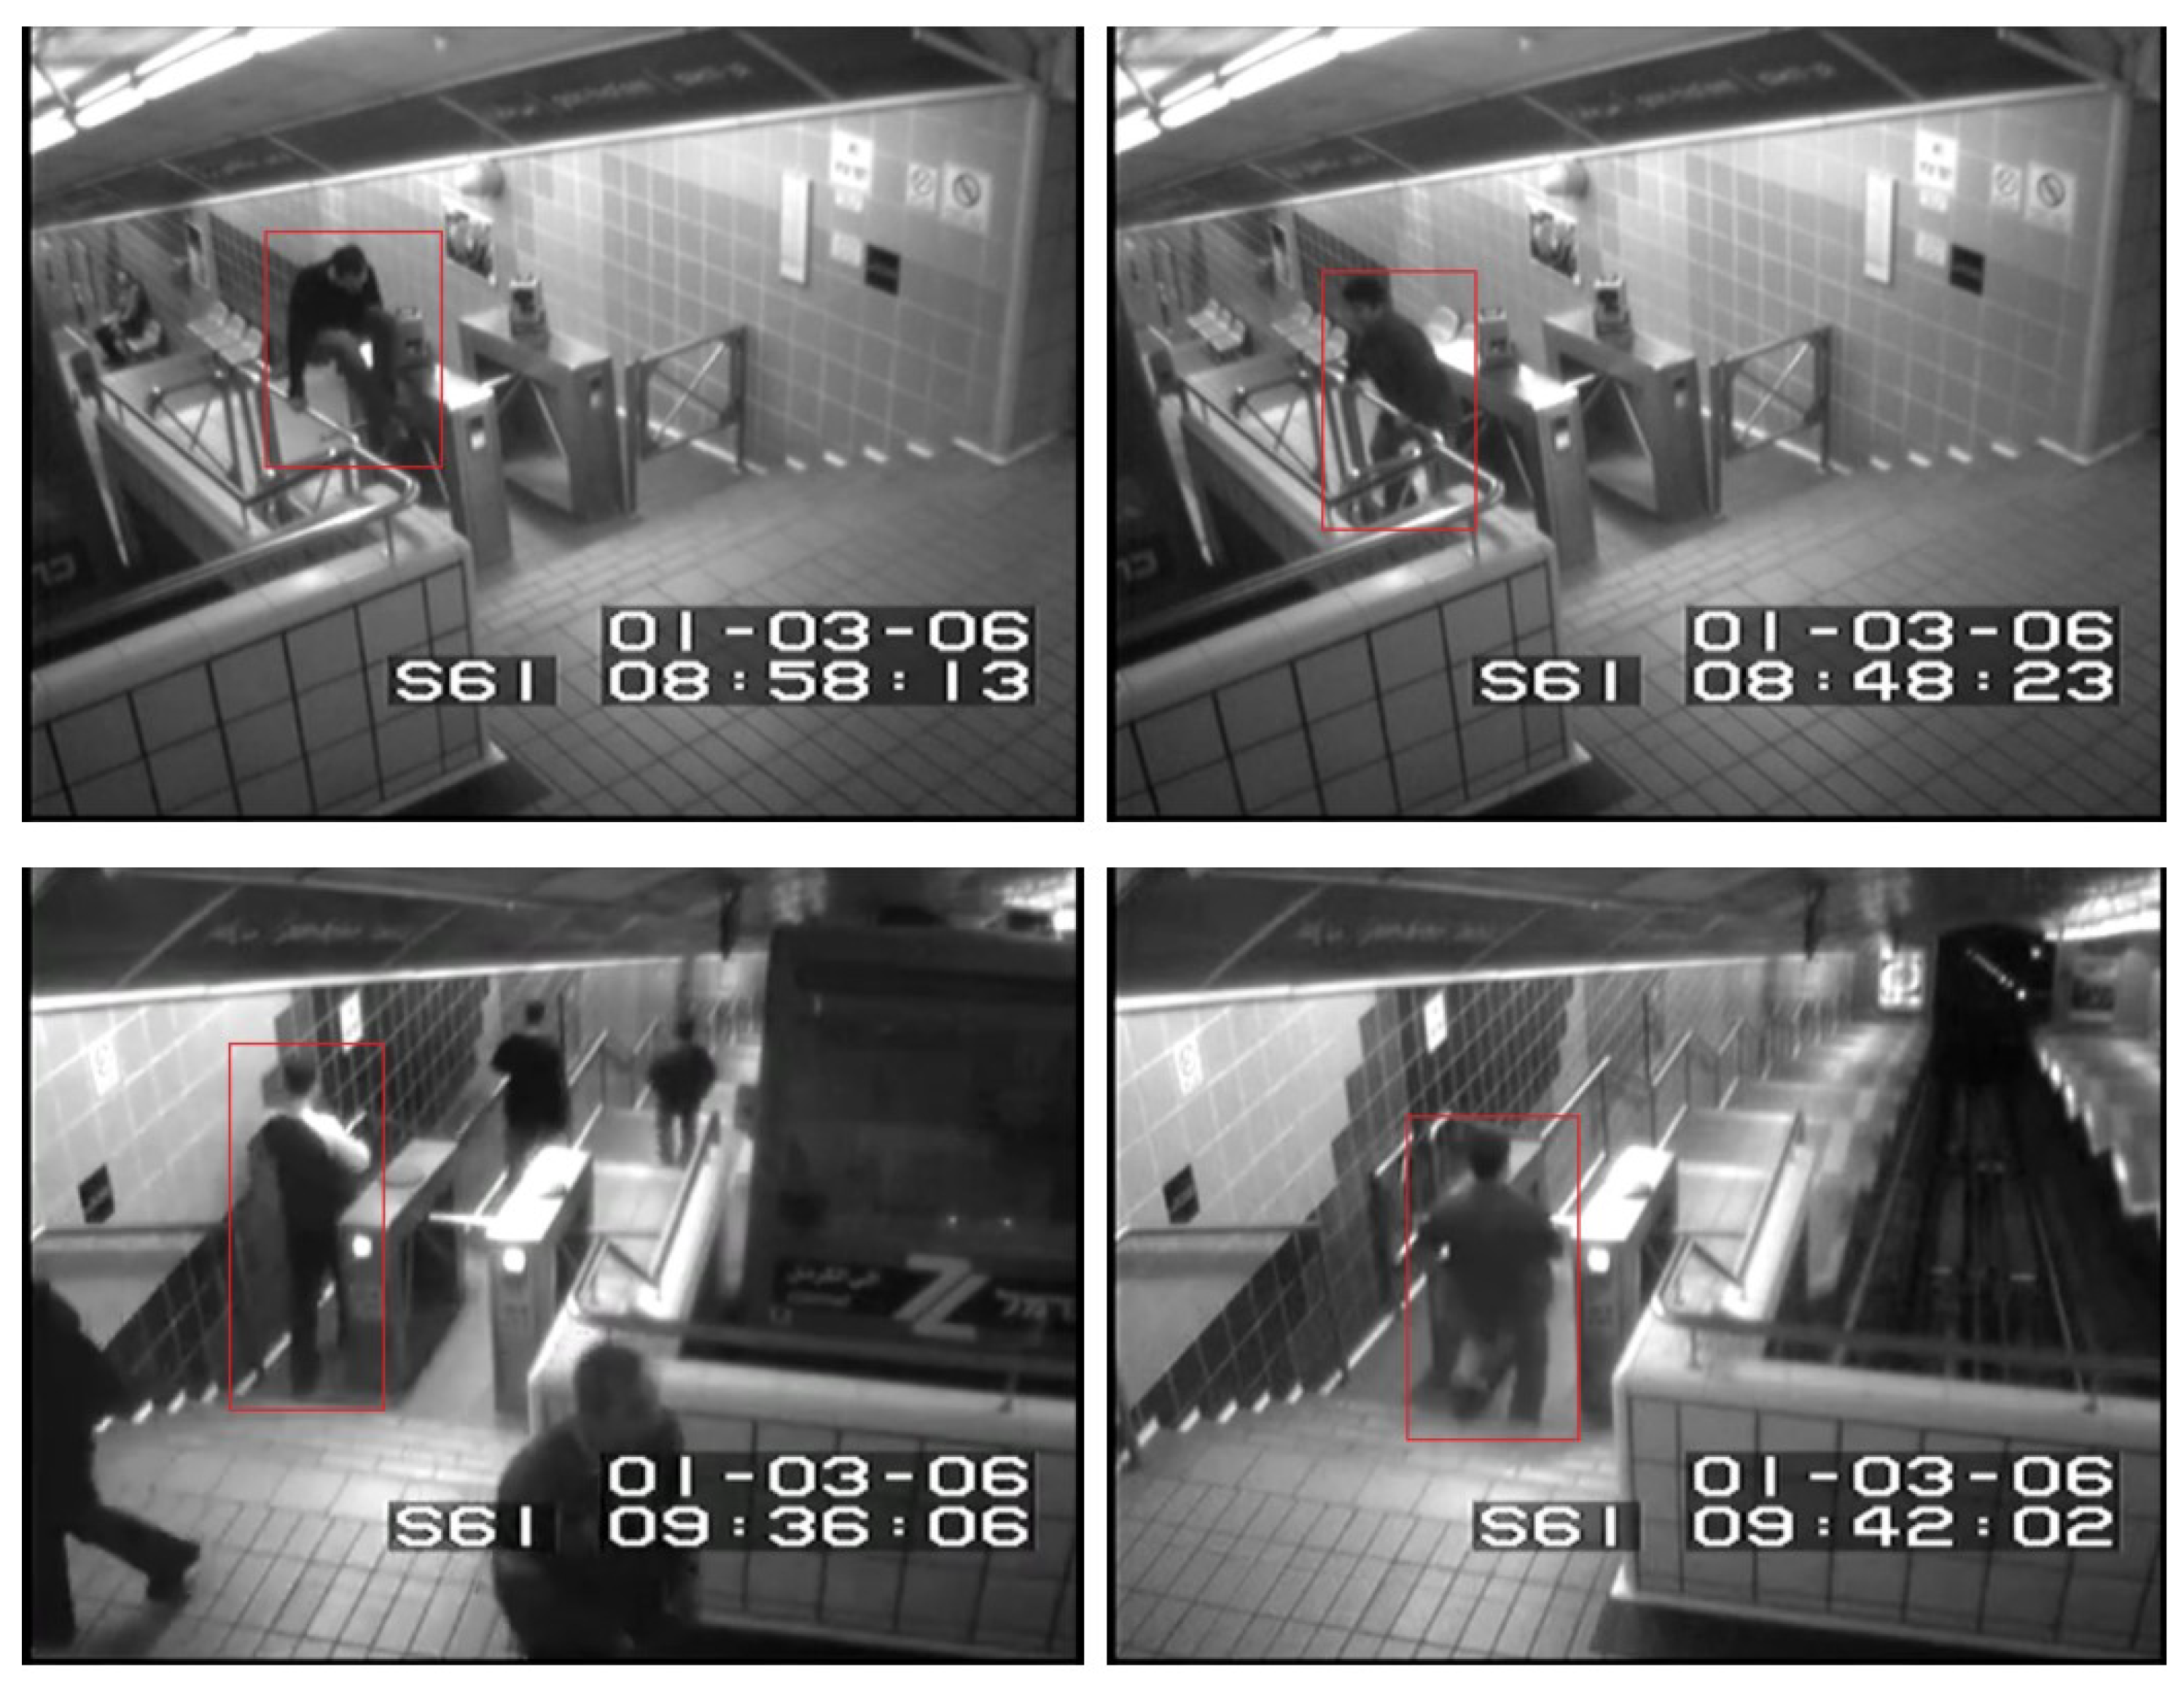
4.2. Subway Dataset
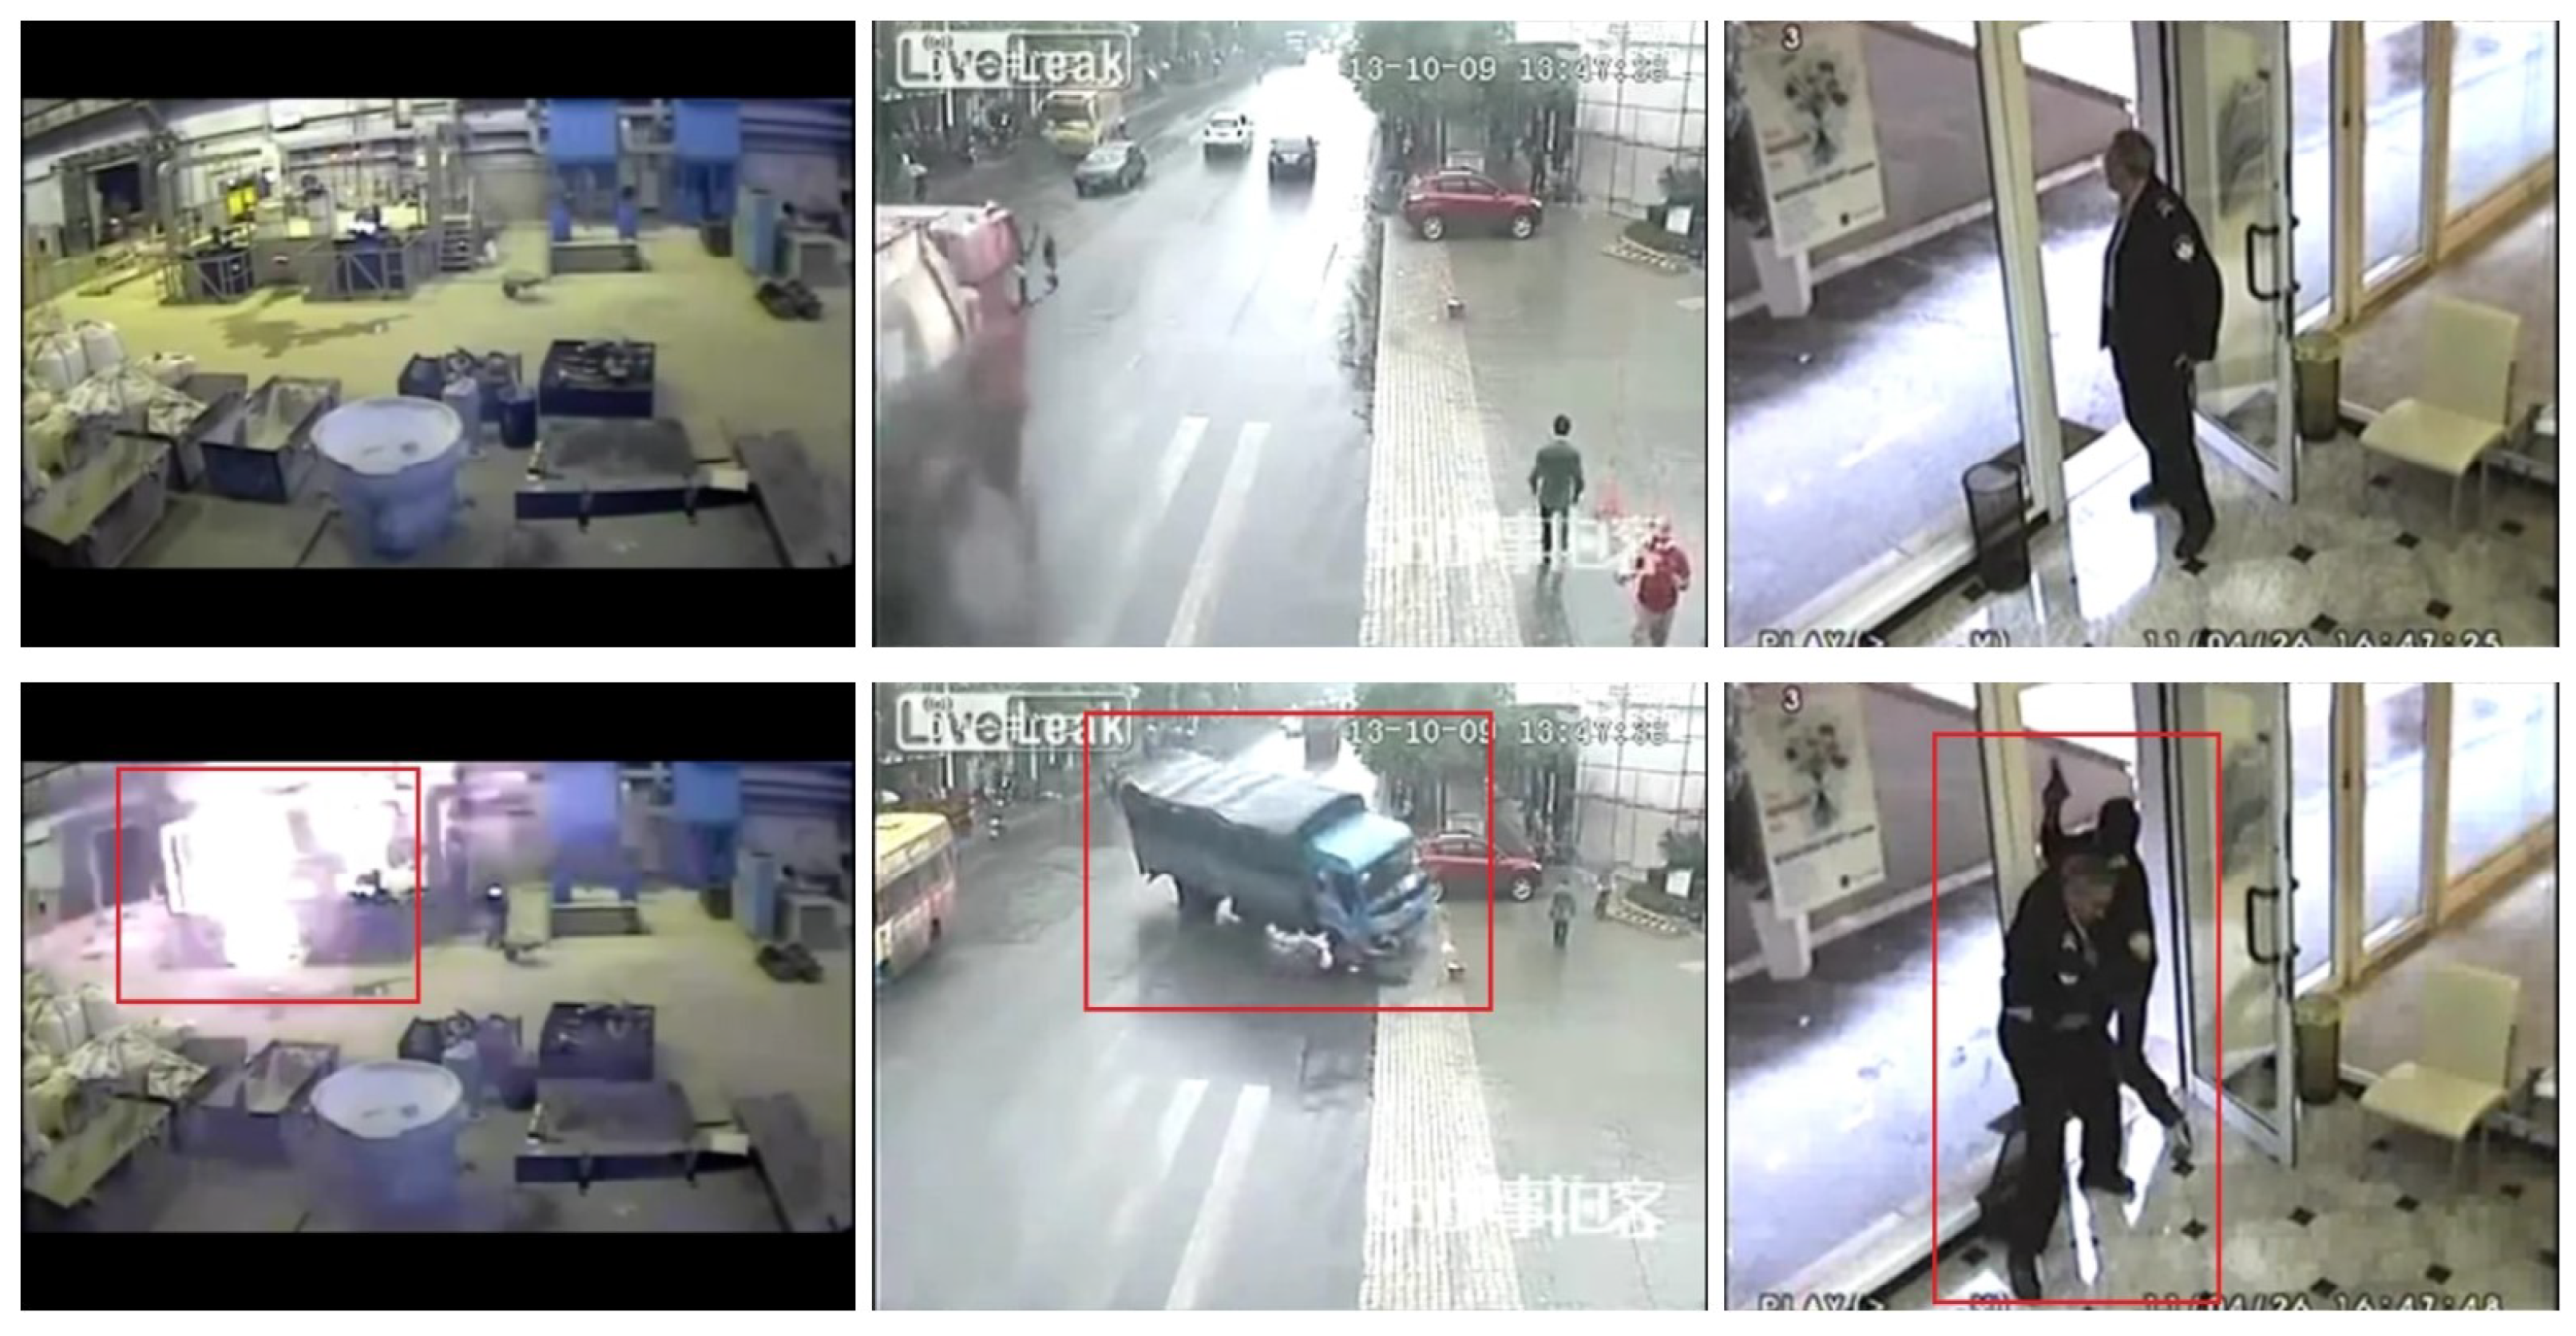
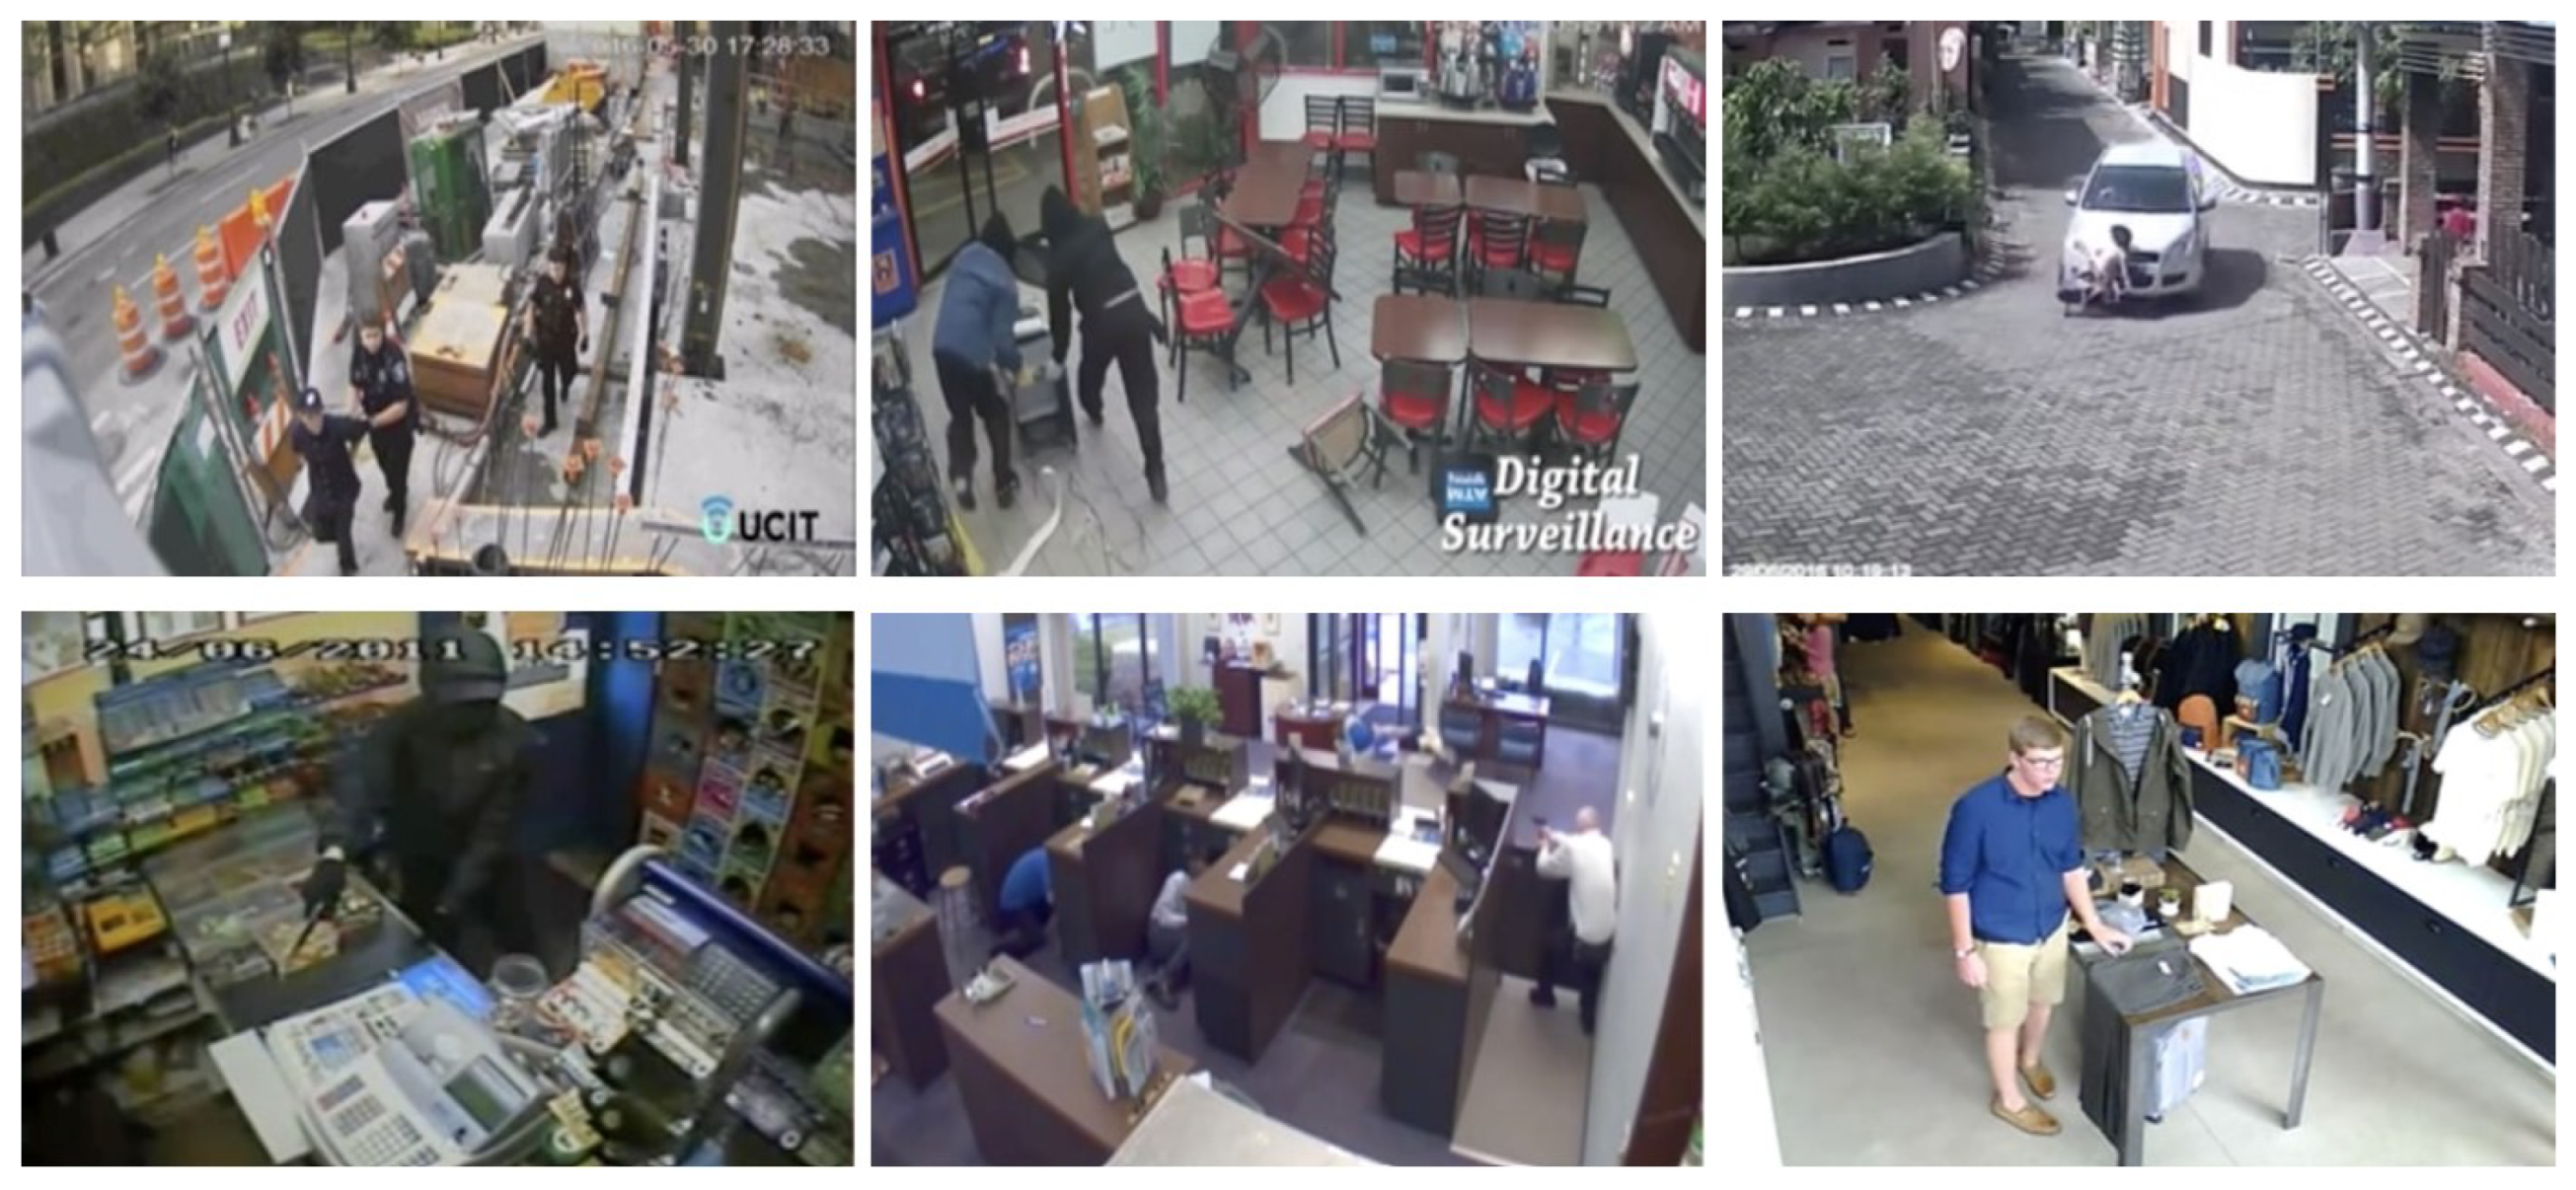
4.3. UCF-Crime Dataset
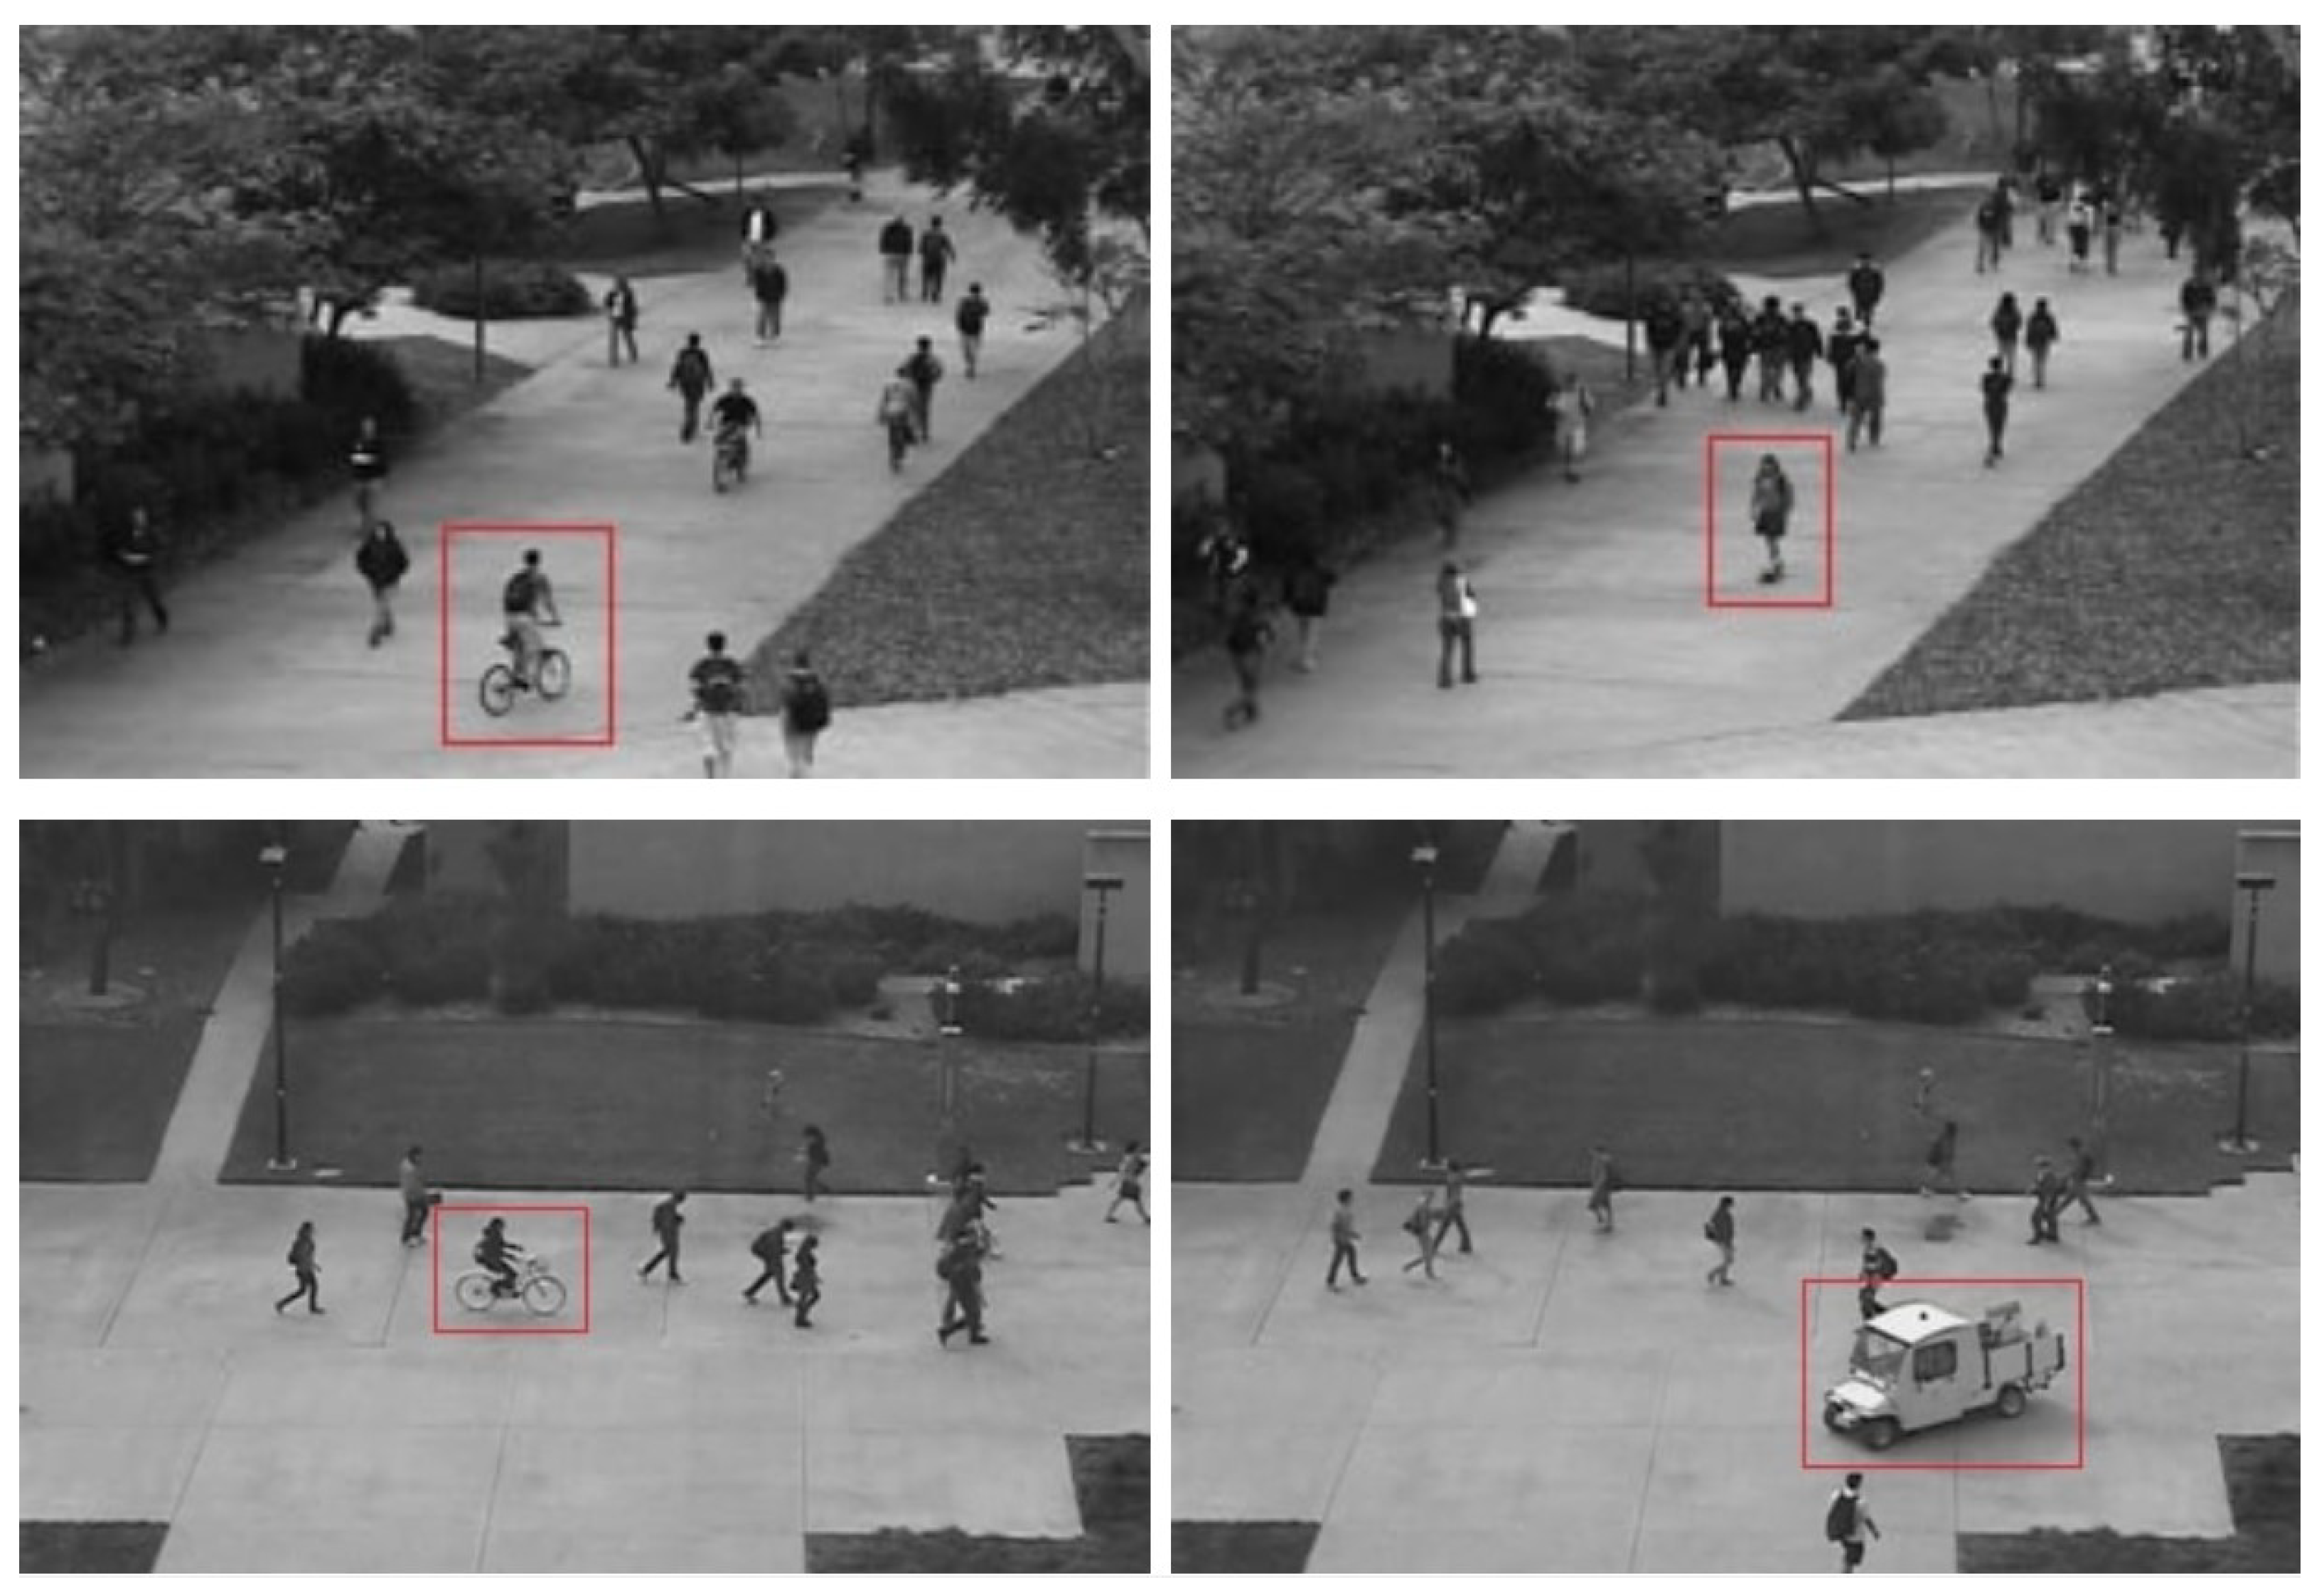
4.4. UCSD Dataset
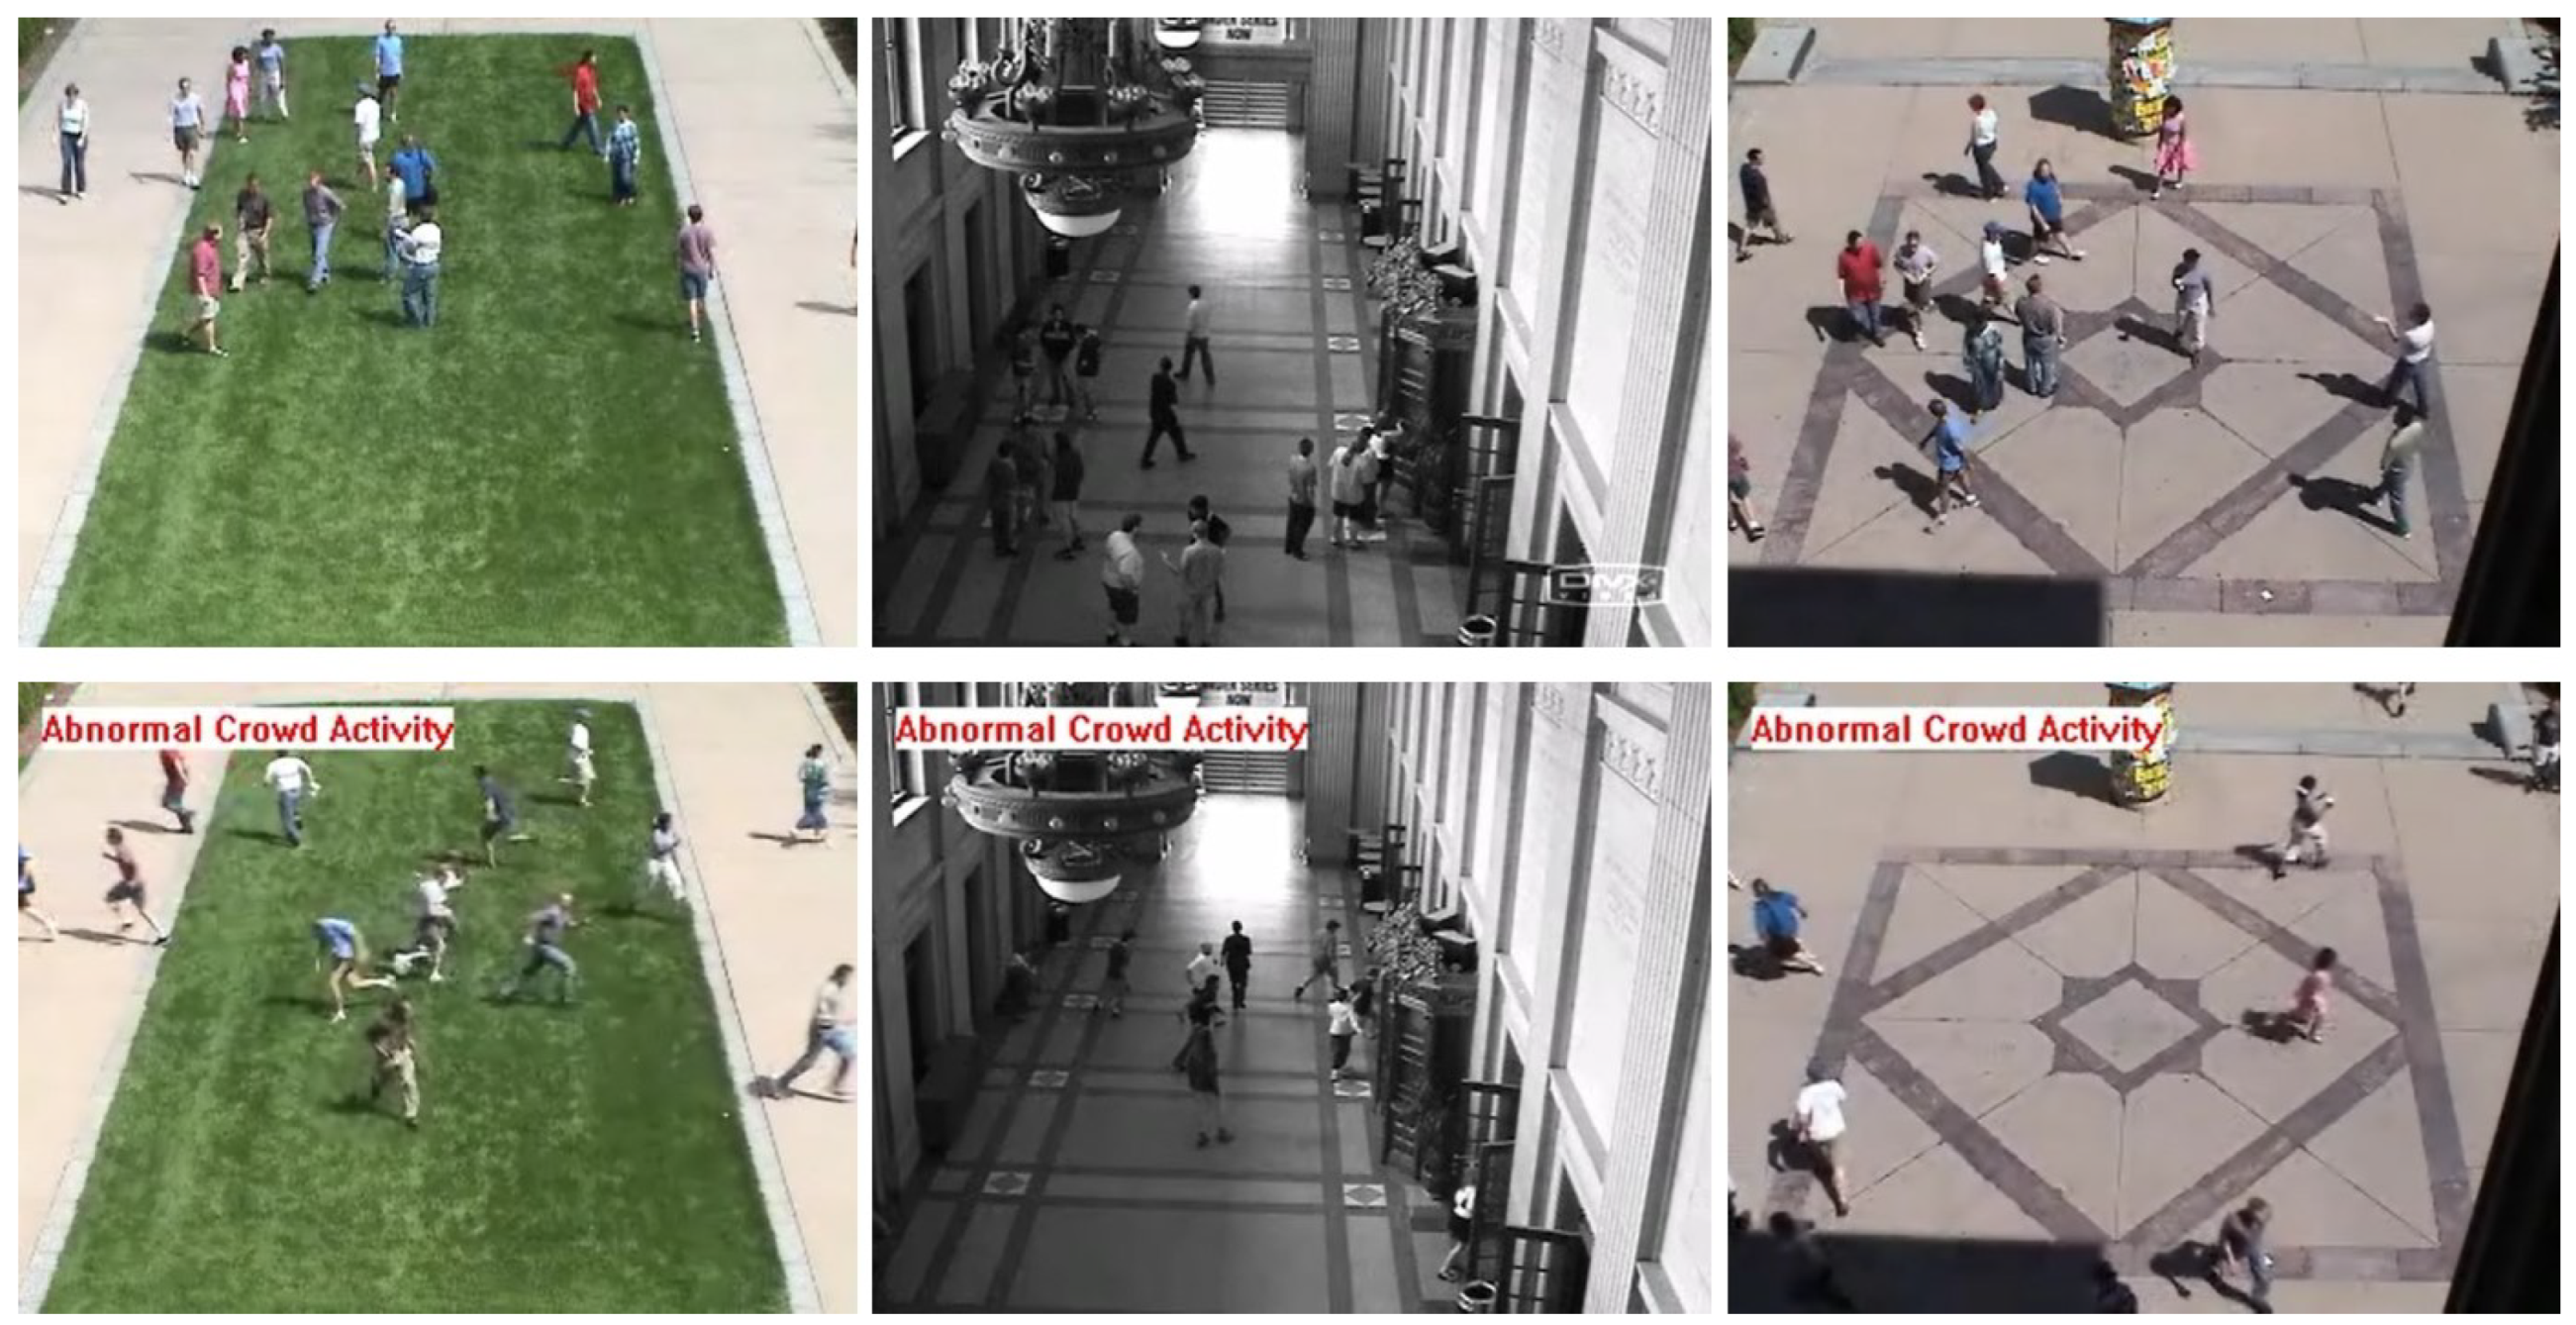
4.5. UMN Dataset
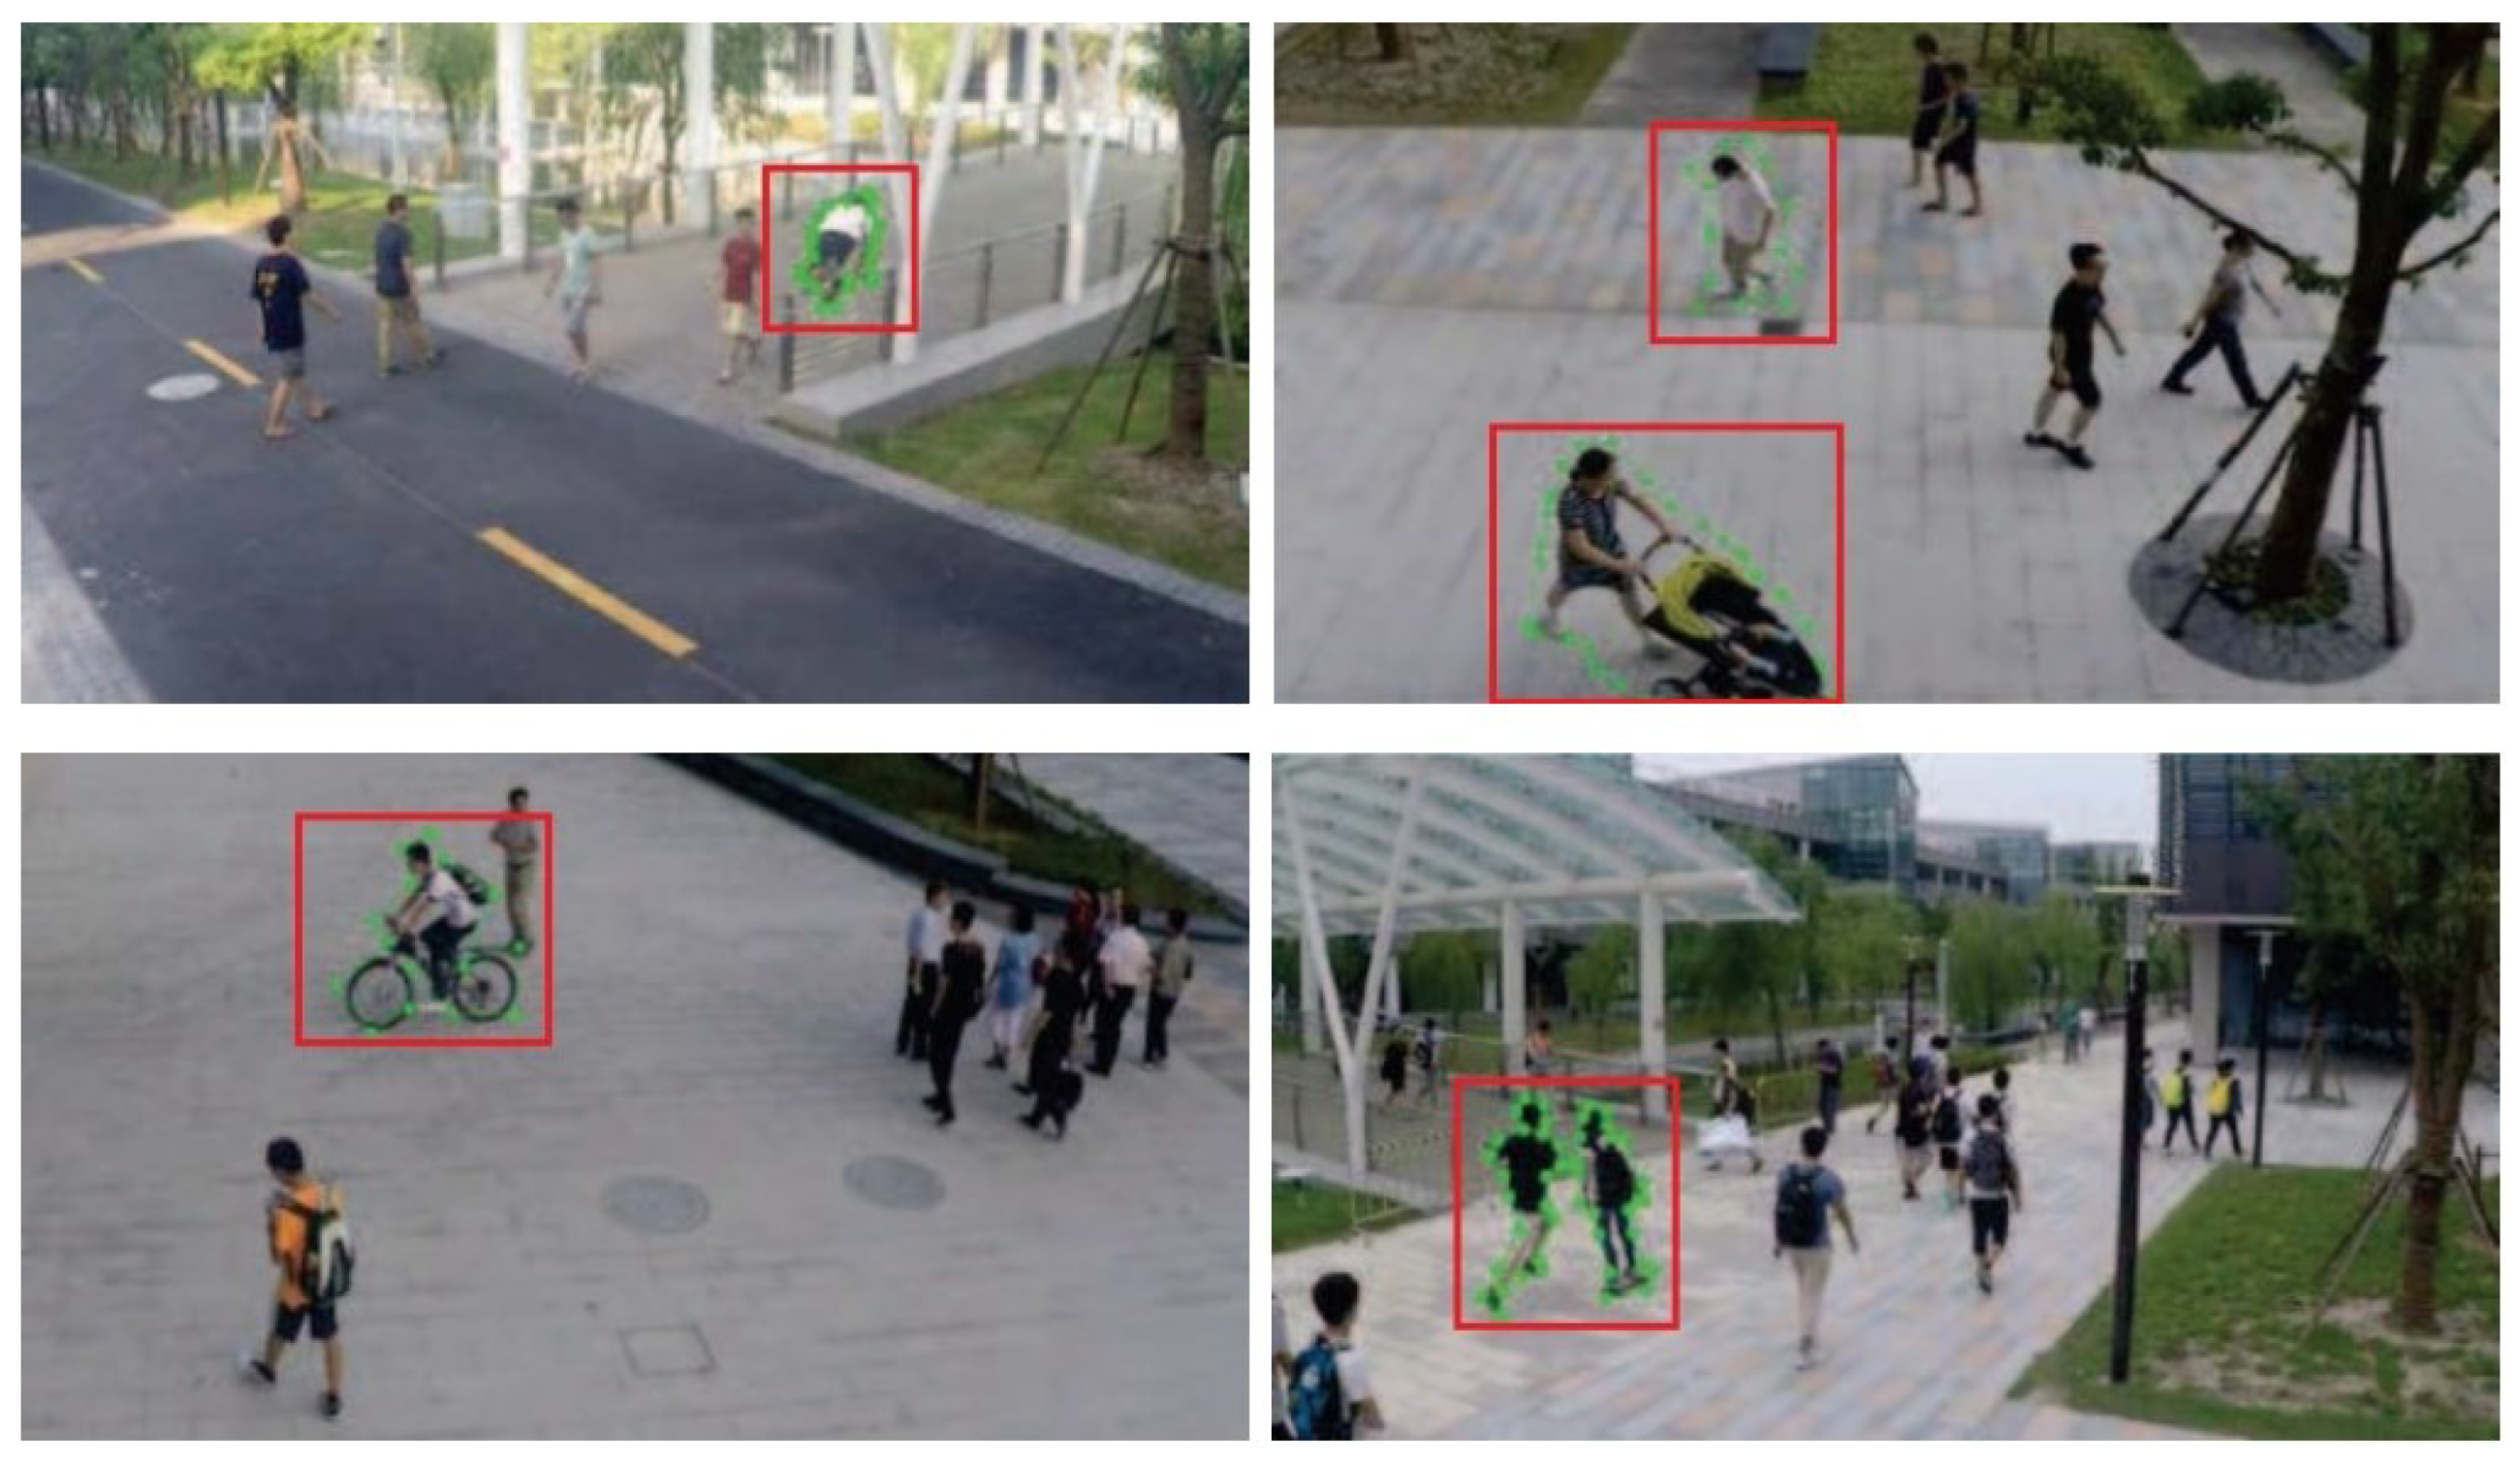
4.6. ShanghaiTech Dataset
4.7. HR-Crime Dataset
4.8. Comparison of Surveillance Datasets
4.8.1. Based on Recording Environment
4.8.2. Based on Color Space
4.8.3. Based on Ground Truth Labeling
5. Evaluation of the Performance of Existing Applications
6. Discussion
6.1. Current Developments
6.2. Limitations and Challenges
6.3. Future Directions
7. Conclusions
Author Contributions
Funding
Institutional Review Board Statement
Informed Consent Statement
Data Availability Statement
Conflicts of Interest
References
- Kumari, P.; Bedi, A.K.; Saini, M. Multimedia Datasets for Anomaly Detection: A Survey. arXiv 2021, arXiv:2112.05410. [Google Scholar]
- Verma, K.K.; Singh, B.M.; Dixit, A. A review of supervised and unsupervised machine learning techniques for suspicious behavior recognition in intelligent surveillance system. Int. J. Inf. Technol. 2019, 14, 397–410. [Google Scholar] [CrossRef]
- Zhao, Y. Deep Learning in Video Anomaly Detection and Its Applications. Ph.D. Thesis, The University of Liverpool, Liverpool, UK, 2021. [Google Scholar]
- Abu Al-Haija, Q.; Zein-Sabatto, S. An Efficient Deep-Learning-Based Detection and Classification System for Cyber-Attacks in IoT Communication Networks. Electronics 2020, 9, 2152. [Google Scholar] [CrossRef]
- Grubbs, F.E. Procedures for detecting outlying observations in samples. Technometrics 1969, 11, 1–21. [Google Scholar] [CrossRef]
- Hawkins, D.M. Identification of Outliers; Springer: Berlin/Heidelberg, Germany, 1980; Volume 11. [Google Scholar]
- Barnett, V.; Lewis, T. Outliers in Statistical Data; Wiley Series in Probability and Mathematical Statistics. Applied Probability and Statistics; Wiley: New York, NY, USA, 1984. [Google Scholar]
- Wan, B.; Jiang, W.; Fang, Y.; Luo, Z.; Ding, G. Anomaly detection in video sequences: A benchmark and computational model. IET Image Process. 2021, 15, 3454–3465. [Google Scholar] [CrossRef]
- Aldayri, A.; Albattah, W. Taxonomy of Anomaly Detection Techniques in Crowd Scenes. Sensors 2022, 22, 6080. [Google Scholar] [CrossRef]
- Pannirselvam, P.M.; Geetha, M.K.; Kumaravelan, G. A Comprehensive Study on Automated Anomaly Detection Techniques in Video Surveillance. Ann. Rom. Soc. Cell Biol. 2021, 25, 4027–4037. [Google Scholar]
- Chandola, V.; Banerjee, A.; Kumar, V. Anomaly detection: A survey. ACM Comput. Surv. (CSUR) 2009, 41, 1–58. [Google Scholar] [CrossRef]
- Abdelghafour, M.; ElBery, M.; Taha, Z. Comparative Study for Anomaly Detection in Crowded Scenes. Int. J. Intell. Comput. Inf. Sci. 2021, 21, 84–94. [Google Scholar] [CrossRef]
- Wilmet, V.; Verma, S.; Redl, T.; Sandaker, H.; Li, Z. A Comparison of Supervised and Unsupervised Deep Learning Methods for Anomaly Detection in Images. arXiv 2021, arXiv:2107.09204. [Google Scholar]
- Abu Al-Haija, Q.; Alohaly, M.; Odeh, A. A Lightweight Double-Stage Scheme to Identify Malicious DNS over HTTPS Traffic Using a Hybrid Learning Approach. Sensors 2023, 23, 3489. [Google Scholar] [CrossRef] [PubMed]
- Medel, J.R. Anomaly Detection Using Predictive Convolutional Long Short-Term Memory Units; Rochester Institute of Technology: Rochester, NY, USA, 2016. [Google Scholar]
- Le, V.T.; Kim, Y.G. Attention-based residual autoencoder for video anomaly detection. Appl. Intell. 2022, 53, 3240–3254. [Google Scholar] [CrossRef]
- Liu, W.; Cao, J.; Zhu, Y.; Liu, B.; Zhu, X. Real-time anomaly detection on surveillance video with two-stream spatiotemporal generative model. Multimed. Syst. 2022, 29, 59–71. [Google Scholar] [CrossRef]
- Başkurt, K.B.; Samet, R. Long-term multiobject tracking using alternative correlation filters. Turk. J. Electr. Eng. Comput. Sci. 2018, 26, 2246–2259. [Google Scholar] [CrossRef]
- Baskurt, K.B.; Samet, R. Video synopsis: A survey. Comput. Vis. Image Underst. 2019, 181, 26–38. [Google Scholar] [CrossRef]
- Ramachandra, B.; Jones, M.; Vatsavai, R. Learning a distance function with a Siamese network to localize anomalies in videos. In Proceedings of the IEEE/CVF Winter Conference on Applications of Computer Vision, Snowmass Village, CO, USA, 1–5 March 2020; pp. 2598–2607. [Google Scholar]
- Colque, R.V.H.M. Robust Approaches for Anomaly Detection Applied to Video Surveillance. 2018. Available online: https://repositorio.ufmg.br/manutencao/ (accessed on 12 January 2023).
- Chen, C.H. Handbook of Pattern Recognition and Computer Vision; World Scientific: Singapore, 2015. [Google Scholar]
- Munyua, J.G.; Wambugu, G.M.; Njenga, S.T. A Survey of Deep Learning Solutions for Anomaly Detection in Surveillance Videos. Int. J. Comput. Inf. Technol. 2021, 10, 5. [Google Scholar] [CrossRef]
- Alsulami, A.A.; Abu Al-Haija, Q.; Tayeb, A.; Alqahtani, A. An Intrusion Detection and Classification System for IoT Traffic with Improved Data Engineering. Appl. Sci. 2020, 12, 12336. [Google Scholar] [CrossRef]
- Nasteski, V. An overview of the supervised machine learning methods. Horizons B 2017, 4, 51–62. [Google Scholar] [CrossRef]
- Morente-Molinera, J.A.; Mezei, J.; Carlsson, C.; Herrera-Viedma, E. Improving supervised learning classification methods using multigranular linguistic modeling and fuzzy entropy. IEEE Trans. Fuzzy Syst. 2016, 25, 1078–1089. [Google Scholar] [CrossRef]
- Angarita-Zapata, J.S.; Masegosa, A.D.; Triguero, I. A taxonomy of traffic forecasting regression problems from a supervised learning perspective. IEEE Access 2019, 7, 68185–68205. [Google Scholar] [CrossRef]
- Asad, M.; Yang, J.; He, J.; Shamsolmoali, P.; He, X. Multi-frame feature-fusion-based model for violence detection. Vis. Comput. 2021, 37, 1415–1431. [Google Scholar] [CrossRef]
- Wang, T.; Qiao, M.; Deng, Y.; Zhou, Y.; Wang, H.; Lyu, Q.; Snoussi, H. Abnormal event detection based on analysis of movement information of video sequence. Optik 2018, 152, 50–60. [Google Scholar] [CrossRef]
- Patil, N.; Biswas, P.K. Global abnormal events detection in surveillance video—A hierarchical approach. In Proceedings of the 2016 Sixth International Symposium on Embedded Computing and System Design (ISED), Patna, India, 15–17 December 2016; IEEE: Piscataway, NJ, USA, 2016; pp. 217–222. [Google Scholar]
- Kaltsa, V.; Briassouli, A.; Kompatsiaris, I.; Strintzis, M.G. Multiple Hierarchical Dirichlet Processes for anomaly detection in traffic. Comput. Vis. Image Underst. 2018, 169, 28–39. [Google Scholar] [CrossRef]
- Abu Al-Haija, Q.; Al Badawi, A. High-performance intrusion detection system for networked UAVs via deep learning. Neural Comput. Appl. 2022, 34, 10885–10900. [Google Scholar]
- Sultani, W.; Chen, C.; Shah, M. Real-world anomaly detection in surveillance videos. In Proceedings of the IEEE Conference on Computer Vision and Pattern Recognition, Salt Lake City, UT, USA, 18–22 June 2018; pp. 6479–6488. [Google Scholar]
- Alsulami, A.A.; Abu Al-Haija, Q.; Alqahtani, A.; Alsini, R. Symmetrical Simulation Scheme for Anomaly Detection in Autonomous Vehicles Based on LSTM Model. Symmetry 2022, 14, 1450. [Google Scholar] [CrossRef]
- Huang, G.; Song, S.; Gupta, J.N.; Wu, C. Semi-supervised and unsupervised extreme learning machines. IEEE Trans. Cybern. 2014, 44, 2405–2417. [Google Scholar] [CrossRef]
- Chriki, A.; Touati, H.; Snoussi, H.; Kamoun, F. Uav-based surveillance system: An anomaly detection approach. In Proceedings of the 2020 IEEE Symposium on Computers and Communications (ISCC), Rennes, France, 7–10 July 2020; IEEE: Piscataway, NJ, USA, 2020; pp. 1–6. [Google Scholar]
- Chriki, A.; Touati, H.; Snoussi, H.; Kamoun, F. Deep learning and handcrafted features for one-class anomaly detection in UAV video. Multimed. Tools Appl. 2021, 80, 2599–2620. [Google Scholar] [CrossRef]
- Al-Qudah, M.; Ashi, Z.; Alnabhan, M.; Abu Al-Haija, Q. Effective One-Class Classifier Model for Memory Dump Malware Detection. J. Sens. Actuator Netw. 2022, 12, 5. [Google Scholar] [CrossRef]
- Wang, L.L.; Ngan, H.Y.; Yung, N.H. Automatic incident classification for large-scale traffic data by adaptive boosting SVM. Inf. Sci. 2018, 467, 59–73. [Google Scholar] [CrossRef]
- Ravanbakhsh, M.; Nabi, M.; Sangineto, E.; Marcenaro, L.; Regazzoni, C.; Sebe, N. Abnormal event detection in videos using generative adversarial nets. In Proceedings of the 2017 IEEE International Conference on Image Processing (ICIP), Beijing, China, 17–20 September 2017; IEEE: Piscataway, NJ, USA, 2017; pp. 1577–1581. [Google Scholar]
- Van Engelen, J.E.; Hoos, H.H. A survey on semi-supervised learning. Mach. Learn. 2020, 109, 373–440. [Google Scholar] [CrossRef]
- Bhakat, S.; Ramakrishnan, G. Anomaly detection in surveillance videos. In Proceedings of the ACM India Joint International Conference on Data Science and Management of Data, Kolkata, India, 3–5 January 2019; pp. 252–255. [Google Scholar]
- Santhosh, K.K.; Dogra, D.P.; Roy, P.P. Anomaly detection in road traffic using visual surveillance: A survey. ACM Comput. Surv. (CSUR) 2020, 53, 1–26. [Google Scholar] [CrossRef]
- Hu, W.; Gao, J.; Li, B.; Wu, O.; Du, J.; Maybank, S. Anomaly detection using local kernel density estimation and context-based regression. IEEE Trans. Knowl. Data Eng. 2018, 32, 218–233. [Google Scholar] [CrossRef]
- Rüttgers, A.; Petrarolo, A. Local anomaly detection in hybrid rocket combustion tests. Exp. Fluids 2021, 62, 136. [Google Scholar] [CrossRef]
- Bansod, S.D.; Nandedkar, A.V. Crowd anomaly detection and localization using histogram of magnitude and momentum. Vis. Comput. 2020, 36, 609–620. [Google Scholar] [CrossRef]
- Zhang, Y.; Lu, H.; Zhang, L.; Ruan, X. Combining motion and appearance cues for anomaly detection. Pattern Recognit. 2016, 51, 443–452. [Google Scholar] [CrossRef]
- Sabokrou, M.; Fayyaz, M.; Fathy, M.; Moayed, Z.; Klette, R. Deep-anomaly: Fully convolutional neural network for fast anomaly detection in crowded scenes. Comput. Vis. Image Underst. 2018, 172, 88–97. [Google Scholar] [CrossRef]
- Rahmani, M.; Atia, G.K. Coherence pursuit: Fast, simple, and robust principal component analysis. IEEE Trans. Signal Process. 2017, 65, 6260–6275. [Google Scholar] [CrossRef]
- Sarker, I.H. Machine learning: Algorithms, real-world applications and research directions. SN Comput. Sci. 2021, 2, 160. [Google Scholar] [CrossRef]
- Wang, T.; Snoussi, H. Detection of abnormal visual events via global optical flow orientation histogram. IEEE Trans. Inf. Forensics Secur. 2014, 9, 988–998. [Google Scholar] [CrossRef]
- Doshi, K.; Yilmaz, Y. Online anomaly detection in surveillance videos with asymptotic bound on false alarm rate. Pattern Recognit. 2021, 114, 107865. [Google Scholar] [CrossRef]
- Aboah, A. A vision-based system for traffic anomaly detection using deep learning and decision trees. In Proceedings of the IEEE/CVF Conference on Computer Vision and Pattern Recognition, Nashville, TN, USA, 20–25 June 2021; pp. 4207–4212. [Google Scholar]
- Saeedi, J.; Giusti, A. Anomaly Detection for Industrial Inspection using Convolutional Autoencoder and Deep Feature-based One-class Classification. In Proceedings of the VISIGRAPP (5: VISAPP), Online, 6–8 February 2022; pp. 85–96. [Google Scholar]
- Chen, Y.; Tian, Y.; Pang, G.; Carneiro, G. Deep one-class classification via interpolated gaussian descriptor. In Proceedings of the AAAI Conference on Artificial Intelligence, Washington, DC, USA, 7–14 February 2022; Volume 36, pp. 383–392. [Google Scholar]
- Lee, K.; Lee, H.; Lee, K.; Shin, J. Training confidence-calibrated classifiers for detecting out-of-distribution samples. arXiv 2017, arXiv:1711.09325. [Google Scholar]
- Liu, W.; Luo, W.; Lian, D.; Gao, S. Future frame prediction for anomaly detection–a new baseline. In Proceedings of the IEEE Conference on Computer Vision and Pattern Recognition, Salt Lake City, UT, USA, 18–22 June 2018; pp. 6536–6545. [Google Scholar]
- Jiang, T.; Li, Y.; Xie, W.; Du, Q. Discriminative reconstruction constrained generative adversarial network for hyperspectral anomaly detection. IEEE Trans. Geosci. Remote Sens. 2020, 58, 4666–4679. [Google Scholar] [CrossRef]
- Cheng, H.; Liu, X.; Wang, H.; Fang, Y.; Wang, M.; Zhao, X. SecureAD: A secure video anomaly detection framework on convolutional neural network in edge computing environment. IEEE Trans. Cloud Comput. 2020, 10, 1413–1427. [Google Scholar] [CrossRef]
- Zhao, Y.; Deng, B.; Shen, C.; Liu, Y.; Lu, H.; Hua, X.S. spatiotemporal autoencoder for video anomaly detection. In Proceedings of the 25th ACM International Conference on Multimedia, Mountain View, CA, USA, 23–27 October 2017; pp. 1933–1941. [Google Scholar]
- Xu, D.; Ricci, E.; Yan, Y.; Song, J.; Sebe, N. Learning deep representations of appearance and motion for anomalous event detection. arXiv 2015, arXiv:1510.01553. [Google Scholar]
- Fan, Y.; Wen, G.; Li, D.; Qiu, S.; Levine, M.D.; Xiao, F. Video anomaly detection and localization via gaussian mixture fully convolutional variational autoencoder. Comput. Vis. Image Underst. 2020, 195, 102920. [Google Scholar] [CrossRef]
- Duman, E.; Erdem, O.A. Anomaly detection in videos using optical flow and convolutional autoencoder. IEEE Access 2019, 7, 183914–183923. [Google Scholar] [CrossRef]
- Madan, N.; Farkhondeh, A.; Nasrollahi, K.; Escalera, S.; Moeslund, T.B. Temporal cues from socially unacceptable trajectories for anomaly detection. In Proceedings of the IEEE/CVF International Conference on Computer Vision, Montreal, BC, Canada, 11–17 October 2021; pp. 2150–2158. [Google Scholar]
- Song, H.; Sun, C.; Wu, X.; Chen, M.; Jia, Y. Learning normal patterns via adversarial attention-based autoencoder for abnormal event detection in videos. IEEE Trans. Multimed. 2019, 22, 2138–2148. [Google Scholar] [CrossRef]
- Sun, C.; Jia, Y.; Song, H.; Wu, Y. Adversarial 3d convolutional auto-encoder for abnormal event detection in videos. IEEE Trans. Multimed. 2020, 23, 3292–3305. [Google Scholar] [CrossRef]
- Nguyen, T.N.; Meunier, J. Anomaly detection in video sequence with appearance-motion correspondence. In Proceedings of the IEEE/CVF International Conference on Computer Vision, Seoul, Republic of Korea, 27 October–2 November 2019; pp. 1273–1283. [Google Scholar]
- Feng, X.; Song, D.; Chen, Y.; Chen, Z.; Ni, J.; Chen, H. Convolutional transformer based dual discriminator generative adversarial networks for video anomaly detection. In Proceedings of the 29th ACM International Conference on Multimedia, Nice, France, 21–25 October 2021; pp. 5546–5554. [Google Scholar]
- Lee, J.; Nam, W.J.; Lee, S.W. Multi-Contextual Predictions with Vision Transformer for Video Anomaly Detection. In Proceedings of the 2022 26th International Conference on Pattern Recognition (ICPR), Montreal, QC, Canada, 21–25 August 2022; IEEE: Piscataway, NJ, USA, 2022; pp. 1012–1018. [Google Scholar]
- Yuan, H.; Cai, Z.; Zhou, H.; Wang, Y.; Chen, X. Transanomaly: Video anomaly detection using video vision transformer. IEEE Access 2021, 9, 123977–123986. [Google Scholar] [CrossRef]
- Ullah, A.; Ahmad, J.; Muhammad, K.; Sajjad, M.; Baik, S.W. Action recognition in video sequences using deep bi-directional LSTM with CNN features. IEEE Access 2017, 6, 1155–1166. [Google Scholar] [CrossRef]
- Ergen, T.; Kozat, S.S. Unsupervised anomaly detection with LSTM neural networks. IEEE Trans. Neural Netw. Learn. Syst. 2019, 31, 3127–3141. [Google Scholar] [CrossRef] [PubMed]
- Ristea, N.C.; Madan, N.; Ionescu, R.T.; Nasrollahi, K.; Khan, F.S.; Moeslund, T.B.; Shah, M. Self-supervised predictive convolutional attentive block for anomaly detection. In Proceedings of the IEEE/CVF Conference on Computer Vision and Pattern Recognition, New Orleans, LA, USA, 18–24 June 2022; pp. 13576–13586. [Google Scholar]
- Zhou, J.T.; Du, J.; Zhu, H.; Peng, X.; Liu, Y.; Goh, R.S.M. Anomalynet: An anomaly detection network for video surveillance. IEEE Trans. Inf. Forensics Secur. 2019, 14, 2537–2550. [Google Scholar] [CrossRef]
- Nawaratne, R.; Alahakoon, D.; De Silva, D.; Yu, X. Spatiotemporal anomaly detection using deep learning for real-time video surveillance. IEEE Trans. Ind. Inform. 2019, 16, 393–402. [Google Scholar] [CrossRef]
- Ullah, W.; Ullah, A.; Hussain, T.; Khan, Z.A.; Baik, S.W. An efficient anomaly recognition framework using an attention residual LSTM in surveillance videos. Sensors 2021, 21, 2811. [Google Scholar] [CrossRef]
- Ranjith, R.; Athanesious, J.J.; Vaidehi, V. Anomaly detection using DBSCAN clustering technique for traffic video surveillance. In Proceedings of the 2015 Seventh International Conference on Advanced Computing (ICoAC), Chennai, India, 15–17 December 2015; IEEE: Piscataway, NJ, USA, 2015; pp. 1–6. [Google Scholar]
- Li, Y.; Guo, T.; Xia, R.; Xie, W. Road traffic anomaly detection based on fuzzy theory. IEEE Access 2018, 6, 40281–40288. [Google Scholar] [CrossRef]
- Chang, M.C.; Wei, Y.; Song, N.; Lyu, S. Video analytics in smart transportation for the AIC’18 challenge. In Proceedings of the IEEE Conference on Computer Vision and Pattern Recognition Workshops, Salt Lake City, UT, USA, 18–22 June 2018; pp. 61–68. [Google Scholar]
- Lu, C.; Shi, J.; Jia, J. Abnormal event detection at 150 fps in matlab. In Proceedings of the IEEE International Conference on Computer Vision, Sydney, Australia, 1–8 December 2013; pp. 2720–2727. [Google Scholar]
- Adam, A.; Rivlin, E.; Shimshoni, I.; Reinitz, D. Robust real-time unusual event detection using multiple fixed-location monitors. IEEE Trans. Pattern Anal. Mach. Intell. 2008, 30, 555–560. [Google Scholar] [CrossRef]
- Mahadevan, V.; Li, W.; Bhalodia, V.; Vasconcelos, N. Anomaly detection in crowded scenes. In Proceedings of the 2010 IEEE Computer Society Conference on Computer Vision and Pattern Recognition, San Francisco, CA, USA, 13–18 June 2010; IEEE: Piscataway, NJ, USA, 2010; pp. 1975–1981. [Google Scholar]
- Lee, S.; Kim, H.G.; Ro, Y.M. STAN: Spatiotemporal adversarial networks for abnormal event detection. In Proceedings of the 2018 IEEE International Conference on Acoustics, Speech and Signal Processing (ICASSP), Calgary, AB, Canada, 15–20 April 2018; IEEE: Piscataway, NJ, USA, 2018; pp. 1323–1327. [Google Scholar]
- Mehran, R.; Oyama, A.; Shah, M. Abnormal crowd behavior detection using social force model. In Proceedings of the 2009 IEEE Conference on Computer Vision and Pattern Recognition, Miami, FL, USA, 20–25 June 2009; IEEE: Piscataway, NJ, USA, 2009; pp. 935–942. [Google Scholar]
- Boekhoudt, K.; Matei, A.; Aghaei, M.; Talavera, E. HR-Crime: Human-Related Anomaly Detection in Surveillance Videos. In Proceedings of the International Conference on Computer Analysis of Images and Patterns, Virtual, 28–30 September 2021; Springer: Berlin/Heidelberg, Germany, 2021; pp. 164–174. [Google Scholar]
- Wang, T.; Qiao, M.; Lin, Z.; Li, C.; Snoussi, H.; Liu, Z.; Choi, C. Generative neural networks for anomaly detection in crowded scenes. IEEE Trans. Inf. Forensics Secur. 2018, 14, 1390–1399. [Google Scholar] [CrossRef]
- Del Giorno, A.; Bagnell, J.A.; Hebert, M. A discriminative framework for anomaly detection in large videos. In Proceedings of the European Conference on Computer Vision, Amsterdam, The Netherlands, 11–14 October 2016; Springer: Berlin/Heidelberg, Germany, 2016; pp. 334–349. [Google Scholar]
- Tudor Ionescu, R.; Smeureanu, S.; Alexe, B.; Popescu, M. Unmasking the abnormal events in video. In Proceedings of the IEEE International Conference on Computer Vision, Venice, Italy, 22–29 October 2017; pp. 2895–2903. [Google Scholar]
- Wang, S.; Zhu, E.; Yin, J.; Porikli, F. Anomaly detection in crowded scenes by SL-HOF descriptor and foreground classification. In Proceedings of the 2016 23rd International Conference on Pattern Recognition (ICPR), Cancun, Mexico, 4–8 December 2016; IEEE: Piscataway, NJ, USA, 2016; pp. 3398–3403. [Google Scholar]
- Hasan, M.; Choi, J.; Neumann, J.; Roy-Chowdhury, A.K.; Davis, L.S. Learning temporal regularity in video sequences. In Proceedings of the IEEE Conference on Computer Vision and Pattern Recognition, Las Vegas, NA, USA, 27–30 June 2016; pp. 733–742. [Google Scholar]
- Luo, W.; Liu, W.; Gao, S. Remembering history with convolutional lstm for anomaly detection. In Proceedings of the 2017 IEEE International Conference on Multimedia and Expo (ICME), San Diego, CA, USA, 10–14 July 2017; IEEE: Piscataway, NJ, USA, 2017; pp. 439–444. [Google Scholar]
- Vu, H.; Nguyen, T.D.; Travers, A.; Venkatesh, S.; Phung, D. Energy-based localized anomaly detection in video surveillance. In Proceedings of the Pacific-Asia Conference on Knowledge Discovery and Data Mining, Nanjing, China, 22–25 May 2017; Springer: Berlin/Heidelberg, Germany, 2017; pp. 641–653. [Google Scholar]
- Chong, Y.S.; Tay, Y.H. Abnormal event detection in videos using spatiotemporal autoencoder. Advances in Neural Networks—ISNN 2017; Springer: Berlin/Heidelberg, Germany, 2017; pp. 189–196. [Google Scholar]
- Yang, B.; Cao, J.; Ni, R.; Zou, L. Anomaly detection in moving crowds through spatiotemporal autoencoding and additional attention. Adv. Multimed. 2018, 2018, 2087574. [Google Scholar] [CrossRef]
- Tudor Ionescu, R.; Smeureanu, S.; Popescu, M.; Alexe, B. Detecting abnormal events in video using Narrowed Normality Clusters. arXiv 2018, arXiv1801. [Google Scholar]
- Zhong, J.X.; Li, N.; Kong, W.; Liu, S.; Li, T.H.; Li, G. Graph convolutional label noise cleaner: Train a plug-and-play action classifier for anomaly detection. In Proceedings of the IEEE/CVF Conference on Computer Vision and Pattern Recognition, Long Beach, CA, USA, 15–20 June 2019; pp. 1237–1246. [Google Scholar]
- Gong, D.; Liu, L.; Le, V.; Saha, B.; Mansour, M.R.; Venkatesh, S.; Hengel, A.V.D. Memorizing normality to detect anomaly: Memory-augmented deep autoencoder for unsupervised anomaly detection. In Proceedings of the IEEE/CVF International Conference on Computer Vision, Seoul, Republic of Korea, 27 October–2 November 2019; pp. 1705–1714. [Google Scholar]
- Luo, W.; Liu, W.; Lian, D.; Tang, J.; Duan, L.; Peng, X.; Gao, S. Video anomaly detection with sparse coding inspired deep neural networks. IEEE Trans. Pattern Anal. Mach. Intell. 2019, 43, 1070–1084. [Google Scholar] [CrossRef]
- Zhou, J.T.; Zhang, L.; Fang, Z.; Du, J.; Peng, X.; Xiao, Y. Attention-driven loss for anomaly detection in video surveillance. IEEE Trans. Circuits Syst. Video Technol. 2019, 30, 4639–4647. [Google Scholar] [CrossRef]
- Lee, S.; Kim, H.G.; Ro, Y.M. BMAN: Bidirectional multi-scale aggregation networks for abnormal event detection. IEEE Trans. Image Process. 2019, 29, 2395–2408. [Google Scholar] [CrossRef] [PubMed]
- Dubey, S.; Boragule, A.; Jeon, M. 3D resnet with ranking loss function for abnormal activity detection in videos. In Proceedings of the 2019 International Conference on Control, Automation and Information Sciences (ICCAIS), Chengdu, China, 23–26 October 2019; IEEE: Piscataway, NJ, USA, 2019; pp. 1–6. [Google Scholar]
- Dong, F.; Zhang, Y.; Nie, X. Dual discriminator generative adversarial network for video anomaly detection. IEEE Access 2020, 8, 88170–88176. [Google Scholar] [CrossRef]
- Lu, Y.; Yu, F.; Reddy, M.K.K.; Wang, Y. Few-shot scene-adaptive anomaly detection. In Proceedings of the European Conference on Computer Vision, Glasgow, UK, 23–28 August 2020; Springer: Berlin/Heidelberg, Germany, 2020; pp. 125–141. [Google Scholar]
- Yang, Y.; Zhan, D.; Yang, F.; Zhou, X.D.; Yan, Y.; Wang, Y. Improving video anomaly detection performance with patch-level loss and segmentation map. In Proceedings of the 2020 IEEE 6th International Conference on Computer and Communications (ICCC), Chengdu, China, 11–14 December 2020; IEEE: Piscataway, NJ, USA, 2020; pp. 1832–1839. [Google Scholar]
- Chang, Y.; Tu, Z.; Xie, W.; Yuan, J. Clustering driven deep autoencoder for video anomaly detection. In Proceedings of the European Conference on Computer Vision, Glasgow, UK, 23–28 August 2020; Springer: Berlin/Heidelberg, Germany, 2020; pp. 329–345. [Google Scholar]
- Park, H.; Noh, J.; Ham, B. Learning memory-guided normality for anomaly detection. In Proceedings of the IEEE/CVF Conference on Computer Vision and Pattern Recognition, Seattle, WA, USA, 13–19 June 2020; pp. 14372–14381. [Google Scholar]
- Zaheer, M.Z.; Mahmood, A.; Shin, H.; Lee, S.I. A self-reasoning framework for anomaly detection using video-level labels. IEEE Signal Process. Lett. 2020, 27, 1705–1709. [Google Scholar] [CrossRef]
- Feng, J.; Liang, Y.; Li, L. Anomaly detection in videos using two-stream autoencoder with post hoc interpretability. Comput. Intell. Neurosci. 2021, 2021, 7367870. [Google Scholar] [CrossRef]
- Yang, F.; Yu, Z.; Chen, L.; Gu, J.; Li, Q.; Guo, B. Human-machine cooperative video anomaly detection. Proc. ACM Hum.-Comput. Interact. 2021, 4, 1–18. [Google Scholar] [CrossRef]
- Georgescu, M.I.; Barbalau, A.; Ionescu, R.T.; Khan, F.S.; Popescu, M.; Shah, M. Anomaly detection in video via self-supervised and multi-task learning. In Proceedings of the IEEE/CVF Conference on Computer Vision and Pattern Recognition, Nashville, TN, USA, 20–25 June 2021; pp. 12742–12752. [Google Scholar]
- Li, B.; Leroux, S.; Simoens, P. Decoupled appearance and motion learning for efficient anomaly detection in surveillance video. Comput. Vis. Image Underst. 2021, 210, 103249. [Google Scholar] [CrossRef]
- Ouyang, Y.; Sanchez, V. Video anomaly detection by estimating likelihood of representations. In Proceedings of the 2020 25th International Conference on Pattern Recognition (ICPR), Milan, Italy, 10–15 January 2021; IEEE: Piscataway, NJ, USA, 2021; pp. 8984–8991. [Google Scholar]
- Dubey, S.; Boragule, A.; Gwak, J.; Jeon, M. Anomalous event recognition in videos based on joint learning of motion and appearance with multiple ranking measures. Appl. Sci. 2021, 11, 1344. [Google Scholar] [CrossRef]
- Wang, B.; Yang, C. Video Anomaly Detection Based on Convolutional Recurrent AutoEncoder. Sensors 2022, 22, 4647. [Google Scholar] [CrossRef]
- Ul Amin, S.; Ullah, M.; Sajjad, M.; Cheikh, F.A.; Hijji, M.; Hijji, A.; Muhammad, K. EADN: An Efficient Deep Learning Model for Anomaly Detection in Videos. Mathematics 2022, 10, 1555. [Google Scholar] [CrossRef]
- Ganokratanaa, T.; Aramvith, S.; Sebe, N. Video anomaly detection using deep residual-spatiotemporal translation network. Pattern Recognit. Lett. 2022, 155, 143–150. [Google Scholar] [CrossRef]
- Huang, X.; Zhao, C.; Wang, Y.; Wu, Z. A Video Anomaly Detection Framework based on Appearance-Motion Semantics Representation Consistency. arXiv 2022, arXiv:2204.04151. [Google Scholar]
- Liu, W.; Chang, H.; Ma, B.; Shan, S.; Chen, X. Diversity-Measurable Anomaly Detection. arXiv 2023, arXiv:2303.05047. [Google Scholar]
- Ouyang, Y.; Shen, G.; Sanchez, V. Look at adjacent frames: Video anomaly detection without offline training. In Computer Vision—ECCV 2022 Workshops; Springer: Berlin/Heidelberg, Germany, 2023; pp. 642–658. [Google Scholar]
- Sharif, M.; Jiao, L.; Omlin, C.W. Deep Crowd Anomaly Detection: State-of-the-Art, Challenges, and Future Research Directions. arXiv 2022, arXiv:2210.13927. [Google Scholar]
- Tsiktsiris, D.; Dimitriou, N.; Lalas, A.; Dasygenis, M.; Votis, K.; Tzovaras, D. Real-time abnormal event detection for enhanced security in autonomous shuttles mobility infrastructures. Sensors 2020, 20, 4943. [Google Scholar] [CrossRef]
- He, C.; Shao, J.; Sun, J. An anomaly-introduced learning method for abnormal event detection. Multimed. Tools Appl. 2018, 77, 29573–29588. [Google Scholar] [CrossRef]


| Learning | Algorithms |
|---|---|
| Supervised learning | Statistics-based algorithms |
| Unsupervised learning | Classification-based algorithms |
| Semi-supervised learning | Reconstruction-based algorithms |
| Prediction-based algorithms | |
| Other algorithms |
| Methods | Summary |
|---|---|
| HoMM [46] | The histogram of magnitudes is used to record the motion of objects. The anomalous motion of an object is represented by its momentum about the foreground region’s occupancy. Feature descriptors for typical situations are learned in an unsupervised manner using K-means clustering. By measuring the distance between cluster centers and the test frame’s feature vector, frame-level anomalies are discovered. The region and anything leaving that region are regarded as anomalous. |
| Datasets: UCSD, UMN; Techniques: background subtraction, optical flow, K-means clustering. | |
| Novel scheme based on SVDD [47] | Statistical histograms are used to model normal motion distributions. It combines motion detection and appearance detection criteria to find anomalous objects. They created a method based on Support Vector Data Description (SVDD), which creates a sphere-shaped boundary around the regular items to keep out anomalous ones. They took into account a fixed-dimension region, and anything left in that region is regarded as anomalous. |
| Datasets: UCSD, UMN, Subway; Techniques: histogram model, optical flow, support vector data description. | |
| Gaussian classifier [48] | Deep autoencoder networks and single-class image-level classification are proposed to detect event anomalies in surveillance videos. |
| Datasets: UCSD, Subway; Techniques: Gaussian classifier, CNN, sparse autoencoder. | |
| CoP [49] | The method called Consistency Pursuit (CoP) is based on the idea that normal samples have a very high correlation with each other, can span low-dimensional subspaces, and therefore, have strong mutual consistency with a large number of data points. |
| Datasets: Hopkins155; Techniques: robust PCA, saliency map. |
| Methods | Summary |
|---|---|
| One-class classification [51] | A histogram of optical flow orientation is integrated with a one-class SVM to identify abnormal events. Modeling high-density scenes may be performed quickly and precisely using optical flow techniques. Pattern identification is performed after feature extraction to discriminate between regular and irregular activities. |
| Datasets: UMN; Techniques: SVM, optical flow, histogram of optical flow orientation. | |
| Asymptotic bounds [52] | The crowd escape anomaly is detected using statistical and deep learning algorithms that directly evaluate the pixel coordinates. |
| Datasets: UCSD, Avenue, ShanghaiTech; Techniques: YOLOv3, GAN-based frame predictor, kNN. | |
| Decision tree [53] | To detect abnormalities from video surveillance while precisely estimating the start and end times of the anomalous event, a decision-tree-enabled solution leveraging deep learning was created. |
| Datasets: ImageNet, COCO; Techniques: decision trees, YOLOv5. | |
| AE with kNN [54] | A new approach combines an AE-based method with single-class deep feature classification. An AE is trained using normal images; then, anomaly maps are embedded using a pre-trained CNN feature extractor. A one-class classifier with kNN is trained to calculate the anomaly score. |
| Datasets: MVTec; Techniques: convolutional autoencoder, high-density embedding, one-class classification. | |
| IGD [55] | There is a high probability of overfitting as abnormal datasets are insufficient. The Interpolated Gaussian Descriptor (IGD) method, an OCC model that learns a one-class Gaussian anomaly classifier trained with inversely interpolated training samples, is proposed to solve this problem. The IGD is used to learn more meaningful data descriptions from typical normal samples. The crowd escape anomaly is detected using statistical and deep learning algorithms that directly evaluate the pixel coordinates. |
| Datasets: MNIST, Fashion MNIST, CIFAR10, MVTec AD; Techniques: Gaussian classifier. | |
| Out of distribution [56] | A classifier that is simultaneously trained to give the GAN samples less confidence is used in conjunction with a GAN. Samples from each test distribution of anomalies are used to arrange the classifier and GAN. |
| Datasets: CIFAR, tree-enabled, LSUN; Techniques: DNN, GAN, Kullback–Leibler, Gaussian distribution. |
| Methods | Summary |
|---|---|
| ST-AE [60] | The spatiotemporal AE comprises one encoder and two decoders of 3D convolutional layers. It employs parallel training of decoders with monochrome frames, which is noteworthy compared to the distillation process. |
| Datasets: Traffic, UCSD, Avenue; Techniques: CNN, autoencoder. | |
| AMDN [61] | The appearance and motion DeepNet model employs AEs and a modified two-stream network with an additional third stream to improve detection performance. The two-stream method has two major drawbacks: the requirement for a pre-processing technique, such as optical flow, which may be costly for real-world applications, and multiple networks for inference. |
| Datasets: Train, UCSD; Techniques: one-class SVM, optical flow. | |
| GMFC-VAE [62] | The Gaussian mixture fully convolutional-variational AE uses the conventional two-stream network technique and uses a variational AE to enhance its feature extraction capability. This method estimates the appearance and motion anomaly score before combining the two clues to provide the final detection results. |
| Datasets: Avenue, UCSD; Techniques: convolutional autoencoder, Gaussian mixture model. | |
| OF-ConvAE-LSTM [63] | This method uses the convolutional AE and long short-term memory to detect anomalies. The framework produces the error function and reconstructed dense optical flow maps. |
| Datasets: Avenue, UCSD; Techniques: convolutional autoencoder, LSTM, optical flow. | |
| Temporal cues [64] | A conditional GAN is trained to learn two renderers that map pixel data to motion and vice versa. As a result, normal frames will have little reconstruction loss, while anomalous frames will have significant reconstruction loss. |
| Datasets: Avenue, ShanghaiTech; Techniques: GAN, LSTM, optical flow. | |
| Ada-Net [65] | An attention-based autoencoder using contentious learning is proposed to detect video anomalies. |
| Datasets: UCSD, Avenue, ShanghaiTech; Techniques: GAN, autoencoder. | |
| Adversarial 3D CAE [66] | A 3D CAE-based competitor anomalous event detection method is proposed to obtain the maximum accuracy by simultaneously learning motion and appearance features. It was developed to explore spatiotemporal features that help detect anomalous events in video frames. |
| Datasets: UCSD, Avenue, Subway, ShanghaiTech; Techniques: convolutional autoencoder. | |
| Conv-AE + U-Net [67] | A two-stream model is created that learns the connection between common item appearances and their related motions. A single encoder is paired with a U-net decoder to predict motion and a deconvolution decoder that reconstructs the input frame under the control of the reconstruction error loss terms using a single frame as the input. |
| Datasets: UCSD, Avenue, Subway, Traffic; Techniques: convolutional autoencoder. |
| Methods | Summary |
|---|---|
| FFP [57] | Spatial and motion constraints are used to estimate the future frame for normal events in addition to density and gradient losses. |
| Datasets: UCSD, ShanghaiTech, Avenue; Techniques: GAN, optical flow. | |
| Deep BD-LSTM [71] | A model combining CNN and bidirectional LSTM is proposed to recognize human movement in video sequences. |
| Datasets: YouTube 11 Actions, UCF-101, HMDB51; Techniques: LSTM, CNN. | |
| LSTM [72] | By using the effective gradient and quadratic-programming-based training methods, the parameters of the LSTM architecture and the support vector data description algorithm are trained and optimized. |
| Datasets: Avenue, Subway, ShanghaiTech, UCSD; Techniques: LSTM, one-class SVM. | |
| SSPCAB [73] | A Self-Supervised Predictive Convolutional Attentive Block (SSPCAB) is proposed, which can be easily incorporated into various anomaly detection methods. The block acquires the ability to recreate the masked area utilizing contextual information for each site where the dilated convolutional filter is applied. |
| Datasets: Avenue, MVTec AD, ShanghaiTech; Techniques: CNN, convolutional attentive block. | |
| Spatiotemporal feature extraction [74] | A neural network built with transaction blocks, including dictionary learning, feature learning, and sparse representation, is proposed. A novel long short-term memory was also proposed and reformulated using an adaptive iterative hard-thresholding technique (LSTM). |
| Datasets: UCSD, Avenue, UMN; Techniques: LSTM, RNN-based sparsity learning. | |
| ISTL [75] | An Incremental Spatiotemporal Learner (ISTL) model is proposed to address the difficulties and limitations of anomaly detection and localization to keep track of the changing character of anomalies through active learning using fuzzy aggregation. |
| Datasets: UCSD, Avenue; Techniques: convolutional LSTM, fuzzy aggregation. | |
| Residual attention-based LSTM [76] | Using a light-weight CNN and an attention-based LSTM for anomaly detection reduces the time complexity with competitive accuracy. |
| Datasets: Avenue, UCF-Crime, UMN; Techniques: residual attention-based LSTM. | |
| CT-D2GAN [68] | A Conv-transformer is used to perform future frame prediction. Dual-discriminator adversarial training maintains local consistency and global coherence for future frame prediction. |
| Datasets: UCSD Ped2, Avenue, ShanghaiTech; Techniques: GANs; transformer; CNN. | |
| ViT-based framework [69] | Using a ViT model for anomaly detection involves processing a single frame as one patch. This approach yields good performance on the SVAD task while maintaining the advantages of the transformer architecture. |
| Datasets: UCSD Ped2, Avenue, ShanghaiTech; Techniques: vision transformer. |
| Algorithms | Strengths | Weaknesses |
|---|---|---|
| Statistics-based | Generally, they are suitable for real-time applications as they are simple and computationally efficient. | They cannot detect subtle or complex anomalies, such as changes in spatial or temporal relationships. |
| Subtle or complex anomalies, such as those involving spatial or temporal relationship changes, cannot be detected. | False alarms may also occur when the data distribution deviates from a Gaussian distribution. | |
| High-dimensional datasets can be handled, and robustness to noise can be exhibited. | ||
| Classification-based | Anomalies can be learned to be detected based on labeled training data, allowing them to adapt to changes in the data distribution over time. | Generally, they could be improved for real-time applications, being more computationally expensive than statistics-based algorithms. |
| High-dimensional datasets can be handled, and global and local anomalies can be detected. | A large amount of labeled training data is also required, which can be difficult and time-consuming. | |
| Only the anomalies encountered in the training data can be detected, and new unseen anomalies cannot be detected. | ||
| Reconstruction-based | A compact representation of normal data can be learned, allowing subtle or complex anomalies to be detected. | They are generally less well-suited for real-time applications as they are more computationally expensive than statistics-based algorithms. |
| High-dimensional datasets can be handled, and global and local anomalies can be detected. | A large amount of normal data for training is also required, which can be difficult to obtain in some scenarios. | |
| They are not robust to noise, and false alarms may occur when the data are noisy or corrupted. | ||
| Prediction-based | Temporal dependencies in the data can be leveraged to detect anomalies, making them well-suited for time series data. | They are generally less well-suited for real-time applications as they are more computationally expensive than statistics-based algorithms. |
| High-dimensional datasets can be handled, and global and local anomalies can be detected. | A large amount of normal data for training is also required, which can be difficult to obtain in some scenarios. | |
| Anomalies involving spatial or temporal relationship changes may be difficult to detect. | ||
| They do not possess robustness to noise, and false alarms can be produced when the data are noisy or corrupted. |
| Heterogeneous | Specific |
|---|---|
| UCSD | Subway |
| Avenue | UMN |
| UCF-Crime | |
| ShanghaiTech |
| Category | UCF-Crime | HR-Crime |
|---|---|---|
| Abuse | 50 | 38 |
| Arrest | 50 | 42 |
| Arson | 50 | 48 |
| Assault | 50 | 47 |
| Burglary | 100 | 96 |
| Explosion | 50 | 26 |
| Fighting | 50 | 39 |
| Road accident | 150 | 68 |
| Robbery | 150 | 145 |
| Shooting | 50 | 46 |
| Shoplifting | 50 | 50 |
| Stealing | 100 | 98 |
| Vandalism | 50 | 46 |
| Normal | 950 | 782 |
| Total | 1900 | 1571 |
| Datasets | Anomalies |
|---|---|
| Avenue | Throwing objects, loitering, and running |
| UCF-Crime/HR-Crime | Abuse, arson, arrest, assault, burglary, explosion, road accident, fighting, shooting, robbery, shoplifting, stealing, and vandalism |
| UMN | Unusual behavior of the crowd and running |
| ShangaiTech | Chasing, brawling, running, and non-pedestrian assets, such as skaters and bicycles, on the pedestrian path |
| Subway Entrance/Exit | Wrong direction, no payment, unusual interactions, and loitering |
| UCSD Ped1/Ped2 | Passage of non-pedestrian assets, such as vehicles and bicycles, from the pedestrian path |
| Datasets | Release Year | Ground Truth | Resolution | FPS | Environment | Normal Frames | Abnormal Frames | Training Frames | Test Frames | Total Frames |
|---|---|---|---|---|---|---|---|---|---|---|
| Avenue | 2013 | frame/ pixel | 640 × 360 | 25 | outdoor | 26,832 | 3820 | 15,328 | 15,324 | 30,652 |
| UCF-Crime | 2018 | frame/ clip | 320 × 240 | 30 | indoor/ outdoor | N/A | N/A | 12,631,211 | 1,110,182 | 13,741,393 |
| HR Crime | 2021 | frame/ clip | 320 × 240 | 30 | indoor/ outdoor | 485,227 | 335,378 | N/A | N/A | N/A |
| UMN | 2009 | frame | 320 × 240 | 30 | indoor/ outdoor | 6165 | 1576 | N/A | N/A | 7740 |
| ShangaiTech | 2016 | frame/ pixel | 856 × 480 | - | outdoor | 300,308 | 17,090 | 274,515 | 42,883 | 317,398 |
| Subway | ||||||||||
| Entrance | 2008 | frame | 512 × 384 | 25 | indoor | 132,138 | 12,112 | 76,453 | 67,797 | 144,250 |
| Exit | 60,410 | 4491 | 22,500 | 42,401 | 64,901 | |||||
| UCSD | ||||||||||
| Ped1 | 2010 | frame/ pixel | 238 × 158 | - | outdoor | 9995 | 4005 | 6800 | 7200 | 14,000 |
| Ped2 | 360 × 240 | 2924 | 1636 | 2550 | 2010 | 4560 |
| Indoor | Outdoor |
|---|---|
| UCF-Crime | Avenue |
| UMN | UCF-Crime |
| Subway Entrance | UMN |
| Subway Exit | ShanghaiTech |
| UCSD Ped1 | |
| UCSD Ped2 |
| Grayscale | RGB |
|---|---|
| UCSD Ped1 | Avenue |
| UCSD Ped2 | ShanghaiTech |
| Subway Entrance | UMN |
| Subway Exit | UCF-Crime |
| Clip-Level | Frame-Level | Pixel-Level |
|---|---|---|
| UCF-Crime | Avenue | Avenue |
| UCF-Crime | ShanghaiTech | |
| UMN | UCSD Ped1/Ped2 | |
| ShanghaiTech | ||
| UCSD Ped1/Ped2 | ||
| Subway Entrance/Exit |
| Actual Class | |||
|---|---|---|---|
| True | False | ||
| Predicted Class | True | True Positives (TPs) | False Positives (FPs) |
| False | False Negatives (FNs) | True Negatives (TNs) | |
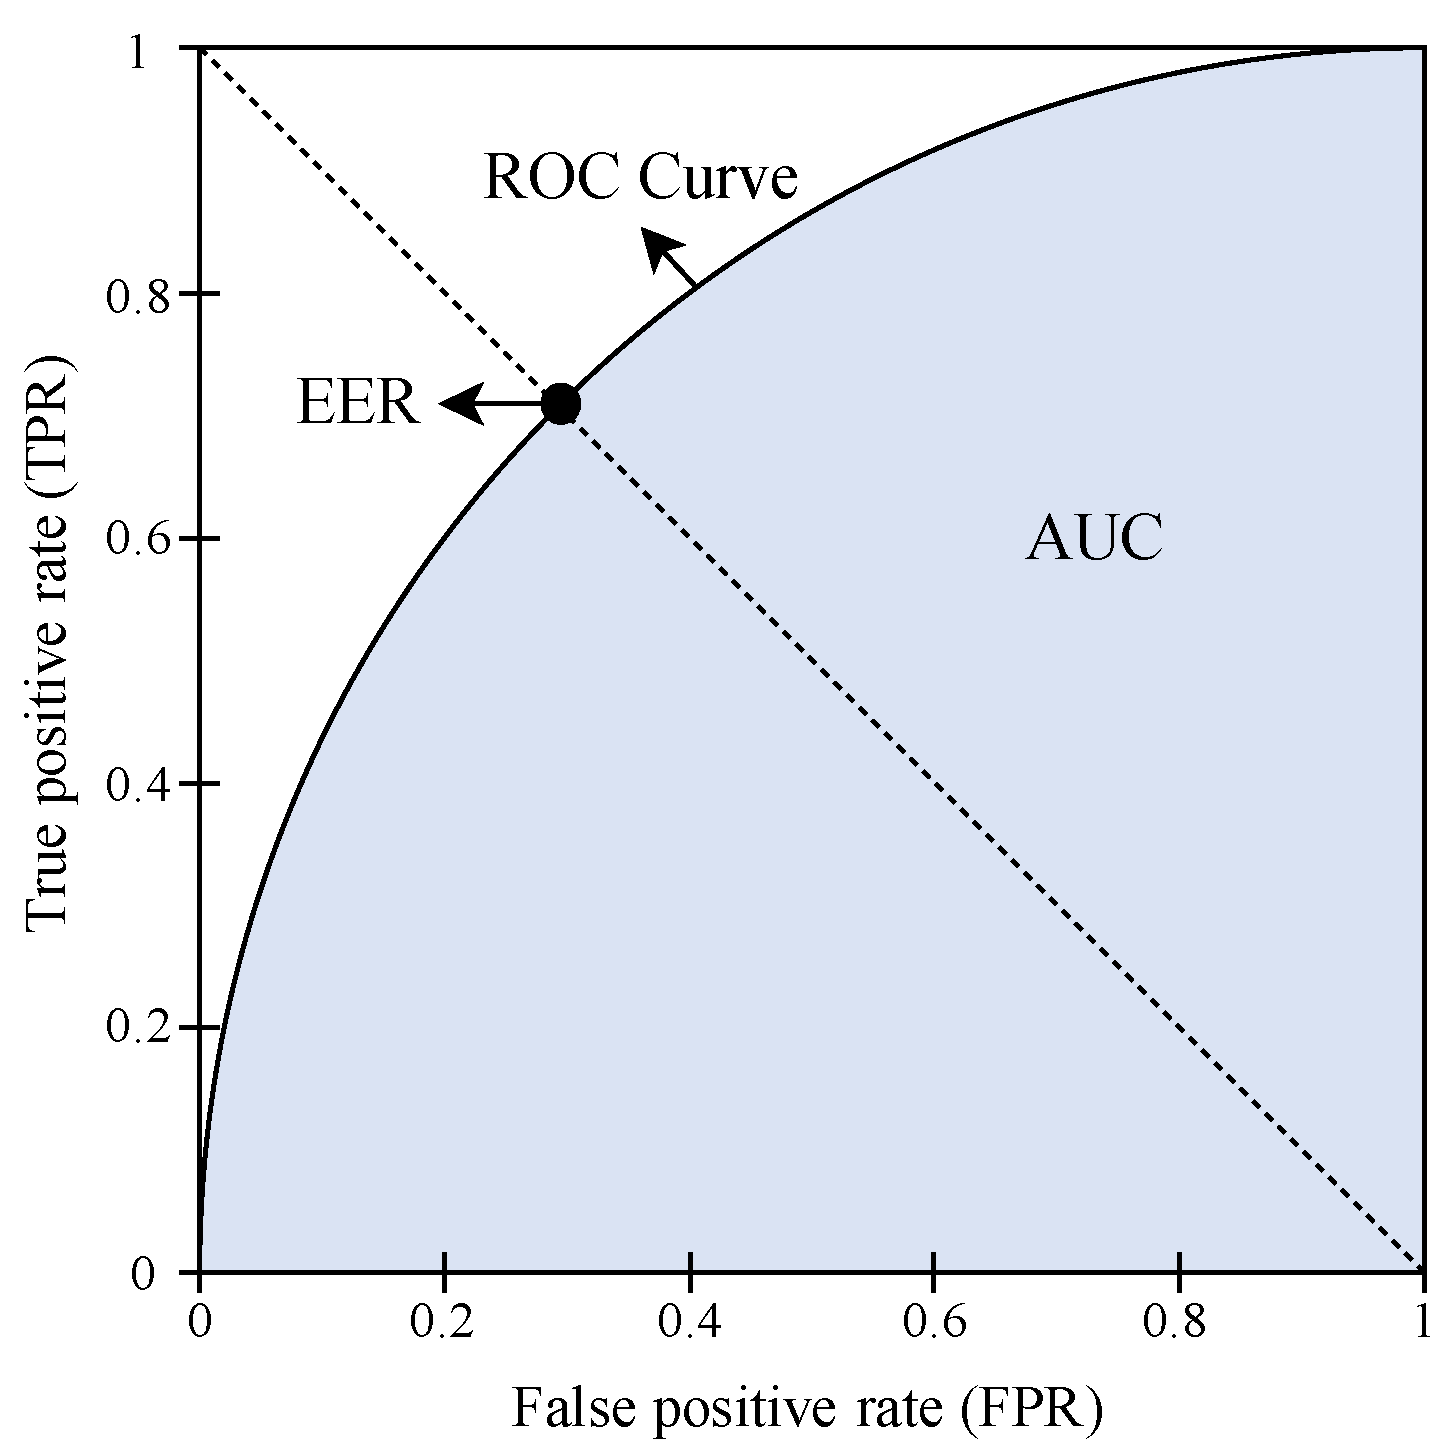
| True Positive Rate (TPR) = TP/(TP + FN) False Positive Rate (FPR) = FP/(FP + TN) | |||
| CUHK Avenue | Subway Entrance | Subway Exit | UCSD Ped1 | UCSD Ped2 | Shanghai Tech | UCF Crime | |||||||||
|---|---|---|---|---|---|---|---|---|---|---|---|---|---|---|---|
| Year | Methods | AUC | EER | AUC | EER | AUC | EER | AUC | EER | AUC | EER | AUC | EER | AUC | EER |
| 2016 | SL-HOF+FC [89] | - | - | - | - | - | - | 87.4 | 18.0 | 95.07 | 9.0 | - | - | - | - |
| ConvAE [90] | 70.2 | 25.1 | 94.3 | 26.0 | 80.7 | 9.9 | 81.0 | 27.9 | 90.0 | 21.7 | - | - | - | - | |
| 2017 | ConvLSTM-AE [91] | 77.0 | - | 93.3 | - | 87.7 | - | 75.5 | - | 88.1 | - | - | - | - | - |
| S-RBM [92] | 78.7 | 27.2 | - | - | - | - | 70.2 | 35.4 | 86.4 | 16.4 | - | - | - | - | |
| ST-AE [93] | 80.3 | 20.7 | 84.7 | 23.7 | 94.0 | 9.5 | 89.9 | 12.5 | 87.4 | 12.0 | - | - | - | - | |
| 3D gradients+conv5 [88] | 80.6 | - | 70.6 | - | 85.7 | - | 68.4 | - | 82.2 | - | - | - | - | - | |
| 2018 | Baseline [57] | 85.1 | - | - | - | - | - | 83.1 | - | 95.4 | - | 72.8 | - | - | - |
| WCAE-LSTM [94] | 85.7 | - | - | - | - | 85.1 | - | 92.6 | - | - | - | - | - | ||
| NNC [95] | 88.9 | - | 93.5 | - | 95.1 | - | - | - | - | - | - | - | - | - | |
| 2019 | TSN [96] | - | - | - | - | - | - | - | - | 92.8 | - | - | - | 78.0 | - |
| MemAE [97] | 83.3 | - | - | - | - | - | - | - | 94.1 | - | 71.2 | - | - | - | |
| sRNN-AE [98] | 83.4 | - | 85.3 | - | 89.7 | - | - | - | 92.2 | - | 69.6 | - | - | - | |
| Attention [99] | 86.0 | - | - | - | - | - | 83.9 | - | 96.0 | - | - | - | - | - | |
| AnomalyNet [74] | 86.1 | 22.0 | - | - | - | - | 83.5 | 25.2 | 94.9 | 10.3 | - | - | - | - | |
| BMAN [100] | 90.0 | - | - | - | - | - | - | - | 96.6 | - | 76.2 | - | - | - | |
| 3D ResNet [101] | - | - | - | - | - | - | - | - | - | - | - | - | 76.6 | - | |
| 2020 | Dual D-b GAN [102] | 84.9 | - | - | - | - | - | - | - | 95.6 | - | 73.7 | 32.2 | - | - |
| r-GAN [103] | 85.8 | - | - | - | - | - | 86.3 | - | 96.2 | - | 77.9 | - | - | - | |
| FFP+MS SSIM+FCN [104] | 85.9 | 20.4 | - | - | - | - | 84.5 | 22.3 | 95.9 | 11.1 | 73.5 | 32.5 | - | - | |
| Deep AE [105] | 86.0 | - | - | - | - | - | - | - | 96.5 | - | 73.3 | - | - | - | |
| Siamese CNN [20] | 87.2 | 18.8 | - | - | - | - | 86.0 | 23.3 | 94.0 | 14.1 | - | - | - | - | |
| P w/ Mem [106] | 88.5 | - | - | - | - | - | - | - | 97.0 | - | 70.5 | - | - | - | |
| Self-reasoning [107] | - | - | - | - | - | - | - | - | 94.4 | - | 84.1 | - | 79.5 | - | |
| 2021 | Spatial+temporal [108] | 80.3 | - | 87.3 | - | 90.8 | - | - | - | 84.5 | - | - | - | - | - |
| HMCF [109] | 83.2 | 20.2 | - | - | 94.2 | 12.6 | 93.5 | 17.4 | 93.7 | 18.8 | - | - | - | - | |
| Multi-task L. [110] | 86.9 | - | - | - | - | - | - | - | 92.4 | - | 83.5 | - | - | - | |
| Decoupled Arch. [111] | 88.8 | - | - | - | 84.7 | - | 95.1 | - | 92.4 | - | 74.2 | - | - | - | |
| GMM-DAE [112] | 89.3 | - | - | - | - | - | - | - | 96.5 | - | 81.2 | - | - | - | |
| DMRMs [113] | - | - | - | - | - | - | - | - | - | - | 68.5 | - | 81.2 | - | |
| 2022 | Att-b residual AE [16] | 86.7 | - | - | - | - | - | - | - | 97.4 | - | 73.6 | - | - | - |
| CR-AE [114] | - | - | - | - | - | - | - | - | 95.6 | - | 73.1 | - | - | - | |
| EADN [115] | 97.0 | - | - | - | - | - | 93.0 | - | 97.0 | - | - | - | 98.0 | - | |
| DR-STN [116] | 90.8 | 11.0 | - | - | - | - | 98.8 | 2.9 | 97.6 | 6.9 | - | - | - | - | |
| AMSRC [117] | 93.8 | - | - | - | - | - | - | - | 99.3 | - | 76.6 | - | - | - | |
| 2023 | DMAD [118] | 92.8 | - | - | - | - | - | - | - | 99.7 | - | 78.8 | - | - | - |
| Adjacent frames [119] | 90.2 | - | - | - | - | - | - | - | 96.5 | - | 83.1 | - | - | - | |
Disclaimer/Publisher’s Note: The statements, opinions and data contained in all publications are solely those of the individual author(s) and contributor(s) and not of MDPI and/or the editor(s). MDPI and/or the editor(s) disclaim responsibility for any injury to people or property resulting from any ideas, methods, instructions or products referred to in the content. |
© 2023 by the authors. Licensee MDPI, Basel, Switzerland. This article is an open access article distributed under the terms and conditions of the Creative Commons Attribution (CC BY) license (https://creativecommons.org/licenses/by/4.0/).
Share and Cite
Şengönül, E.; Samet, R.; Abu Al-Haija, Q.; Alqahtani, A.; Alturki, B.; Alsulami, A.A. An Analysis of Artificial Intelligence Techniques in Surveillance Video Anomaly Detection: A Comprehensive Survey. Appl. Sci. 2023, 13, 4956. https://doi.org/10.3390/app13084956
Şengönül E, Samet R, Abu Al-Haija Q, Alqahtani A, Alturki B, Alsulami AA. An Analysis of Artificial Intelligence Techniques in Surveillance Video Anomaly Detection: A Comprehensive Survey. Applied Sciences. 2023; 13(8):4956. https://doi.org/10.3390/app13084956
Chicago/Turabian StyleŞengönül, Erkan, Refik Samet, Qasem Abu Al-Haija, Ali Alqahtani, Badraddin Alturki, and Abdulaziz A. Alsulami. 2023. "An Analysis of Artificial Intelligence Techniques in Surveillance Video Anomaly Detection: A Comprehensive Survey" Applied Sciences 13, no. 8: 4956. https://doi.org/10.3390/app13084956
APA StyleŞengönül, E., Samet, R., Abu Al-Haija, Q., Alqahtani, A., Alturki, B., & Alsulami, A. A. (2023). An Analysis of Artificial Intelligence Techniques in Surveillance Video Anomaly Detection: A Comprehensive Survey. Applied Sciences, 13(8), 4956. https://doi.org/10.3390/app13084956