1. Introduction
Mitigating climate change requires the development of technologies that combine energy and transport sectors. One of them is the production of sustainable fuels from electricity and carbon dioxide via power-to-liquid (PtL) processes. As one option of splitting CO
2, plasma-based processes promise a high potential due to their flexibility, scalability, and theoretically high efficiencies. The use of renewable energies to operate the traffic and transport sector plays an important role due to the high energy requirements and the large part of global CO
2 emissions (20%) [
1].
Driven by economic and political interests, renewable energies are set to become the dominant source of electricity worldwide. Based on announced pledges by governments, the global share of electricity in total final energy consumption will rise from 20 percent in 2021 to 24 percent in 2030 and up to 39 percent in 2050 [
2]. According to reports of the European government, the share of renewable energy in Europe has more than doubled between 2004 and 2021 [
3].
In Germany, for example, the installed electrical capacity of renewable energies was expanded from 4.4 MW in 1990 to 139 GW (46% wind, 42% photovoltaics) in 2021 [
4].
New acceleration plans were also published at the beginning of 2023 to further accelerate the expansion. One target is the expansion of offshore wind power plants from 8 GW (2022) to 30 GW (2030) and then to 70 GW (2045) [
5].
The goal of the expansion of renewable energies is not only the conversion of the power supply but also the electrification of various sectors, especially the transport segment and the chemical industry. In addition to accelerating the expansion of renewable energies, the German government published a power-to-liquid (PtL) roadmap in 2021 [
6]. The roadmap defines measures to enable CO
2-neutral and sustainable flying. As the electrification of air traffic is hardly possible according to the current state of knowledge, this transport sector will have to rely on liquid fuels (hydrocarbons) in the long term. In the PtL roadmap, the annual use of 200,000 t of synthetic PtL kerosene is formulated as a target by 2030. This corresponds to approximately 2% of the kerosene refueled annually in Germany (as of 2019). The PtL roadmap identifies alternative syngas production as an important step toward achieving the defined targets.
The consumption share of syngas for the production of chemicals is around 80%. The demand for syngas is estimated to grow approximately 5% per year with a value of
m
3 (normal cubic meters) in 2022, leading to high CO
2 emissions in conventional production. The main source of syngas production is coal, with a share of 50%, followed by natural gas at around 15%. Sixty percent of the production and half the consumption of syngas take place in China [
7].
Since fossil fuels are finite and recent crises have shown us how quickly the price of natural gas can rise (500% percent price rise in Germany from mid–2021 to mid–2022 [
8]), defossilization is a necessary step alongside electrification and decarbonization.
Due to the high demand for syngas and the desire for defossilization, the question of the best-performing PtL processes is huge. In addition to the further development of individual process steps, system integration and the interaction of individual process components take on an important role. Gas separation processes for coupling, in particular, play an important role in system integration. Economically, these process steps have had a major impact, which has been investigated, for example, in the study by Sofia et al. on the use of selective membranes for hydrogen [
9]. For better planning and further development of PtL plants, process engineering modeling and coupled analyses are indispensable.
In the report “E-Fuels: a techno-economic assessment of European domestic production and imports towards 2050”, published in 2022 by Concawe [
10], individual power-to-liquid plants were considered techno-economically. Based on the boundary conditions, fuel costs for synthetic diesel were estimated between EUR 1.9/L and EUR 2.9/L for the year 2050, depending on the location in Europe (e.g., Germany: EUR 2.4/L). The location-dependent cost variation is due to the cost of electricity, which is expected to be higher in Northern and Central Europe than in Southern Europe. The cost of electricity consists of slightly above 60% of the costs. The considered power-to-liquid process uses hydrogen generated via electrolysis to thermo-chemically split CO
2 in a reverse water gas shift reaction (RWGS) at 800 to 1000 °C and 30 bar pressure. The efficiency of the RWGS reaction was assumed to be 83%. As an alternative to synthetic diesel, it is possible to produce other electricity-based fuels from syngas, such as methanol or dimethyl ether [
11]. The results of the Concawe report show that these require lower manufacturing costs than synthetic diesel. Nevertheless, the prices will be at least twice as high as fossil diesel of EUR 0.8/L in 2050 [
10].
In their paper from 2016, Albrecht et al. also showed techno-economic results for power-to-liquid plants with Fischer–Tropsch synthesis with an RWGS reaction for CO
2 splitting [
12]. They obtain fuel costs between EUR 2.2 and EUR 2.8/L as a result, with a 60% share of electricity costs.
The research initiative Energiewende im Verkehr (EiV) of the German Ministry for Economy and Climate Protection (BMWK) deals with the use of electricity-based fuels. More than 100 research groups that deal with alternative fuels for large transport volumes and distances are being funded [
13]. The results of the research groups should promote the coupling of the electricity and transport sectors and enable a reduction in greenhouse gas emissions. The individual joint projects are networked via the accompanying research on the energy transition in transport (BEniVer) of the German Aerospace Center (DLR). Its focus is on the consideration of technical, economic, ecological, and social effects. A standardized method for determining the production costs is being used to compare the individual fuel production processes.
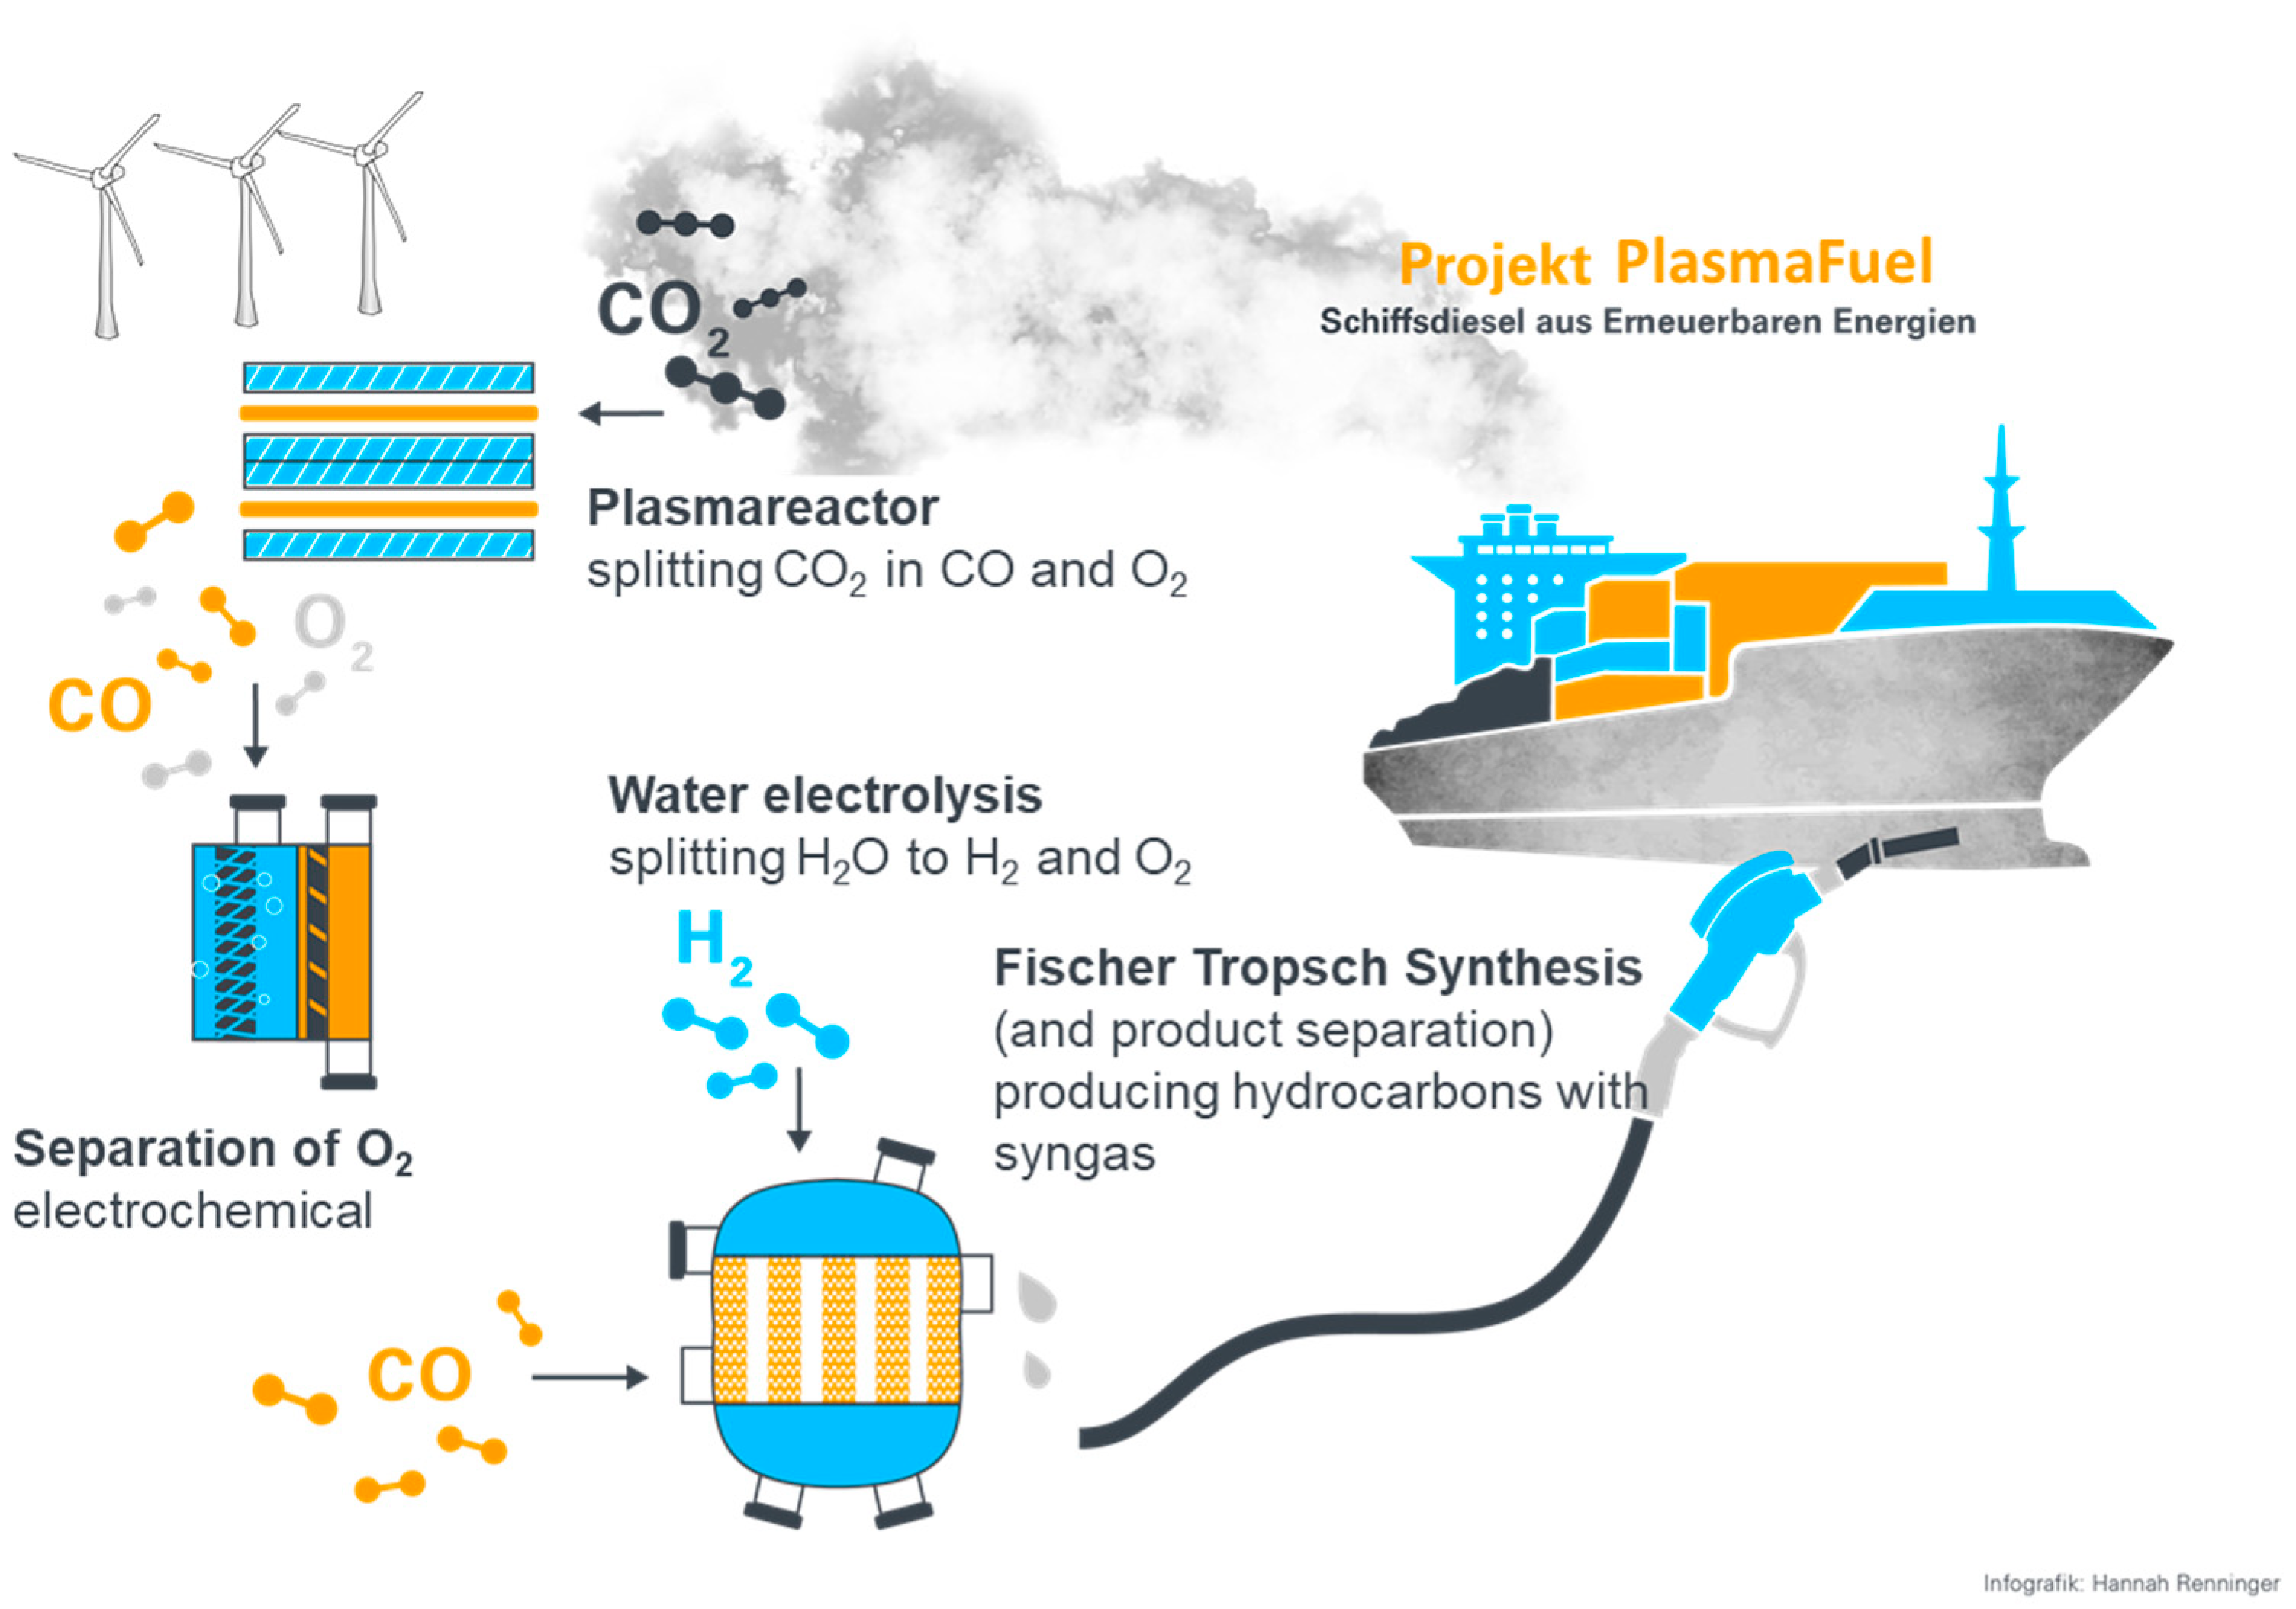
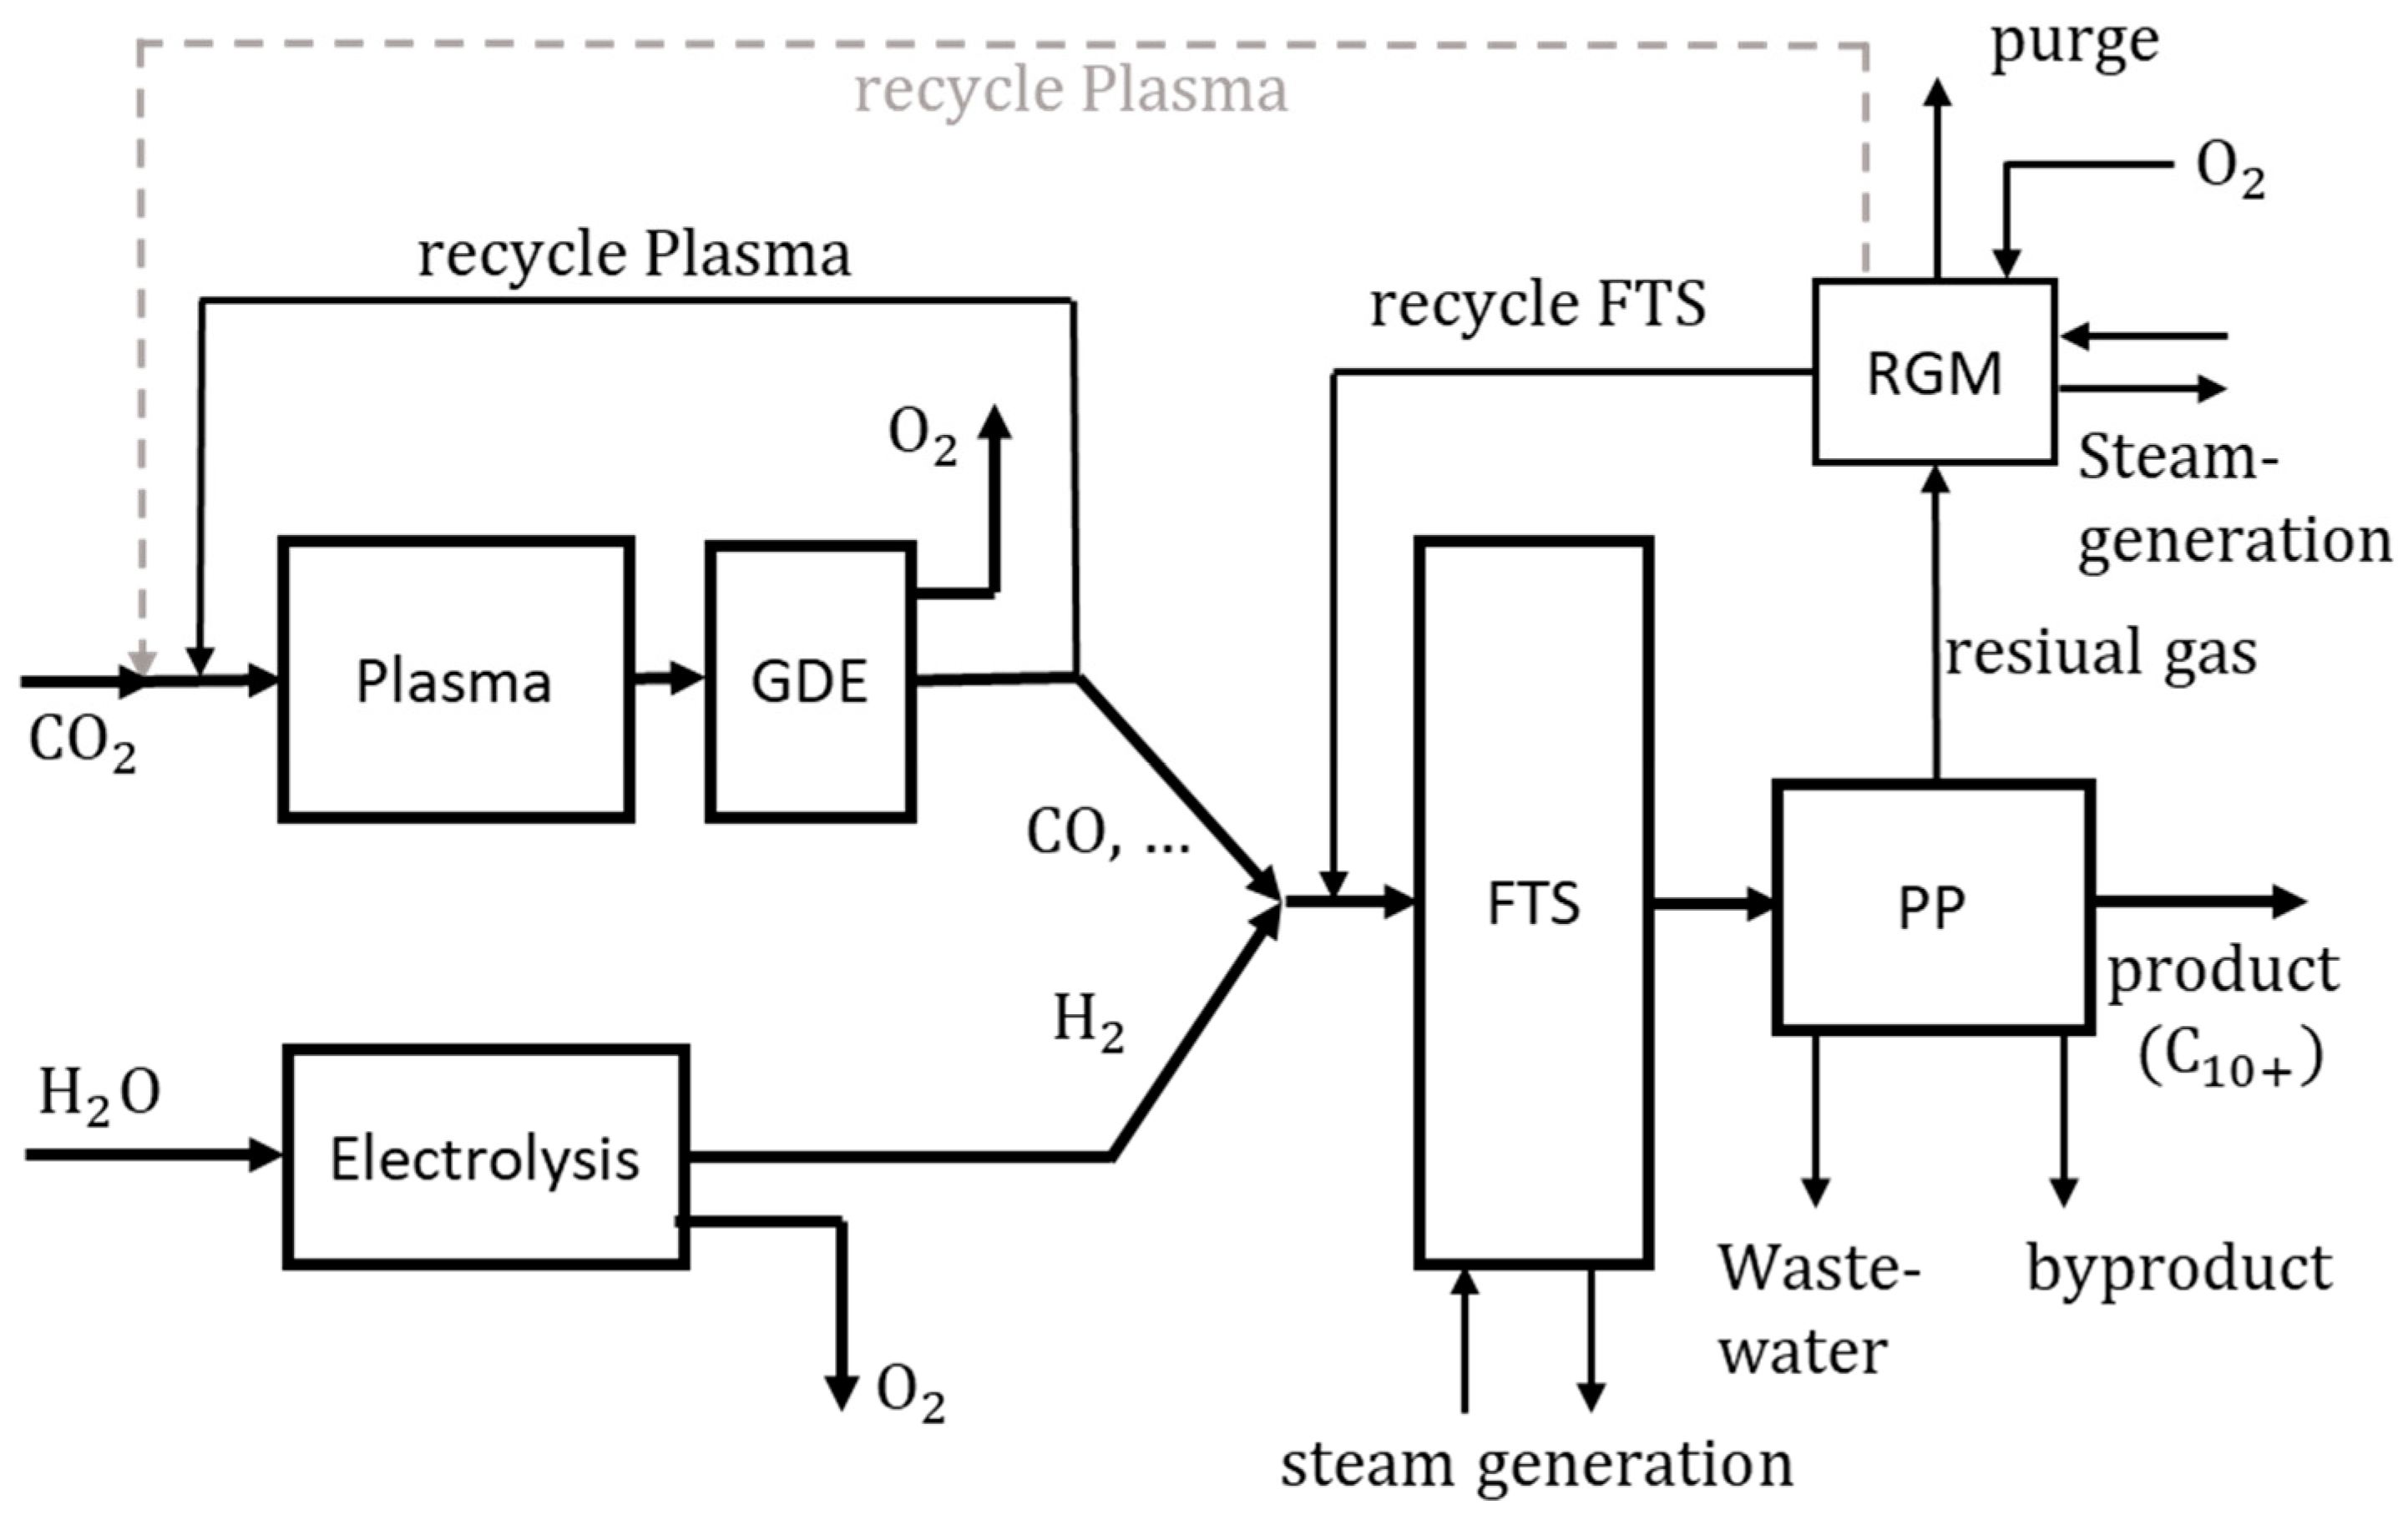
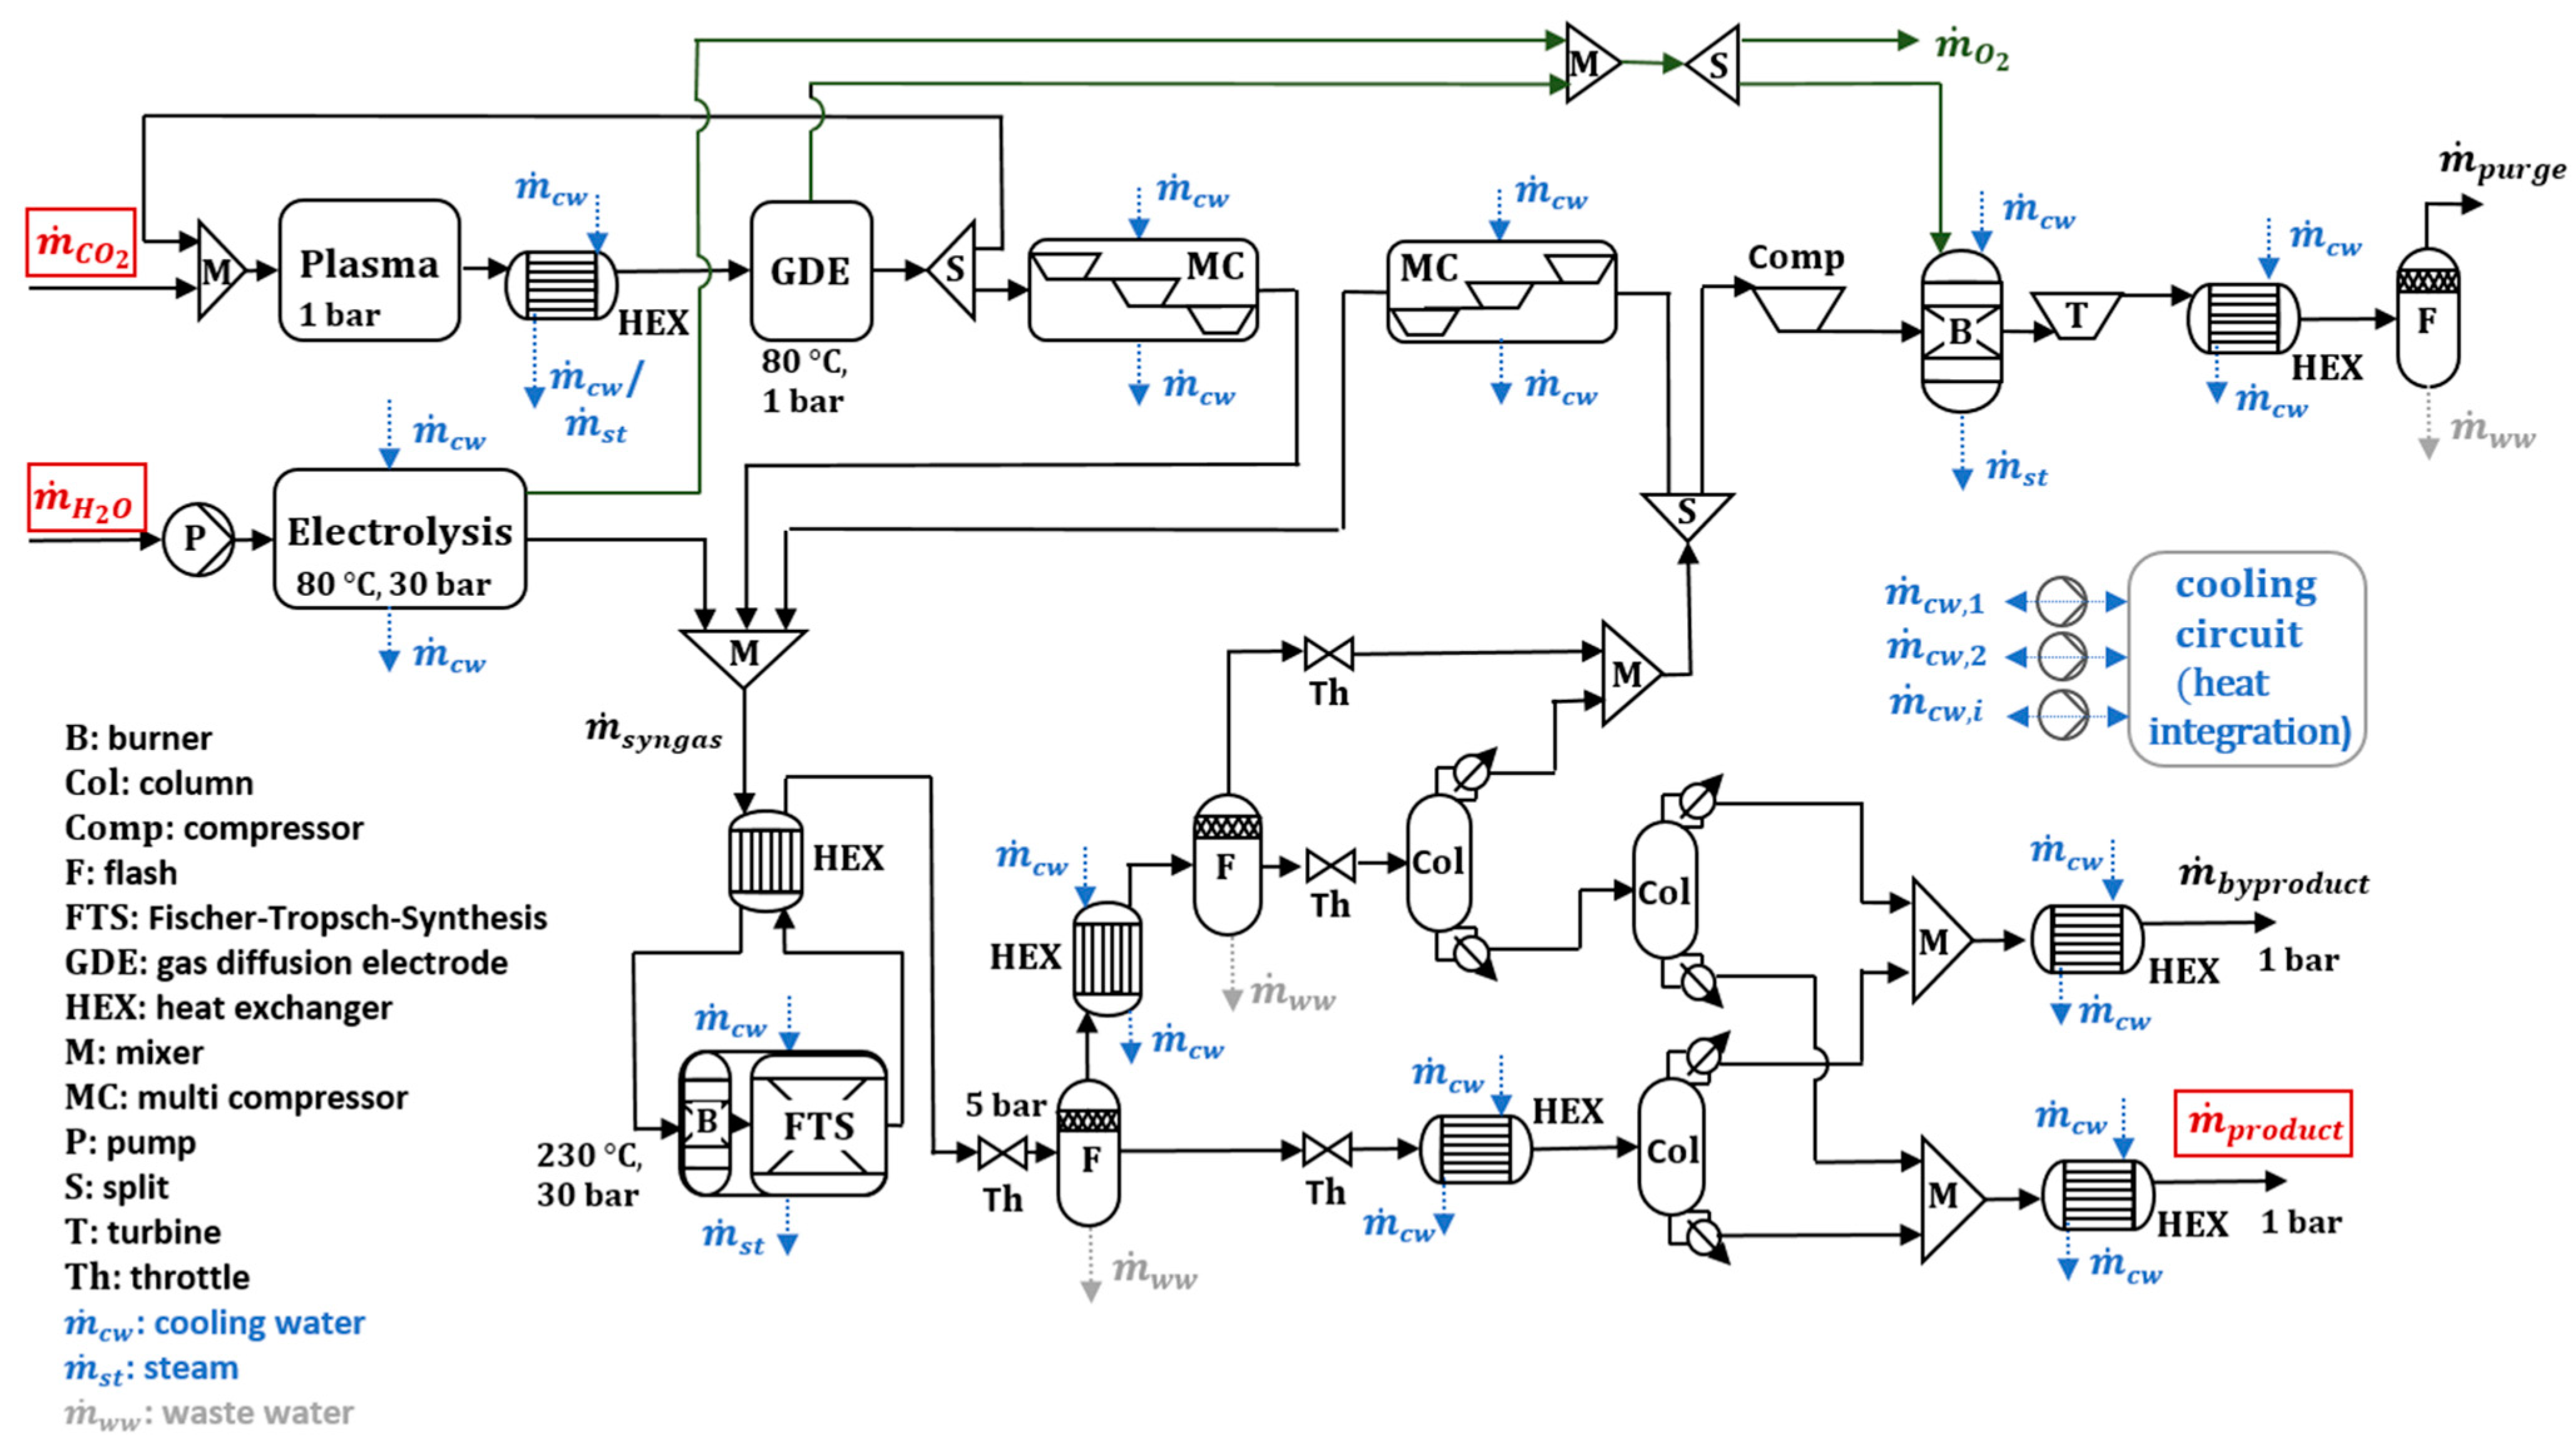
The PlasmaFuel joint project (2018–2022) in EiV, which includes the Institute for Photovoltaics (
ipv) at the University of Stuttgart, dealt with the plasma-induced production of fuel for shipping. In a PtL process using electricity from renewable energies, plasma-induced CO
2 splitting is linked to fuel production via the Fischer–Tropsch synthesis (FTS), as shown in
Figure 1. In this project, the plasma-based splitting of CO
2 into carbon monoxide (CO) and oxygen (O
2) through a dielectric barrier discharge (DBD) and a variation of a gliding arc discharge (GA) was carried out. Through subsequent oxygen separation, the CO was synthesized together with electrolysis-H
2 in a Fischer–Tropsch reactor to form marine diesel. The energy required for this was supplied by excess wind power.
The Smart Freight Centre and the European Chemical Industry Council provide average values of transport CO
2 emissions (g CO
2 per t km) for chemical–pharmaceutical industry transports [
14]. The values for road transport are 71, for rail transport 19, for inland waterway ships 25, for ocean-going ships only about 4, and for airplanes 1060
. Due to very high loading capacities and comparatively low CO
2 emissions, large-scale transports by container ship cannot be replaced.
The generation of electricity-based marine diesel is an important area of development for several reasons. On the one hand, the electrification of shipping is not feasible. The reasons for this are the high costs and excessive mass of the battery units needed, based on their low energy densities and the charging infrastructure. In the following case example, the problem is taken up again. The energy consumption of a big container ship with a typical 200.000 t payload over a 10.000 km transport distance ) can be estimated as bigger than (dimensions: 400 m, 60 m, 15 m; a cruising speed of 10 m/s, and friction value of 0.0025). Comparing the specific energy of chemical fuels () and electrochemical cells (), much of the payload must be dispensed. With a usual 1 day of charging, the ship would need more than 300 MW of electrical power to fill the energy storage. On the other hand, conventional ship fuel releases sulfur emissions when burned; to reduce these emissions, the shipping industry is striving to further develop exhaust gas cleaning systems and to use alternative fuels. An alternative to synthetic fuel is the use of hydrogen and conversion to electricity in fuel cells. Since the storage of gaseous hydrogen under high pressure involves very large reservoirs due to the low density, and liquefaction requires very costly insulation and energy for cooling, integration in long-haul aircraft and container ships is still problematic.
In summary, it can be said that the production of synthetic fuels for the ship and aviation sectors is an important part of the energy transition. The development and optimization of technologies such as CO2 splitting are necessary to design the required power-to-liquid plants. In addition, considerations of the entire process chain and investigation and comparison of technical and economic performances are necessary. This can be carried out through techno-economic analyses, in which the costs of a fuel produced can be estimated.
In addition to previous studies on the feasibility of synthetic fuels, this work provides insights into the integration of plasma-based CO2 splitting into PtL plants. The work, thus, extends the previously considered paths to synthetic fuels by a plasma-based option. For this purpose, the reactors investigated in the PlasmaFuel joint project are integrated into a process chain to produce sulfur-free sustainable marine diesel. Since processes of plasma-based CO2 splitting have several advantages but still require further development, this work examines its feasibility and economic potential. The modeling and techno-economic analyses address the research questions: How expensive is the production of plasma-induced, pollution-free sustainable fuels? What are the biggest levers regarding efficiency? Is it possible to produce plasma-based synthetic diesel for EUR 2.0/L or less? How big is the impact of the electricity costs via renewable energies?
2. State of the Art
In the following, a brief review of plasma-based CO2 splitting is presented. In the reviewed literature, no techno-economic consideration of system integration in PtL plants has been considered so far; therefore, this work provides a valuable addition to the consideration of this plasma application.
2.1. Plasma-Based CO2 Splitting—A Short Review
Plasma technologies are promising in power-to-liquid processes due to their simple operating conditions and flexible use as renewable electrical energy. The term plasma describes an ionized gas in which at least one electron is not bound. Plasma can be achieved from the gaseous third state of matter by heat input, electric fields, and radiation. In non-thermal plasma, the temperatures of the individual plasma parts differ significantly. The electron temperature of about 10,000 K is significantly higher than all other temperatures (neutral particles, oscillating particles, ions). As a result, reactions operate in non-thermal plasmas that could not occur from a thermal point of view. Warm plasma represents a middle ground between thermal and non-thermal plasma. It contains properties of both types of plasma and is characterized by both high electron density and a high degree of non-equilibrium. Bogaerts and Centi describe this type of plasma as very promising for CO
2 conversion due to its high process flexibility, which allows different types of reactions to be carried out (e.g., pure CO
2 splitting, as well as CO
2 conversion in the presence of CH
4, H
2, or H
2O [
15,
16,
17]).
In addition, the investment and operating costs are very low, and rare earth metal-based catalysts are not necessarily required for the reactions. Another advantage is its possible application in a modular environment, since plasma reactors are linearly scaled with the plant capacity, allowing production according to demand. One of the most important advantages is the very simple linkage with renewable electricity. When plasma generation is combined with an additionally introduced catalyst, this is referred to as plasma catalysis. A distinction is made between in-plasma catalysis (catalyst in the plasma) and post-plasma catalysis (catalyst after the plasma). Compared to thermal processes, significantly smaller amounts of catalysts are required, and reactions can be carried out at much milder operating conditions (low pressures, low temperatures) due to the properties of non-thermal plasmas. In addition, interactions occur between the plasma and the catalyst (e.g., changes in the electric field or changes in the catalyst surface), which positively affects both. The applications of plasma catalysis are versatile, and
Table 1 shows some processes, their reactants, and products, as well as their technology readiness levels (TRL) [
15].
The challenges in applying plasma catalysis are the optimization and control of processes in terms of conversion, selectivity, and efficiency. Since the vibrational excitations triggered in the plasma significantly reduce the activation energy of reactions, plasma-based processes and plasma catalysis have very high potential in terms of energy efficiency. Moreover, the interactions between plasma and the catalyst are still not clear due to their complexity and require real-time studies directly at the interaction sites. In addition to a better understanding of plasma–catalyst interactions, Tu et al. mentioned the further engineering development of plasma processes regarding new reactor designs and further process engineering adaptations as an important step toward the optimal exploitation of this potential [
26].
To compare different plasma processes in the field of CO
2 splitting—conversion and efficiency must be considered. The efficiency
of the plasma-based CO
2 splitting can be assumed to consist of the effective conversion of CO
2 , and the specific energy input
is related to the standard reaction enthalpy of the CO
2 splitting reaction of
[
18].
where
is the molar stream of CO
2 at the inlet of the reactor,
is the molar stream at the inlet of the reactor,
is the molar stream of CO
2 at the outlet of the reactor, and
is the electric power input to the reactor.
Snoeckx and Bogaerts et al. considered the different plasma technologies for CO
2 splitting in their 2017 study [
18]. The paper focused on dielectric barrier discharge, and gliding arc and microwave plasmas. Different studies were summarized and plotted in a conversion–efficiency diagram. Microwave plasmas with both a high conversion and efficiency stood out. Gliding arc plasmas achieve high efficiencies with low conversions. Dielectric barrier discharge (DBD) plasmas perform worse due to the reduced field strength deviating from Microwave plasma (MW) and gliding arc plasma (GA), with a few exceptions.
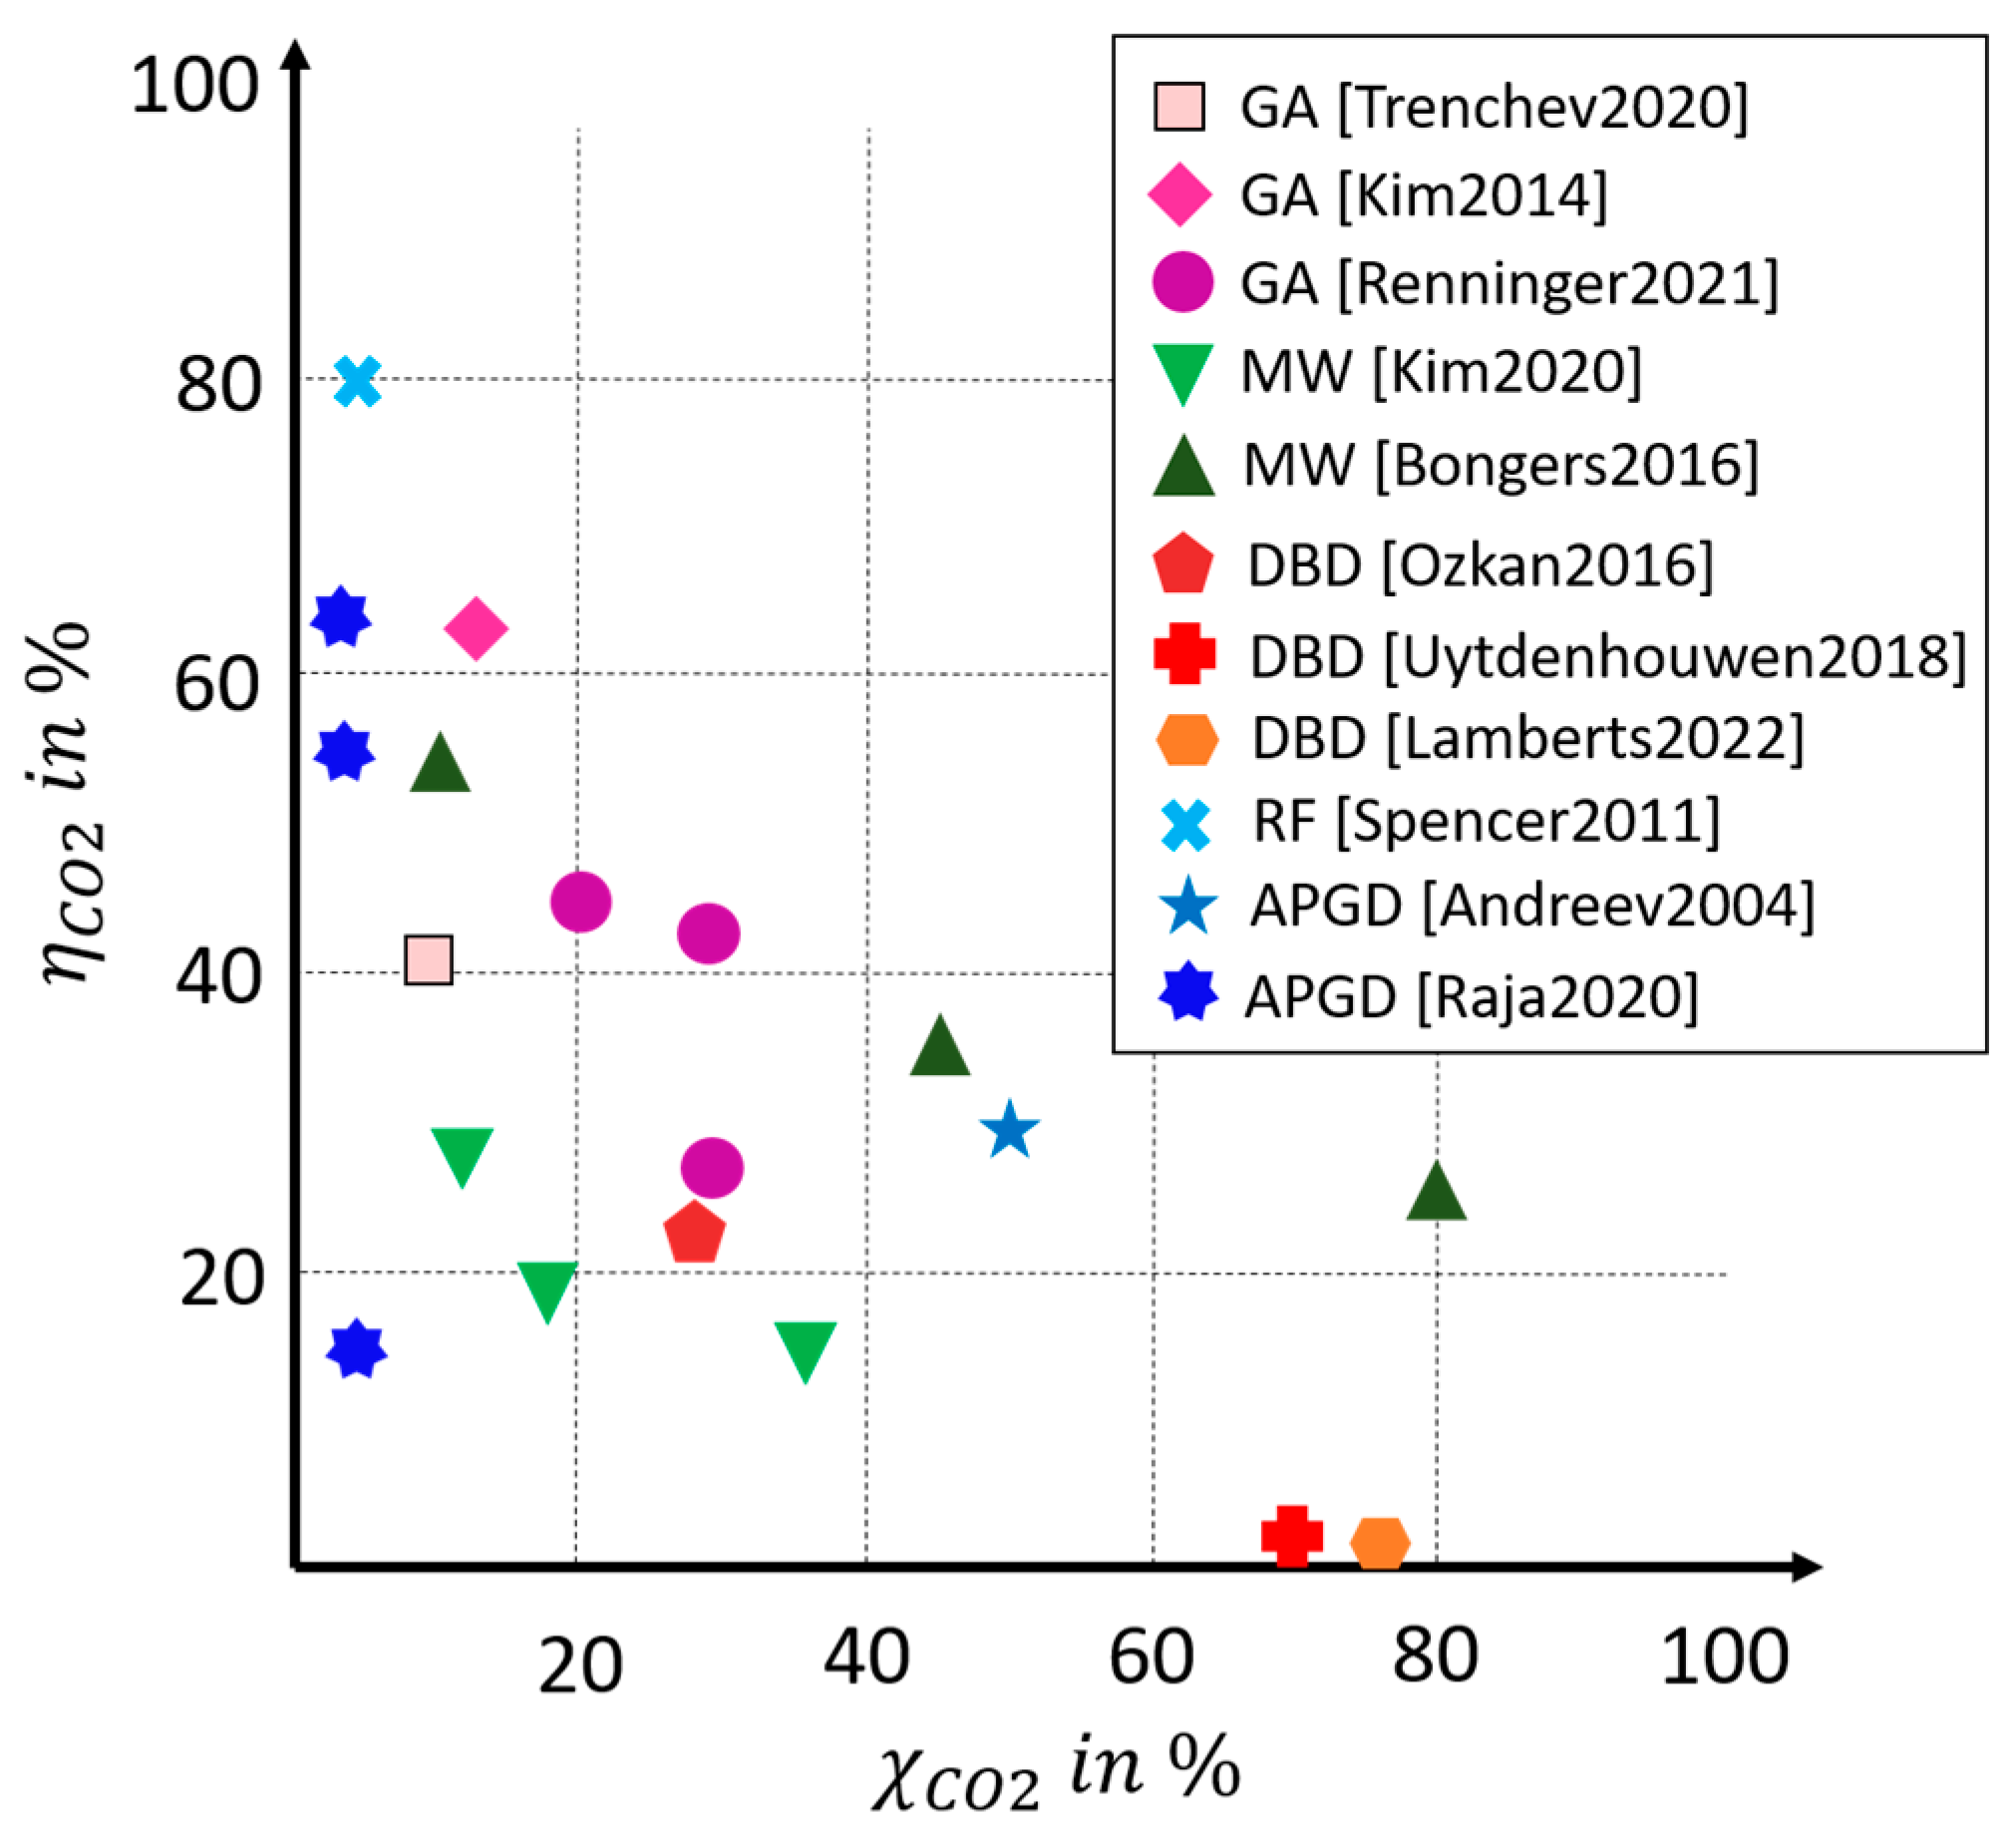
In a comparative study from 2021 by Renninger et al., experimental studies on plasma-based CO
2 splitting were considered and compiled [
27]. Only studies that achieved comparatively high conversions and/or efficiencies for the individual technologies were included. Minor extensions were made to the original diagram; the adjusted diagram is shown in
Figure 2.
Ozkan et al. conducted experiments with a coaxial DBD reactor, varying a number of parameters, including the flow rate, operating frequency, power, barrier thickness, and duty cycle [
38]. By using a burst mode, they were able to achieve an efficiency of 23%, which is comparably high for a DBD reactor, with a conversion of 26%. Uytdenhouwen et al. achieved the highest DBD conversions of 71% by reducing the gap size of the reactor; however, the efficiency of the reactor was only 2.5% [
39].
Lamberts et al. published a techno-economic assessment of CO
2 splitting with a DBD reactor in 2022. Experiments were carried out on a coaxial design with an integrated catalyst-packed bed [
34]. The packed bed, the residence time, the specific energy input, and the feed were varied. When varying the feed, pure CO
2 splitting and dry reforming of methane (CO
2 and CH
4 feed) were investigated. For the analysis of the economic feasibility, the net present value (NPV) was determined, which offset incoming and outgoing cash flows. This resulted in only negative values that were largely due to the high electricity costs, which were assumed to be EUR 80/MWh in the study. Among the considered experiments, the studies with CO
2 and CH
4 performed better than the pure CO
2 splitting. For CO
2 splitting, a maximum conversion of
with an
(
) was achieved. The energetic consideration was carried out via the specific energy consumption, which amounted to 90 MJ/mol at the maximum conversion. Converted into the previously defined efficiency of CO
2 splitting, this resulted in
. At
, a conversion of 40% was obtained with a specific energy consumption of 30 MJ/mol
). Under the mixture of CH
4 (ratio 1:1 molar), conversions of
were obtained with a specific energy consumption of 80 MJ/mol. In the economic analysis, capital costs of
were estimated for a 144 kW pilot plant, based on reactor costs and the associated power supply, which corresponds to specific costs of EUR 1.300/kW for this size.
As part of the PlasmaFuel joint project, a gliding arc reactor was developed, and its results were published in two papers by Renninger et al. [
40,
41]. The GA discharge plasma reactor achieved a conversion of CO
2 of 27% at an energy efficiency of 42% at ambient pressure. The good performance was attributed to an efficient sweeping of the gas by discharge due to the magnetic field. The reactor setup used a magnetic field to force the plasma into a large disc-like volume and lead the working gas with a laminar gas flow through. The highest performance was achieved at
and
, which corresponded to
.
2.2. Oxygen Separation—Review and Experimental
Reducing carbon dioxide yields oxygen-rich gas, from which the oxygen must be extracted before further use is possible to inhibit recombination.
The amount of oxygen in the process gas was investigated in the PlasmaFuel project, and a 1% to 2% concentration was set as a maximum value that can be processed by the downstream Fischer-Tropsch synthesis. The influence of the oxygen content was investigated by Jess et al. [
42]. To reduce the oxygen content to 1%, a variety of technologies can be applied. Commonly, adsorption technologies or nanoporous membranes are used; however, both are not able to deliver high-purity gases or extract traces of oxygen from gases. A lot of research is currently being undertaken on high-temperature solid electrolyte ion pumps, which offer high selectivity for oxygen. However, these systems require a catalyst as well, which can lead to coking issues when carbon monoxide is present. Finding high-temperature solutions that offer high current density while being robust is an ongoing field of research. Low-temperature electrolysis can resolve this issue in theory; however, a fitting catalyst is also required that is stable in the presence of carbon-containing gases.
Different oxygen separation approaches are characterized in the following. The challenge of oxygen separation lies in the gas composition of the mixed gas from which the oxygen is to be separated. Originally, a zirconium dioxide electrode was considered for this task. Commercially available zirconium dioxide membranes use a catalyst to split the molecular oxygen into atomic oxygen, which can be conducted. This is typically a platinum-group metal. Such catalysts are poisoned by carbon monoxide (CO) and carbon dioxide (CO2), i.e., their active surface area decreases rapidly. Research reveals several potential alternative technologies. These include nanoporous membranes, which enable low-temperature applications. They are operated by diffusion, i.e., a pressure difference. The main disadvantage is their low separation efficiency due to the similar permeability of O2, CO, and CO2 of the membrane.
Better separation efficiencies are achieved by electrochemical methods. For example, a zirconium dioxide membrane has high selectivity and is commercially available but requires a working temperature
T > 600 °C. Working temperature, selectivity, and flow rate are, therefore, relevant parameters. Perovskite membranes belong to the group of mixed ionic electric conductors (MIEC) and can be manufactured both monolithically and asymmetrically [
43]. At low temperatures of
T = 150 °C, they can be used as a catalyst for oxygen uptake. For significantly higher temperatures, the function of a separation membrane is also possible, although the asymmetric membrane has, so far, only been CO
2-resistant to a limited extent. In addition, a perovskite membrane is conceivable as an electrode for electrochemical substance separation, but developments of this kind would have to be pursued in cooperation with research groups experienced in this field.
Gas diffusion electrodes are another option and are used in the chemical industry. They achieve sufficient fluxes at low operating temperatures and sufficient selectivity. The question of a suitable catalyst also arises here. Pressure swing adsorption or temperature swing adsorption can both be used to separate oxygen from the gas mixture but require a large amount of energy in the form of heat [
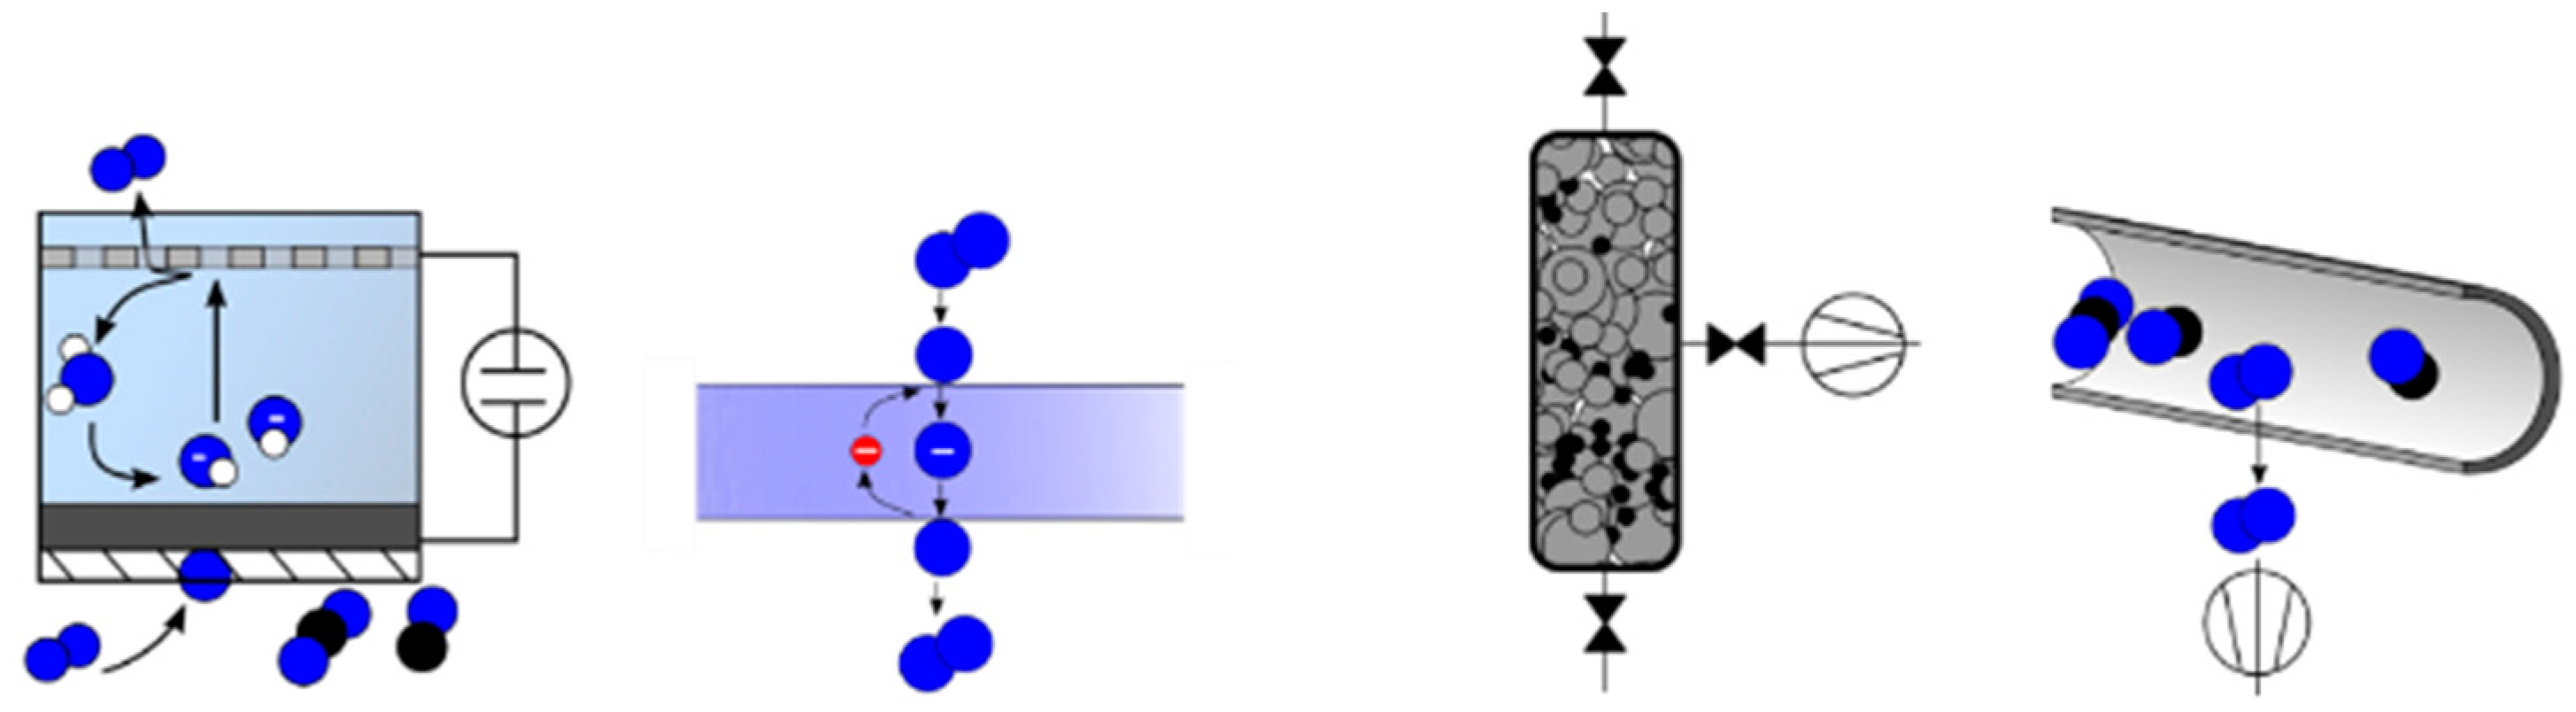
44]. The last technology considered is the molten carbonate fuel cell (MCFC) membrane, which can be used in reverse mode for oxygen separation. Currently, this patented membrane is only sold by one company at a very high price and is consequently not commercially available in a cost-efficient way.
The possible processes for oxygen removal are summarized graphically in
Figure 3.
After evaluating the possible technologies for extracting oxygen from a mixed gas stream, a separation process for PlasmaFuel has been selected. Because of its innovation potential and technical advantages, the gas diffusion electrode (GDE) was investigated.
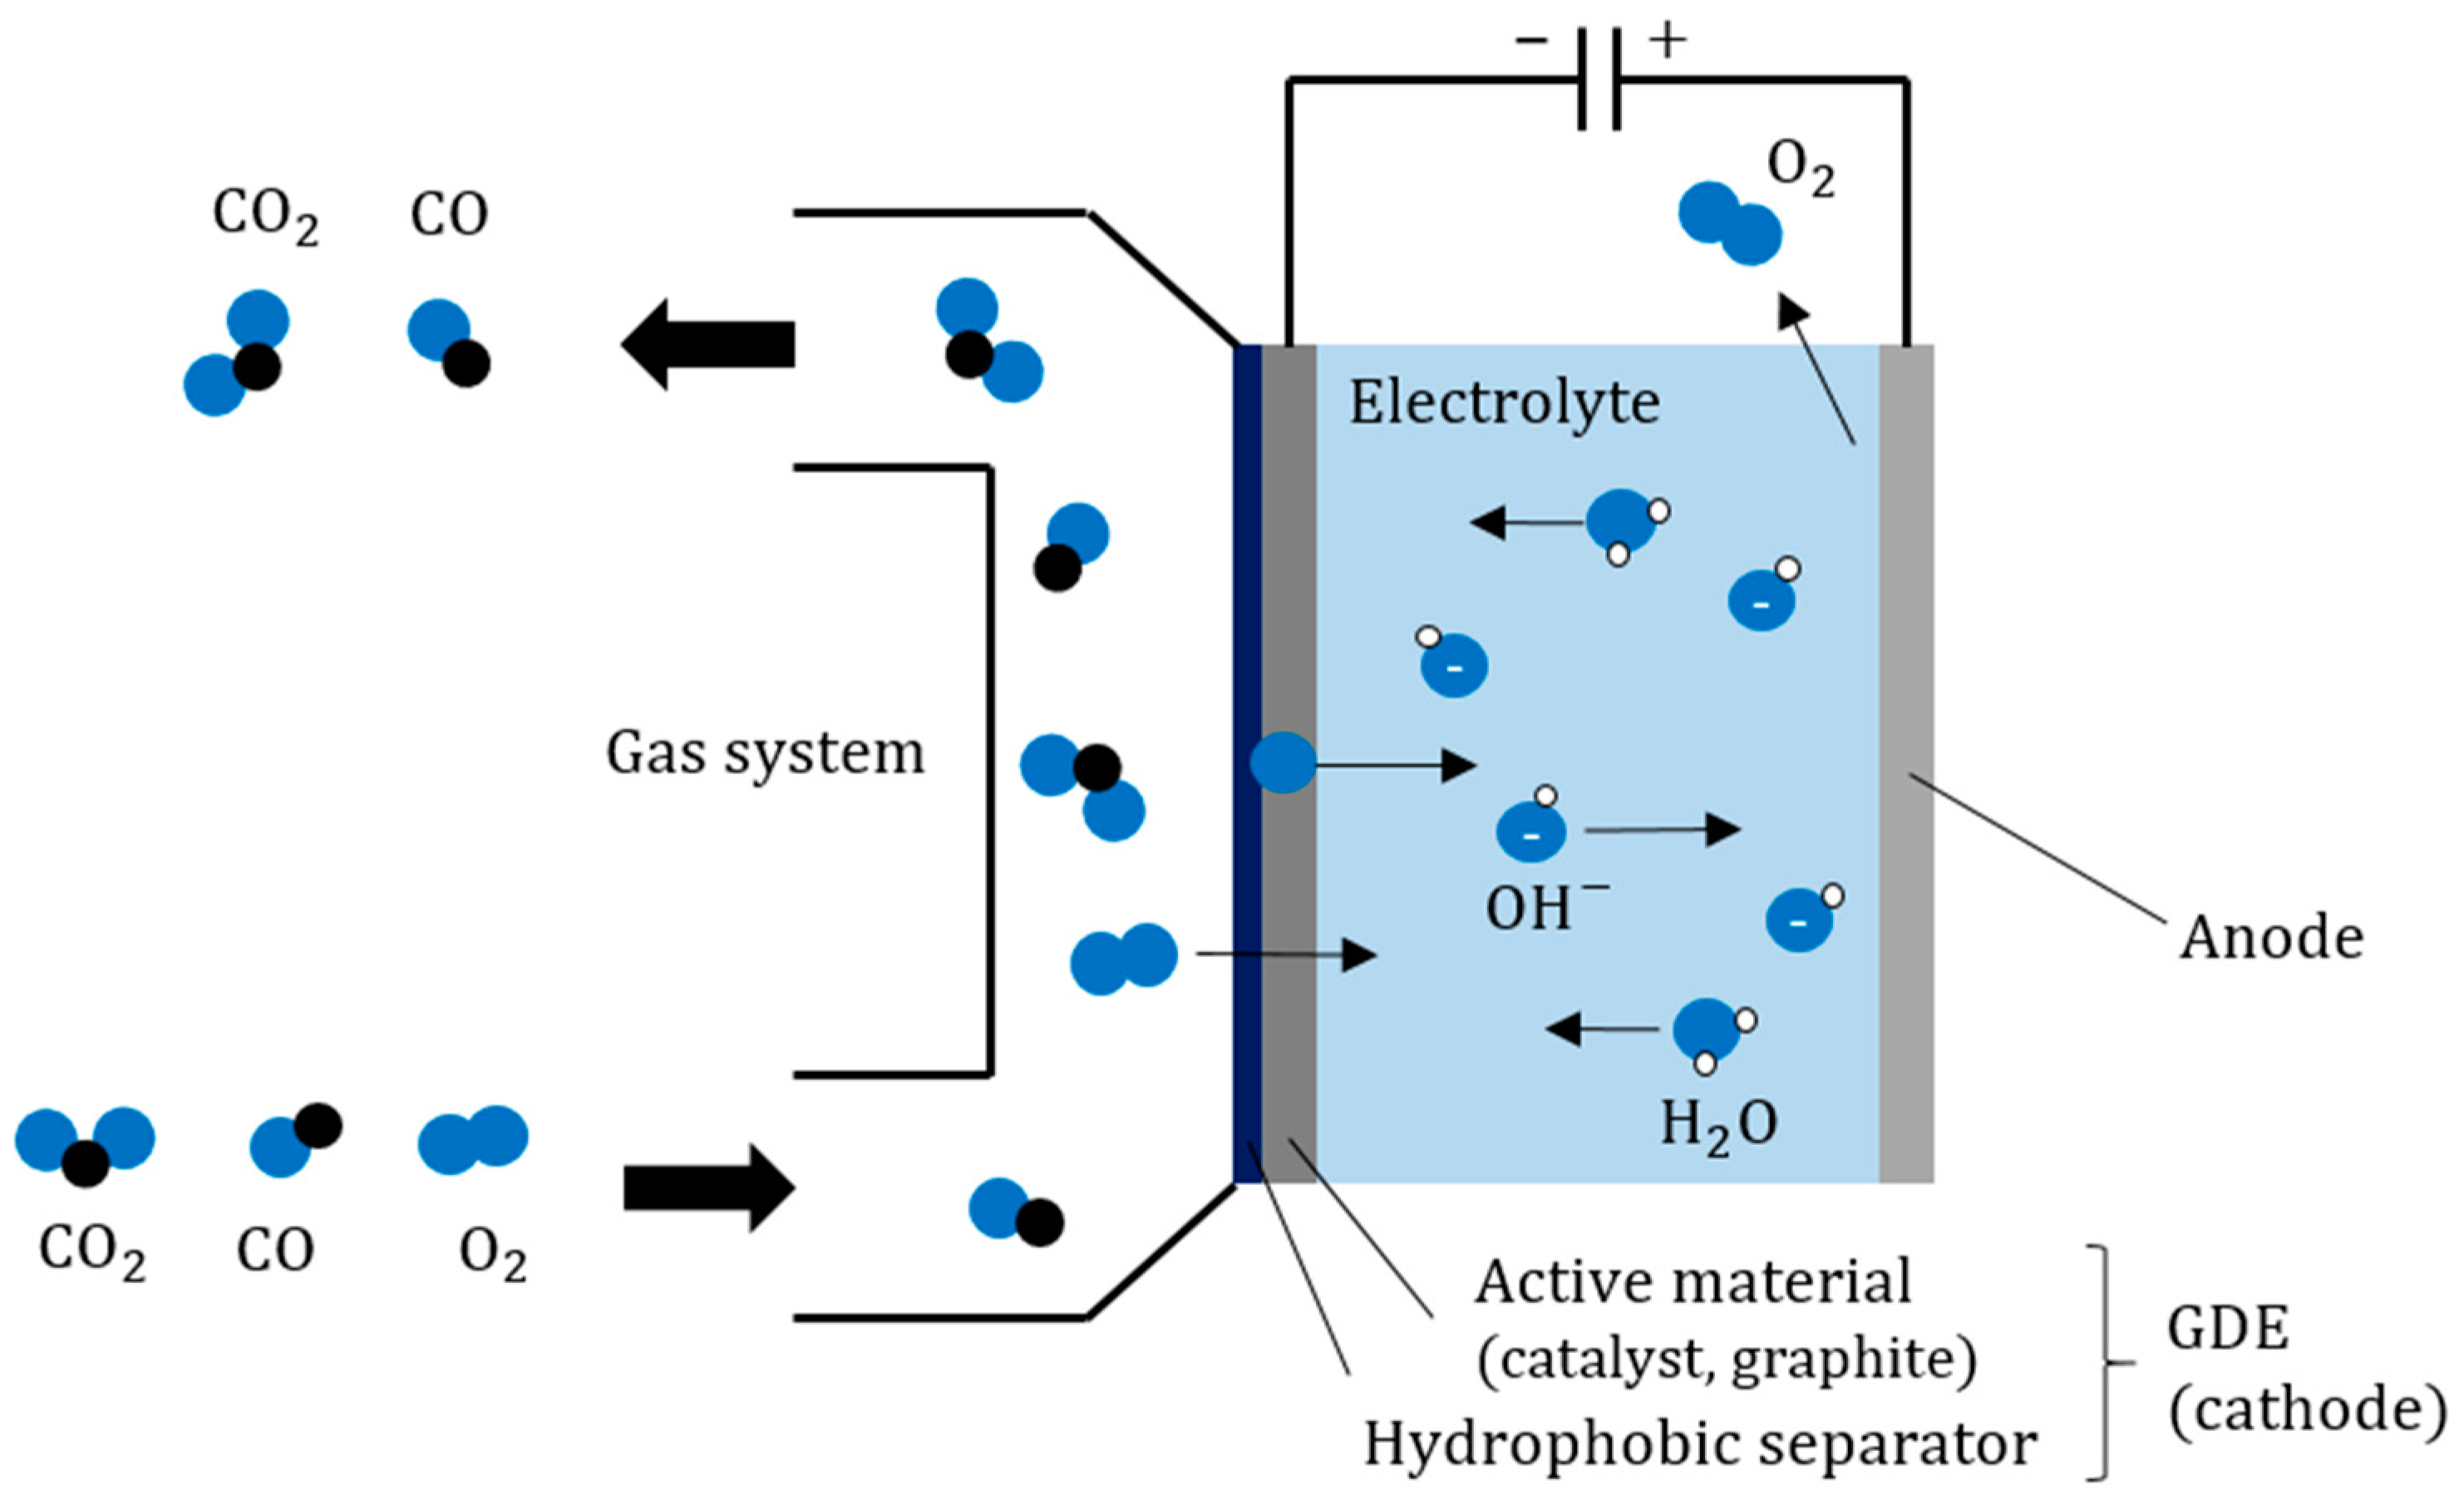
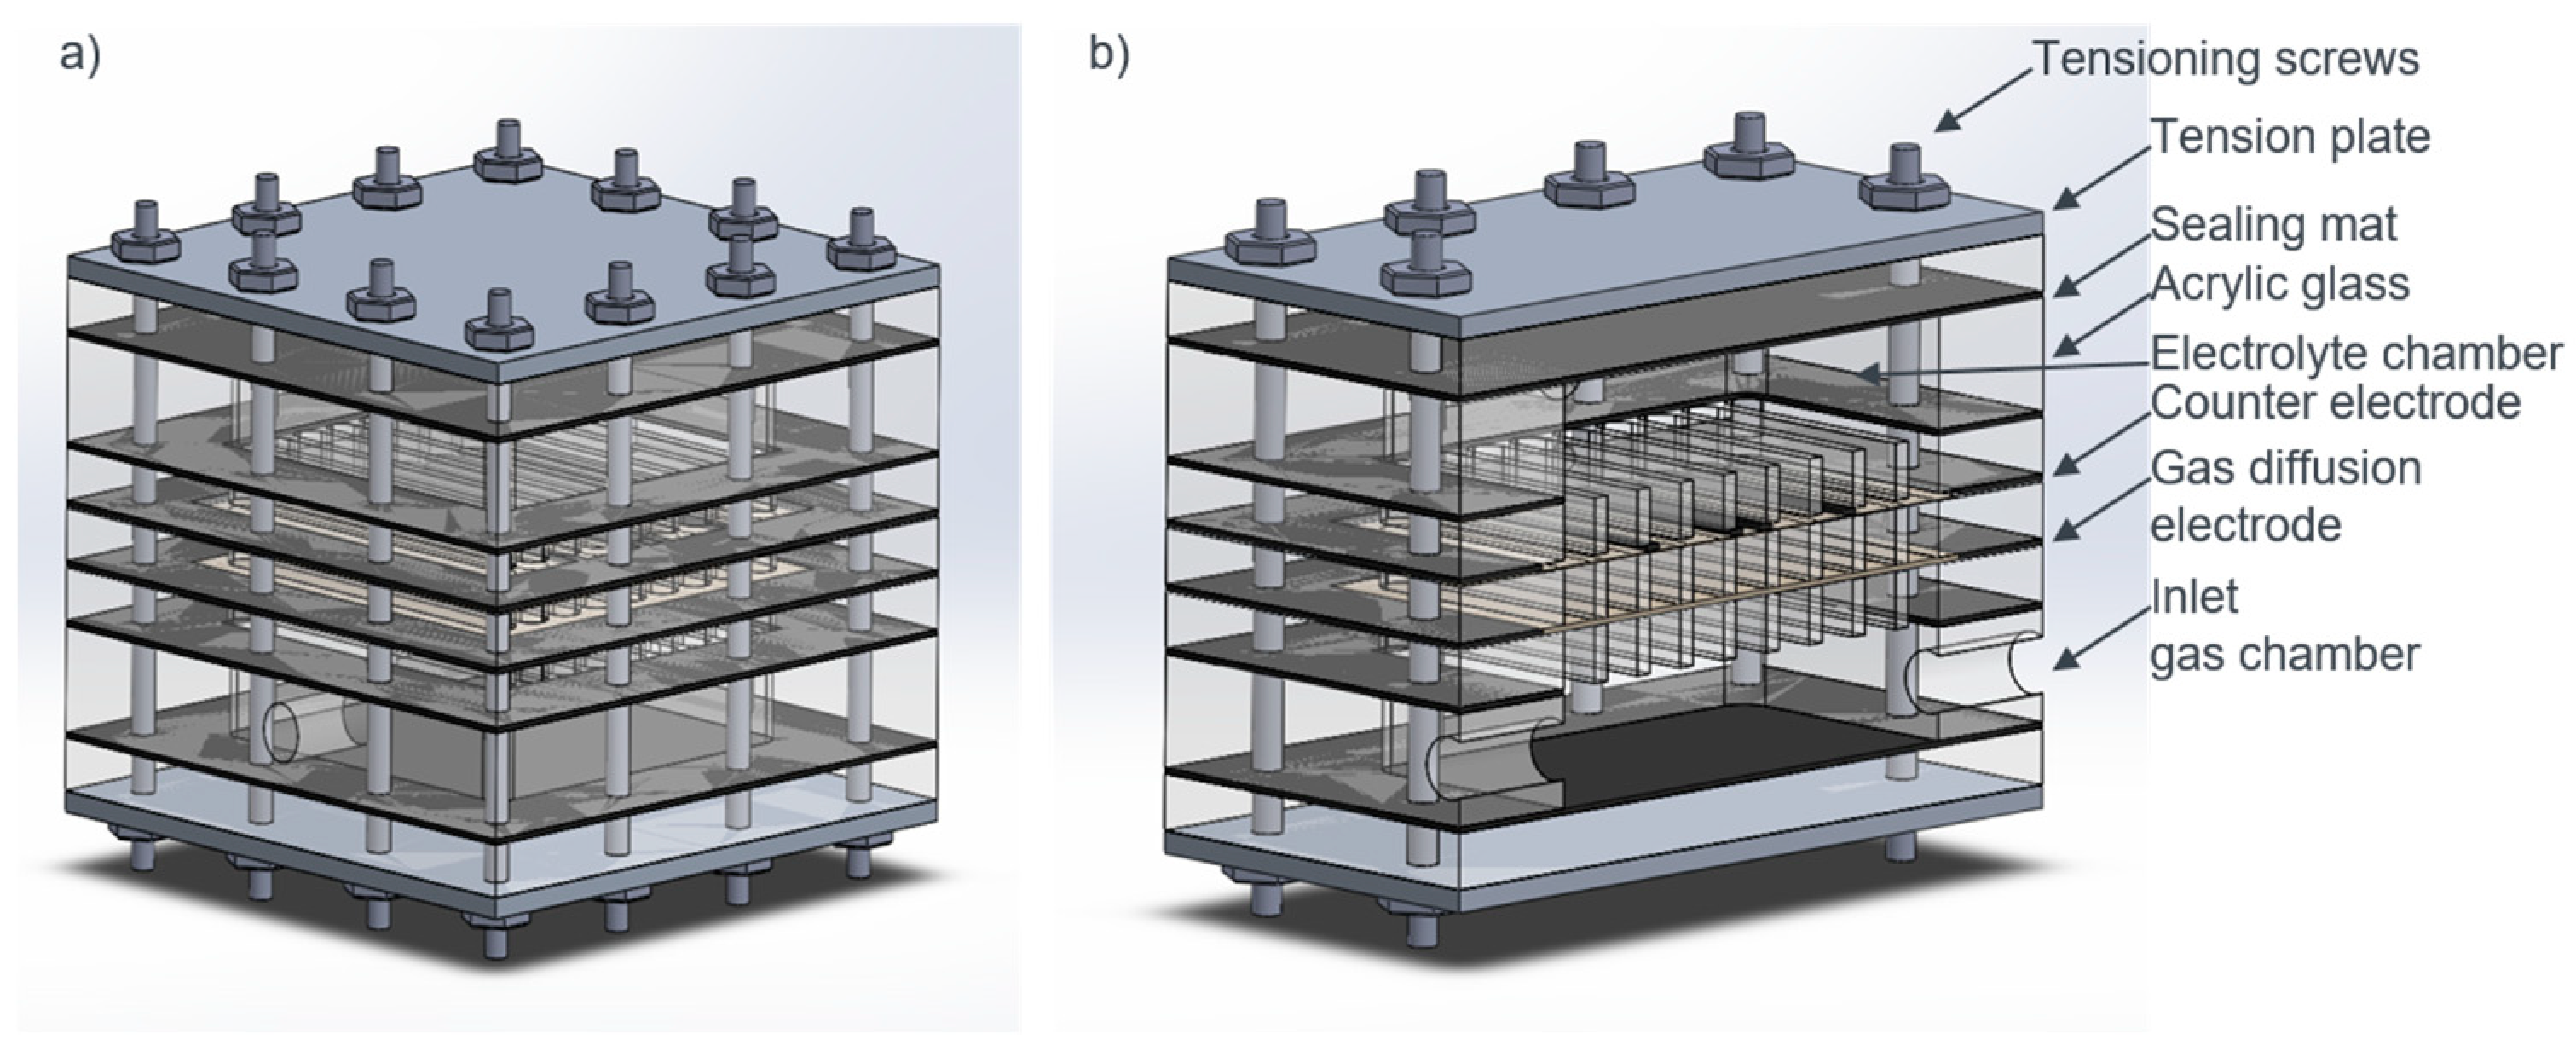
Gas diffusion electrodes (GDE) are used in the fuel cell industry. As a multi-layer porous electrode made of active material and a hydrophobic layer, it enables the separation of oxygen (O
2) from a material flow. A mixed gas of CO
2, CO, and O
2, in which the O
2 is to be removed, is used as an example. The working principle and design of a GDE separation device is depicted in
Figure 4 and
Figure 5, respectively. Oxygen gets into the adjacent electrolyte through the multi-layered GDE (cathode). The hydrophobic separator on the gas side ensures that no liquid electrolyte can penetrate the gas system. The active material of the GDE consists of a catalyst (e.g., silver oxide, manganese oxide) with graphite. The graphite gives the electrode sufficient porosity to allow gas and electrolyte to penetrate. The electrolyte used was 17% potassium carbonate solution (K
2CO
3).
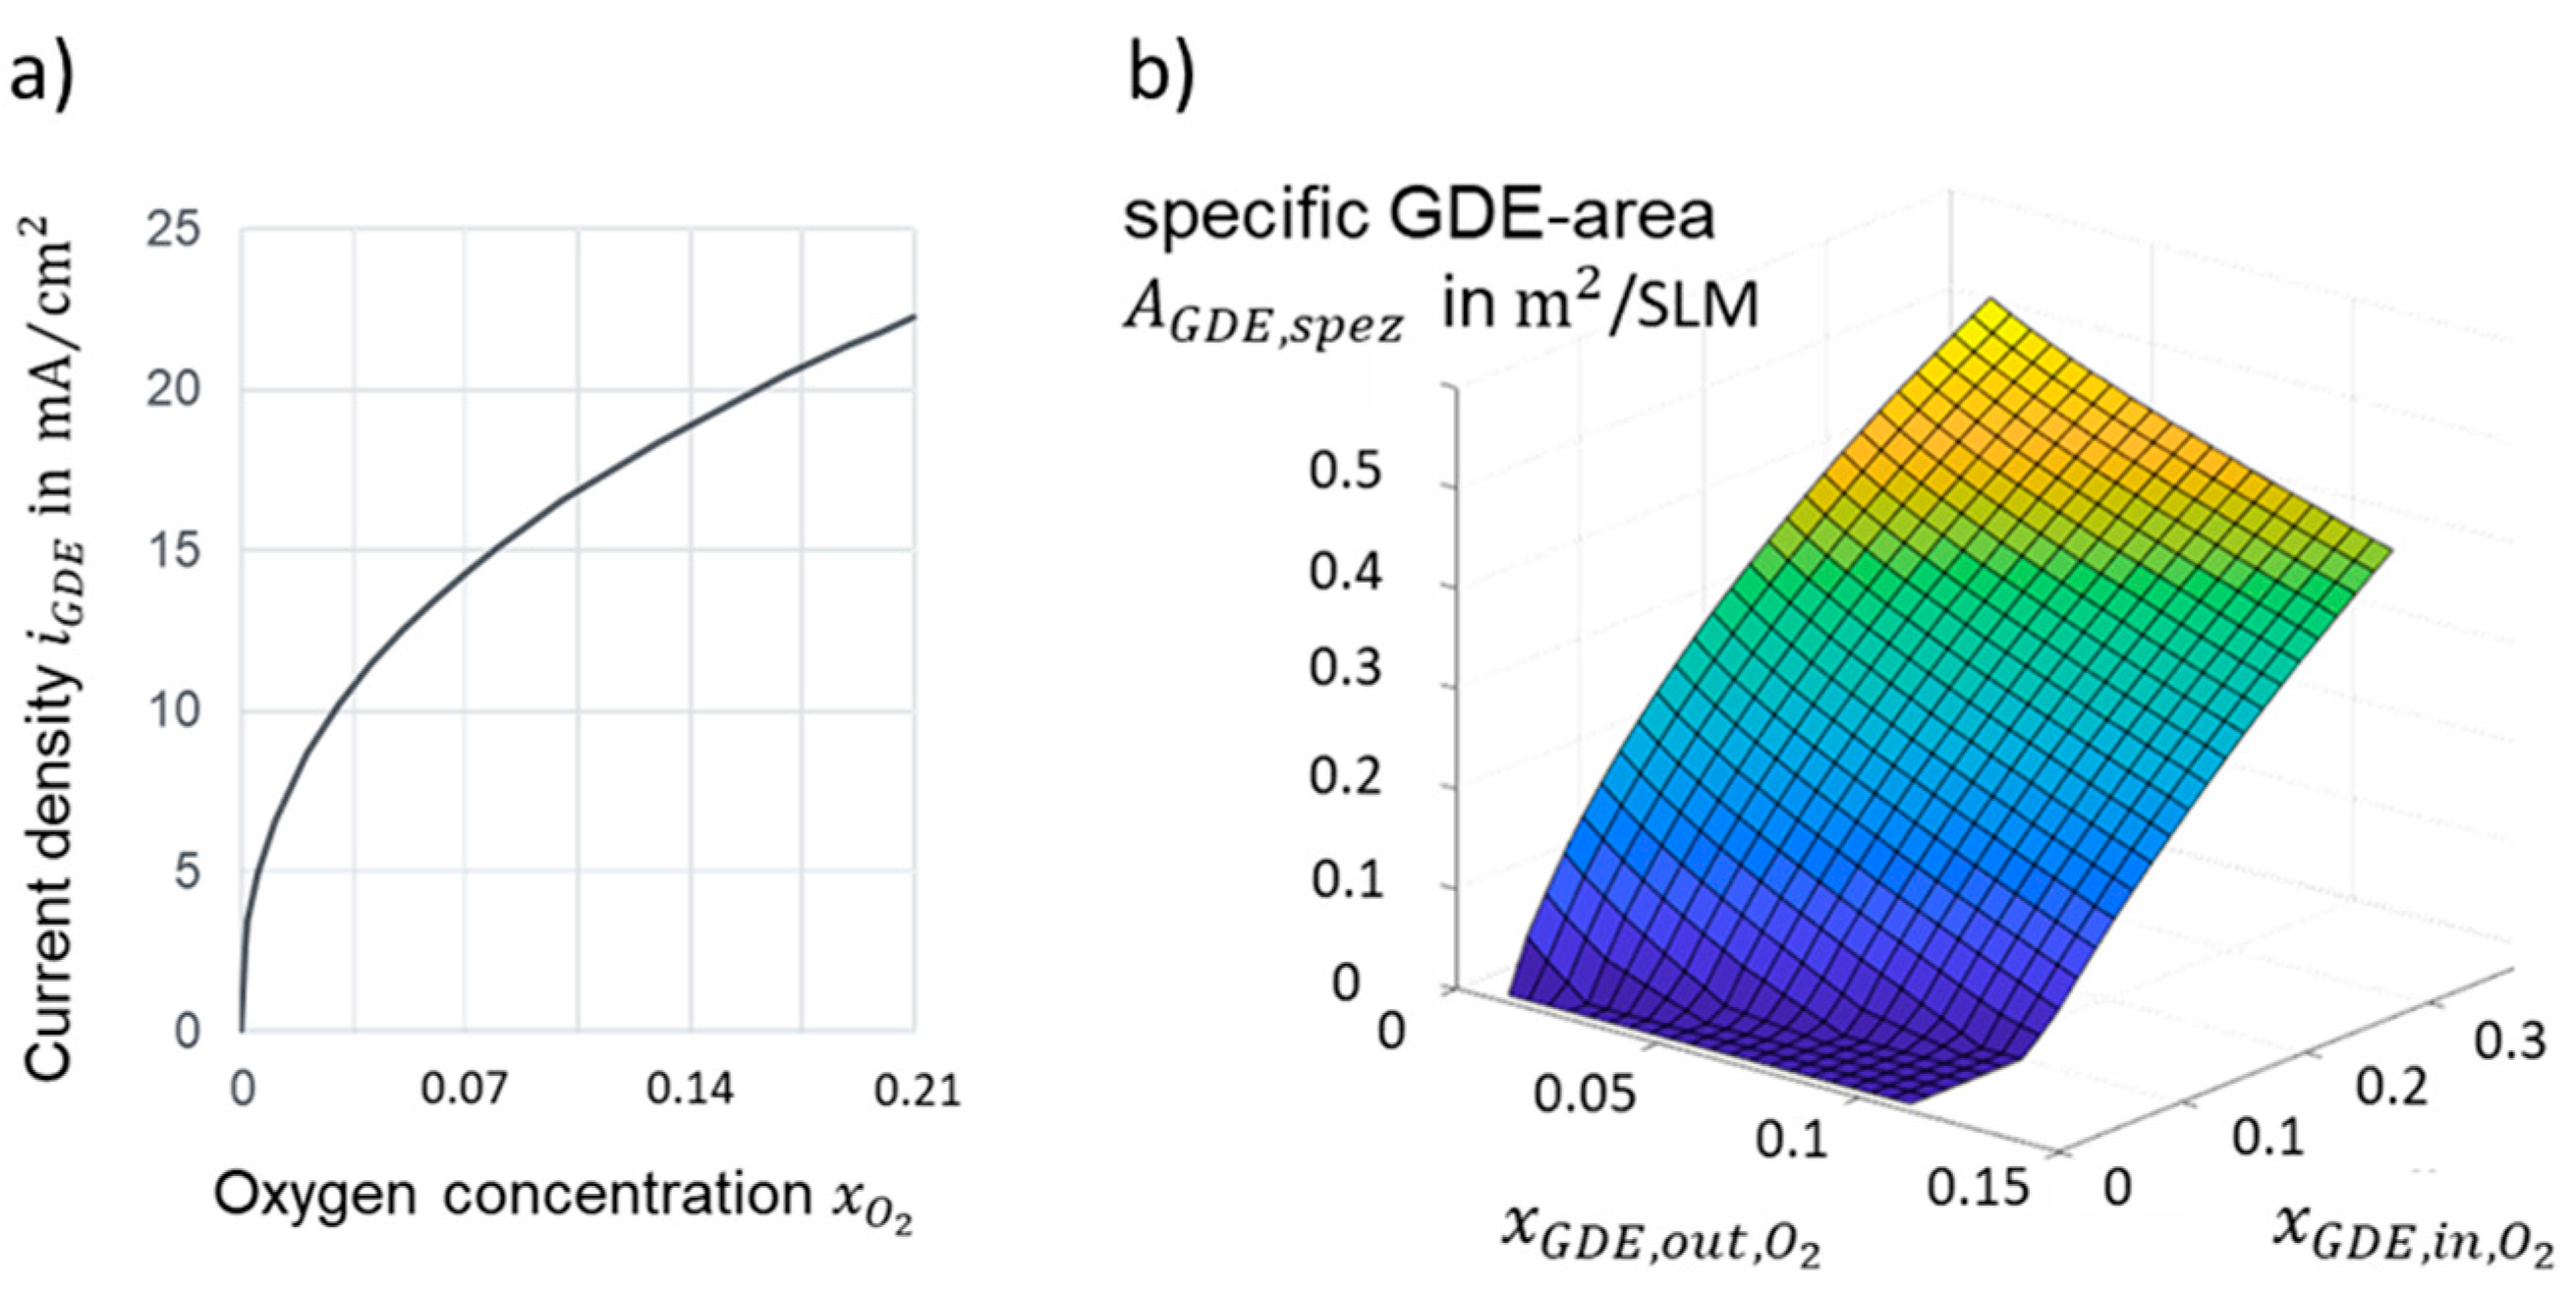
The gas diffusion electrode currently under investigation uses graphite as the support and manganese dioxide (MnO2) as the catalyst for oxygen reduction catalyst. MnO2 is a weak catalyst commonly used in air-fed batteries. It is an electrochemical separation process of oxygen (O2) from a mixed gas stream of predominantly carbon dioxide (CO2) and carbon monoxide (CO), and the catalyst used is selective for the reduction of O2. Oxygen is transported through the electrolyte in the form of OH− ions. Due to the high conductivity of aqueous electrolytes, the system can achieve high current densities at low temperatures (T < 90 °C). By using a carbonate-based alkaline electrolyte, side reactions with the electrolyte are mitigated. Using a hydroxide-based electrolyte might work better initially, but they will quickly react to carbonates in situ.
The power needed to separate oxygen through the GDE is defined through:
According to the reaction equation at the GDE surface
z = 2 is fixed.
A current density of was achieved with N2/O2 mixtures. When CO-rich gas from the plasma reactor was used, the current density dropped to 65% of the initial value before stabilizing. The operation was demonstrated successfully for a period of 10 h. The obtained results suggest that a higher current density could be achieved using a modified catalyst since the oxygen reduction and gas formation produce the highest potential.
4. Results
This chapter includes the results of the techno-economic analysis. First, the results for the scenarios, defined by the varying parameters, are presented. Shown values are the process efficiency, including the produced amount of fuel and capital costs, as well as the net production costs () resulting from calculations mentioned in the methodology. Subsequently, several results of the sensitivity analyses are shown.
4.1. Scenarios
The defined scenarios investigated in the analysis differ in the technical parameters of the plasma reactors (conversion and efficiency) and electrolysis (efficiency).
Table 7 contains the resulting process efficiencies of the individual scenarios based on the annual product (marine diesel) produced. The projected improvement in component efficiency and conversion increases the amount of product produced by the plant across the scenarios.
As mentioned in the introduction, a container ship requires a certain amount of energy for typical long-distance transports. Using a lower heating value of a fuel mass of 233 tons of marine diesel is required for each ship. Thus, the 300 MW large-scale plant considered in the scenarios can supply over 200 ships/transport route.
In relation to the above-mentioned technical results of the simulation, the cost of capital for the dielectric barrier discharge (DBD)-plant is shown in
Table 8.
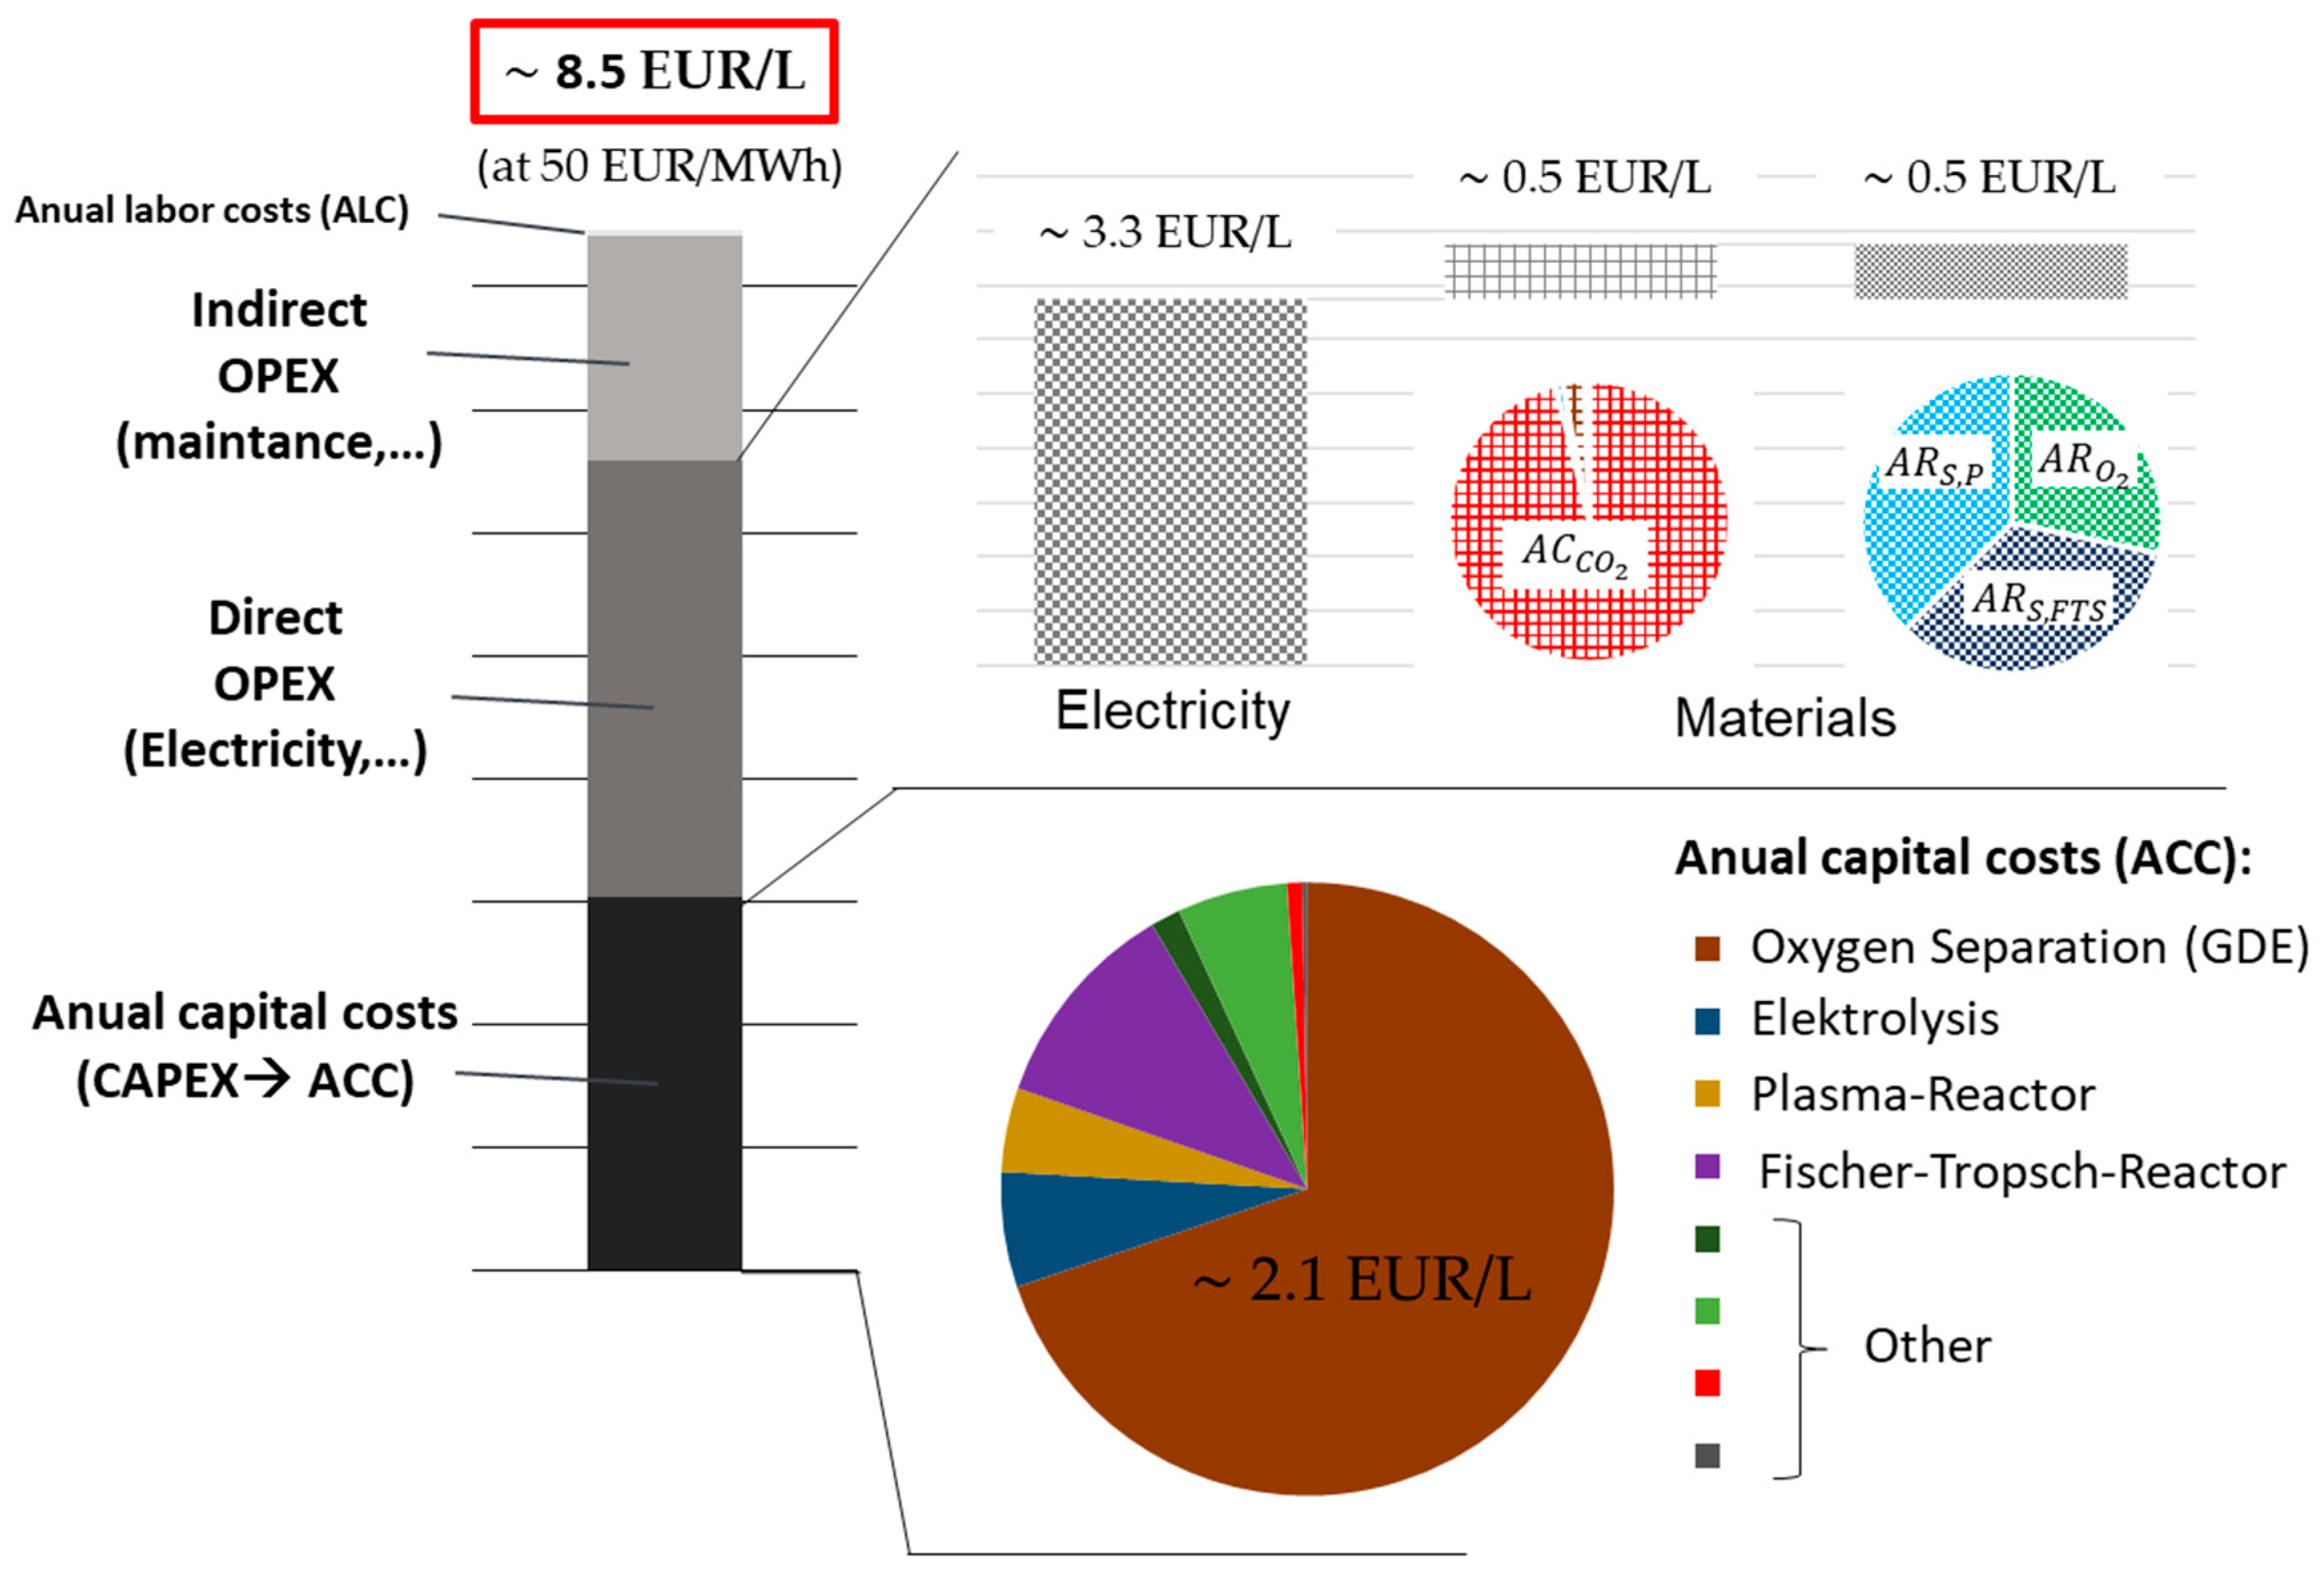
A of over 1 billion emerge from the modeling of scenario 2018/20. This results, to a large extent, from the oxygen separation via the GDE. Based on the current density curve used in the scenario, an area of is required. By optimizing the current density curve, a significant decrease in costs can be observed in the scenarios 2030 and 2050. The FTS reactor also requires comparatively high capital costs because, as mentioned in the methodology, a high rate of recycle stream is applied. Due to the increased product yield, these increases are negligible.
In the diagrams shown in
Figure 9, the net production costs (
) of scenario 2018/20 of the DBD plant are broken down. It is clearly visible that both the electricity costs and the
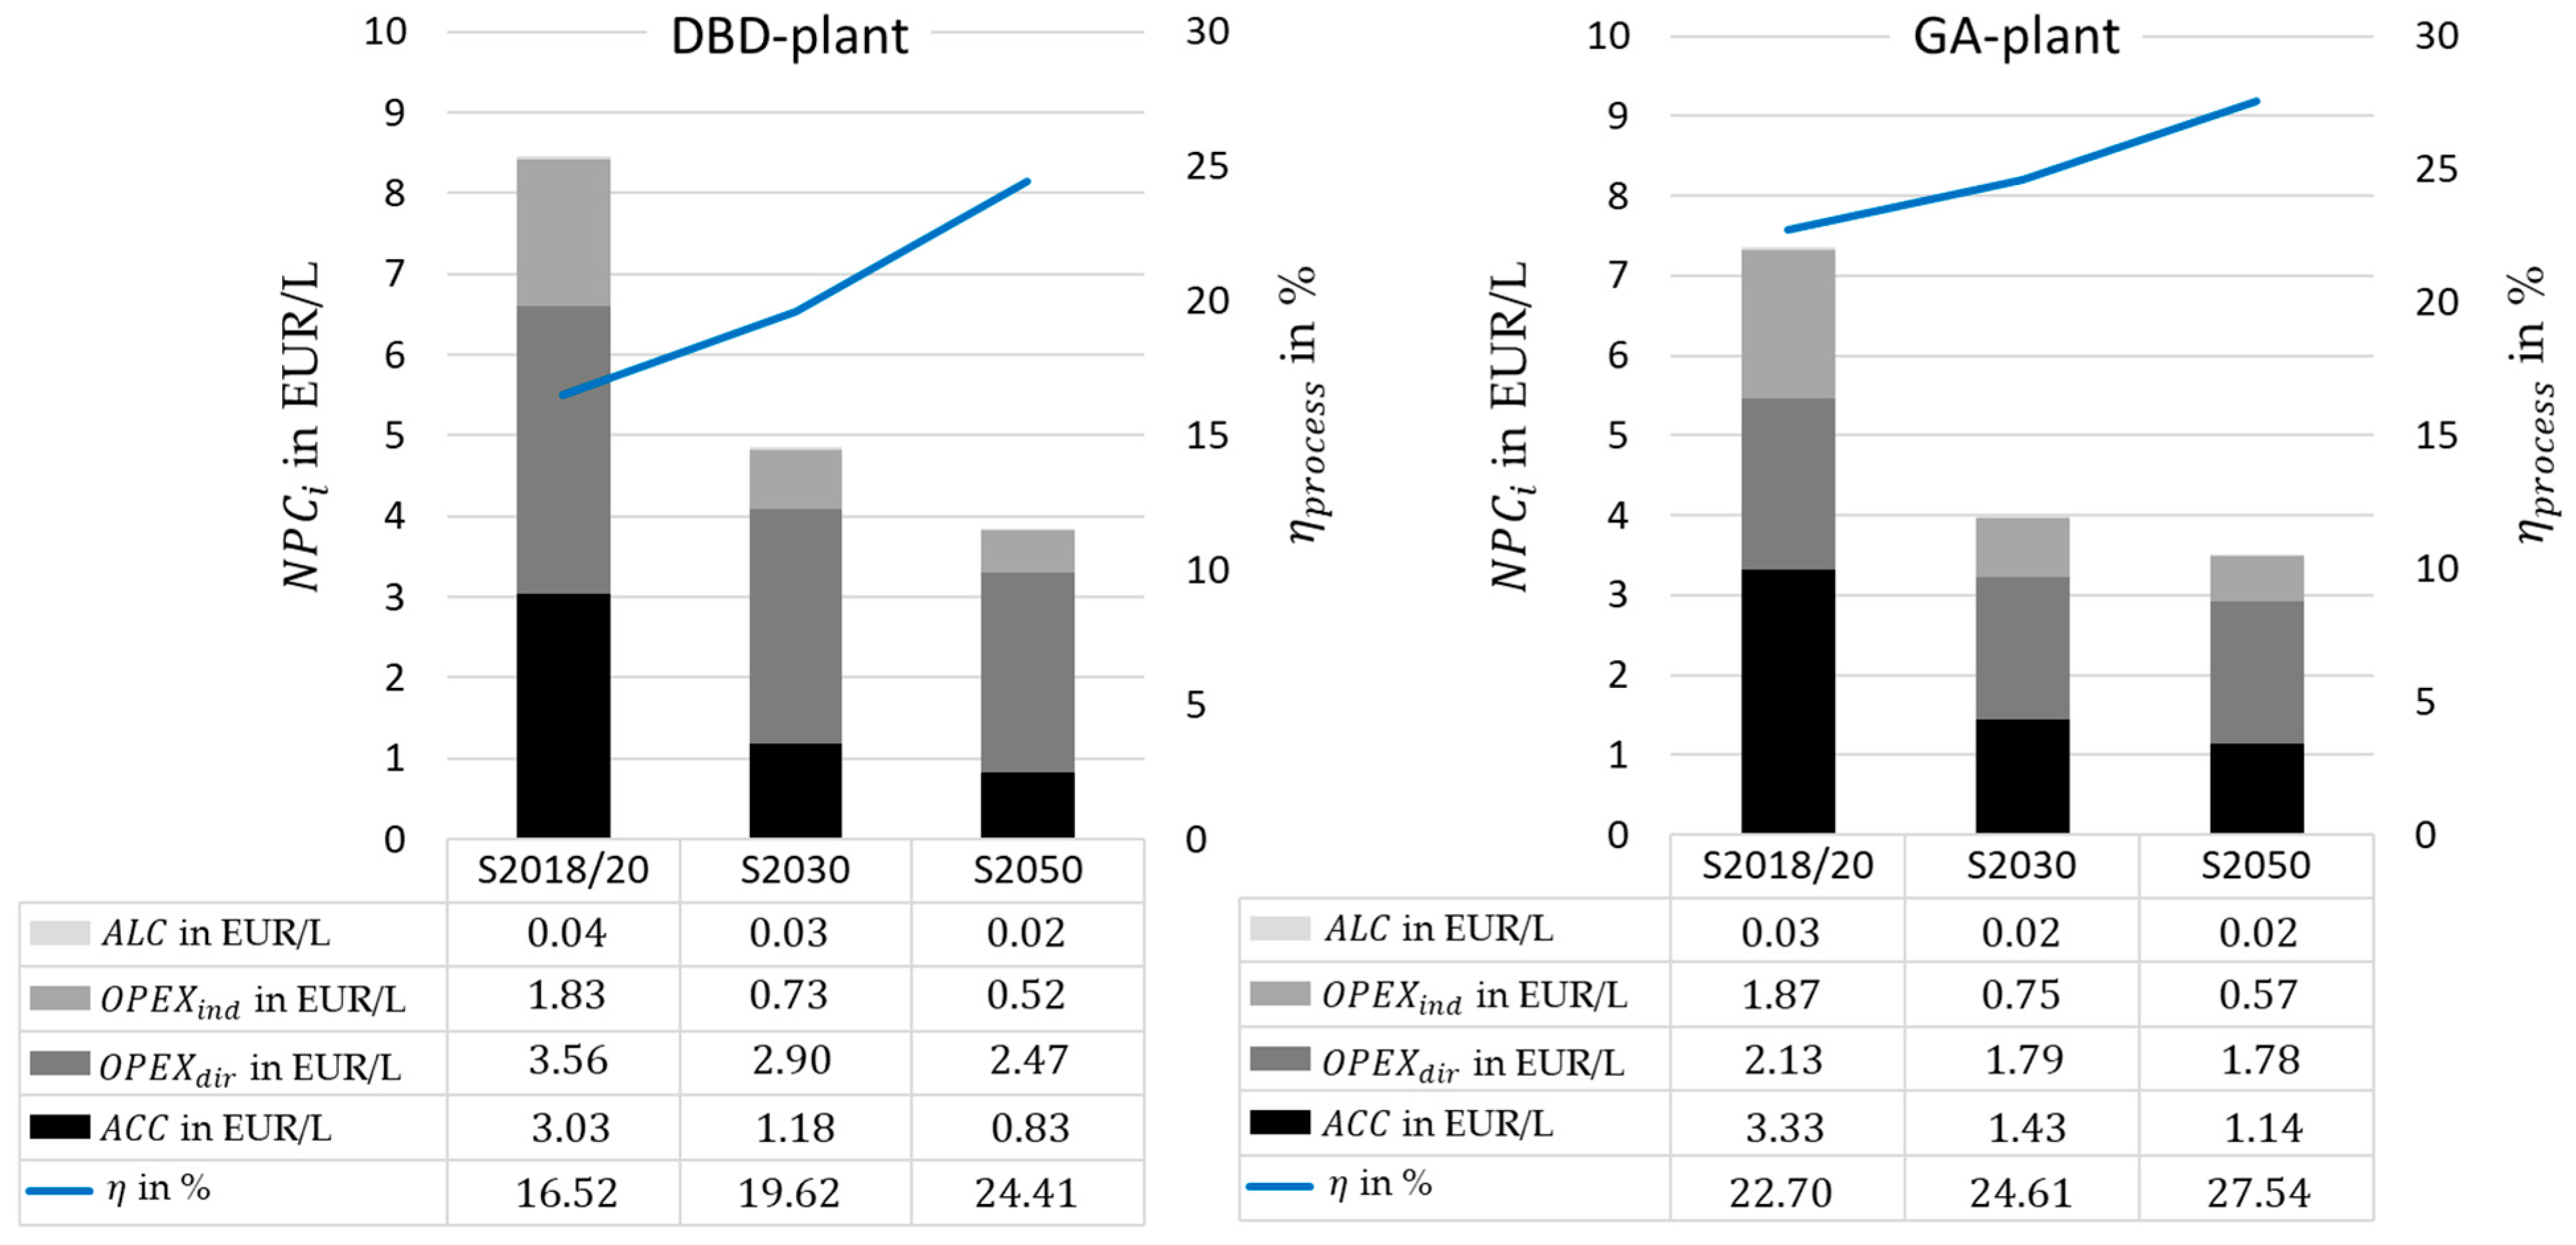
of the GDE make up a significant share of the costs. The data of the GA-plant, as well as the
of the scenarios 2030 and 2050 for each plant, are presented in
Figure 10.
Due to higher capital costs, the part of increases in the case of the gliding arc discharge (GA)-plant. However, since we receive more process heat and can use it to generate steam, which is sold as revenue, decreases by about the same amount as increases.
4.2. Sensitivity Analysis
In addition to the parameter variations within the scope of the scenarios shown, the parameters were varied around the scenario parameters to see the influence on the techno-economic results. Special focus is set on the component parameters of the plasma process. In addition, it is to be found out how large the influence of the GDE is. In the scenarios, a significant reduction in area and thus costs can already be observed by optimizing the characteristic maps.
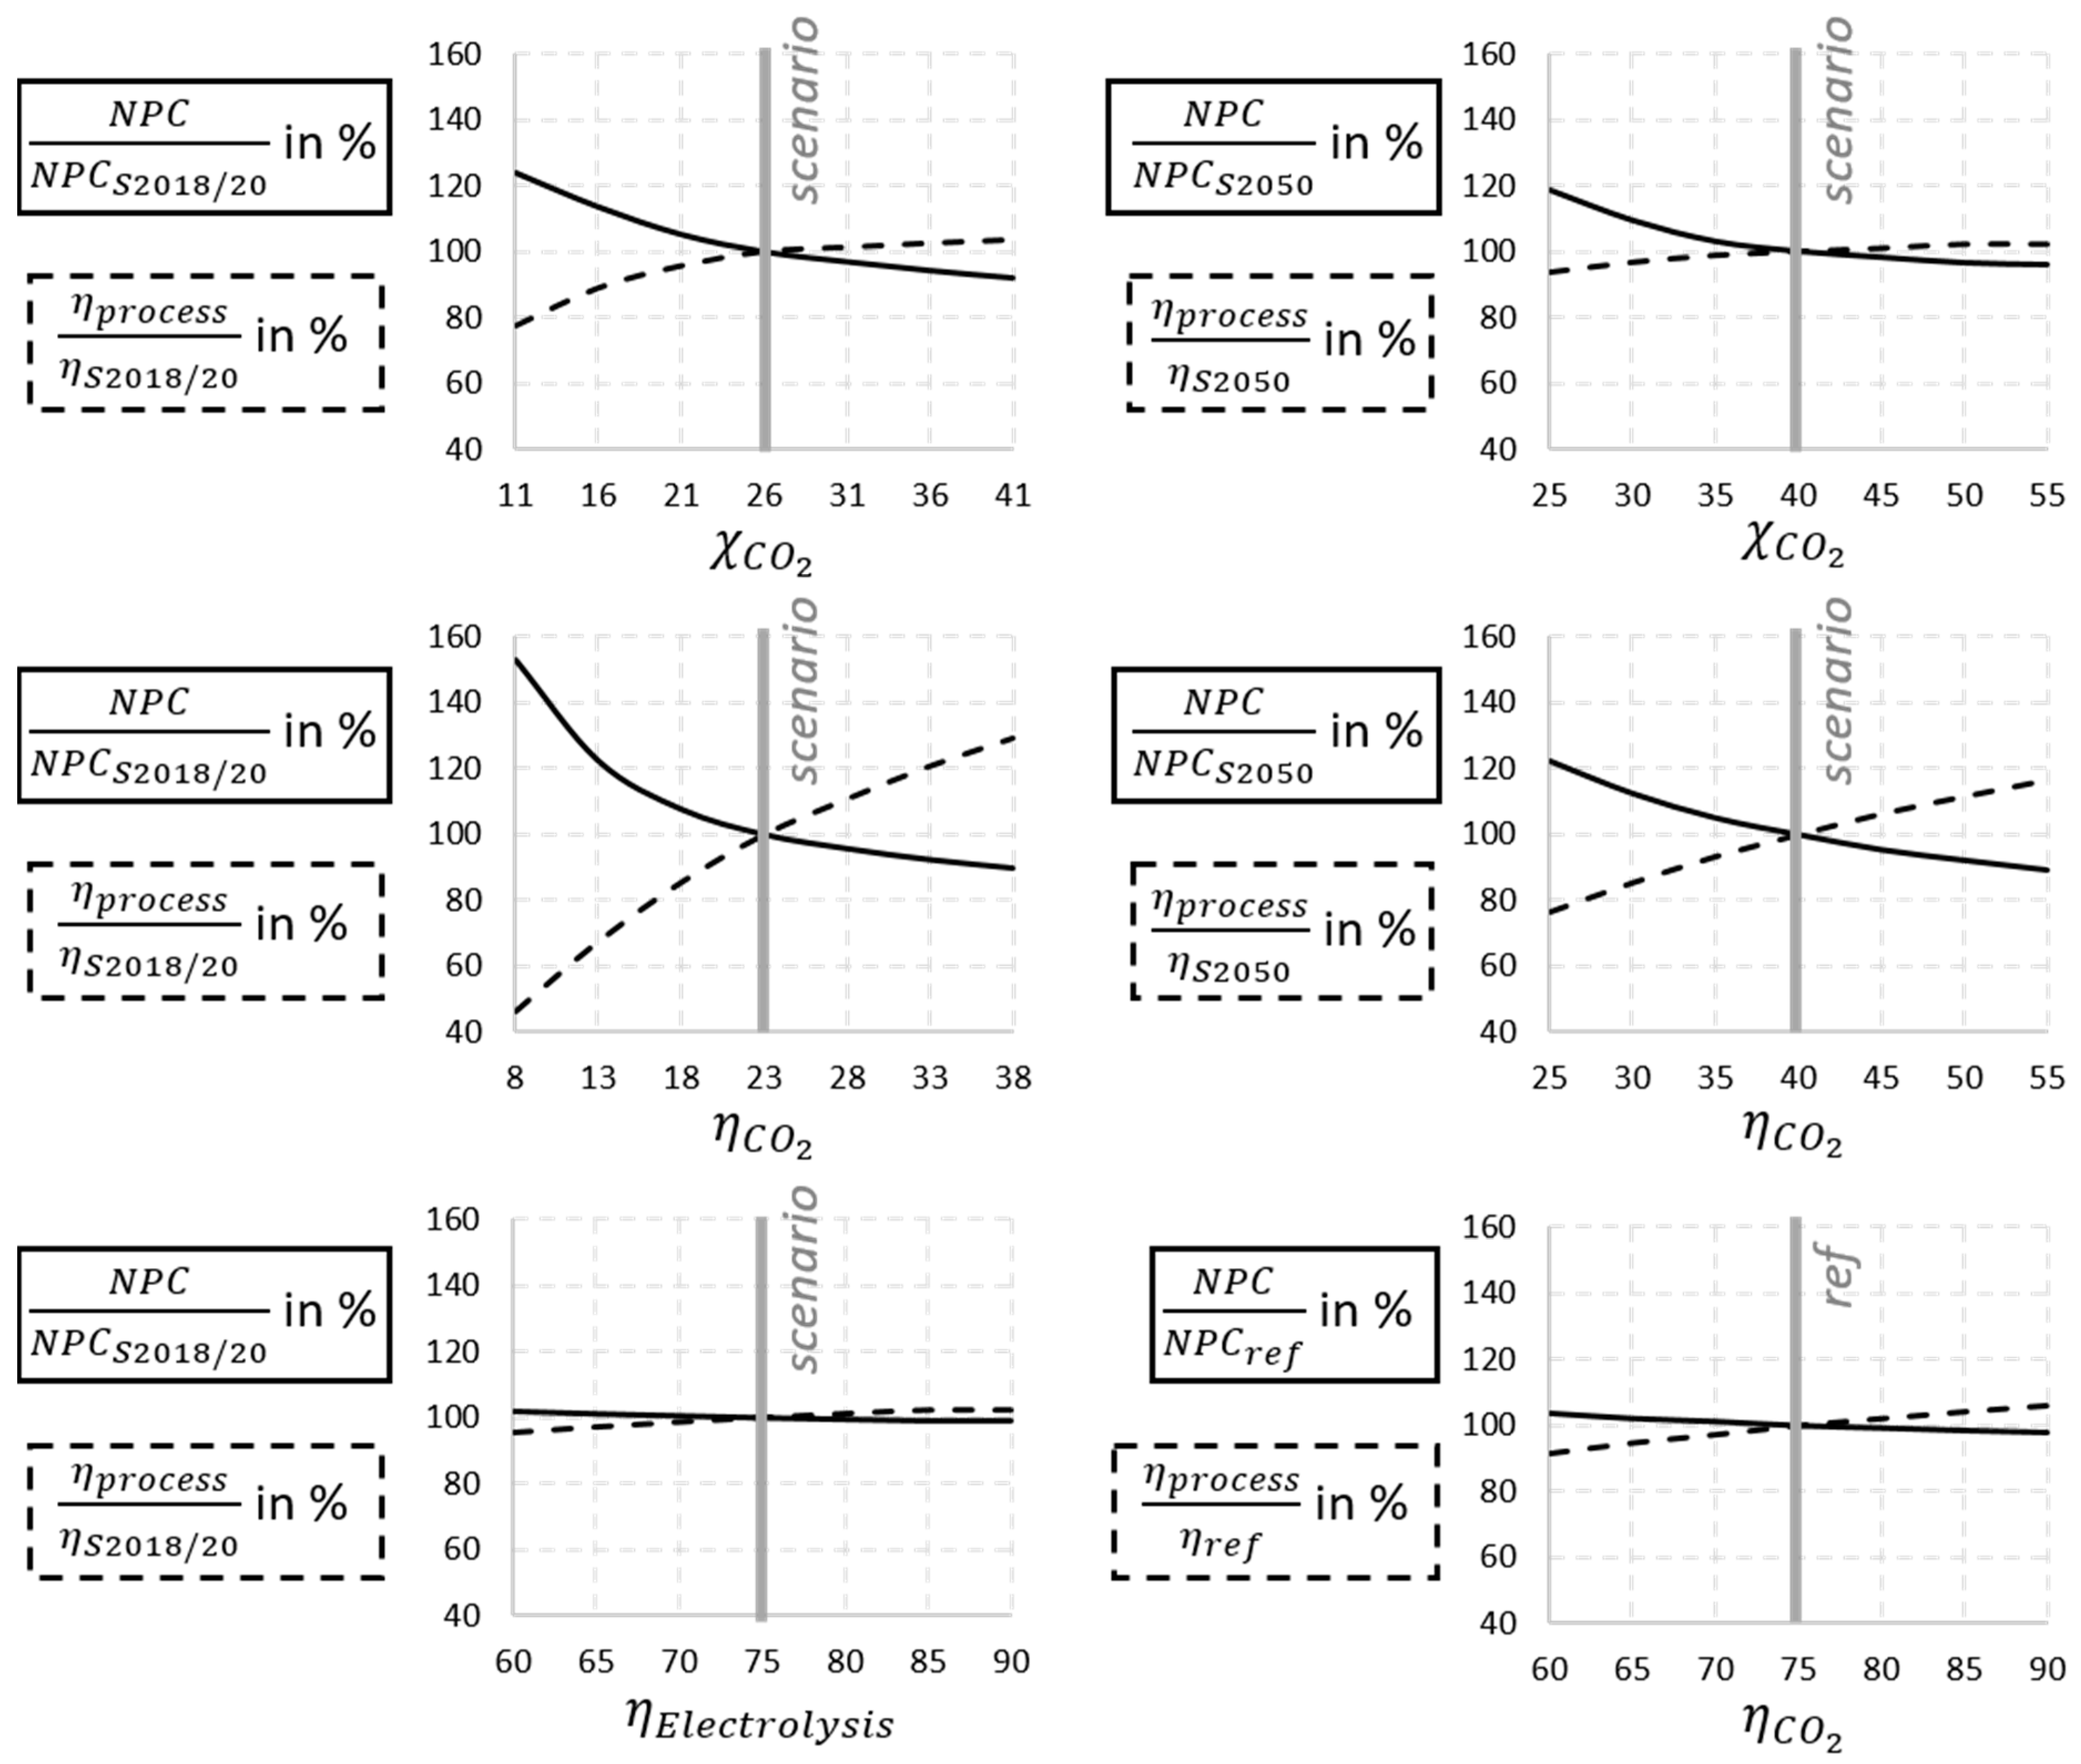
In the cases shown in
Figure 11, some parameters of the plasma reactor and electrolysis are varied around the scenario values. The percentage deviations of the
and the process efficiency
from the scenario value are shown. It can be clearly seen that at low scenario values, i.e., at the plasma-specific values, an increase or decrease has a significantly greater influence on the result. From the percentage deviations of
and process efficiency shown in the figure, it is evident that the variation of plasma conversion and efficiency by the values chosen in the scenarios exert significant influence. In contrast, further optimization of electrolysis does not result in a large change.
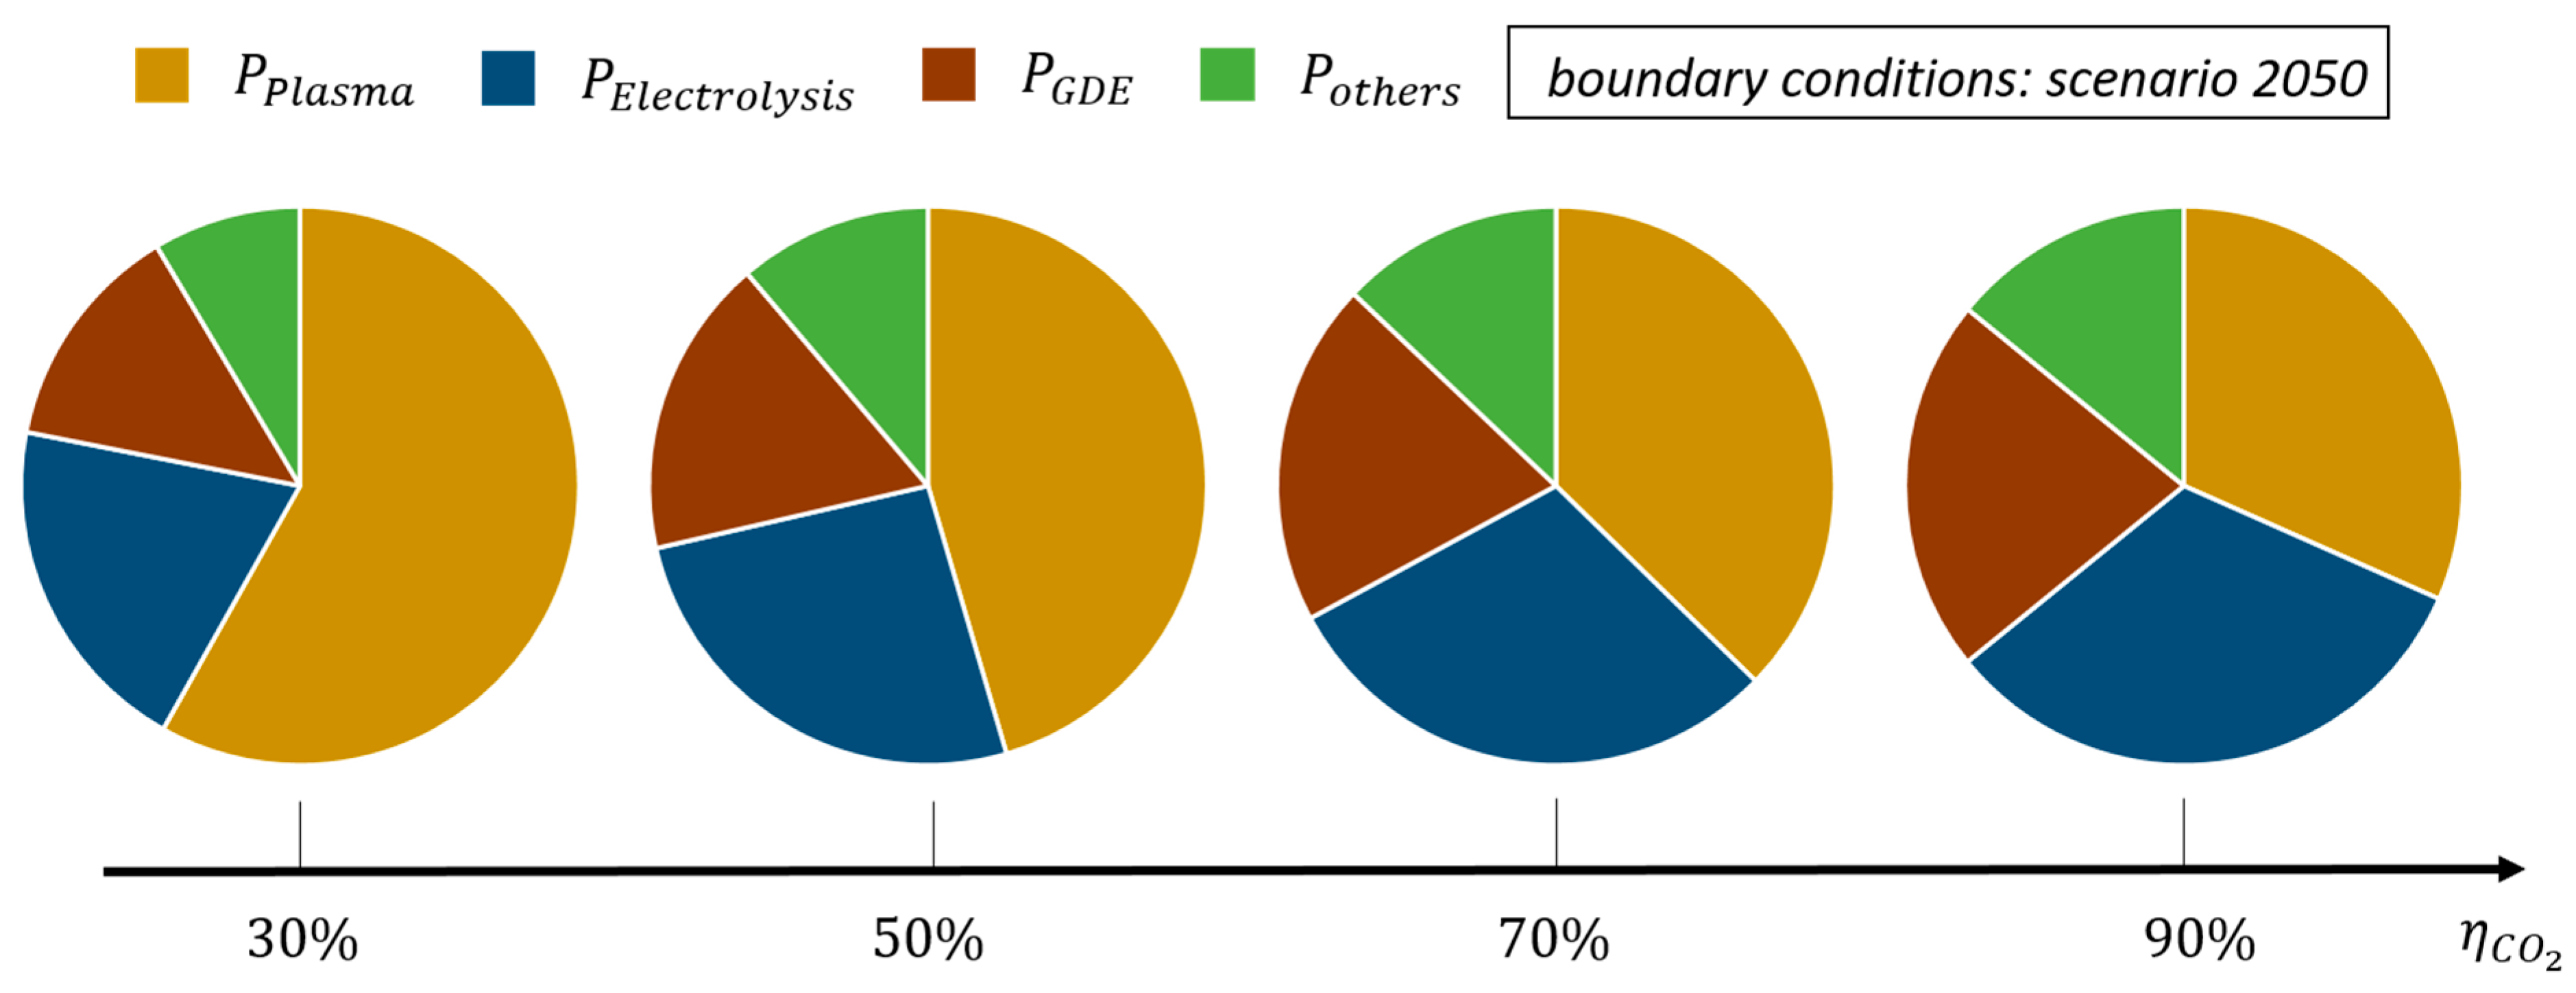
Figure 12 shows the power distribution among plasma generation, electrolysis, GDE, and all other components, such as compressors and pumps. The power ratio
decreases significantly with higher efficiencies in syngas generation. It results from more gases being transported by the GDE and the compressors, etc. This can be used to justify the decreasing slope of the process efficiency at higher component efficiencies. As a conclusion from this observation, it can be found that for high-efficiency electrolysis and plasma processes, holistic optimization is necessary. Better compressor efficiencies and more energy-efficient GDE must be investigated to get the maximum potential out of the process.
The process can also be optimized by adjusting FTS parameters. By changing the process by adjusting temperature and catalysts, the chain growth probability can be influenced. If higher values can be achieved there, the product yield increases significantly. However, product preparation becomes more difficult due to the higher proportion of waxes.
Another optimization option is to increase the CO turnover of the FTS. If this is increased by 5% in the different scenarios, the will decrease by EUR 0.2/L at S2018/20 and by EUR 0.1/L at S2050. However, the increase in revenue allows the high recycling rate around the FTS reactor to be eliminated. This also reduces the energy cost of compressing residual gas and the capital cost.
As part of the sensitivity analysis, the characteristic maps of the GDE were also varied. If the optimized GDE current densities of S2050 () are already used in the 2018/20 scenario, the NPCs decrease from EUR 8.5/L to EUR 5.5/L. This results from a decrease in GDE from >900 Mio EUR to <200 Mio EUR. On the other hand, if in the 2050 scenario the GDE performance is not optimized as assumed and is according to the performance of S2018/20, the NPC increase from EUR 3.8/L to EUR 6.8/L, resulting from an increase of the GDE from 200 Mio EUR to 1300 Mio EUR.
The recycle streams were also varied. In
Table 9, the main parts of the
as well as the process efficiency of scenarios 2018/20 and 2050 are shown without the use of recycle streams. The
are 1.7 times bigger than the scenario values with recycle streams.
The reduced yield decreases the process efficiency and increases the costs significantly. This results mainly from the recirculation around the FTS reactor, which is why a rate of 0.9 was also chosen in all scenarios. Recirculation around the plasma increases the absolute conversion of CO2 to CO, but the capital costs increase significantly. Since CO2 behaves inertly in the FTS reactor, the present ratio between CO2 and CO has no major influence.
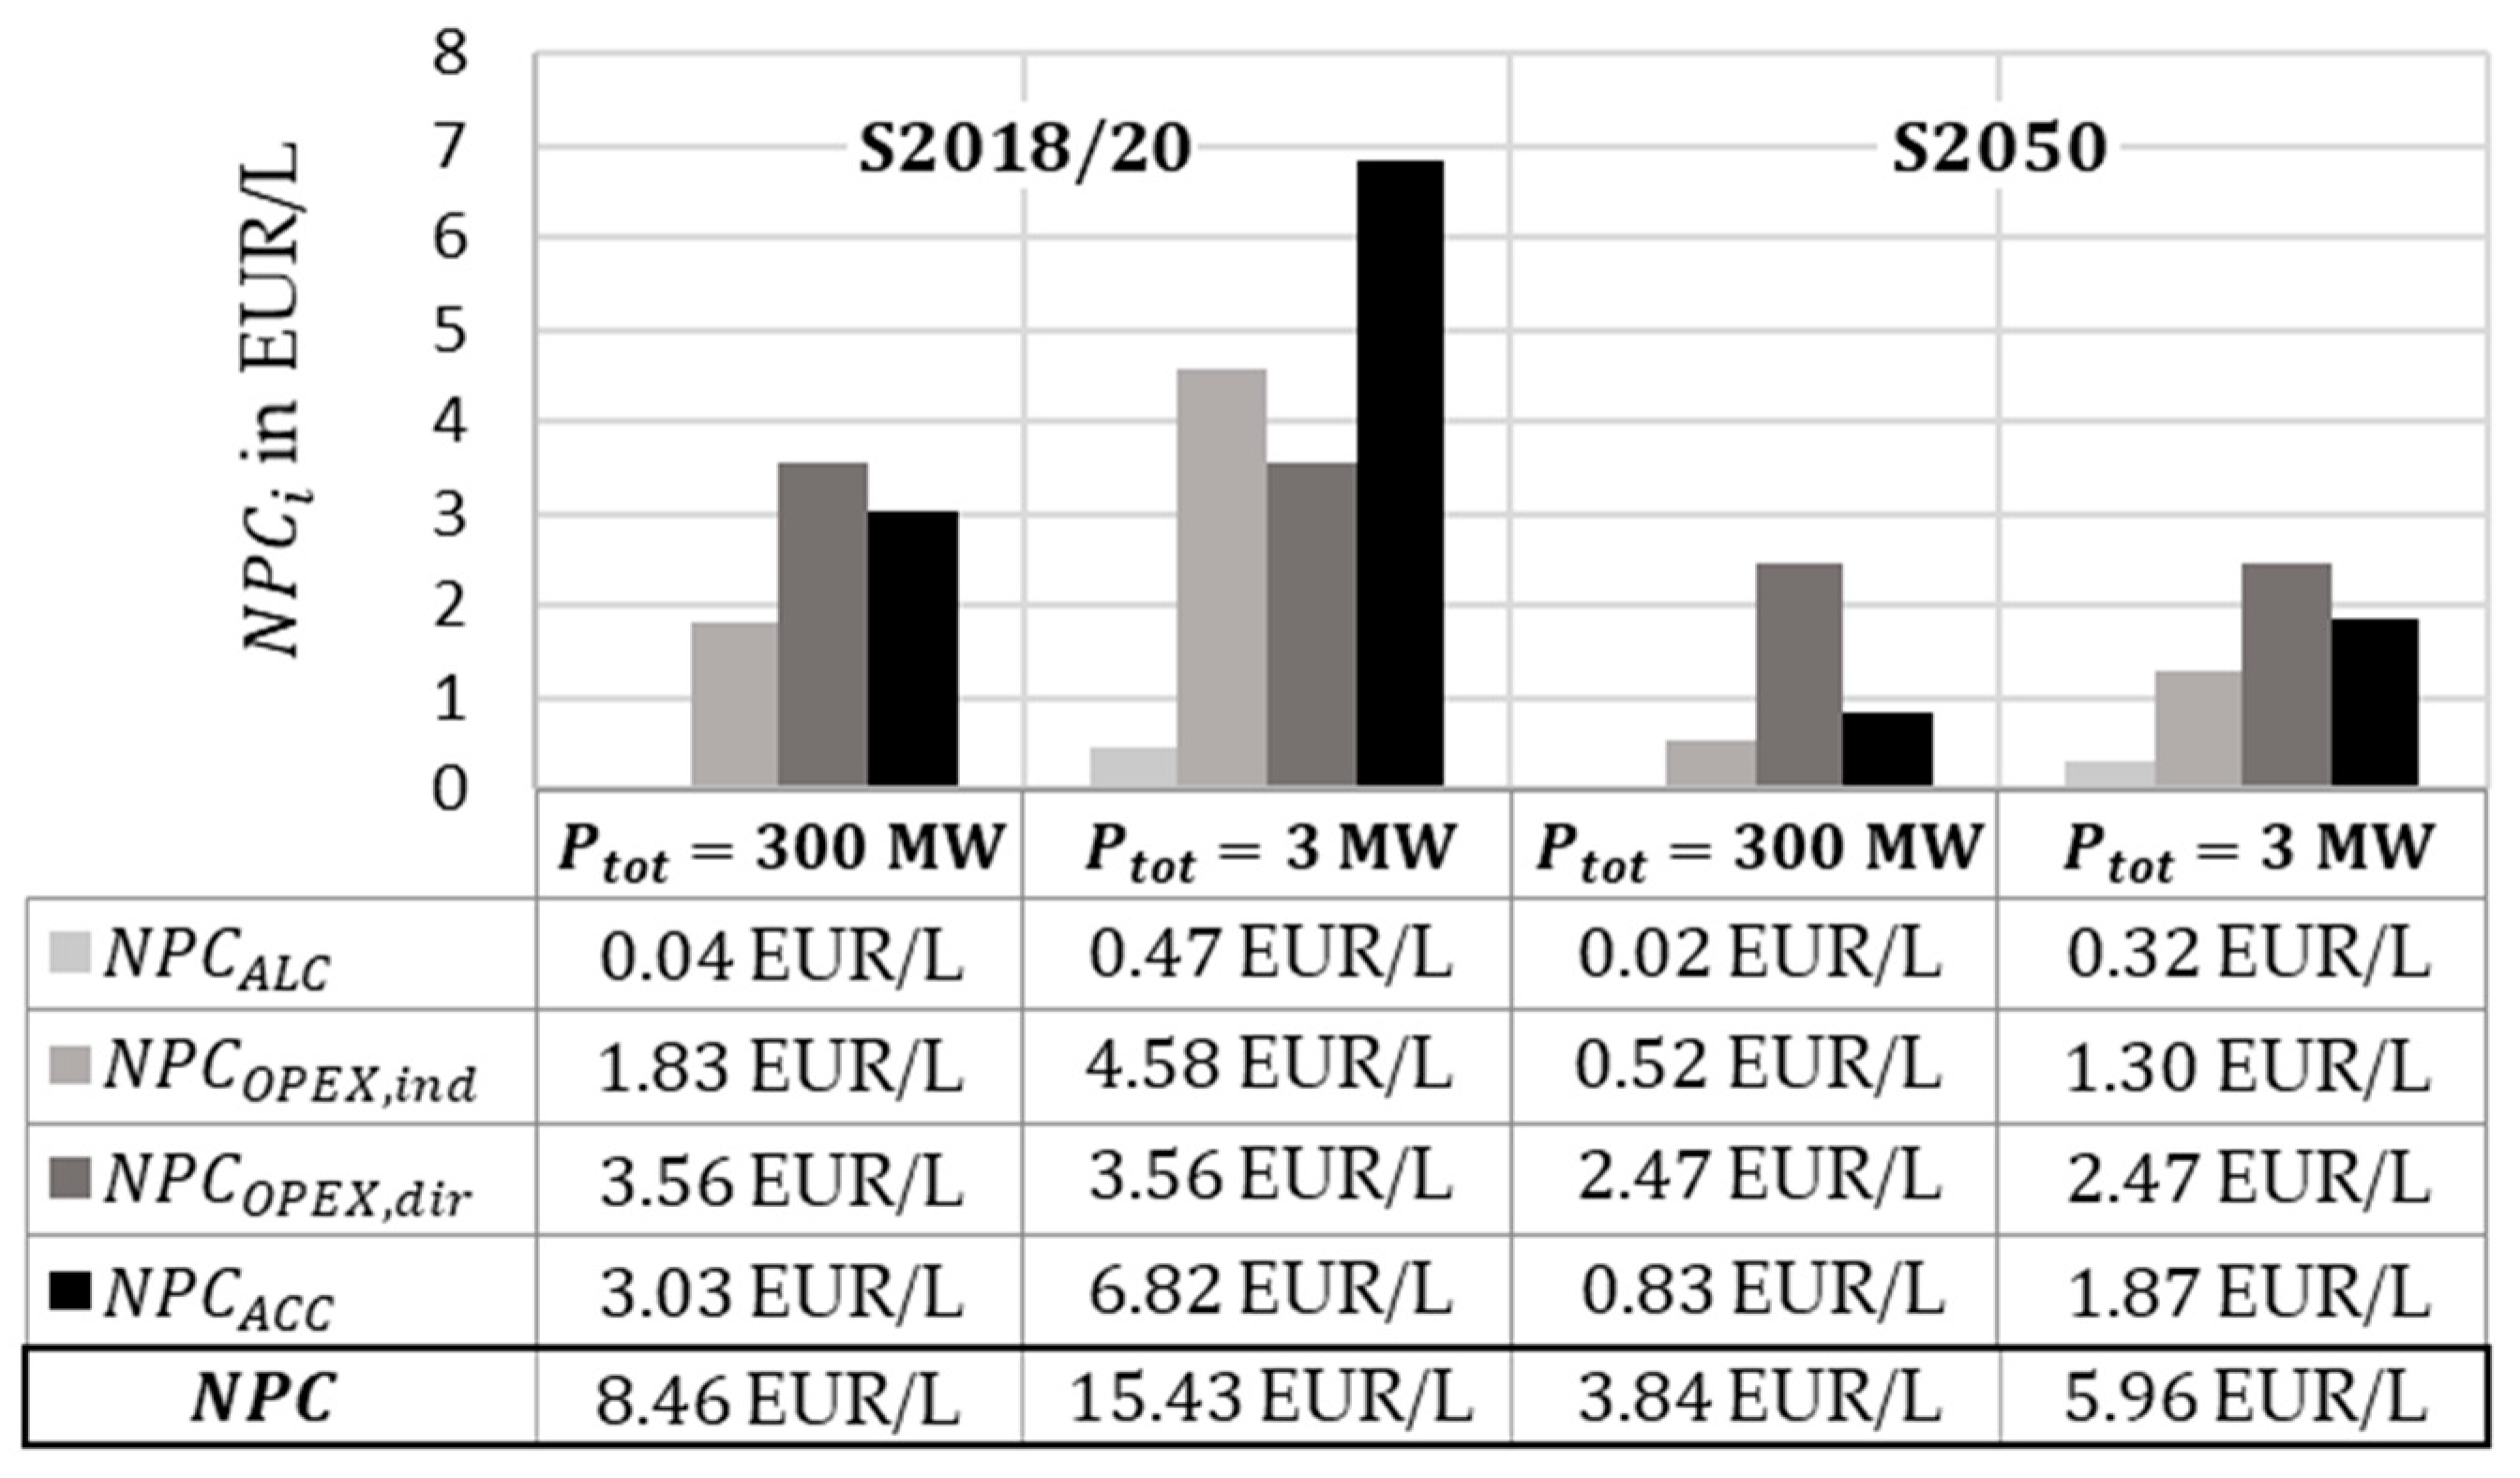
In further sensitivity analyses, different plant sizes were compared. In
Figure 13, for scenario 2018/30 and scenario 2050, the parts of the
are shown for a 300 MW and a 3 MW plant. It is obvious that the
are rising because of the used cost functions and the lost of economy of scale.
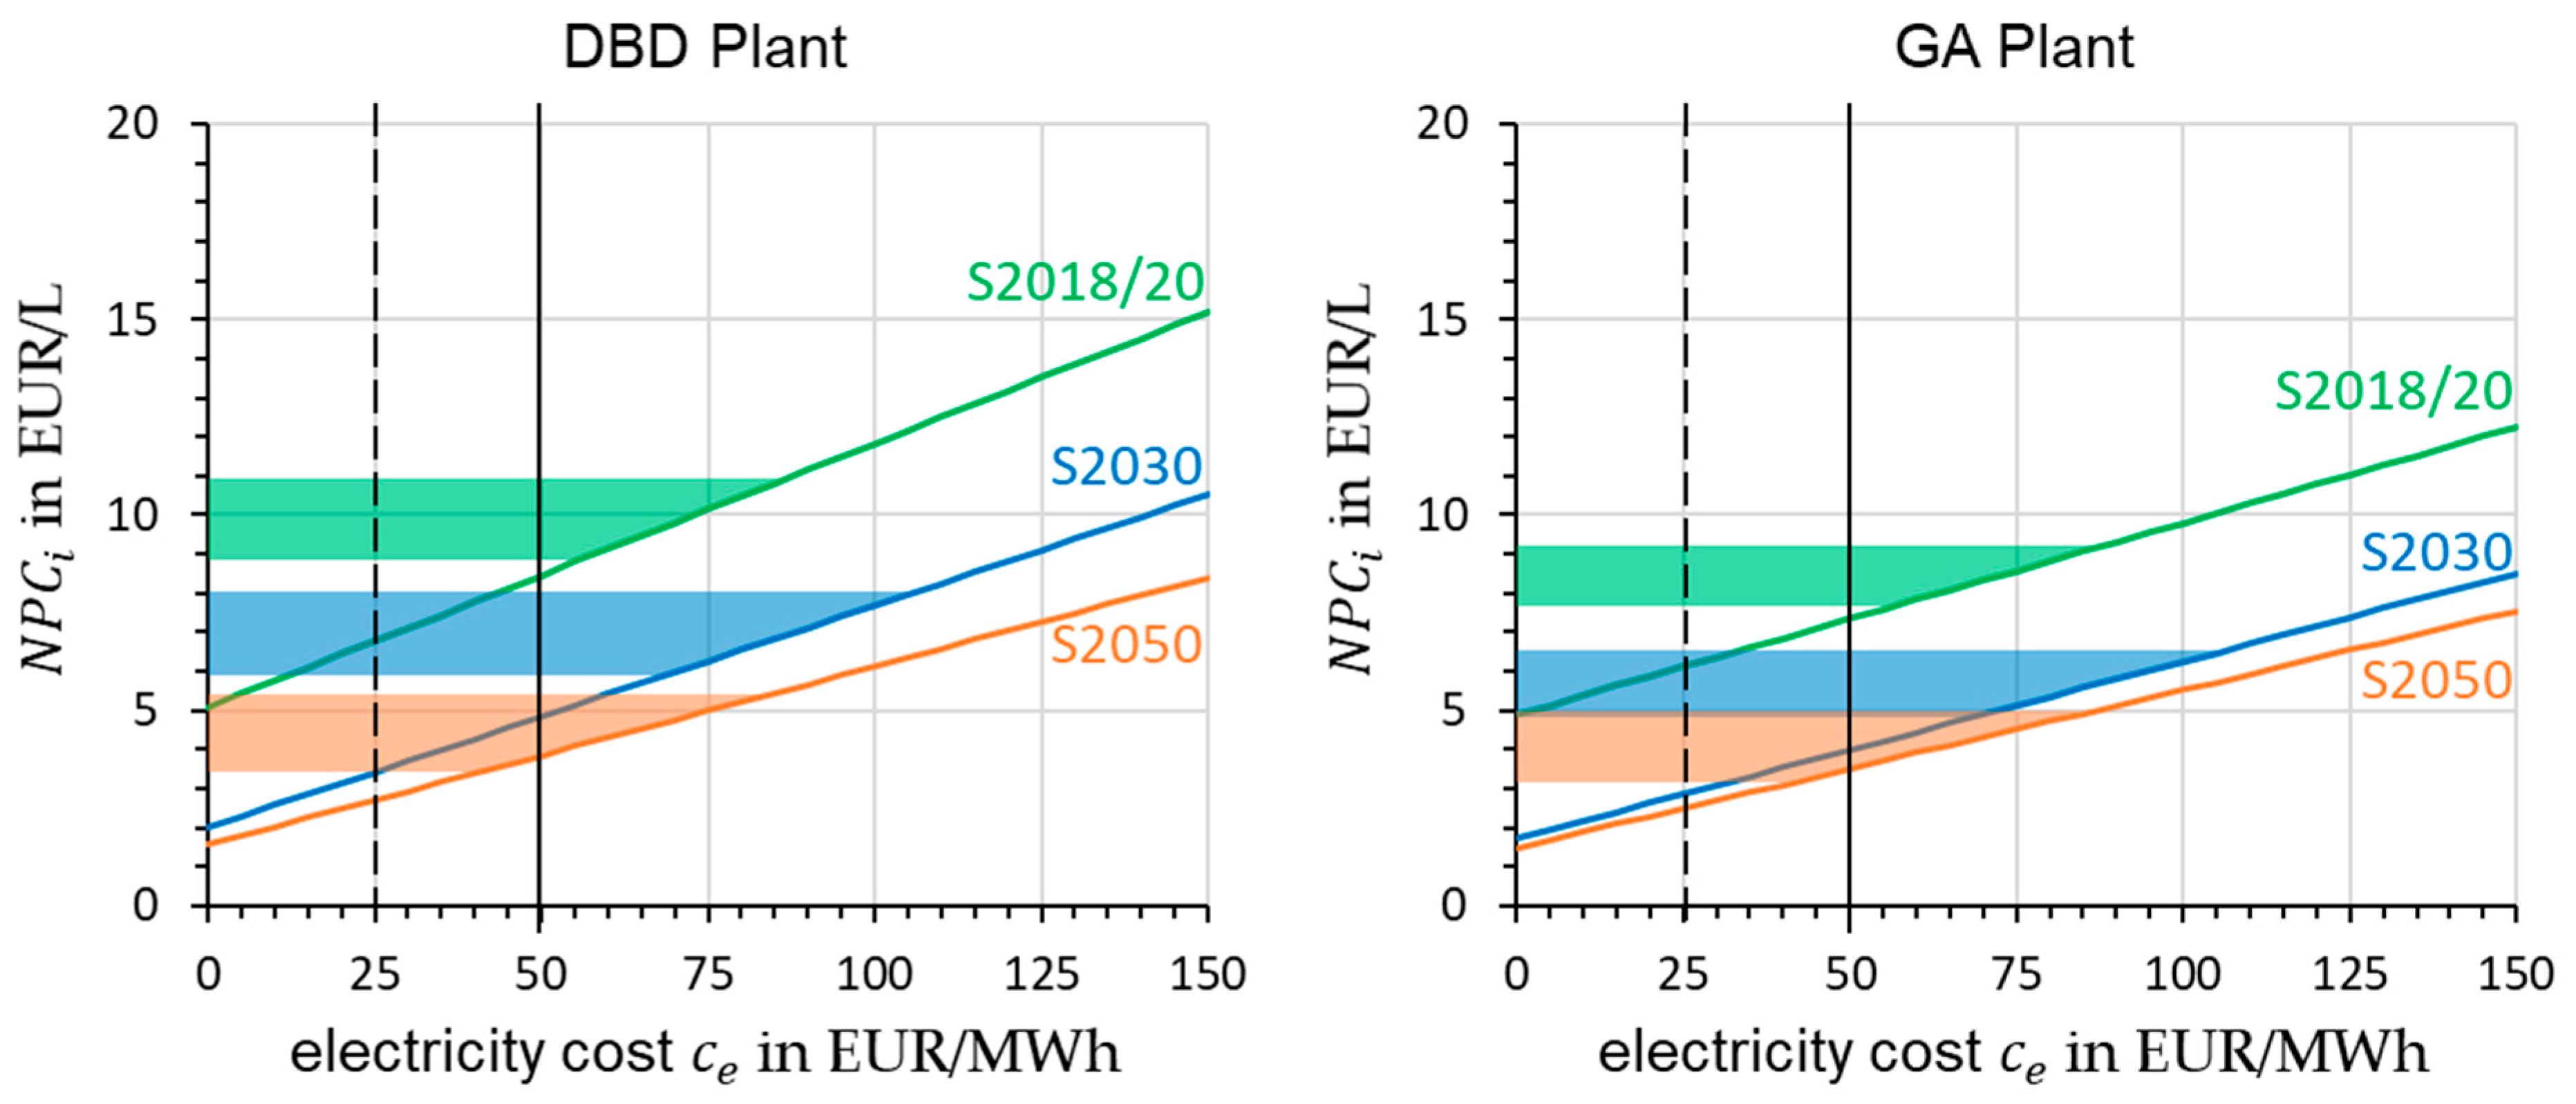
Based on the hourly share of renewable energy and the corresponding average price per MWh in the European Union, a correlation between these factors could be identified [
45]. A high share of renewable energy sources, such as wind and PV, reduces the cost of electrical energy significantly. In the study of ICCT from the year 2020, different scenarios for electricity prices from renewable energies in future were defined [
52]. They differ in terms of the generation and transmission of energy. The scenario in which just the generation is observed, so that the user is directly connected to the renewable energy plant, results in electricity costs of
. Because of the flexible operating of plasma-based processes, the reactors could fit with these scenarios. The BEniVer also conducted research and defined scenarios with different electricity prices. The values are shown in
Table 10. All mentioned electricity costs are marked in the diagrams shown in
Figure 14. Due to the higher process efficiency, the gradients in the diagram for the GA plant are significantly lower.
5. Discussion—Techno-Economic Potential
The results of the individual scenarios show that the plasma-based CO
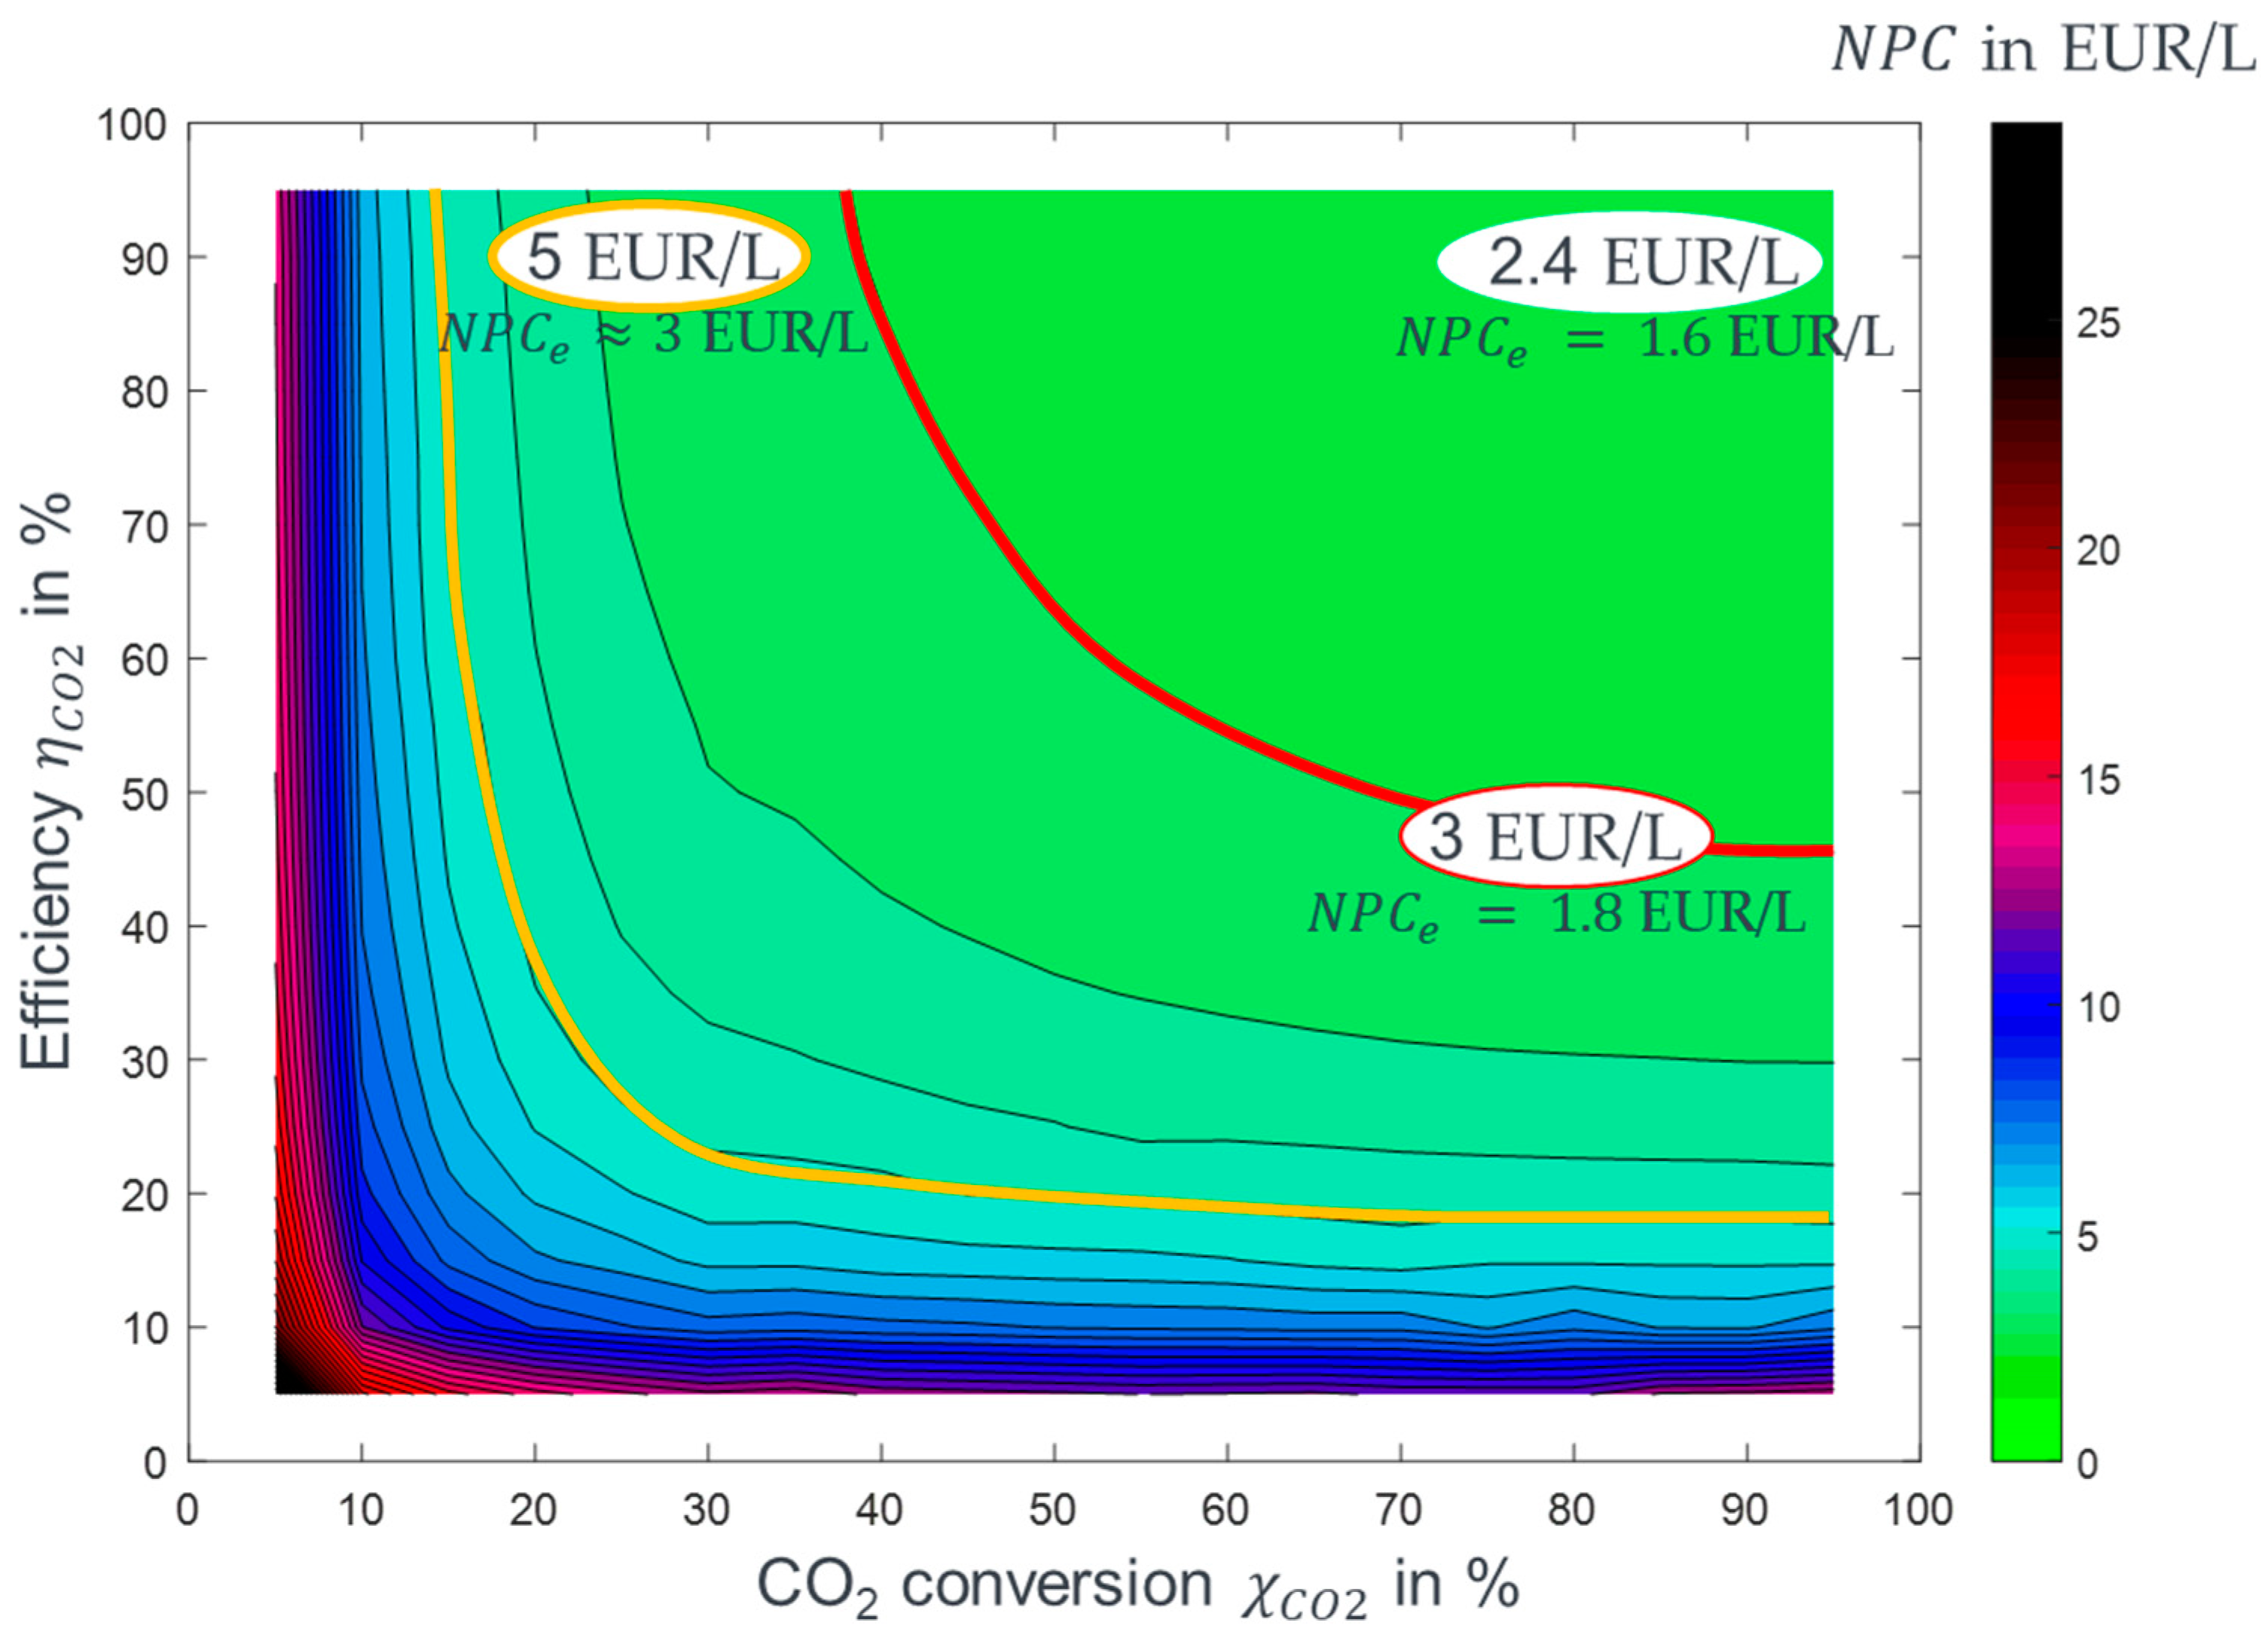
2 splitting does not quite reach the values of the Concawe study on the PTL plants with RWGS. In order to get an overview of which combinations of efficiency and conversions go into which cost areas of
, the diagrams shown in
Figure 15 and
Figure 16 were created. The figure shows the
over the conversion
as well as the efficiency
of plasma-based CO
2 splitting. For the diagram in
Figure 15, other boundary conditions are taken from the 2050 scenario that are important for the overall efficiency are, e.g.,
and a higher-performing GDE in terms of current density.
At low values of both
and
, unilateral optimization does not have a large impact on the overall performance and, thus, on the NPC. Until the line highlighted in orange at EUR 5/L, there is a high slope of the cost development. This limit can be undercut when reaching
. To reach the value of the fuel costs determined in the Concawe study, conversions and efficiencies must be developed to a level above the red line shown [
10]. To get below this cost, efficiencies of at least 45% and revenues of at least 40% must be achieved. By optimizing the GDE and using more efficient compressors and pumps, the efficiency can theoretically be further increased and, thus,
can also be achieved. If the efficiencies of the compressors, turbines, and pumps increase from 80% to 85%, the process efficiency increases by
, which enables an
minimum of EUR 2.2/L. Further cost savings are only feasible through more energy-efficient oxygen separation.
As already shown in the sensitivity analysis, a larger plant capacity leads to a decrease in fuel costs. The PTL plant considered in the Concawe study delivers 1 million tons of product per year (here considered case: <50,000 t), based on the boundary conditions mentioned in the appendix, which leads to the conclusion that the input capacity is significantly larger. As a result, further NPC decreases can be expected if the dimensions are adjusted.
With the supposed development potential of the DBD reactor of
, we get between the two lines shown, thus, a value of EUR 3.8/L can be reached with assumed boundary conditions and electricity costs. For the GA reactor, we suppose a development potential to
and
, thus coming closer to the red line with
. Both reactors reach an equal range of NPC under the scenario assumptions made. Looking at the current state of the research, the values are more in favor of using GA plasma in CO
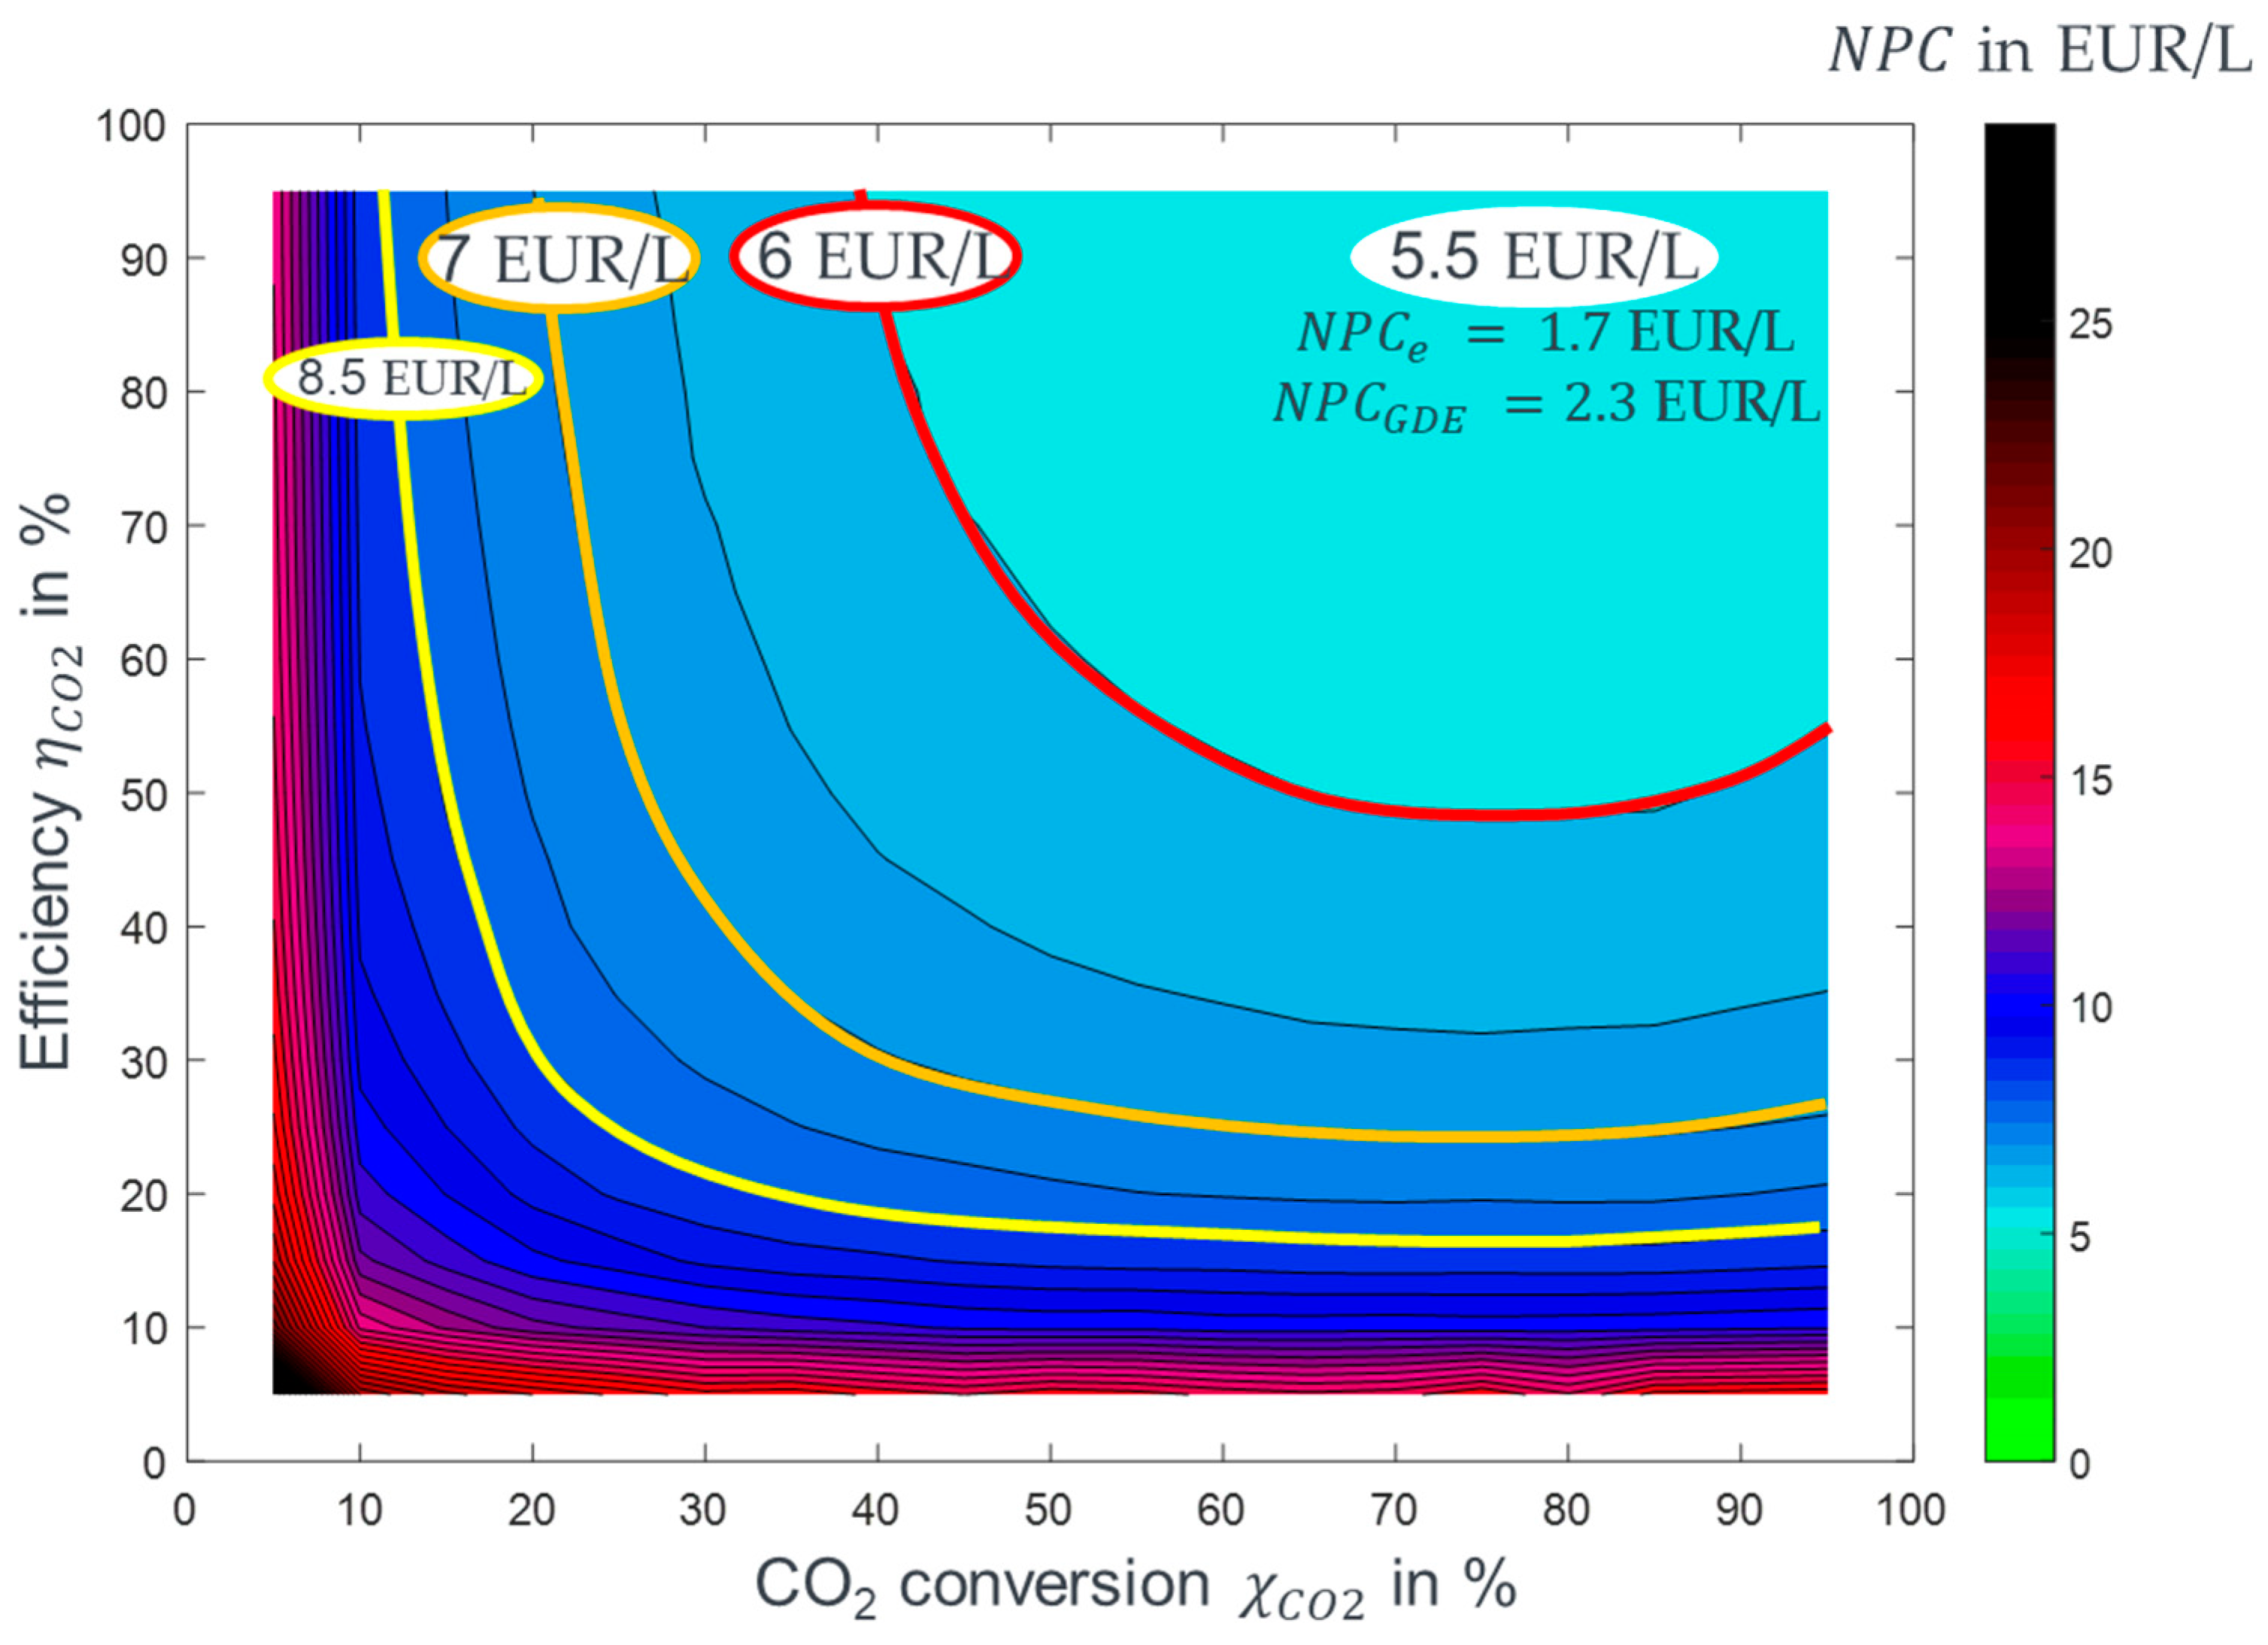
2-only splitting, as all high-performing DBD reactors do not get above the orange line. The additional capital costs that arise are not considered or offset as in the scenarios via better heat utilization. If other boundary conditions are set to those of scenario 2018/20, the result shown in
Figure 16 is achieved. Thus, it is assumed that the electrolysis, as well as the GDE, do not receive any further development.
The minimum can be seen in the figure as a worst case. Considering the change in power distribution to the main processes plasma and electrolysis and to auxiliary units GDE as well as peripheral elements such as compressors, etc., shown in the sensitivity analysis, it makes sense to look for alternatives to GDE that do not require electrical energy. If a co-reactant is used in the plasma reactors, O2 can be avoided as a product. One possibility is to convert CO2 via dry reforming of methane (DRM), in which CO and H2 are the products. DRM has already been considered in many papers. In further model variations, the process of a PlasmaFuel follow-up project that will start soon is compared with the predecessor process.
Considering the electricity price from 2018 in Germany, from which the initial assumption of was made, the operating time can also be adjusted to times with lower costs. This would result in obtaining favorable excess electricity and saving operating costs. In the example year, there are approximately 2000 h at an electricity price below EUR 30/MWh. If the prices are averaged, one gets prices of , which reduces operating costs by 60%. However, with a reduced operating time, the share of capital costs is also increased. By reducing the operating time by a factor of 4, the share increases by this factor. Applying these two changes to the 2018/20 and 2050 scenarios, we obtain a change in from EUR 8.5/L to EUR 15.4/L for S2018/20 and EUR 3.8/L to EUR 4.8/L for S2050.
6. Conclusions
In the present work, a PTL plant with plasma-based CO2 splitting was modeled and techno-economically evaluated. Two different technology types, the dielectric barrier discharge plasma (DBD) and the gliding arc discharge plasma (GA), were modeled in different scenarios.
With a defined plant capacity of , which is largely distributed between the plasma reactor and electrolysis components, the process efficiencies for the individual scenarios range from for scenario 2018/20 to for scenario 2050 for the DBD plant. For the GA plant, the process efficiency ranges from 22.7% to 27.5%. The differences between the individual scenarios are based on improved characteristic values of individual components as well as on changed parameters used in the calculations. The total capital investment in the considered process is estimated at 1350 Mio EUR or scenario 2018/20, 650 Mio EUR for scenario 2030, and 560 Mio EUR for scenario 2050. The main cost driver is the gas diffusion electrode (GDE) for oxygen separation, which accounts for between 30% (2050 scenario) and 70% (2018/20 scenario) of the . Including all annual costs, the net production cost () for the generated product ranges from for scenario 2018 to for scenario 2050 for the DBD plasma plant and EUR 7.3/L to EUR 3.5/L for the GA plasma plant.
From sensitivity analyses to the scenarios, dependencies of and to variations of technical sizes are considered. Especially the conversion rate and energy efficiency of the plasma reactor have a great impact on the results due to relatively low values. Reaching higher performance, the influence of value increase has a lower impact because of the power requirements of supporting components like the GDE or compressors. Downscaling the modeled process to , without adjusting other parameters, increases costs by for scenario 2018/20 and by for scenario 2050. The reason for this is non-linearly scaling equipment costs. If cheaper electricity is used, as assumed, for example, in a study by the ICCT for 2050 with a direct connection to a renewable energy system such as photovoltaics, a fuel price of approx. EUR 2/L can be achieved in the scenarios examined.
At low values of both and , unilateral optimization does not have a large impact on the overall performance and, thus, on the . Until EUR 5/L, there is a high slope of cost development. This limit can be undercut when reaching . To get below EUR 3/L cost, efficiencies of at least 45% and revenues of at least 40% must be achieved. By optimizing the GDE and using more efficient compressors and pumps, the efficiency can theoretically be further increased and, thus, can also be achieved.
The present work provides an extension to previous studies on the techno-economics of PtL processes. By looking at the scenarios, it is moreover possible to distinguish between the different development levels of plasma and GDE technology. The sensitivity analysis illustrates the significant influence of component optimization on existing values. The techno-economic potential, shown in
Figure 15, highlights the benchmarks of conversion and efficiency. In addition, the processing by gas separation is emphasized, which in this work is carried out by the GDE and is currently very energy- and cost-intensive. The variations made, and the mapping of the potential furthermore provide an extension to economic studies like the work of Lamberts et al., in which the economics of a DBD plasma reactor is investigated. The results of the present study reflect the direction of further development of plasma-based CO
2 splitting for use in PtL plants. The relatively low conversion rates of plasma reactors, in contrast to electrolysis, can be counteracted to a certain extent using recycle streams. However, the crucial point for the classification of the process in the PtL sector lies in the characteristic values of the GDE. The low costs in the 2030 and 2050 scenarios result, to a large extent, from the reduction of the GDE costs by improving the current density. Therefore, the further development of this characteristic value is decisive for the use of plasma-induced CO
2 splitting in the PtL process. If this is successful, plasma-based CO
2 splitting can be a viable alternative to RWGS CO
2 splitting due to its scalability, flexibility, and process without external thermal heat supply via a burner.


 ,
, 


