Abstract
Aloe vera gel and whole leaf materials, as well as polysaccharides, precipitated from the gel, have previously been shown to enhance macromolecular drug delivery across epithelial tissues. This study investigated the effectiveness of microparticle formulations prepared from A. vera polysaccharides for nasal delivery of insulin across excised sheep olfactory and respiratory nasal epithelial tissues. An emulsion-solvent evaporation technique was used to prepare two insulin microparticle formulations, namely one containing Eudragit® L100 and A. vera polysaccharides and one containing A. vera polysaccharides only. In addition, an ionic gelation technique was used to prepare an insulin microparticle formulation with A. vera polysaccharides, where calcium chloride was used as a cross-linker. The microparticle formulations were evaluated in terms of drug content (assay), particle size, drug release (dissolution), ex vivo drug permeation, and histology. The microparticle formulations exhibited statistically significantly higher insulin delivery across excised sheep olfactory and respiratory nasal epithelial tissues compared to that of the control group (insulin alone). In conclusion, the use of A. vera polysaccharides in microparticle formulations significantly improved nasal insulin delivery. Therefore, A. vera polysaccharide containing microparticles showed high potential to enhance systemic bioavailability and delivery into the brain of macromolecular drugs such as insulin after intranasal administration.
1. Introduction
Insulin is a peptide hormone that is secreted by the pancreas to regulate blood glucose levels [1]. Diabetes mellitus is a metabolic disease where there is a defect in insulin action, secretion or a combination thereof causing hyperglycaemia in patients suffering from this disease [2]. Insulin is the main drug for the treatment of type 1 diabetes mellitus and is primarily administered through subcutaneous injection [3,4]. After oral administration, insulin undergoes rapid degradation due to proteases in the intestinal tract, and it is also poorly permeable across the intestinal epithelium, which results in it having a very low oral bioavailability [5,6]. Due to its unfavourable physicochemical properties, insulin is difficult to deliver systemically in any other way than with subcutaneous injection. However, frequent injections on a chronic basis have drawbacks, such as discomfort and pain, the potential for infections, and the potential of lipohypertrophy at the site of injection [7,8].
Besides blood glucose regulation, insulin also plays a role in normal brain functions. It was found that a dysregulation of insulin in the brain may contribute to the occurrence of diseases such as Alzheimer’s and Parkinson’s disease [9]. Treatment with insulin in the central nervous system has shown therapeutic potential for neurodegenerative diseases as well as neurotrauma [10].
In the brain, insulin receptors are concentrated in the amygdala, cerebellum, hippocampus, septum, cerebral cortex, and olfactory bulb. Nose-to-brain drug delivery occurs when drug molecules move from the nasal cavity to the brain, thereby bypassing the blood–brain barrier [1]. Drug molecules can be delivered directly to the brain after intranasal administration via different pathways. One pathway involves the movement of drug molecules along the trigeminal nerve; however, molecules can also move into the olfactory bulb from the olfactory region in the nasal cavity via diffusion across the epithelium. Drug molecules absorbed into the systemic circulation mostly from the respiratory region after intranasal administration can also reach the brain indirectly but then must pass the blood–brain barrier [11,12,13,14,15,16,17]. The challenge remains that most protein and peptide molecules (including insulin) show poor bioavailability of 1% or less when administered intranasally due to their unfavourable physicochemical properties that hinder membrane permeation [18].
Permeation enhancers may be used to increase the rate and extent of drug delivery from the nasal cavity. These permeation enhancers can, for example, work by opening tight junctions between epithelial cells in the nasal mucosa, which allows for paracellular diffusion of large hydrophilic molecules [19]. Both gel and whole-leaf extracts from A. vera have shown the ability to enhance the absorption of poorly permeable drugs across different epithelial mucosae. Gel and whole leaf materials from A. vera have shown the ability to increase drug delivery across intestinal epithelial cells (Caco-2) and excised intestinal tissues [20,21], excised buccal mucosa [22], excised skin [23], and excised nasal mucosa [24].
Microparticles have been successfully used as dosage forms for the effective delivery of drugs for different routes of drug administration [25,26]. Furthermore, microparticles have advantages such as protecting the drug against degradation, improving the dissolution rate, and thereby increasing drug bioavailability. Additionally, functional excipients can also be incorporated into microparticles to further improve versatility and effectiveness [25,26]. An example of a functional excipient that has been frequently included in formulations is Eudragit® L100. Eudragit® L100 has been employed in various formulations, including microspheres, nanoparticles, and liposomes, to impart different properties or characteristics such as enteric behaviour, sustained release, or enhanced bioavailability [27,28].
Chitosan-4-thiobutylamidine (chitosan-TBA) was used to prepare insulin-containing microparticles by means of an emulsification solvent evaporation technique. The chitosan–TBA–insulin microparticles increased the absolute bioavailability of insulin to 7.24 ± 0.76% after intranasal administration in conscious rats, which was markedly higher than that of the control groups of 2.04 ± 1.33% and 1.04 ± 0.27%, respectively [18]. In another study, insulin was incorporated into thiomeric microparticles using a two-step method. In the first step, interpolymer complexes were formed between poly (vinyl pyrrolidone) (PVP) and poly (acrylic acid) (PAA) or poly (acrylic acid)-cysteine (PAA-Cys) in the presence of insulin. The lyophilized coprecipitates were then micronized by means of an air jet mill. Some of these microparticles showed a moderate decrease in ciliary beat frequency, after which the cilia completely recovered 60 min after a washout period. From this study, it was concluded that the thiomeric microparticles provided a safe multi-unit drug delivery system for the nasal application of insulin [29].
In this study, three different insulin microparticle formulations have been prepared that contain A. vera polysaccharides as drug-absorption-enhancing agents. The microparticles have been characterised by means of particle size determination, drug release, and insulin delivery across excised olfactory and respiratory nasal epithelial tissues mounted in a Sweetana–Grass diffusion chamber system. Histological evaluation was conducted on the tissues at the end of the permeation study to determine if any damage was caused to the excised nasal tissues by the microparticles during the permeation study.
2. Materials and Methods
2.1. Materials
The chemicals used to prepare the microparticles included Eudragit® L100 (Evonik Industries, Essen, Germany), polysaccharides that were precipitated from A. vera gel (Daltonmax700®, Improve USA Inc., Plano, TX, USA, DeSoto), liquid paraffin (Sigma-Aldrich, Johannesburg, South Africa), n-hexane (ACE chemicals, Johannesburg, South Africa), hydrochloric acid, and calcium chloride (SAARCHEM, Johannesburg, South Africa). Krebs Ringer Bicarbonate buffer (KRB) was prepared according to the K4002 product sheet (Sigma-Aldrich, Taufkirchen, Germany) and contained D-glucose, magnesium chloride (anhydrous), potassium chloride, sodium chloride, sodium phosphate dibasic (anhydrous), and sodium phosphate monobasic (anhydrous). The chemicals for the histological evaluation included haematoxylin, eosin Y, and Alcian blue (Sigma-Aldrich, Johannesburg, South Africa).
2.2. High-Performance Liquid Chromatography (HPLC) Analysis of Insulin
The HPLC analysis method that was used to determine the insulin concentration in the samples was adapted from a previously published study [20]. The instrument consisted of an Agilent® Technologies 1200 series fitted with a G1310A Iso Pump DE62955738; the column was a Venusil® ASB column C18 (T), 5 µm 300 Å 4.6 × 250 mm from Agela® Technology. The mobile phase consisted of 2 phases, namely phase A (Degassed mixture of HPLC grade water and 0.1% orthophosphoric acid) and phase B (Acetonitrile). The flow rate was set at 1.0 mL/min, and the injection volume was 10 µL. The samples were quantified with a PDA detector measuring UV absorbance at a wavelength of 200 nm. The retention time was 6 min, and stop time at 12 min. Gradient elution was applied starting with 80% phase A and 20% phase B; at 6 min, it changed to 40% phase A and 60% phase B, and at 8.2 min, it changed to 80% phase A and 20% phase B until time 12 min.
Standard Solution Preparation
Approximately 5 mg of human recombinant insulin was weighed accurately and placed in 5 mL of KRB within a volumetric flask, which was shaken to dissolve the insulin. The stock solution was diluted by a series of dilutions taking 500 µL from each resultant solution and further diluting it with 500 µL KRB to produce 10 standard solutions with different concentrations in HPLC vials. The vials were then loaded into the autosampler of the HPLC instrument and injected (10 µL) to be analysed, and the response (peak area) was plotted as a function of concentration to produce a standard curve. A standard curve was constructed before every analysis and used to calculate the insulin concentration from the peak areas of the samples that were analysed.
2.3. Fluorescence Spectrophotometric Analysis of Lucifer Yellow
The fluorescence spectrophotometric analysis method that was used to determine the Lucifer yellow (LY) concentration in the samples was based on a previously published method [24]. The LY analysis was conducted using a Spectramax® Paradigm multi-mode detection platform plate reader set at excitation and emission wavelengths of 485 nm and 535 nm, respectively.
2.4. Validation of the High-Performance Liquid Chromatography (HPLC) and Fluorescence Spectroscopy Analytical Methods
The HPLC method for insulin analysis and fluorescence method for LY analysis were validated in terms of linearity, accuracy, precision, limit of quantification, limit of detection, and specificity, which proved that the analytical method is reliable and accurate [30]. The validation of the analysis methods was conducted to prove that they conformed with the parameters of ICH harmonised tripartite guidelines for validation of analytical procedures [31].
2.4.1. Linearity
A series of standard solutions of insulin was prepared as previously described over a concentration range of 1.953 µg/mL to 1000 µg/mL and injected in duplicate into the HPLC. The peak areas obtained on the chromatograms were plotted as a function of insulin concentration. A series of standard solutions of LY was prepared over a concentration range of 0.098 µg/mL to 50.0 µg/mL and detected on the plate reader at excitation and emission wavelengths of 485 nm and 535 nm, respectively. A linear regression was conducted on the standard curve, and the correlation coefficient (R2) was calculated. The R2 should be ≥0.998 for the standard curve to be accepted as linear [30].
2.4.2. Accuracy
For accuracy determination, 3 insulin solutions were used at a low, moderate, and high insulin concentration (25, 75, and 100 µg/mL), which were each prepared in triplicate to produce 9 samples for measurement. For LY, the concentration of the solutions used for accuracy determination included 12.5, 25, and 50 µg/mL. The percentage recovery for each concentration was calculated based on the theoretical concentration in each solution.
2.4.3. Precision
Both intra-day and inter-day precision were determined as described below.
Intra-Day Precision (Repeatability)
The insulin samples were analysed 3 times within the same day with 3 different concentrations (3.9, 7.9, and 15.7 µg/mL) and for LY 12.5, 25, and 50 µg/mL. The percentage relative standard deviation (%RSD) values were calculated, which should be equal to or smaller than 2% [31].
Inter-Day Precision
A set of 3 samples of insulin with known concentrations of 3.9, 7.9, and 15.7 µg/mL and for LY with known concentrations of 12.5, 25, and 50 µg/mL were analysed on 3 different days, and from this, percentage relative standard deviation (% RSD) values were calculated [30]. The %RSD should be equal to or smaller than 2% [31].
2.4.4. Limit of Quantification (LOQ) and Limit of Detection (LOD)
Limit of quantification is the lowest limit of analyte in a sample which can be detected with valid precision and accuracy [30], whereas the limit of detection is the lowest concentration which can be distinguished from baseline noise [30].
The limit of quantification was determined by the following equation [32]:
Limit of detection (LOD) was determined by the following equation [32]:
where SD is the standard deviation error of the regression statistics from the regression line (7 points were used), and S is the slope of the standard curve of the analyte [30,33].
2.4.5. Specificity
Specificity was determined by measuring the insulin concentration in samples in the presence of all the substances used in the microparticle formulations and comparing the chromatograms to a chromatogram of insulin alone. Therefore, a mixture of insulin and A. vera polysaccharides, a mixture of A. vera polysaccharides, Eudragit® L100, and insulin, as well as a mixture of calcium chloride, insulin, and A. vera polysaccharides were prepared to test for specificity. The percentage recovery of insulin in these mixtures was determined.
2.5. Formulation and Preparation of Insulin Containing Microparticles
2.5.1. Precipitation of Aloe vera Gel Polysaccharides
Polysaccharides were precipitated from A. vera gel (Daltonmax700®) in aqueous solution by adding absolute ethanol to the volume four times that of the aqueous solution as previously described [21]. Firstly, the A. vera gel powder (30 g) was dissolved in distilled water by stirring overnight and then made up to a volume of 1 L. A volume of 4 L of absolute ethanol was added slowly to this aqueous solution and left overnight. The precipitated polysaccharides were separated centrifugally at 4000 rpm for 10 min and washed 4 times with 80% v/v ethanol, after which it was frozen with liquid nitrogen and freeze dried.
2.5.2. Emulsion-Solvent Evaporation Method of Microparticle Preparation
An emulsion-solvent evaporation method previously described for preparation of insulin microparticles [34] has been used with slight modification to prepare two insulin-containing microparticle formulations investigated in this study. One insulin microparticle formulation contained Eudragit® L100 together with A. vera polysaccharides, while the other insulin microparticle formulation contained A. vera polysaccharides only.
The internal phase (38 mL) of the emulsion for the first microparticle formulations consisted of a mixture of 0.01 M HCl (10.98 mL), ethanol (20.8 mL), Tween ® 80 (0.3 mL), A. vera polysaccharides (0.303 g), insulin (156 mg), and Eudragit® L100 (1.5 g). The internal phase (38 mL) of the emulsion for the second microparticle formulation consisted of a mixture of 0.01 M HCl (10.98 mL), ethanol (20.8 mL), Tween 80 (0.3 mL), A. vera polysaccharides (0.1 g), and insulin (159 mg); insulin amount was varied due to weighing differences; however, the end concentration in the permeation studies were worked out on basis of amount of microparticles. The continuous phase consisted of 98.5 mL mineral oil, to which a sufficient quantity of Span® 80 was added to make up a volume of 100 mL.
The internal phase was added dropwise using a peristaltic pump through an 18-gauge needle into the continuous phase while stirring at 2000 rpm. After the total volume of the internal phase was completely dropped into the continuous phase, the mixture was stirred (2000 rpm) for 24 h at room temperature to allow the ethanol to evaporate. The resultant microparticle suspension was washed using n-hexane to remove the mineral oil, and the microparticles were separated by filtration and then transferred to a container. This microparticle formulation prepared by the emulsion-solvent evaporation method containing Eudragit® L100 in addition to A. vera polysaccharides was referred to as “E + AVP emulsion”, while the microparticle formulation prepared using emulsion-solvent evaporation consisting of A. vera polysaccharides only was referred to as “AVP emulsion”.
2.5.3. Ionic Gelation Method of Microparticle Preparation
Firstly, a calcium chloride (cross-linker) solution was prepared by dissolving 60 g calcium chloride in deionised water, which was made up to 1000 mL and then sonicated for 10 min. An A. vera gel polysaccharide (0.3 g) and insulin (158.9 mg) solution were prepared in 60 mL 0.01 M HCl that was stirred for 30 min.
A volume of 60 mL of the prepared cross-linking solution was added to the A. vera polysaccharide and insulin solution (60 mL) in the form of finely divided droplets using an atomised spraying apparatus, which was set at 0.6 bar, while the polysaccharide and insulin solution was mixed at 2000 rpm. The resultant microparticle suspension was left to stir for two hours. It was then frozen in a −70 °C freezer and freeze dried. The lyophilised powder was ground in a nano grinder (Fritsch, planetary micro mill pulverisette 7 premium line) set at 30 s intervals for 1 min at an amplitude of 6 to produce the final microparticles. This microparticle formulation prepared by the ionic gelation method consisting of only A. vera polysaccharides was referred to as “AVP ionic gelation”.
2.6. Evaluation of the Insulin Microparticle Formulations
2.6.1. Assay
The insulin content of a 5 mg sample of each microparticle formulation was determined using HPLC. A mixture of water and absolute ethanol (50:50; 10 mL:10 mL) was used as solvent to release the insulin from the microparticles by forcefully stirring (vortex) a suspension of each individual microparticle formulation in the solvent for 20 min. A sample was collected from the suspension and analysed for insulin concentration by HPLC to obtain the experimental value for insulin content. The percentage insulin content in each microparticle formulation was calculated using Equation (3).
2.6.2. Particle Size Analysis
The particle size and size distribution of each insulin microparticle formulation were determined by means of laser light diffraction using a Mastersizer® 2000 apparatus (Malvern Instruments Ltd. Worcestershire, UK) fitted with a Hydro 2000SM dispersion unit. Light mineral oil was the dispersant used for the microparticle formulations prepared by the emulsion-solvent evaporation method, while ethanol was used as the dispersant for the microparticle formulation prepared by the ionic gelation method. Each microparticle sample was added to mineral oil or ethanol in a tube, and a pipette was used to add a sufficient quantity of the microparticle suspension to the Mastersizer® dispersion unit until the laser obscurity was at 15%. Span, an indication of the width of particle size distribution, was obtained from the Mastersizer® software together with the weighted mean value by volume or D [4.3], an indication of the mean particle size.
Micrographs were taken of samples from each microparticle formulation with a ZEISS LSM 980 confocal laser scanning microscope with Airyscan 2 detector (Carl Zeiss, Oberkochen, Germany) using a 63× oil objective with the pinhole set at 48 µm, excited with the 405 nm laser, and the detection wavelength set to 411–605 nm. ZEN 3.4 (blue edition) microscopy software was used to measure the diameter of the particles.
2.6.3. Dissolution Studies
A quantity of approximately 100–150 mg (accurately weighed) of each microparticle formulation was added to glass dissolution vessels (n = 5), respectively. The dissolution medium consisted of 20 mL of KRB (pH = 7.4). The 5 dissolution vessels were placed on a rotating bar in a water bath to rotate at 25 rpm at 37 °C.
A sample (200 µL) was withdrawn from each dissolution vessel with a pipette at time intervals of 5, 10, 15, 30, 45, 60, 90, 120, and 180 min, and each withdrawal was followed by a replenishment of the same volume with KRB. The samples were analysed with an HPLC to determine the concentration of insulin. The percentage of insulin released from each microparticle formulation was plotted as a function of time to provide dissolution profiles.
2.7. Ex Vivo Permeation Studies
2.7.1. Collection, Dissection, and Preparation of Sheep Respiratory and Olfactory Nasal Tissues
Approval for using nasal epithelial tissues from sheep slaughtered at an abattoir was obtained from the North-West University Animal Care, Health, and Safety Research Ethics Committee (ethics approval number: NWU-00417-21-A5).
The snouts of sheep that were slaughtered at Potchefstroom Abattoir (Potchefstroom, South Africa) were removed by means of a transverse incision anterior to the eyes of the sheep’s heads and across the jaw with an electric bone saw. The separated snout was skinned and cut longitudinally along the septum to separate the snout into two halves. A vertical incision was made through the remaining septum to isolate the ventral nasal conchae, from which the respiratory epithelial tissue was dissected with a scalpel. The isolated respiratory epithelial tissues were further divided into smaller pieces of 2 cm × 1 cm to be mounted in between the half-cells of a Sweetana–Grass diffusion chamber apparatus. The olfactory epithelial tissues were dissected from the ethmoid conchae and further divided in the same way as described for the respiratory epithelial tissues, after which it was mounted in between the half-cells of the diffusion chambers.
The assembled cells of the Sweetana–Grass diffusion apparatus were filled with 7 mL of preheated KRB in each chamber. Carbogen (5% CO2; 95% O2) was bubbled through the KRB in the chambers at a gas flow rate of 15–20 mL/min. Pre-incubation was allowed to run for 30 min to equilibrate the tissue before starting the permeation studies [24].
2.7.2. Permeation of Lucifer Yellow as an Indicator of Membrane Integrity
The permeation of the membrane exclusion marker, LY, was measured to determine the integrity of the exercised sheep nasal epithelial tissues mounted in the Sweetana–Grass diffusion chambers under the same conditions and over the entire period that the permeation studies were conducted. A solution of LY (50 µg/mL) was placed into the apical chambers of each Sweetana–Grass cell (n = 6). Samples (200 µL) were withdrawn from the basolateral chamber at time intervals 10, 20, 30, 60, 90, and 120 min and placed in the wells of a black 96-well plate to be analysed with fluorescence spectrophotometry (SpectraMax® Paradigm® plate reader). At each time of withdrawal, from the basolateral side, a volume of 200 µL pre-heated KRB (37 °C) was re-introduced to keep the volume in the chamber constant [35].
2.7.3. Permeation of Insulin
For the control group, an insulin solution (7 mL) with a concentration of 1 mg/mL of insulin in KRB was placed in each apical chamber of 6 Sweetana–Grass diffusion cells (n = 6). Samples (200 µL) were withdrawn from the basolateral side at time intervals of 10, 20, 30, 60, 90, and 120 min and placed in vials to be analysed by means of HPLC. The samples withdrawn were replaced with the same volume of pre-heated KRB at every time interval.
For the experimental groups, a sufficient quantity of each microparticle formulation was dispersed in KRB to provide a suspension with an equivalent concentration of 1 mg/mL of insulin based on the insulin content of each microparticle formulation as determined by the assay. A suspension of each microparticle formulation (7 mL) was placed in each apical chamber of 6 Sweetana–Grass diffusion cells (n = 6). At time intervals of 10, 20, 30, 60, 90, and 120 min, samples (200 µL) were withdrawn from the basolateral side and placed in vials to be analysed by HPLC. After each sample withdrawal, a volume of 200 µL pre-heated KRB was added to the basolateral side to maintain the volume [24].
The apparent permeability coefficient (Papp) values were calculated by using the following equation [36]:
where Papp is the apparent permeability coefficient value (cm.s−1), dQ/dt (µg.s−1) is the amount of insulin that permeated into the receiver chamber over time (slope of the plot of insulin permeated as a function of time), A is the effective surface area of the olfactory/respiratory tissue (cm2) between the apical and basolateral chambers, and Co is the initial insulin concentration that was placed in the apical chamber (µg.cm−3).
2.8. Statistical Analysis
Statistical analysis of the permeation data (Papp values) was performed using R 4.0.5 software (R Core team). An analysis of variance (ANOVA), as well as Brown–Forsythe test of homogeneity of variance, was employed to determine statistical differences among the data. In addition, Tukey’s honest significant difference (HSD) post hoc test was performed to detect any statistically significant differences between the Papp values of the experimental groups compared to that of the control group. It was considered statistically significant if p ≤ 0.05 [37,38].
2.9. Histological Evaluation
Histological evaluations were performed on all excised sheep nasal epithelial tissues at the end of the permeation studies. Tissue samples of each experimental group were fixed in 10% neutral buffered formalin (for 7 days), then serially dehydrated in ethanol, clarified in xylene, and embedded in paraffin wax [24].
The paraffin blocks were sectioned at a thickness of 5 µm, placed onto a clean glass slide, and allowed to dry overnight at 37 °C [23]. The paraffin sections were then dewaxed in xylene and rehydrated in a series of ethanol solutions. Whereafter, the samples were stained with haematoxylin, aqueous eosin Y, and Alcian blue. The sections were examined under a Nikon E800 compound microscope using the 40× and 60× objective [24].
3. Results and Discussion
3.1. Validation of HPLC Analysis Method for Insulin and Fluorescence Spectrophotometric Analysis Method for Lucifer Yellow
The results obtained for the validation parameters of the HPLC method for insulin analysis showed that the method complied with the limits, namely R2 for linearity = 0.999, and percentage recovery values for accuracy were all within the range of 95–105%. The %RSD for inter-day and intra-day precision were all ≤2%, and LOD and LOQ were 0.78 mM and 2.37 mM, respectively.
The results obtained for the validation parameters of the fluorescence spectrophotometric analysis for LY showed that the method complied with the limits, namely R2 for linearity = 0.999, percentage recovery values for accuracy were all within the range of 98–102%, %RSD for inter-day and intra-day precision were all ≤2%, LOD and LOQ were 0.01 mM and LOQ 0.02 mM, respectively.
3.2. Evaluation of Insulin Microparticle Formulations
3.2.1. Assay
Table 1 shows the percentage of insulin content as determined by the assay of the insulin microparticle formulations prepared with different manufacturing techniques.

Table 1.
Percentage insulin content of the microparticle formulations.
The assay results displayed in Table 1 show that the insulin content was the highest (89.6%) in the microparticle formulation consisting of Eudragit® L100 combined with A. vera polysaccharides (E + AVP emulsion), followed by the microparticle formulation consisting of A. vera polysaccharides only (AVP emulsion, 56.2%) that was prepared using the emulsion-solvent evaporation method. The microparticles prepared by the ionic gelation method, consisting of the A. vera polysaccharides only (AVP ionic gelation), showed the lowest insulin content (42.9%). During the emulsion-solvent evaporation technique, the drug molecules were concentrated in the droplets of the internal phase of the emulsion together with the polymer molecules, which formed the microparticles after solvent evaporation. A relatively low portion of the insulin molecules could be lost during microparticle formation into the continuous phase (mineral oil) due to low solubility in this phase. A portion of the insulin may have been lost during the washing step from the microparticles consisting of A. vera polysaccharides only. The relatively low insulin content of the microparticles produced by the ionic gelation technique can possibly be explained by the homogenous distribution of the dissolved insulin molecules throughout the entire solution, and only a portion of the insulin molecules could be captured in the microparticles formed through ionic gelation, while some of the insulin molecules remained in the solution surrounding the microparticles.
3.2.2. Particle Size Analysis
The insulin microparticles consisting of Eudragit® L100 and A. vera polysaccharides prepared by the emulsion-solvent evaporation method (E + AVP emulsion) exhibited an average particle size (D [4.3]) of 86.47 µm. The span value of 2.36 is indicative of a relatively wide particle size distribution, which occurred because of the presence of a fairly large portion of smaller than the average size particles (histogram skewed/tailed to the left). Span is a parameter that indicates the width of particle size distribution. A direct correlation exists between the width of particle size distribution and the span value, which means that the smaller the span value is, the narrower the particle size distribution is [39]. The span values were compared between the microparticle formulations to indicate relative particle size distribution widths. The insulin microparticles prepared by the emulsion-solvent evaporation method consisting of A. vera polysaccharides only (AVP emulsion) exhibited an average particle size (D [4.3]) of 43.84 µm with a span value of 1.49, which is indicative of a relatively narrow particle size distribution.
The insulin microparticles prepared by ionic gelation with A. vera polysaccharides only (AVP ionic gelation) exhibited an average size (D [4.3]) of 151.05 µm with a span value of 2.61. The larger particle size of this microparticle formulation may be explained by the formation of microparticles with weaker ionic bonds between the polysaccharide molecules and the cross-linker ions, which resulted in more diffuse, larger microparticles.
Confocal laser scanning microscopy micrographs of each of the microparticle formulations are shown in Figure 1. A microparticle in the sample of the E + AVP emulsion microparticle formulation measured 61.86 µm (Figure 1A), while a microparticle from the AVP emulsion formulation measured 43.60 µm. A microparticle in the AVP ionic gelation formulation sample measured 105.65 µm. In general, the sizes of the microparticles measured using the confocal laser scanning microscope were in line with the sizes obtained by measurement with the Mastersizer®.
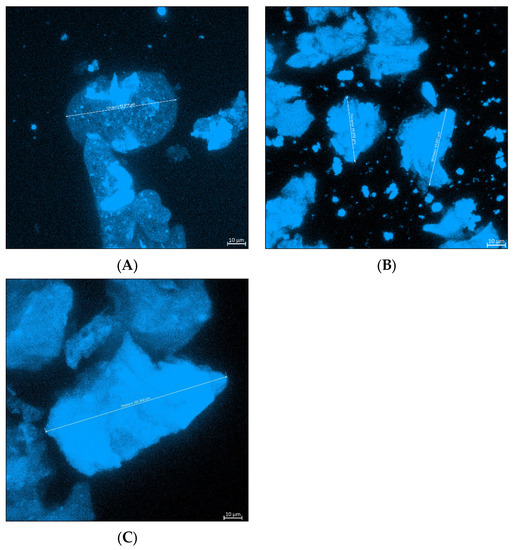
Figure 1.
Confocal laser scanning microscope images of the three microparticle formulations, namely: (A) E + AVP emulsion, (B) AVP emulsion, and (C) AVP ionic gelation.
3.3. Dissolution Studies
The dissolution curves (i.e., the graphs of the percentage of insulin released from each insulin microparticle formulation plotted as a function of time) are shown in Figure 2.
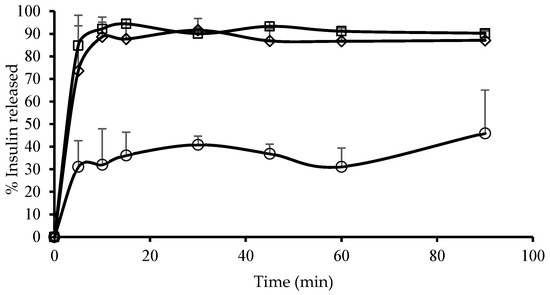
Figure 2.
Dissolution curves displaying the percentage of insulin released as a function of time for the different microparticle formulations. (◊) E + AVP emulsion = microparticles prepared by emulsion-solvent evaporation consisting of Eudragit® L100 and A. vera polysaccharides, (☐) AVP emulsion = microparticles prepared by emulsion-solvent evaporation consisting of A. vera polysaccharides and (○) AVP ionic gelation = microparticles prepared by ionic gelation consisting of A. vera polysaccharides.
The AVP emulsion microparticles exhibited the highest release of insulin over the first 5 min reaching 84.8%, which increased to 92.2% at 10 min. A plateau was then reached, and the maximum insulin released from this microparticle formulation fluctuated around 92% for the duration of the dissolution test. This relatively fast release from the microparticles is desirable for the delivery of insulin into the brain after intranasal administration to achieve a quick pharmacological action.
The E + AVP emulsion microparticles also showed relatively fast insulin release, with 73.6% insulin released over the first 5 min. Thereafter, the insulin release increased to 88.7% at 10 min and fluctuated around this value for the duration of this dissolution study. The inclusion of Eudragit® L100 with the A. vera polysaccharides in the microparticle formulation showed a very slight reduction in the rate and extent of insulin release in comparison to the microparticle formulation consisting of A. vera polysaccharides only.
The AVP ionic gelation microparticles showed a much slower rate and extent of an insulin release than the other two microparticle formulations, which were prepared by means of the emulsion-solvent evaporation method. At 5 min, the percentage of insulin release was only 31.1%, and a maximum insulin release of 45.9% was reached at 90 min. This slower release of insulin from these microparticles may be explained by the larger particle size of this formulation as well as possible ionic interactions of the cross-linker ions (Ca2+) between the insulin molecules and the A. vera polysaccharide molecules. The cross-linker ions may, therefore, have formed bridges between the insulin molecules and the A. vera polysaccharide molecules, which could have potentially decreased the release rate of the insulin molecules from the microparticles. However, this should be further investigated to be conclusive.
Although immediate drug release from the dosage form is desirable for the intranasal route of drug administration to ensure quick drug uptake, the slower release of insulin from this microparticle formulation may provide an advantage in terms of insulin delivery across the nasal epithelium. This advantage can be explained as follows: the A. vera polysaccharide molecules in the microparticles get the opportunity to first interact with the nasal epithelial tissue in order to open the tight junctions between epithelial cells, and thereafter, when the insulin molecules are released slowly, they can permeate through the intercellular spaces via opened tight junctions. This concept was previously shown for a bi-phasic intestinal insulin delivery system [40]. However, mucociliary clearance may prevent complete absorption, and therefore, the clinical effectiveness of insulin delivery from these microparticles should be investigated in vivo before final conclusions can be made.
3.4. Insulin Permeation across Excised Olfactory Sheep Nasal Epithelial Tissues
The Papp values for insulin across excised sheep olfactory nasal epithelial tissues after the application of the different microparticle formulations are shown in Figure 3.
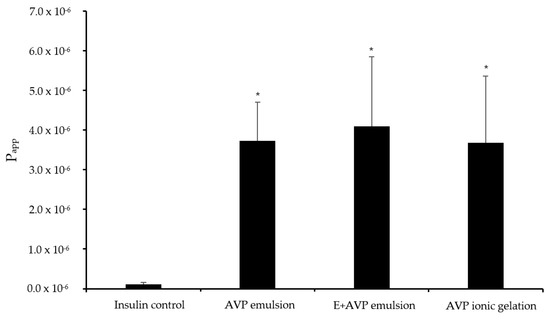
Figure 3.
Apparent permeability coefficient (Papp) values for insulin across excised olfactory sheep nasal epithelial tissues after application of the microparticle formulations and insulin alone (control group). AVP emulsion = insulin microparticle formulation prepared by emulsion-solvent evaporation consisting of A. vera polysaccharides, E + AVP emulsion = emulsion-solvent evaporation with Eudragit® L100 and A. vera polysaccharide, and AVP ionic gelation = insulin microparticle formulation prepared by ionic gelation with A. vera polysaccharides. * Statistically significantly different from the control group (n = 6; p < 0.05).
The permeation of insulin alone (control group) across the excised olfactory sheep nasal epithelial tissues showed a relatively low Papp value of 0.10 × 10⁻⁶ cm/s. This low permeation was expected because insulin is a large (5.8 kDA) hydrophilic peptide molecule with poor membrane permeation properties [41,42].
The Papp for insulin across the excised olfactory nasal epithelial tissue from E + AVP emulsion microparticle formulation was 4.10 × 10⁻⁶ cm/s, while it was 3.73 × 10⁻⁶ cm/s for the AVP emulsion microparticle formulation. The AVP ionic gelation microparticle formulation exhibited a Papp value of 3.68 × 10⁻⁶ cm/s for insulin. The Papp values for insulin from all the microparticle formulations were statistically significantly higher (p < 0.05) across the excised olfactory nasal epithelial tissues than the Papp value of the insulin control group.
A. vera polysaccharides have previously been shown to be effective permeation enhancers for oral drug absorption. It was shown in in vitro studies that A. vera gel polysaccharides have the ability to increase the paracellular intestinal epithelial membrane permeation of a small molecular weight compound (atenolol) and a large molecular weight compound (FITC-dextran, 4 kDa) by the opening of tight junctions [21,43]. In this study, the incorporation of A. vera polysaccharides in the microparticle formulations significantly increased the delivery of insulin across excised olfactory nasal epithelial tissues compared to the control group. The olfactory nasal epithelial permeation results of this study provided proof of concept for the use of A. vera polysaccharides in microparticles as potential delivery systems for insulin delivery into the brain from the olfactory region after intranasal administration. These microparticles may potentially be used for insulin delivery into the brain by means of intranasal administration for the treatment of neurodegenerative diseases. However, targeting the microparticles to the olfactory region during intranasal administration may present a challenge, which should be addressed before this could be applied clinically. Furthermore, follow-up in vivo studies is needed to determine if clinically significant insulin levels can be achieved in the brain after intranasal administration from the olfactory region.
3.5. Insulin Permeation across Excised Respiratory Sheep Nasal Epithelial Tissues
The Papp values for insulin permeation across excised respiratory sheep nasal epithelial tissues after the application of the different microparticle formulations is shown in Figure 4.
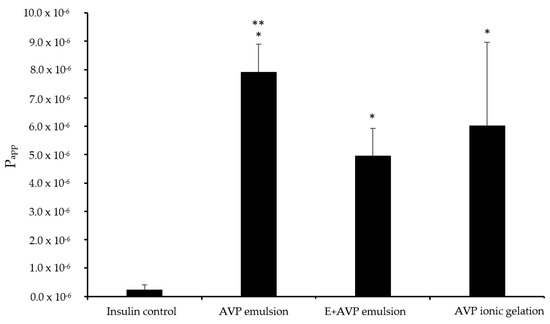
Figure 4.
Apparent permeability coefficient (Papp) values for insulin across excised respiratory sheep nasal epithelial tissues after application of the microparticle formulations and insulin alone (control group). AVP emulsion = insulin microparticle formulation prepared by emulsion-solvent evaporation consisting of A. vera polysaccharides only, E + AVP emulsion = emulsion-solvent evaporation with Eudragit® L100 and A. vera polysaccharide, and AVP ionic gelation = ionic gelation with A. vera polysaccharide only. * Statically significantly different from the control group (n = 6; p < 0.05). ** Statistically significant difference between AVP emulsion group and E + AVP emulsion group.
The relatively low Papp value for insulin alone in the control group of 0.23 × 10⁻⁶ cm/s across excised respiratory sheep nasal epithelial tissues was expected because insulin is a large (5.8 kDA) hydrophilic peptide molecule with poor membrane permeation properties [41,42].
The E + AVP emulsion microparticles exhibited a Papp value of 4.95 × 10⁻⁶ cm/s for insulin, while the AVP emulsion microparticles exhibited a Papp value of 7.91 × 10⁻⁶ cm/s for insulin. The AVP ionic gelation microparticles showed a Papp value of 6.03 × 10⁻⁶ cm/s for insulin. All 3 of the microparticle formulations showed a statistically significantly (p < 0.05) higher Papp value for insulin across the excised respiratory sheep nasal epithelial tissues in comparison to that of the control group.
As explained before, the A. vera polysaccharides were previously shown to increase drug permeation across epithelial tissues by means of tight junction modulation and thereby allow for increased paracellular diffusion [21,43]. The ex vivo permeation results across the excised respiratory sheep nasal epithelial tissues showed that the microparticle formulations containing A. vera polysaccharides advanced insulin delivery significantly compared to the control group. The results obtained from this ex vivo permeation study across excised respiratory epithelial tissues indicated that the microparticle formulations can potentially deliver insulin effectively into systemic circulation after intranasal administration. This may potentially be used for blood glucose control in diabetic patients. However, follow-up in vivo studies is needed to confirm if clinically significant plasma levels can be achieved after intranasal administration.
Furthermore, the nasal insulin delivery results obtained from this current study on A. vera polysaccharide microparticle formulations are in line with a previous study where chitosan-TBA microparticles enhanced insulin delivery [18]; however, further in vivo studies are needed to compare the absolute bioavailability of insulin from the A. vera polysaccharide microparticles with that of previous microparticle formulations.
3.6. Histological Evaluation
Since some permeation enhancers have previously been associated with damaging effects on epithelial membranes [44], it was important to determine if exposure to the microparticles containing A. vera polysaccharides caused any physical harm to the excised nasal epithelial tissues during the permeation studies [45].
3.6.1. Olfactory Nasal Epithelial Tissue
The microscopic images of the olfactory nasal epithelial tissues before and after exposure to the different microparticle formulations are depicted in Figure 5. The tissues were stained with haematoxylin (blue-purple stain of the nuclei), aqueous eosin Y (pink stain of the cytoplasm and extracellular matrix), and Alcian blue (bright blue stain of the mucus).
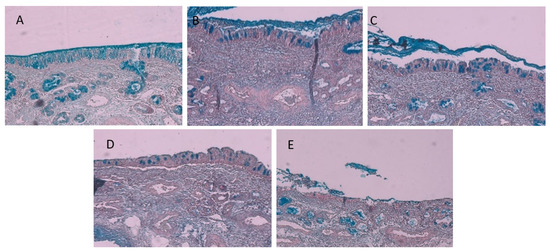
Figure 5.
Micrographs of olfactory sheep nasal epithelial tissues of (A) the intact control, (B) after exposure to insulin in the control group, (C) after exposure to microparticles consisting of Eudragit® L100 and A. vera polysaccharides prepared by the emulsion-solvent evaporation, (D) after exposure to microparticles consisting of A. vera polysaccharide prepared by the emulsion-solvent evaporation, and (E) after exposure to microparticles consisting of A. vera polysaccharide prepared by ionic gelation.
The micrographs of the olfactory sheep nasal tissue in the intact control group (Figure 5A, which is freshly dissected tissue before it was mounted in the diffusion chamber) showed that a layer of mucus (i.e., bright blue colour) was present on the surface of the epithelium, while the pseudostratified ciliated columnar epithelial cells appeared intact with goblet cells interspaced between them. Bowman’s glands are visible in the tissue below the epithelial layer (illustrated by the concentrated bright blue stain in the lamina propria) [24]. When comparing the mucus layer and the presence of goblet cells and Bowman’s glands in Figure 5A (untreated control) and Figure 5B (insulin-treated control), it is apparent that no physical damage occurred in the olfactory epithelial tissue during exposure to insulin alone (control group) in the permeation experiment.
In a previous study, it was shown that A. vera gel and whole leaf materials in solution caused some loosening and detaching of epithelial cells from excised sheep nasal epithelial tissues [24]. In this study, some physical damage can be observed on the olfactory sheep nasal tissues after exposure to the different microparticle formulations, albeit to a smaller degree, as reported by Gerber et al. [24]. In Figure 5C, some mucus, goblet cells, and Bowman’s glands are observed, which are indicators of an intact epithelial layer, similar to the untreated and insulin-treated control groups (Figure 5A,B). The tissue treated with microparticles consisting of A. vera polysaccharide prepared by the emulsion-solvent evaporation (Figure 5D) showed the epithelial layer is still intact, although there are some signs of detachment between the epithelial layer and the lamina propria, indicating some damage may have started to occur after 2 h treatment. Lastly, the tissue treated with the microparticles consisting of A. vera polysaccharides prepared by ionic gelation (Figure 5E) showed relatively more damage than the other microparticles (Figure 5C,D). The epithelial layer appears disintegrated, and the lamina propria showed signs of delamination. This indicated some protective activity of the Eudragit® L100 incorporated within the microparticles prepared by emulsion-solvent evaporation.
3.6.2. Respiratory Nasal Epithelial Tissue
The microscopic images of the respiratory nasal epithelial tissues after exposure to the different microparticle formulations are depicted in Figure 6. As mentioned before, the tissue samples were stained with haematoxylin (blue-purple stain of the nuclei), aqueous eosin Y (pink stain of the cytoplasm and extracellular matrix), and Alcian blue (bright blue stain of the mucus).
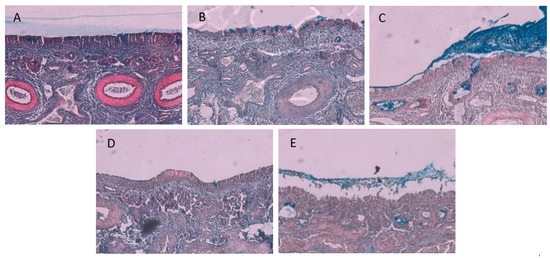
Figure 6.
Micrographs of the respiratory sheep nasal epithelial tissue: (A) the intact control, (B) after exposure to insulin control group, (C) after exposure to microparticles consisting of Eudragit® L100 and A. vera polysaccharides prepared by the emulsion-solvent evaporation, (D) after exposure to microparticles consisting of A. vera polysaccharide prepared by the emulsion-solvent evaporation, and (E) after exposure to microparticles consisting of A. vera polysaccharide prepared by ionic gelation.
The micrograph of the intact respiratory epithelial tissue (Figure 6A) displayed less mucus compared to that of the olfactory epithelial tissue (Figure 5A), which can possibly be explained by the presence of motile cilia in the respiratory tissue, thus continually removing the mucus from the respiratory tissue. From the micrograph in Figure 6B, it is clear that the respiratory epithelial layer on the surface of the tissue remained intact after exposure to the insulin control, while some goblet cells are visible. In Figure 6C, some mucus and goblet cells are visible on the epithelial layer, and some delamination is starting to appear within the lamina propria. The tissue treated with microparticles consisting of A. vera polysaccharide prepared by the emulsion-solvent evaporation (Figure 6D) showed an intact epithelial layer with more delamination within the lamina propria than observed in Figure 6C. The respiratory tissue treated with the microparticles prepared by ionic gelation (Figure 6E) exhibited the greatest amount of delamination of the lamina propria, as well as the disintegration of the epithelial layer. In general, the histology results from this study after exposure to microparticle formulations containing A. vera polysaccharides showed less damage than was previously reported for A. vera gel and whole leaf materials in solution [24].
4. Conclusions
The size of the microparticles prepared by means of the emulsion-solvent evaporation method was substantially smaller than those prepared through ionic gelation. In addition, the microparticles prepared utilizing the emulsion-solvent evaporation method exhibited faster insulin release than the microparticles prepared using ionic gelation. All microparticles were able to enhance insulin permeation statistically significantly across the excised olfactory and respiratory sheep nasal epithelial tissues compared to the control group. The inclusion of Eudragit® L100 together with A. vera polysaccharides in the microparticles increased the insulin content and decreased epithelial tissue damage. The microparticles containing A. vera polysaccharides, therefore, showed the potential to enhance insulin delivery after intranasal administration.
Author Contributions
Conceptualization, J.H., J.S. and D.S.; methodology, C.K.-S. and A.H.-P.; validation, C.K.-S. and A.H.-P.; formal analysis, C.K.-S.; investigation, C.K.-S.; resources, J.H. and J.S.; writing—original draft preparation, C.K.-S.; writing—review and editing, J.S., D.S., A.H.-P., H.H. and J.H.; visualization, H.H.; supervision, J.H., J.S. and D.S.; funding acquisition, J.H. All authors have read and agreed to the published version of the manuscript.
Funding
This research was partly funded by the Faculty of Health Sciences, North-West University, South Africa (Grant name Neurological disorders) and partly by the National Research Foundation of South Africa (Grant Number 129785). Opinions, findings, and conclusions or recommendations expressed in any publication generated by the NRF-supported research are that of the author(s), and the NRF accepts no liability whatsoever in this regard.
Institutional Review Board Statement
The use of excised animal nasal epithelial tissue was approved by the Animal Care, Health, and Safety Research Committee of the North-West University (NWU-AnimCareREC; protocol code NWU-00417-21-A5) on 19 July 2021.
Informed Consent Statement
Not applicable.
Data Availability Statement
The data presented in this study are available on request from the corresponding author.
Conflicts of Interest
The authors declare no conflict of interest.
References
- Gaddam, M.; Singh, A.; Jain, N.; Avanthika, C.; Jhaveri, S.; De la Hoz, I.; Goli, S.R.A. Comprehensive review of intranasal insulin and its effect on the cognitive function of diabetics. Cureus 2021, 13, e17219–e17228. [Google Scholar] [CrossRef] [PubMed]
- Kharroubi, A.T.; Darwish, H.M. Diabetes mellitus: The epidemic of the century. World Diabetes 2015, 6, 850–867. [Google Scholar] [CrossRef] [PubMed]
- Fonte, P.; Araujo, F.; Reis, S.; Sarmento, B. Oral insulin delivery: How far are we? J. Diabetes Sci. Technol. 2013, 7, 520–531. [Google Scholar] [CrossRef] [PubMed]
- Shah, R.B.; Patel, M.; Maahs, D.M.; Shah, V.N. Insulin delivery methods: Past, present and future. Int. J. Pharm. Investig. 2016, 6, 1–9. [Google Scholar] [CrossRef]
- Marschütz, M.K.; Bernkop-Schnürch, A. Oral peptide drug delivery: Polymer-inhibitor conjugates protecting insulin from enzymatic degradation in vitro. Biomaterials 2000, 21, 1499–1507. [Google Scholar] [CrossRef] [PubMed]
- Kalra, S.; Kalra, B.; Agrawal, N. Oral insulin. Diabetol. Metab. Syndr. 2010, 2, 66–69. [Google Scholar] [CrossRef]
- Guo, X.; Wang, W. Challenges and recent advances in the subcutaneous delivery of insulin. Expert Opin. Drug Deliv. 2016, 14, 727–734. [Google Scholar] [CrossRef]
- Mokta, J.K.; Mokta, K.K.; Panda, P. Insulin lipodystrophy and lipohypertrophy. Indian J. Endocrinol. Metab. 2013, 17, 773–774. [Google Scholar] [CrossRef]
- Craft, S.; Watson, G.S. Insulin and neuro degenerative disease: Shared and specific mechanisms. Lancet Neurol. 2004, 3, 169–178. [Google Scholar] [CrossRef]
- Shaughness, M.; Acs, D.; Brabazon, F.; Hockenbury, N.; Byrnes, K.R. Role of insulin in neurotrauma and neurodegeneration: A review. Front. Neurosci. 2020, 14, 547175. [Google Scholar] [CrossRef] [PubMed]
- Appasaheb, P.S.; Manohar, S.D.; Bhanudas, S.R. A review on intranasal drug delivery system. J. Adv. Pharm. Educ. Res. 2013, 3, 333–346. [Google Scholar]
- Bonaccorse, A.; Muisumeci, A.; Puglisi, G. Epilepsy disease and nose- to -brain delivery of polymeric nanoparticles: An overview. Pharmaceutics 2019, 11, 118. [Google Scholar]
- Chhajed, S.; Sangale, S.; Barhate, S.D. Advantageous nasal drug delivery system: A review. Int. J. Pharm. Sci. Res. 2011, 2, 1322–1336. [Google Scholar]
- Grassin-Delyle, S.; Buenstado, A.; Naline, E.; Faisy, C.; Blouquit-Laye, S.; Couderc, L.; Devillier, P. Intranasal drug delivery: An efficient and non-invasive route for systemic administration: Focus on opioids. Pharmacol. Ther. 2012, 134, 366–379. [Google Scholar] [CrossRef]
- Putheti, R.R.; Patil, M.C.; Obire, O. Nasal drug delivery in pharmaceutical and biotechnology: Present and future. E-J. Sci. Technol. 2009, 4, 1–21. [Google Scholar]
- Swamy, N.G.N.; Abbas, Z. Mucoadhesive in situ gels as nasal drug delivery systems: An overview. Asian J. Pharm. Sci. 2012, 7, 168–180. [Google Scholar]
- Upadhyay, S.; Parikh, A.; Joshi, P.; Upadhyay, U.M.; Chotai, N.P. Intranasal drug delivery system-A glimpse to become maestro. J. Appl. Pharm. Sci. 2011, 1, 34–44. [Google Scholar]
- Krauland, A.H.; Guggi, D.; Bernkop-Schnürch, A. Thiolated chitosan microparticles: A vehicle for nasal peptide drug delivery. Int. J. Pharm. 2006, 307, 270–277. [Google Scholar] [CrossRef] [PubMed]
- Rassu, G.; Ferraro, L.; Pavan, B.; Giunchedi, P.; Gavini, E.; Dalpiaz, A. The role of combined penetration enhancers in nasal microspheres on in vivo drug bioavailability. Pharmaceutics 2018, 10, 206. [Google Scholar] [CrossRef] [PubMed]
- Chen, W.; Lu, Z.; Viljoen, A.; Hamman, J. Intestinal drug transport enhancement by Aloe vera. Planta Med. 2009, 75, 587–595. [Google Scholar] [CrossRef] [PubMed]
- Beneke, C.; Viljoen, A.; Hamman, J. In vitro drug absorption enhancement effects of Aloe vera and Aloe ferox. Sci. Pharm. 2012, 80, 475–486. [Google Scholar] [CrossRef]
- Ojewole, E.; Mackraj, I.; Akhundov, K.; Hamman, J.; Viljoen, A.; Olivier, E.; Govender, T. Investigating the effect of Aloe vera gel on the buccal permeability of didanosine. Planta Med. 2012, 78, 354–361. [Google Scholar] [CrossRef] [PubMed]
- Fox, L.T.; du Plessis, J.; Gerber, M.; van Zyl, S.; Boneschans, B.; Hamman, J.H. In vivo skin hydration and anti-erythema effects of Aloe vera, Aloe ferox and Aloe marlothii gel materials after single and multiple application. Pharmacogn. Mag. 2014, 10 (Suppl. S2), S392–S403. [Google Scholar] [PubMed]
- Gerber, W.; Steyn, J.D.; Kotzé, A.F.; Svitina, H.; Weldon, C.; Hamman, J.H. Permeation enhancement effects of leaf materials from different aloe species on in vitro and ex vivo nasal epithelial models. J. HerbMed Pharmacol. 2020, 9, 355–365. [Google Scholar] [CrossRef]
- Bamrungsap, S.; Zhao, Z.; Chen, T.; Wang, L.; Li, C.; Fu, T.; Tan, W. Nanotechnology in therapeutics: A focus on nanoparticles as a drug delivery system. Nanomedicine 2012, 7, 1253–1271. [Google Scholar] [CrossRef] [PubMed]
- Shinde, N.C.; Keskar, N.J.; Argade, P.D. Nanoparticles: Advances in drug delivery systems. Res. J. Pharm. Biol. Chem. Sci. 2012, 3, 922–930. [Google Scholar]
- Cetin, M.; Atila, A.; Kadioglu, Y. Formulation and in vitro characterization of Eudragit® L100 and Eudragit® L100-PLGA nanoparticles containing diclofenac sodium. AAPS PharmSciTech 2010, 11, 1250–1256. [Google Scholar] [CrossRef] [PubMed]
- Patra, C.N.; Priya, R.; Swain, S.; Kumar, J.G.; Panigrahi, K.C.; Ghose, D. Pharmaceutical significance of Eudragit: A review. Future J. Pharm. Sci. 2017, 138, 87–95. [Google Scholar] [CrossRef]
- Deutel, B.; Laffleur, F.; Palmberger, T.; Saxer, A.; Thaler, M.; Bernkop-Schnürch, A. In vitro characterization of insulin containing thiomeric microparticles as nasal drug delivery system. Eur. J. Pharm. Sci. 2016, 81, 157–161. [Google Scholar] [CrossRef] [PubMed]
- British Pharmacopoeia Commission. Monographs. British Pharmacopoeia. Available online: https://www.pharmacopoeia.com/bp-2022/monographs (accessed on 8 May 2022).
- ICH. International Council for Harmonisation of Technical Requirements for Pharmaceuticals for Human Use Guidelines. Available online: https://www.ich.org/page/quality-guidelines (accessed on 8 May 2022).
- Singh, R. HPLC method development and validation- and overview. J. Pharm. Educ. Res. 2013, 4, 26–33. [Google Scholar]
- Lister, A.S. Validation of HPLC methods in pharmaceutical analysis. In Separation Science and Technology; Academic Press: Cambridge, MA, USA, 2005; Volume 6, pp. 191–217. [Google Scholar]
- Marais, E.; Hamman, J.; du Plessis, L.; Lemmer, R.; Steenekamp, J. Eudragit® L100/N-trimethylchitosan chloride microspheres for oral insulin delivery. Molecules 2013, 18, 6734–6747. [Google Scholar] [CrossRef] [PubMed]
- Rozehnal, V.; Nakai, D.; Hoepner, U.; Fischer, T.; Kamiyama, E.; Takahashi, M.; Mueller, J. Human small intestinal and colonic tissue mounted in the using chamber as a tool for characterizing the intestinal absorption of drugs. Eur. J. Pharm. Sci. 2012, 46, 367–373. [Google Scholar] [CrossRef]
- Hellum, B.H.; Nilsen, O.G. In vitro inhibition of CYP3A4 metabolism and p-glycoprotien-mediated transport by trade herbal products. Basic Clin. Pharmacol. Toxicol. 2008, 102, 466–475. [Google Scholar] [CrossRef] [PubMed]
- Dag, O.; Dolgun, A.; Konar, N.M. onewaytests: An R Package for One-Way Tests in Independent Groups Designs. R J. 2018, 10, 175–199. [Google Scholar] [CrossRef]
- Wickham, H.; Averick, M.; Bryan, J.; Chang, W.; McGowan, L.D.; François, R.; Yutani, H. Welcome to the tidyverse. J. Open Source Softw. 2019, 4, 1686–1692. [Google Scholar] [CrossRef]
- Govoreanu, R.; Saveyn, H.; Van der Meeren, P.; Nopens, I.; Vanrolleghem, P.A. A methodological approach for direct quantification of the activated sludge floc size distribution by using different techniques. Water Sci. Technol. 2009, 60, 1857–1867. [Google Scholar] [CrossRef]
- De Bruyn, S.; Willers, C.; Steyn, D.; Steenekamp, J.; Hamman, J. Development and evaluation of a double phase multiple unit dosage form for enhanced insulin intestinal delivery. Drug Deliv. Lett. 2018, 8, 52–60. [Google Scholar] [CrossRef]
- Abdulkareem, R.A. Cloning and expression of recombinant human insulin gene in pichia pastoris. Int. J. Pharm. Qual. Assur. 2019, 10, 136–141. [Google Scholar] [CrossRef]
- Massaro, M.; Cavallaro, G.; Colletti, C.G.; D’Azzo, G.; Guernelli, S.; Lazzara, G.; Riela, S. Halloysite nanotubes for efficient loading, stabilization and controlled release of insulin. J. Colloid Interface Sci. 2018, 574, 156–164. [Google Scholar] [CrossRef]
- Lebitsa, T.; Viljoen, A.; Lu, Z.; Hamman, J. In vitro permeation enhancement potential of aloe gel materials. Curr. Drug Deliv. 2012, 9, 297–304. [Google Scholar] [CrossRef] [PubMed]
- Brayden, D.J.; Maher, S.; Bahar, B.; Walsh, E. Sodium caprate-induced increases in intestinal permeability and epithelial damage are prevented by misoprostol. Eur. J. Pharm. Biopharm. 2015, 94, 194–206. [Google Scholar] [CrossRef] [PubMed]
- Patil, S.B.; Kaul, A.; Babbar, A.K.; Mathur, R. In vivo evaluation of alginate microspheres of carvedilol for nasal delivery. J. Biomed. Mater. Res. Part B Appl. Biomater. 2012, 100, 249–255. [Google Scholar] [CrossRef] [PubMed]


Disclaimer/Publisher’s Note: The statements, opinions and data contained in all publications are solely those of the individual author(s) and contributor(s) and not of MDPI and/or the editor(s). MDPI and/or the editor(s) disclaim responsibility for any injury to people or property resulting from any ideas, methods, instructions or products referred to in the content. |
© 2023 by the authors. Licensee MDPI, Basel, Switzerland. This article is an open access article distributed under the terms and conditions of the Creative Commons Attribution (CC BY) license (https://creativecommons.org/licenses/by/4.0/).