Technical Note

Equivalent Stress Intensity Factor: The Consequences of the Lack of a Unique Definition

by
Sérgio M. O. Tavares
1,2 and
Paulo M. S. T. de Castro
3,*
1
TEMA—Centre for Mechanical Technology and Automation, Department of Mechanical Engineering, University of Aveiro, 3810-193 Aveiro, Portugal
2
LASI—Intelligent Systems Associate Laboratory, 4800-058 Guimaraes, Portugal
3
Faculdade de Engenharia, Universidade do Porto, Rua Dr. Roberto Frias, 4200-465 Porto, Portugal
*
Author to whom correspondence should be addressed.
Appl. Sci. 2023, 13(8), 4820; https://doi.org/10.3390/app13084820
Submission received: 6 March 2023 / Revised: 5 April 2023 / Accepted: 10 April 2023 / Published: 12 April 2023
(This article belongs to the Special Issue Fracture Mechanics: From Theory to Applications)

Abstract

:
The concept of an equivalent stress intensity factor Keq is used in the study of fatigue crack growth in mixed-mode situations. A problem seldom discussed in the research literature are the consequences of the coexistence of several alternative definitions of mixed mode Keq, leading to rather different results associated with the alternative Keq definitions. This note highlights the problem, considering several Keq definitions hitherto not analyzed simultaneously. Values of Keq calculated according to several criteria were compared through the determination of Keq/KI over a wide range of values of KI/KII or KII/KI. In earlier work on Al alloy AA6082 T6, the fatigue crack path and growth rate were measured in 4-point bend specimens subjected to asymmetrical loading and in compact tension specimens modified with holes. The presentation of the fatigue crack growth data was made using a Paris law based on Keq. Important differences are found in the Paris laws, corresponding to the alternative definitions of Keq considered, and the requirements for candidate Keq definitions are discussed. A perspective for overcoming the shortcomings may consist in developing a data-driven modelling methodology, supported by material characterization and structure monitoring during its life cycle.

1. Introduction

The application of Fracture Mechanics to fatigue crack growth phenomena seeks two main goals: i—to quantitatively characterize a material as regards crack growth (path, rate, etc.); and ii—to model fatigue crack propagation in real structural components, starting from existing or assumed cracks that progress under a cyclic load until reaching a larger size or final rupture.
The first goal involves measuring the crack growth rate, path and other relevant properties as the crack grows under diverse loading conditions, including the stress ratio, eventually mixed mode, and environmental effects, such as corrosion, aging and thermal effects. By understanding how cracks propagate in different materials and under different conditions, more accurate models for predicting the life of structural components subject to fatigue can be developed and employed to design and assess structural behavior.
The second goal aims to model and evaluate the propagation of cracks in real structural components. This involves starting with either existing or assumed cracks or microcracks, and modelling their growth under cyclic loading until a given size or final rupture is reached. This type of modelling is critical for assessing the safety and reliability of components subject to fatigue conditions, as it allows one to predict the component’s behavior over time under different loading conditions and to design and maintain safety-critical structures—such as aeronautical or nuclear structures—with a high reliability. Many specialized treatises present the relevant methodologies, e.g., [1,2].
Fatigue crack growth (FCG) modelling relies upon relationships between the fatigue crack growth rate and stress intensity factor K, as in the Paris law applied to mode I situations [3]:
d a d N = C Δ K I m
where a is the crack length, N is the number of cycles, and the empirical constants C and m depend upon the material and particular testing conditions, e.g., load ratio R (R = Kmin/Kmax). Following the findings of Paris [4], it has been noted that ‘Fracture Mechanics approach applied to life prediction has often been misused, or has ignored obvious characteristics which effect the precision and relevance of the predictions’. This warning might be taken into account in mixed-mode situations, where instead of the mode I stress intensity factor KI, the concept of equivalent stress intensity factor Keq is commonly used, and the Paris law is rewritten as:
d a d N = C Δ K e q m
where the constants C and m are generally different from those relevant for mode I.
Several alternative definitions of mixed mode Keq coexist, raising the question of what the consequences of that variety of definitions are—are the consequences noteworthy, or are they negligible? An alternative way of formulating the research question is: in the general KI, KII domain, how do different definitions of Keq compare?
This note considers a number of Keq definitions hitherto not analyzed simultaneously. Experimental and modelling aspects of the mixed-mode-I-II fatigue crack growth problem are revisited, and the values of Keq according to several criteria were compared through the determination of Keq/KI over a wide range of KI/KII or KII/KI values.
Mixed-mode situations are found in planar geometries, e.g., biaxially loaded plates, asymmetrically loaded 3- or 4-point bending specimens, or cylindrical specimens subjected to torsion combined with uniaxial tensile or compressive loading. This note concentrates on planar specimens, with crack path predictions based on 2D finite element method (FEM) analysis and a consideration of KI and KII in the frame of suitable Keq criteria.
Experimental FCG results were available for Al alloy AA6082 T6 [5,6]. Four-point bend specimens subjected to asymmetrical loading and compact tension (CT) specimens modified with holes were subjected to fatigue crack growth tests, where the fatigue crack path and fatigue crack growth rate were measured. The presentation of the FCG data was made using a Paris law based upon Keq, and the tests were modelled using the extended finite element method (XFEM) implemented in ABAQUS [7]. The present note builds upon that earlier work, expanding the number of Keq definitions considered and quantifying the important differences found in the Paris laws corresponding to the alternative definitions of Keq. While considering a wide range of mixity values, it was found that seven different definitions for Keq led to different results. A data-driven modelling methodology (see e.g., [8]) is suggested as a perspective to overcome this unsatisfactory situation, following encouraging applications to mode I FCG, e.g., [9,10,11,12].

2. The Equivalent Stress Intensity Factor Keq

Several approaches are available to define the equivalent stress intensity factor Keq for a mixed-mode-I–II situation. For a given situation characterized by the pair KI, KII, the proposed equations for the calculation of Keq provide different values; the question of how different Keq values compare may be relevant in engineering practice and is not readily apparent from a quick perusal of the relevant equations.
With the support of Matlab scripting, a systematic comparison of the various approaches for calculating Keq was performed and led to graphical presentations of Keq/KI vs. KI/KII or KII/KI. The literature sources for definitions of Keq include research involving monotonic and fatigue loading. In the context of monotonic loading and unstable crack propagation, Keq = f(KI, KII) = KIc. In the context of FCG, the stress intensity factor range ΔKeq is used. In both cases (unstable crack propagation or fatigue crack propagation), the concept of Keq plays the same role of substituting one single value (Keq) for the original two (KI and KII).

2.1. Energy Approach

Irwin’s pioneering work [13] leads to the energy approach, Equation (3), where self-similar crack propagation is assumed (see e.g., [14,15,16,17,18]). This equation is found to be written as a function of the strain energy release rate G, e.g., [6,16], or of the J integral, e.g., [9,19]:
K e q = K I 2 + K I I 2 1 2

2.2. Tanaka’s Approach

Tanaka [20] proposed a definition used or mentioned, e.g., in [15,21,22,23]:
K e q = K I 4 + 8 K I I 4 1 4
Tanaka assumes that FCG occurs when a critical displacement value is attained in a plastic strip. For mixed-mode situations, no interaction between mode I and mode II deformations is assumed.

2.3. Lardner’s Approach

Lardner’s contribution concerns the use of dislocation theory to assess fatigue crack growth [24]. As discussed by Tanaka [20], a first Lardner approach (given by Equation (24) of reference [20]) is:
K e q = K I 2 + 2 K I I 2 1 2
Tanaka [20] also discusses a different interpretation of Lardner’s results, (in the following called Lardner B, given by Equation (25) of reference [20]):
K e q = K I 4 + 4 K I I 4 1 4

2.4. Chen and Keer Approach

FCG was related to the accumulated crack opening and sliding plastic displacements by Chen and Keer. Their approach was originally presented in [25] and is used, e.g., in [21] or [22]:
K e q = K I 2 + 3 K I I 2 3 K I 2 + K I I 2 1 8

2.5. Pook’s Approach

As presented, e.g., in [26], Pook proposes the empirical relation:
K e q = 0.83 K I + 0.4489 K I 2 + 3 K I I 2 1 2 1.5

2.6. Demir’s Approach

For the ranges of the KI and KII values considered [27,28], the following empirical equation was found suitable for CTS (compact tension shear specimen) and for a new type of specimen, labelled T-specimen:
K e q = 1.0519 K I 4 0.035 K I I 4 + 2.3056 K I 2 K I I 2 1 2

2.7. Richard/Henn Approach
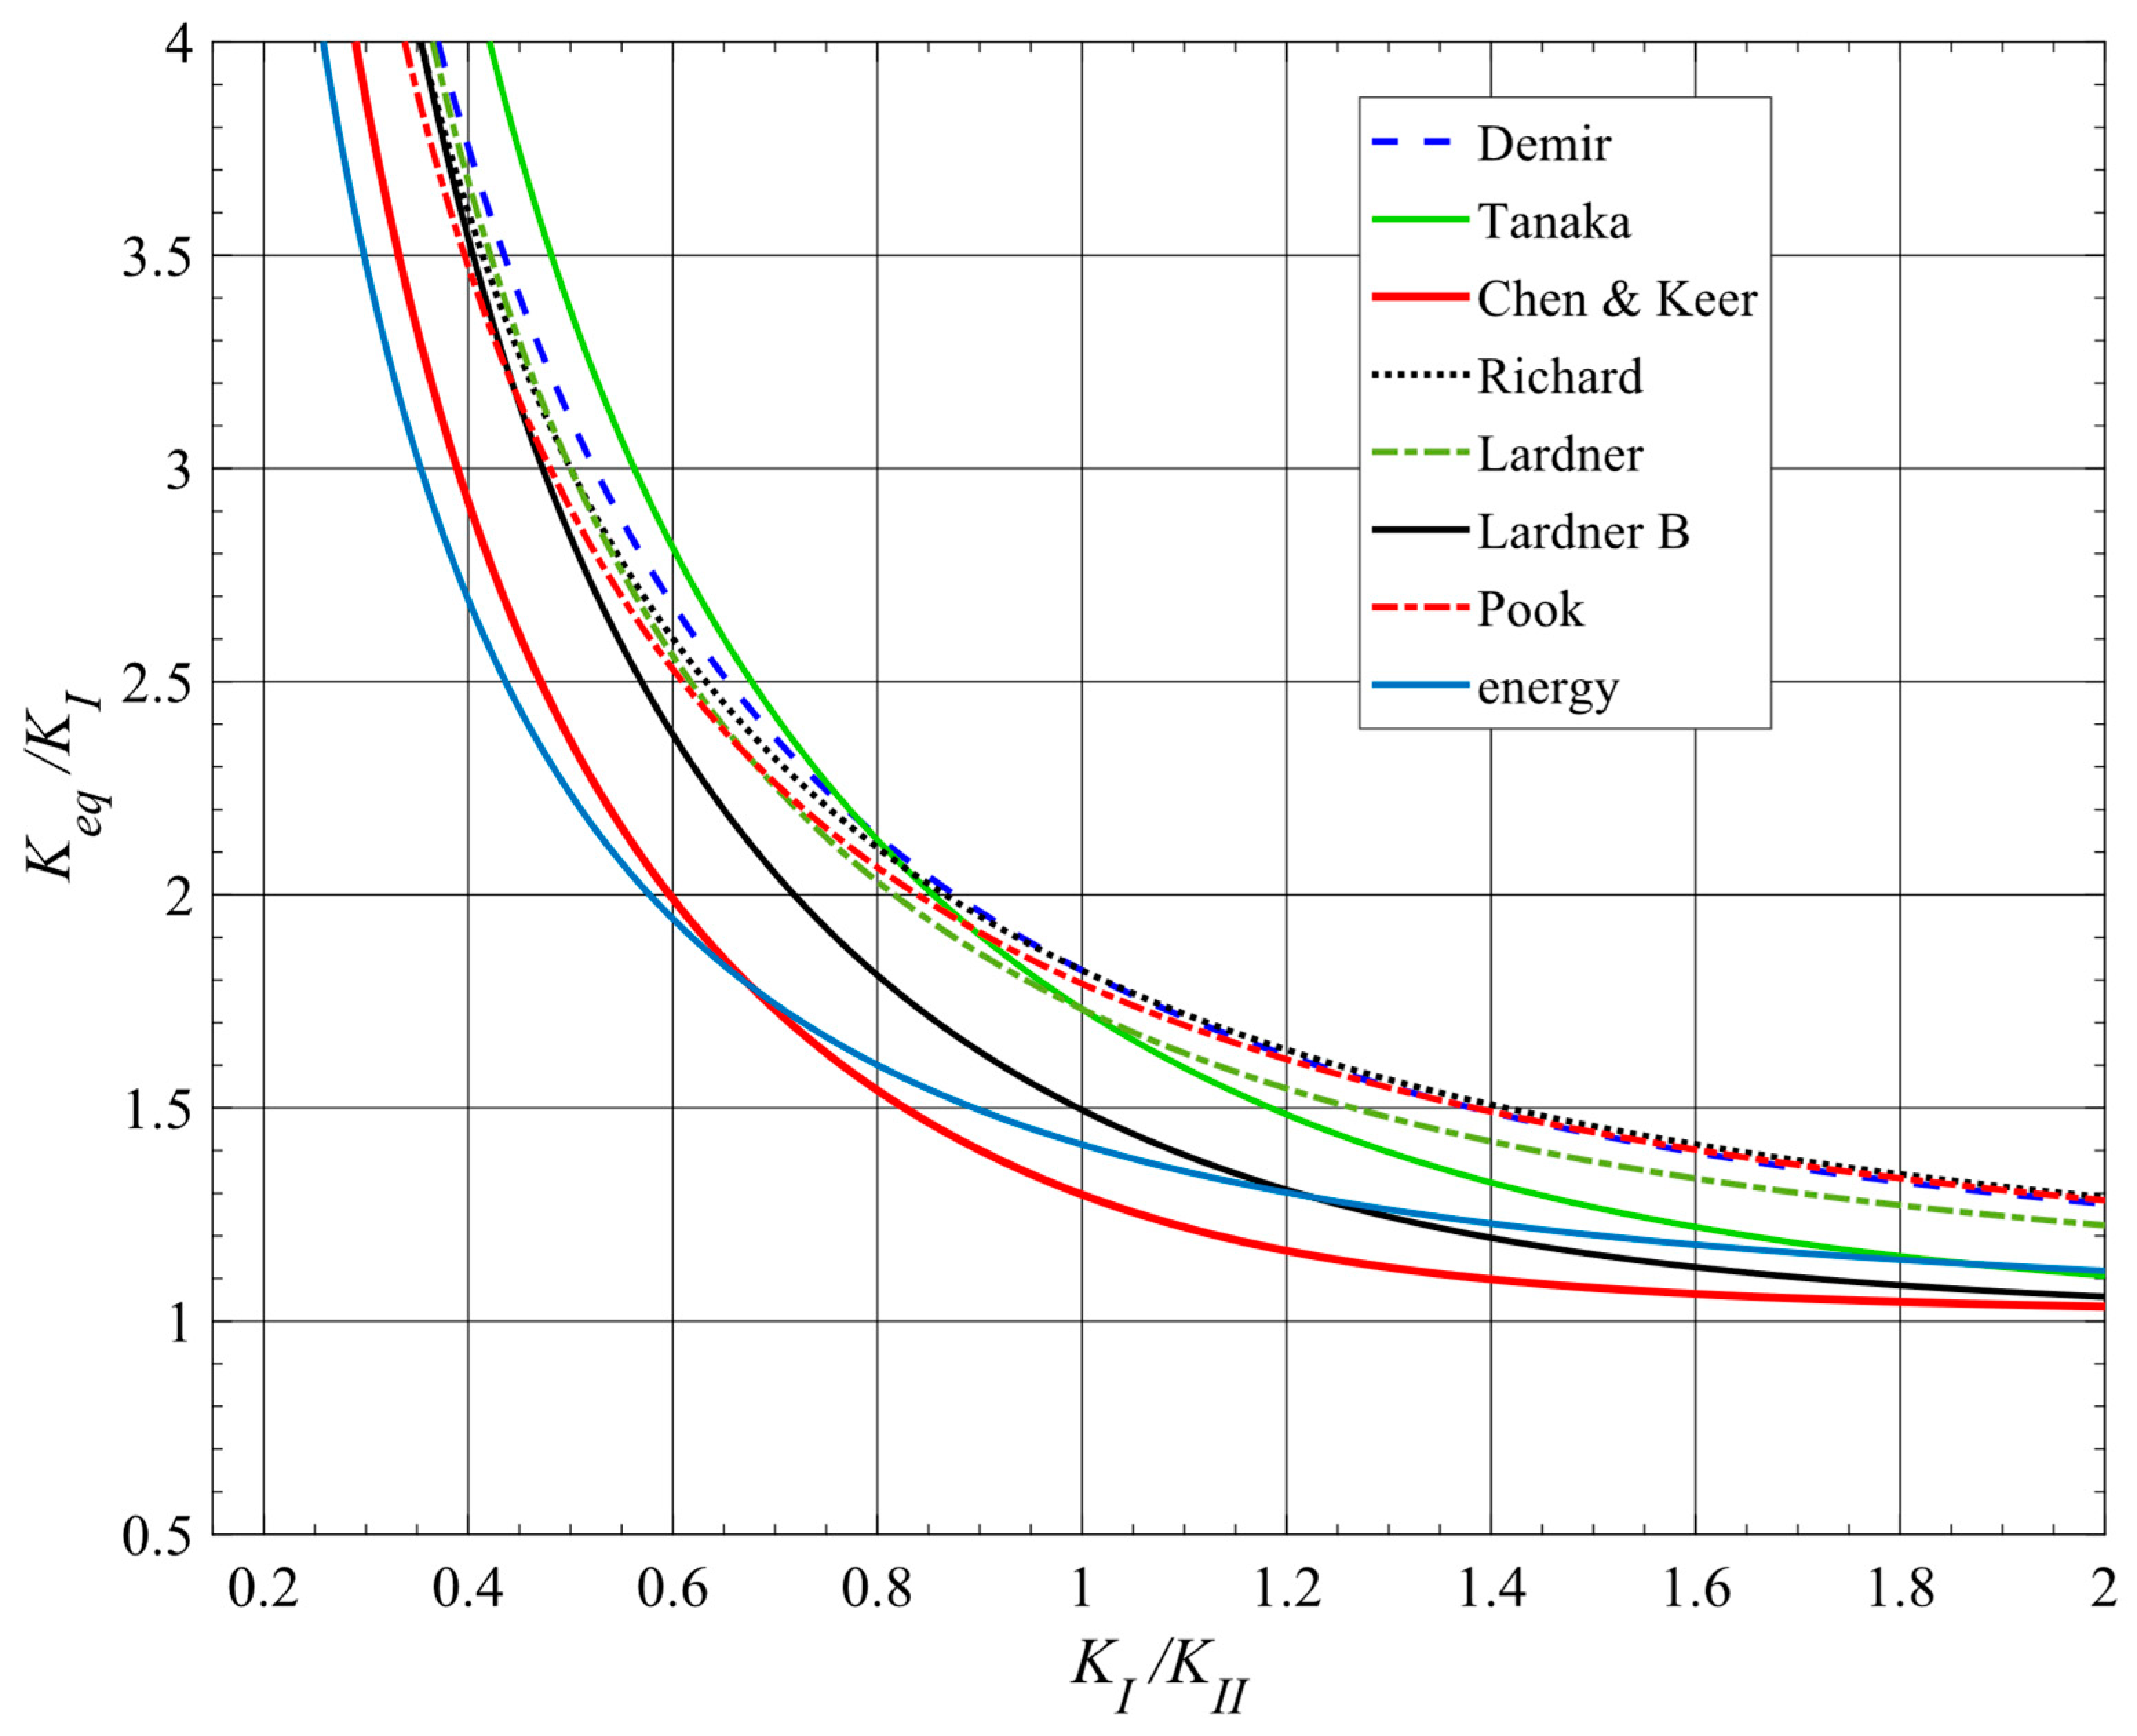
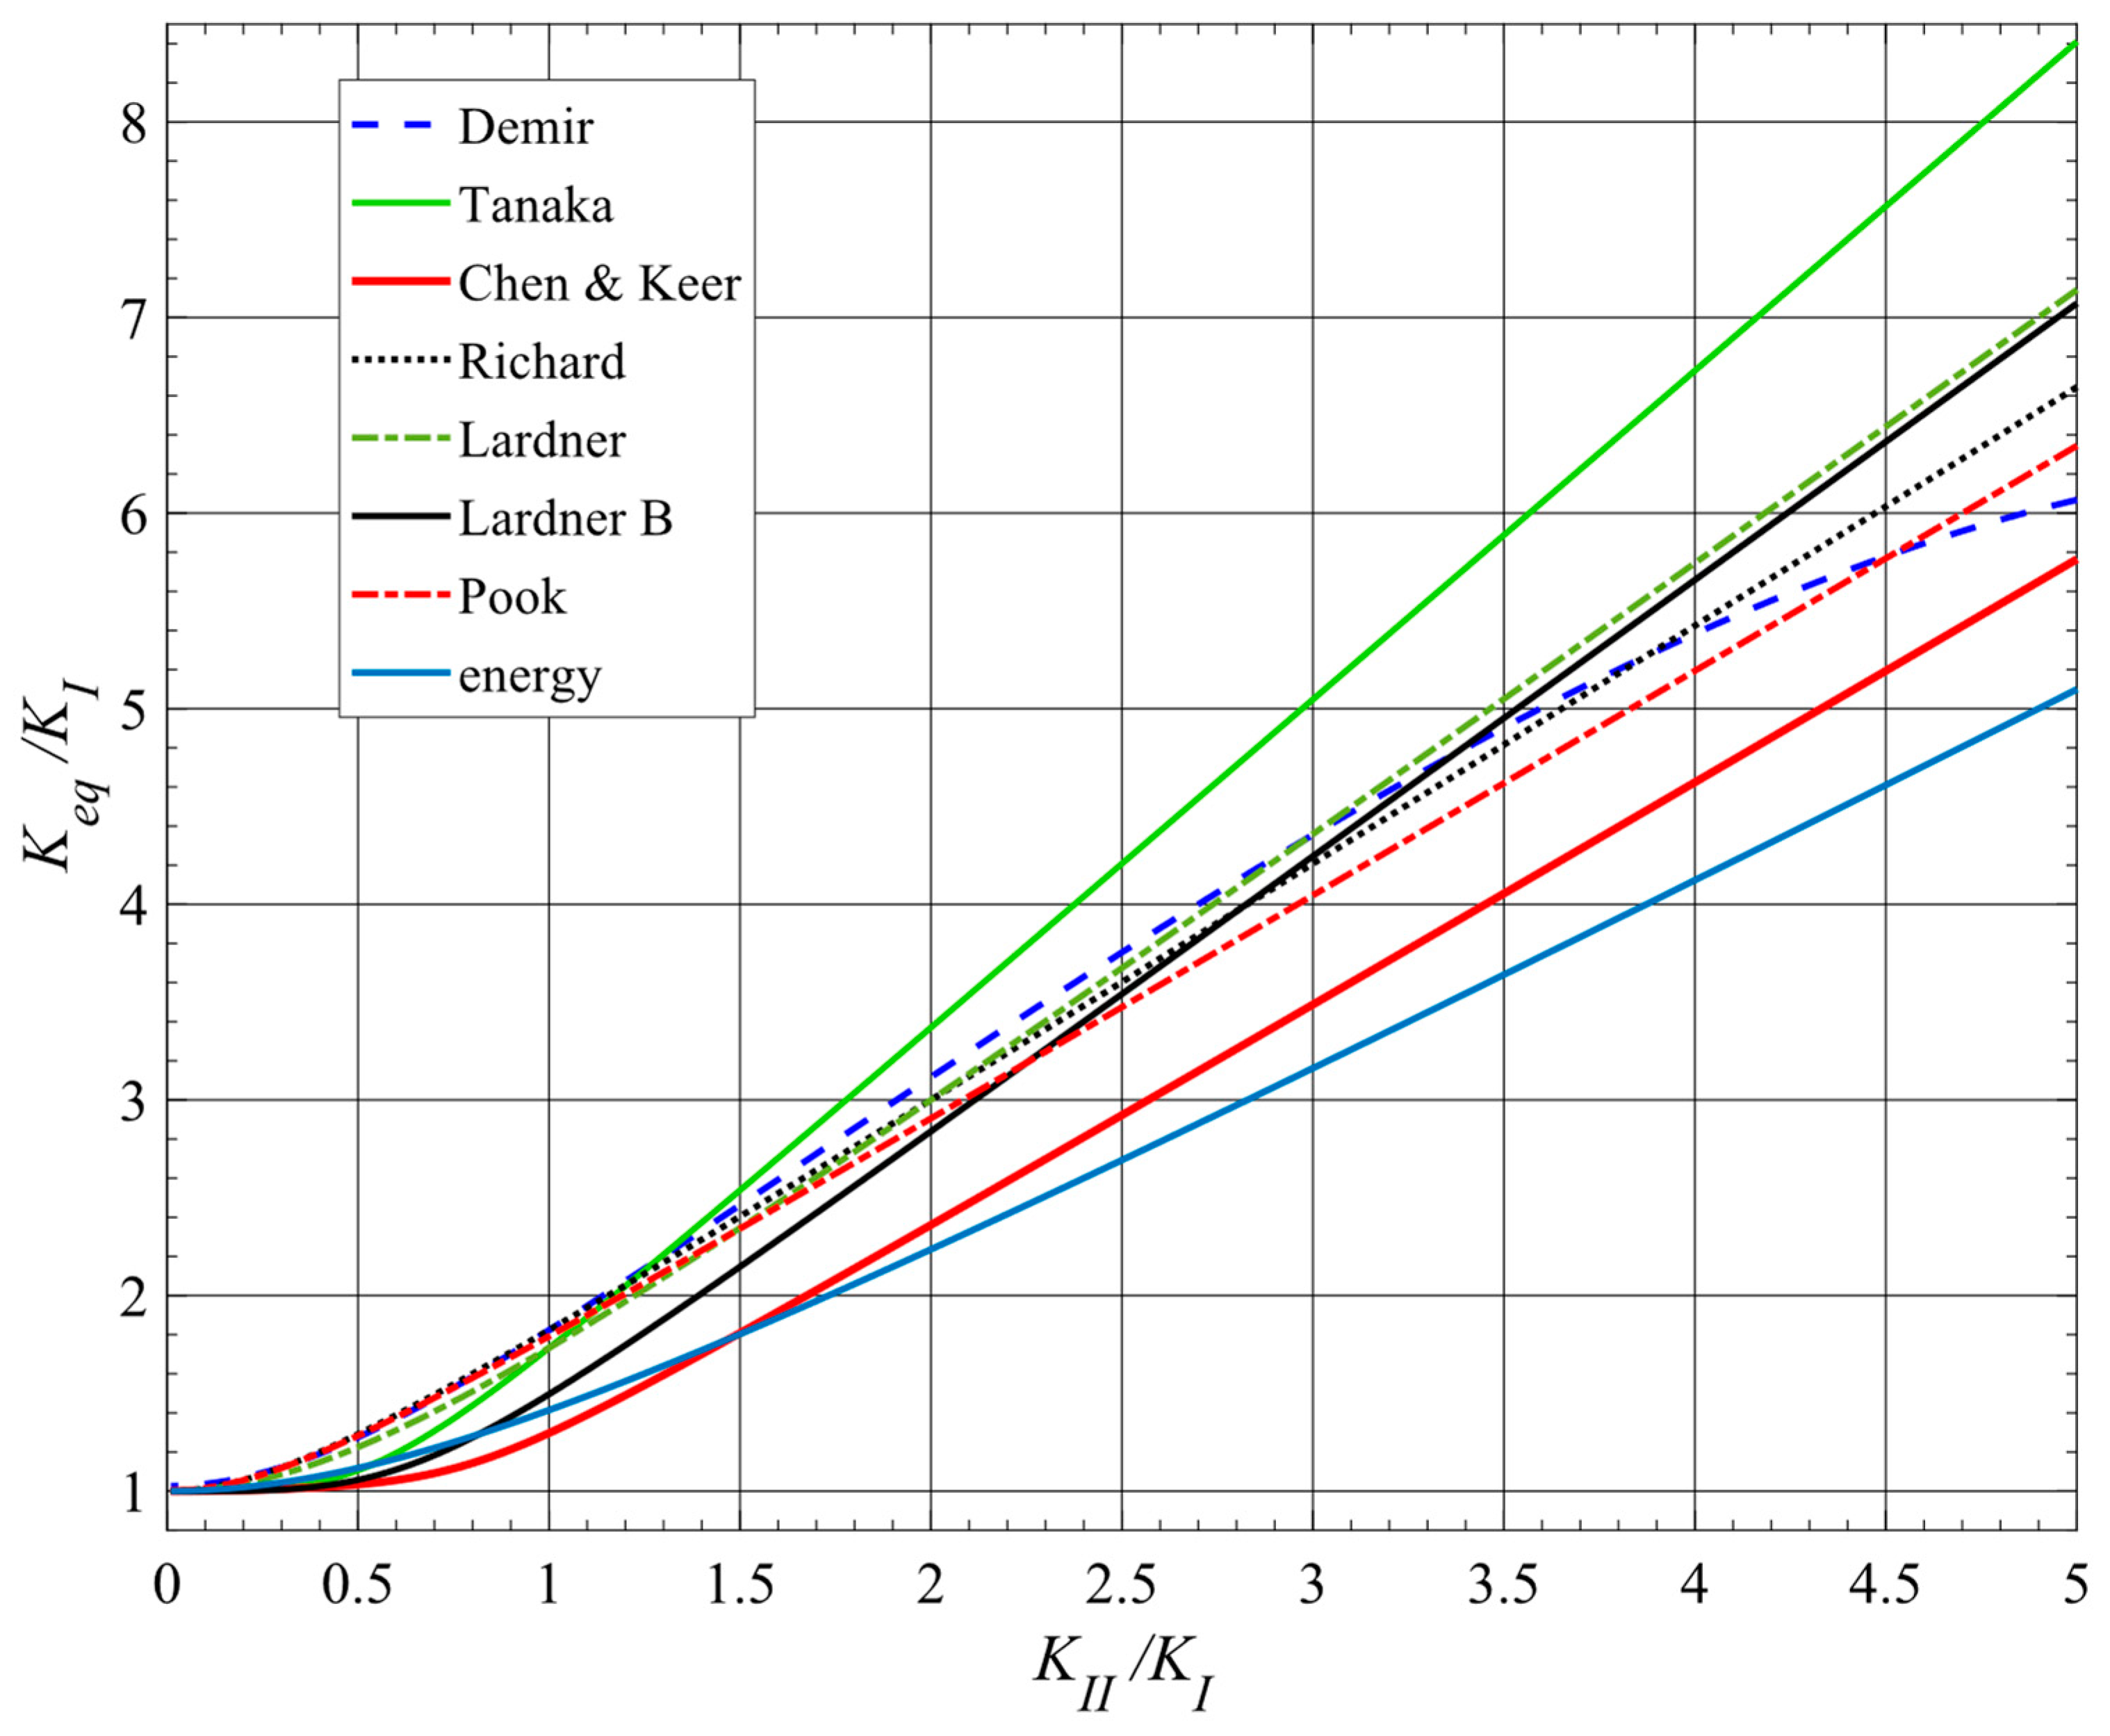
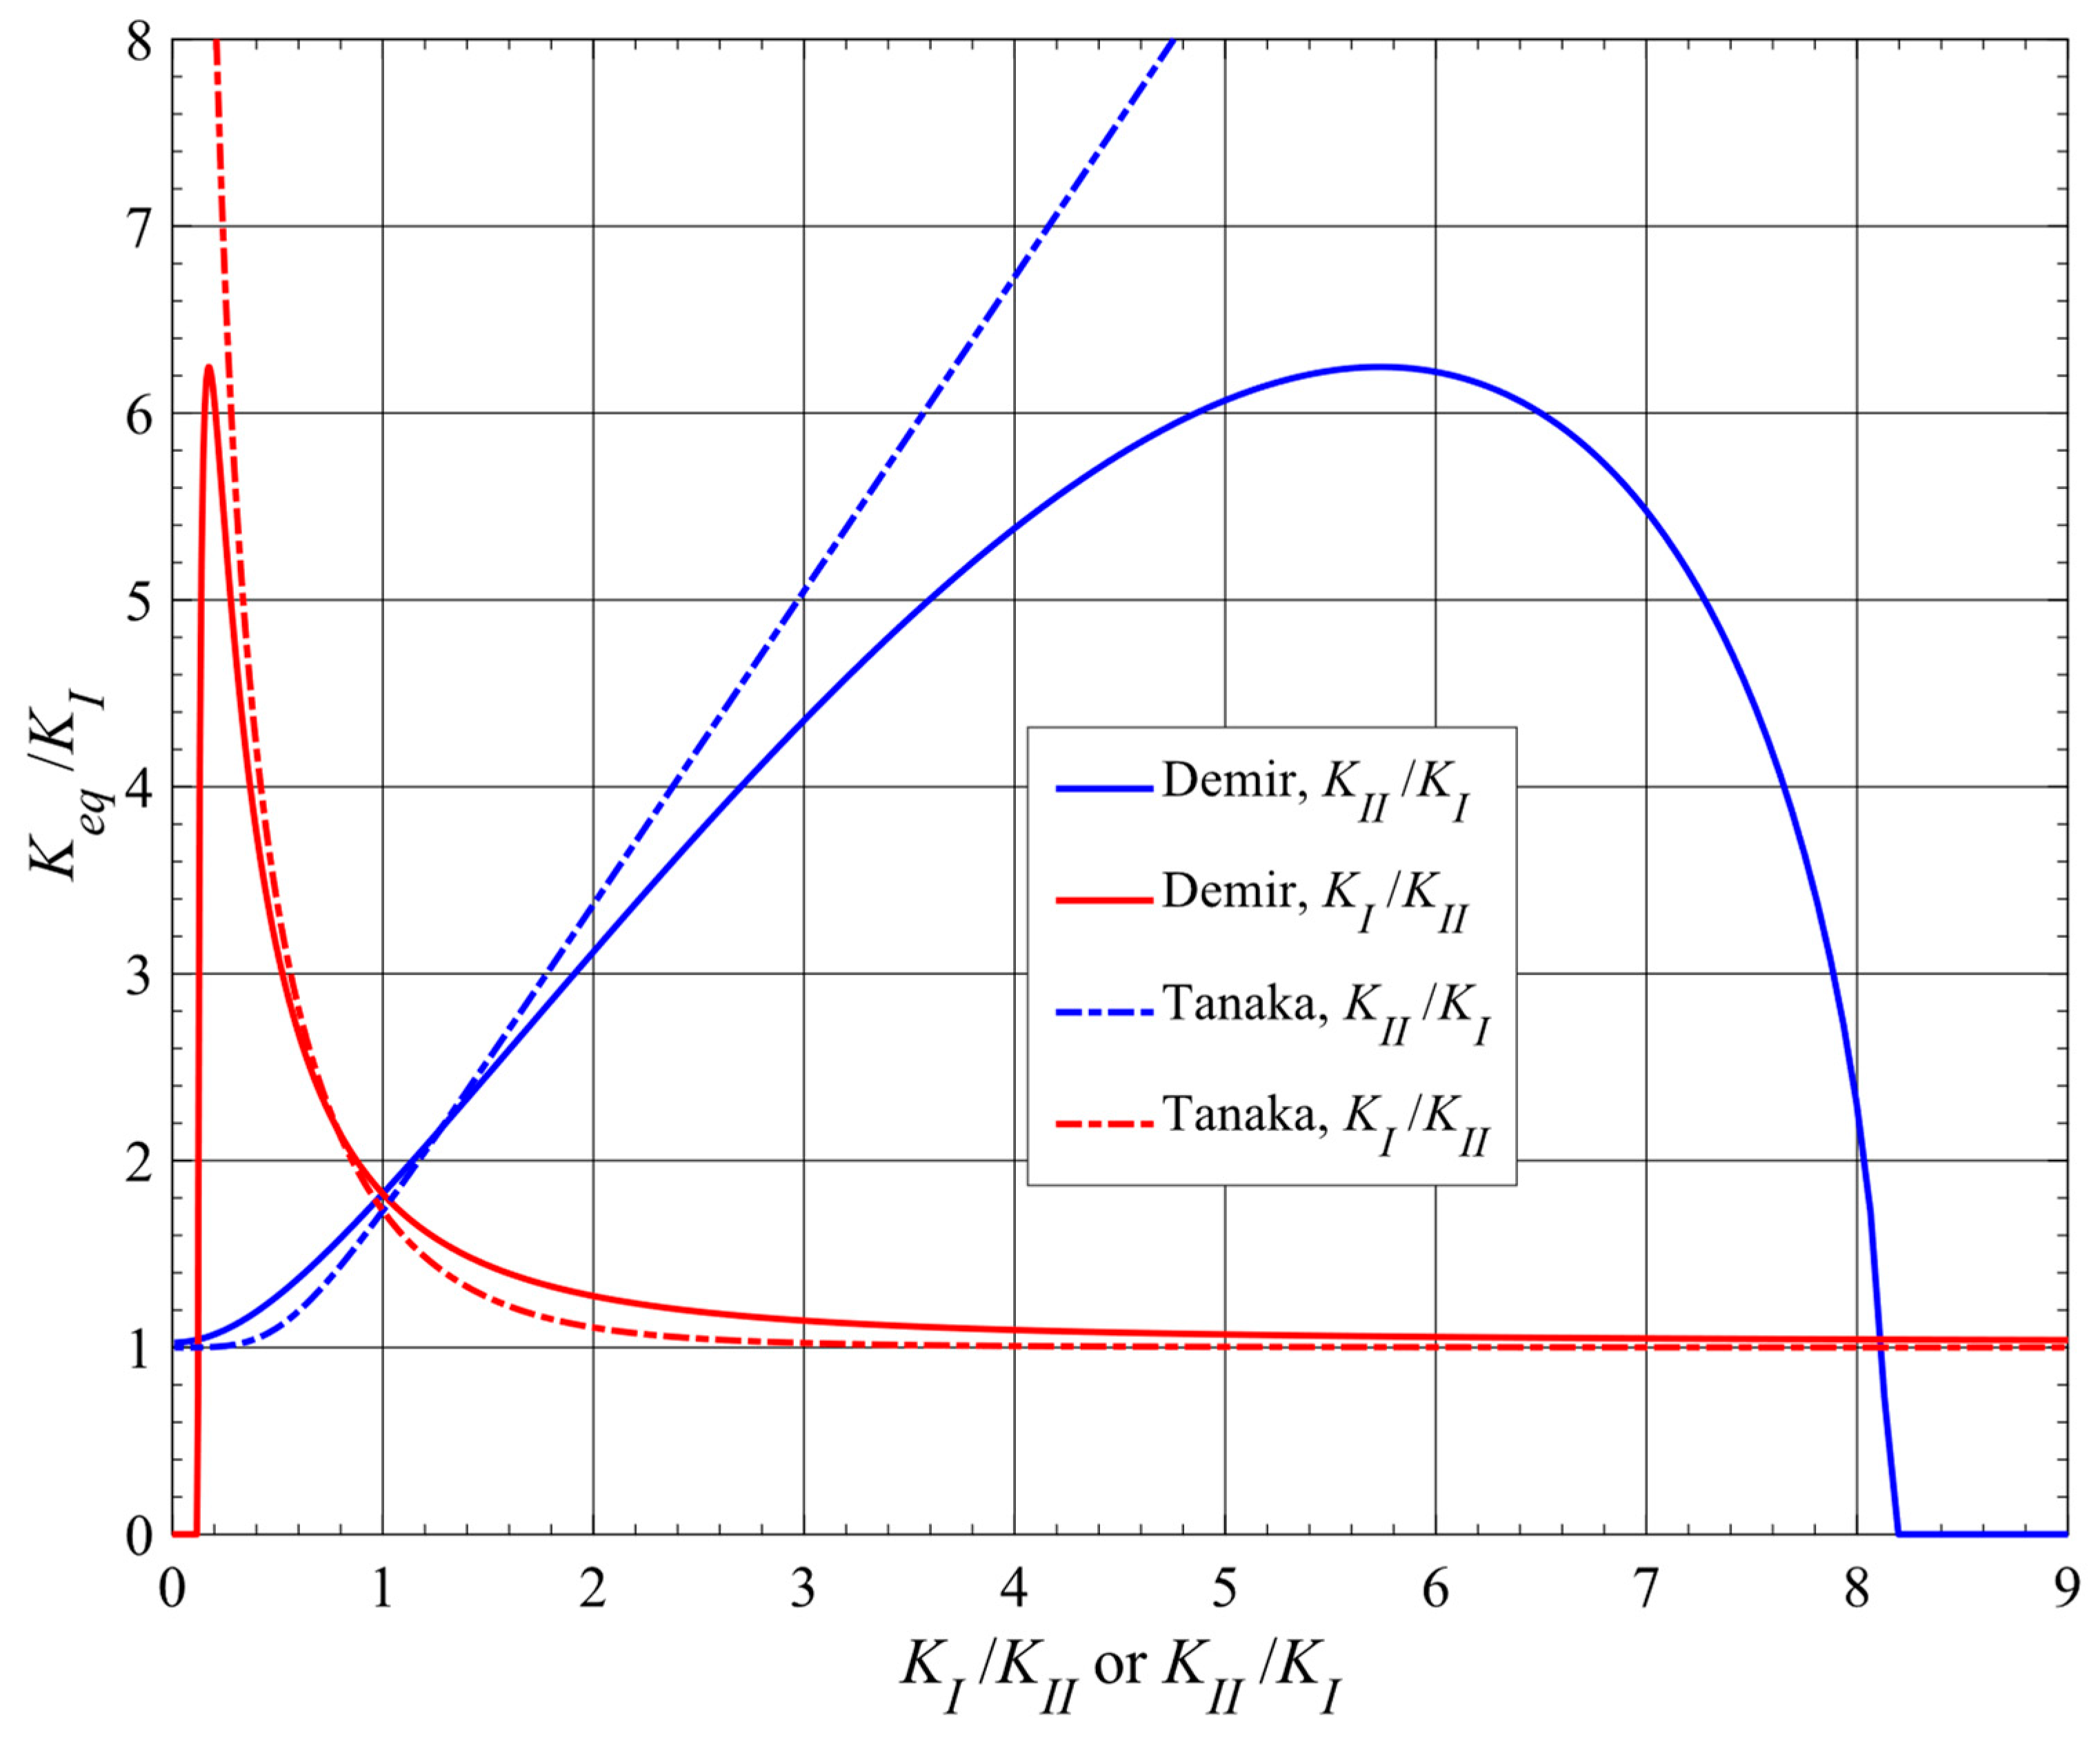
According to Richard [29]:
K e q = K I 2 + 1 2 K I 2 + 6 K I I 2 1 2
Equation (10) is designated the Richard/Henn approach in [30] and is found, e.g., in [31,32,33]. This was originally presented as a function of the mode I/mode II ratio of fracture toughness α1:
K e q = K I 2 + 1 2 K I 2 + 4 α 1 K I I 2 1 2   ;   α I = K I c K I I c
The formulation of Equation (11), proposed in [34], is found in [23,35,36,37] and generalized in [36,38] to include KIII. Using the value α1 = 1.155, Richard et al. also propose, as a good approximation:
K e q = K I 2 + 1 2 K I 2 + 5.336 K I I 2 1 2
See, e.g., [39,40,41].
There are, however, other definitions of the equivalent stress intensity factor for mixed-mode situations, including expressions where parameters are fitted to the experimental data, e.g., [42]. The selection presented above, however, is deemed sufficient to check the consequences of diversity, as follows.

3. Comparisons

For the purpose of a comparison, Keq/KI was plotted as a function of KI/KII and of KII/KI. Equation (10) was adopted as representative of the Richard approach, and the previous Equations (3)–(10) were rewritten as follows:
Energy:
K e q K I = 1 + K I I K I 2 1 2
Tanaka:
K e q K I = 1 + 8 K I I K I 4 1 4
Lardner:
K e q K I = 1 + 2 K I I K I 2 1 2
Lardner B:
K e q K I = 1 + 4 K I I K I 4 1 4
Chen and Keer:
K e q K I = 1 + 3 K I I K I 2 3 1 + K I I K I 2 1 8
Pook:
K e q K I = 1 + 3 K I I K I 2 3 1 + K I I K I 2 1 8
Demir:
K e q K I = K I I K I 1.0519 K I K I I 2 0.035 K I I K I 2 + 2.3056 1 2
Richard:
K e q K I = 1 2 + 1 2 1 + 6 K I I K I 2 1 2
Figure 1 plots the non-dimensional Keq/KI as a function of KI/KII for the approaches considered, in a region KI/KII < 2. Figure 2 plots the non-dimensional Keq/KI as a function of KII/KI for the approaches considered, in the region KII/KI < 5.
Within the range of KI and KII values of Figure 1 and Figure 2, Demir’s approach [27,28] leads to Keq values that approximately follow the trend of other Keq approaches. Nevertheless, the format of Equation (19) and its resulting curve in Figure 2 raised an interest in analyzing its behavior over a wider range of KI and KII values. Notice that, unlike the others, Demir’s curve shows a noticeable decrease of the derivative as KII/KI increases. Indeed, Equation (19) shows Keq/KI = 0 for KI/KII = 0.178, which results from:
1.0519 K I K I I 2 0.035 K I I K I 2 + 2.3056 = 0 1.0519 K I K I I 2 0.035 K I K I I 2 + 2.3056 = 0
Discarding the complex region (square root of a negative number), Figure 3 shows Keq/KI as a function of KI/KII and of KII/KI. Clearly, Equation (19) does not apply to all domains of KI and KII; it presents zeroes for KI/KII = 0.178 and KII/KI = 8.144. Nevertheless, it follows the expected trend of the solution for KI/KII > ~0.4 and for KII/KI < ~4, as shown in Figure 3, where for comparison it is plotted together with Tanaka’s equation.
Two conditions that candidate definitions of Keq should satisfy are:
K e q / K I 1   for   K I / K I I K e q / K I   for   K I / K I I 0
Since the present analyses are concerned with solutions that are as general as possible, the Keq definition of Equations (9) and (19) was no longer used, given its limited application.

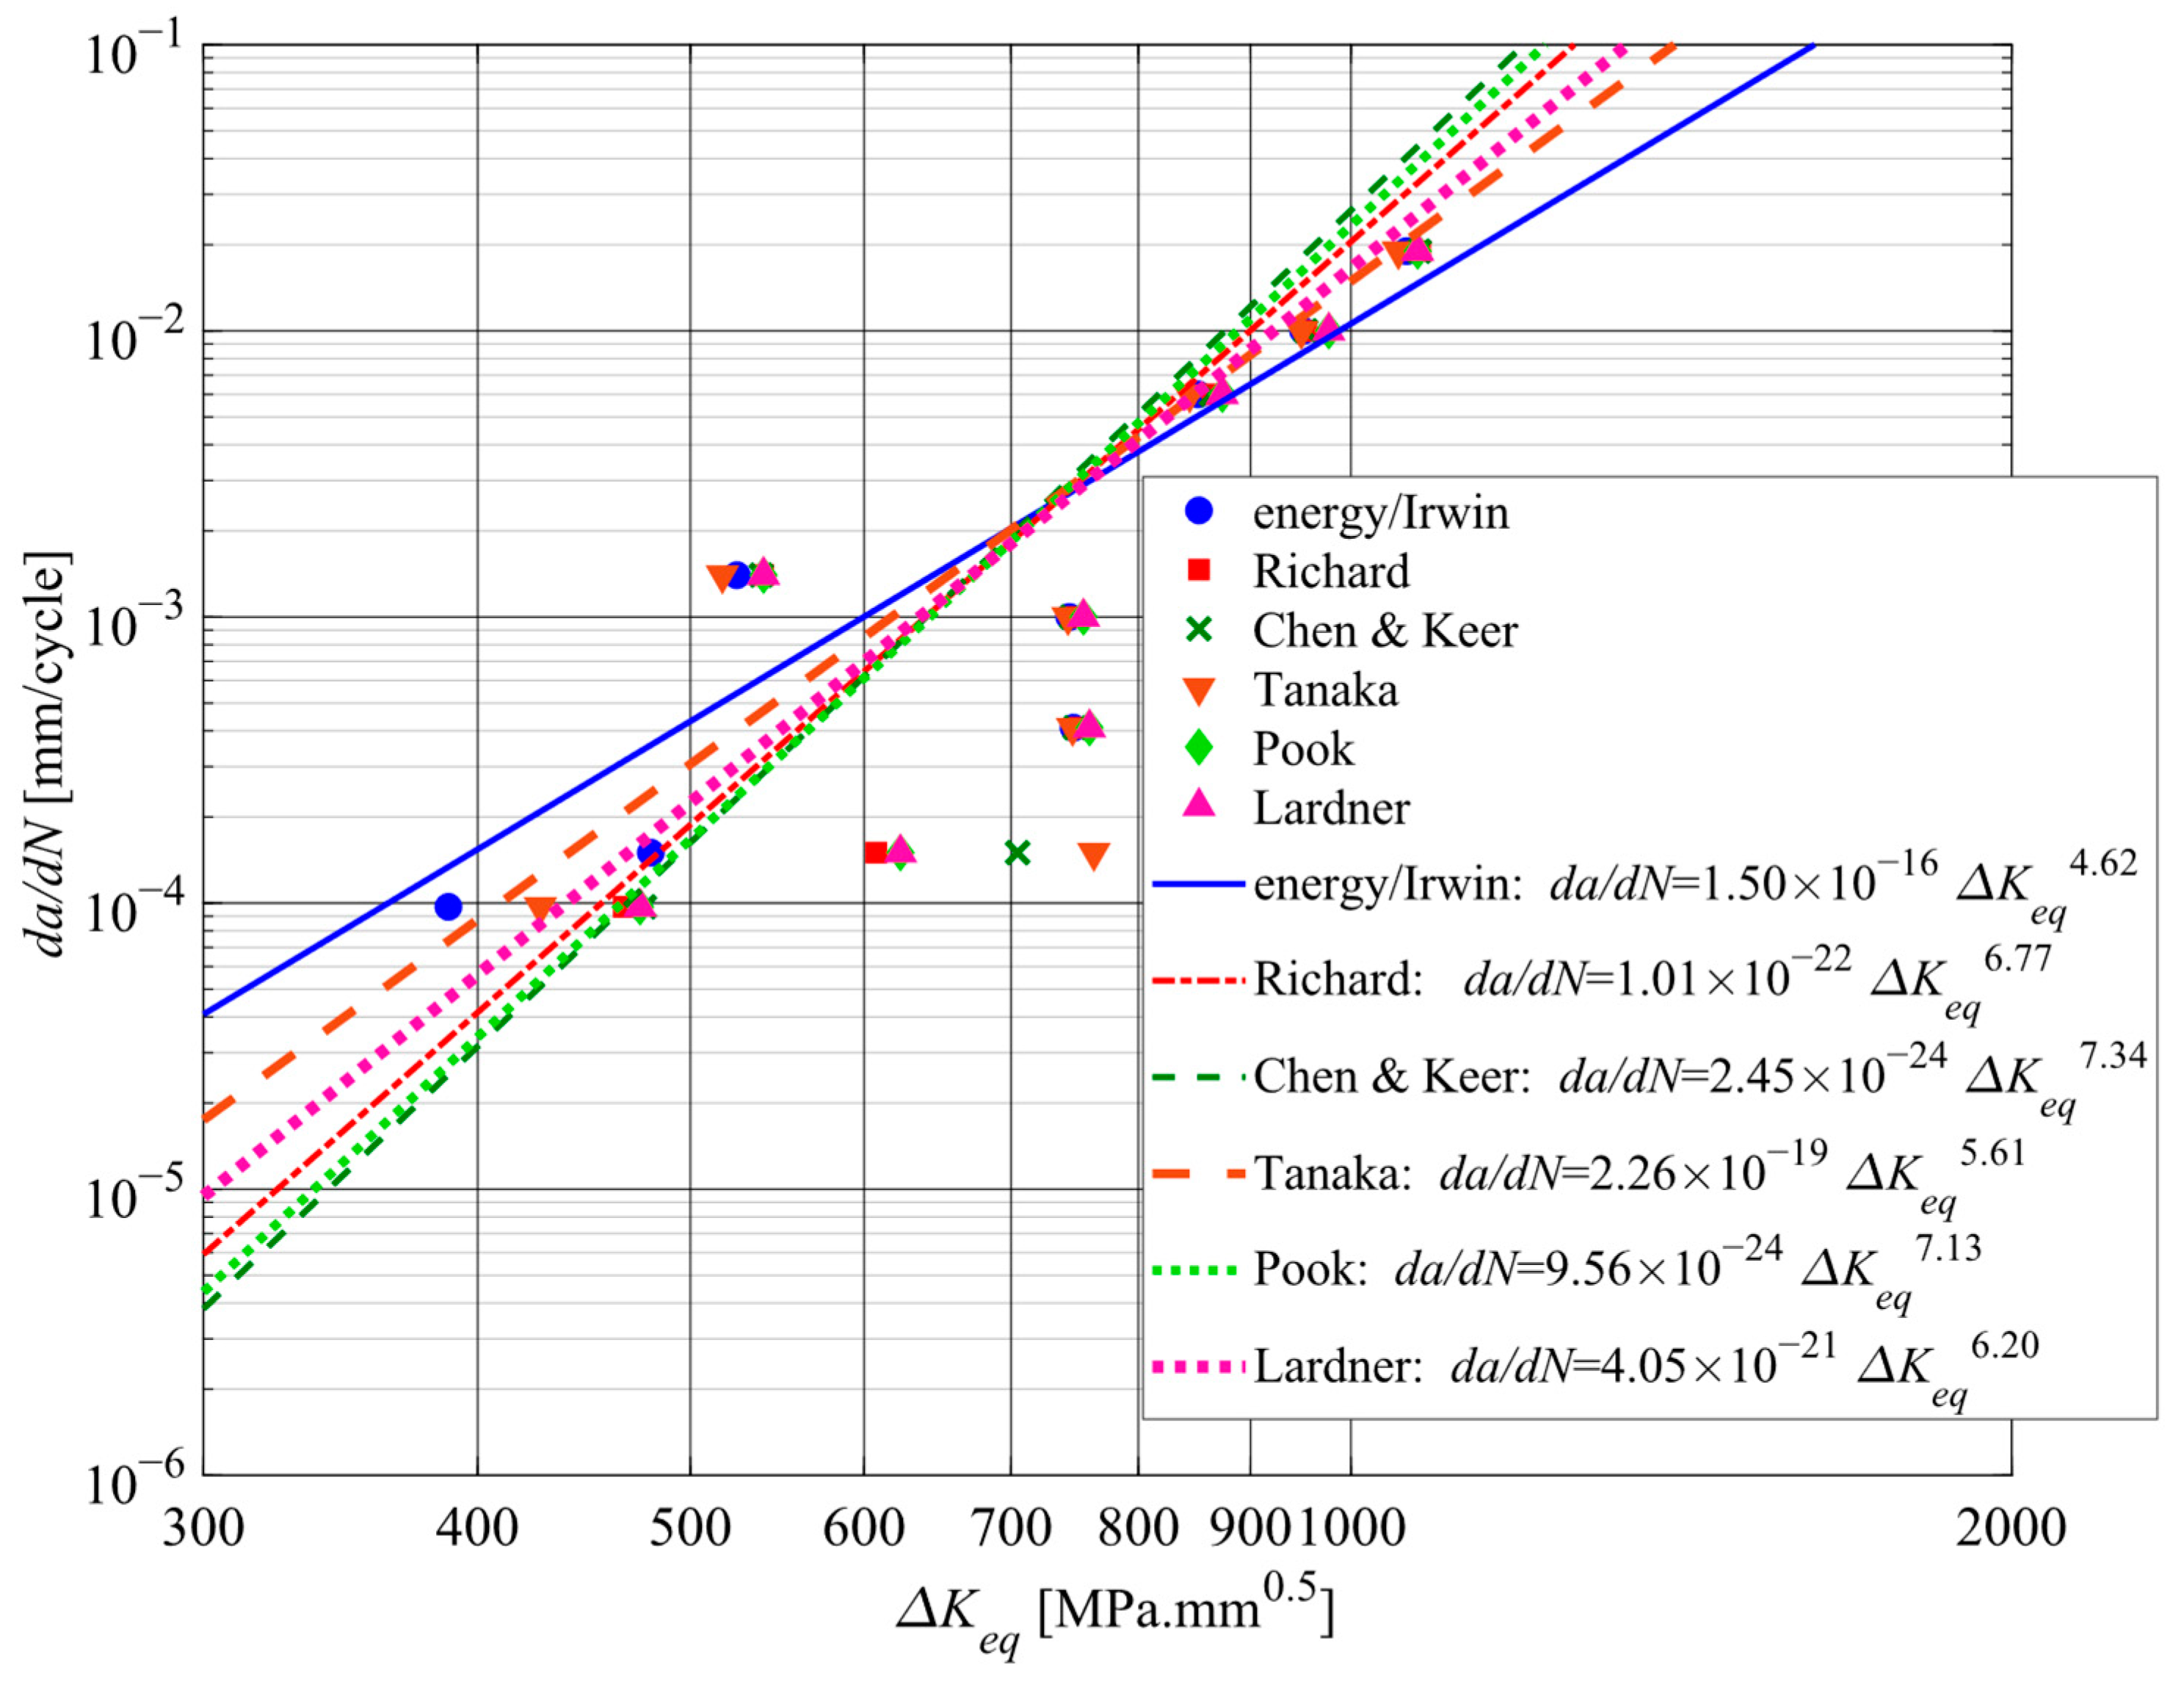
4. Experimental Data and Discussion

Data from [43,44] using Tanaka’s definition of Keq (Equation (4)) indicate that, for the test conditions and structural steels considered, the experimentally measured da/dN vs. ΔKI and da/dN vs. ΔKeq were approximately similar, a trend also found by Akama using Richard’s Keq definition and testing biaxially loaded plates [45]. Using CTS specimens and Richard’s Keq definition of Equations (11) and (12), [46] notes that C and m in Equation (2) depend on the angle of load direction and initial pre-crack, i.e., on the initial values of KII/KI. Such a dependence is also shown in [33]; that is a weak dependence, which is not surprising given that in CTS specimens, after the initial shift in the crack path, most of the FCG takes place in near-mode-I conditions. Similar conclusions were obtained by Hong et al. [47].
As shown in Section 2, substantial differences between Keq definitions are found. What are the consequences of that diversity?
The mixed-mode fatigue crack propagation tests may be performed using a travelling microscope measuring horizontal and vertical coordinates. Preferably, to monitor both surfaces of the specimen, two travelling microscopes may be used. The measurement of the crack path’s x, y coordinates in a mixed-mode fatigue crack propagation test is a tedious and time-consuming task. It involves the identification of the number of cycles needed for the crack tip to move from location x1, y1 to x2, y2. As a simplification, the distance between points 1 and 2 is assumed to be a straight line and therefore:
Δ a x 2 x 1 2 + y 2 y 1 2 Δ N
A higher accuracy is obtained if more points are used to define the path, implying more frequent measurements of coordinates associated with lower values of Δ a , which can be achieved with automatic systems and high-resolution digital cameras. The crack growth rate d a / d N is then defined as:
d a d N Δ a Δ N
In tests reported in [5,6], Al alloy AA6082 T6 CT specimens modified with holes, along with cracked 4-point bend specimens subjected to asymmetrical loading promoting mixed-mode situations, were subjected to FCG tests where the crack path and crack growth rate were measured. As in [48,49,50], for the CT specimens with holes, Keq values were not far from KI, and da/dN vs. ΔKeq data were close to da/dN vs. ΔKI data. Figure 4 shows the crack path in a CT specimen modified with a hole [51].
Research showing a good predictability of FCG was also presented by Alshoaibi in [52,53], where, again, the values of KII were typically smaller or much smaller than the values of KI. However, for the 4-point bend specimens, a great diversity of mixity values was achieved in [5], and substantial differences between mode-I and mixed-mode FCG could be identified. The difference between da/dN vs. ΔKeq and da/dN vs. ΔKI data increases with the mixity value.
According to a suitable choice of loading points, 4-point bend tests may produce pure mode II situations. As an example, Figure 5 shows a 4-point bend specimen, tested under initial pure mode II. Of interest here is the initial direction of the crack growth, starting from the precrack—in this test, the crack growth takes place at an angle of approx. 90°. Details of the experiments may be found in [5].
The present note highlights the need for data clarifying what is the best definition for Keq. This is illustrated by the Paris laws obtained from the dataset of Table 1, using the present enlarged set of definitions of Keq.
The corresponding Paris law representation, in terms of different Keq definitions, is provided in Figure 6.
One example of the consequences of the presented analysis is the expected FCG rate for a given ΔKeq value, considering different definitions for Keq. For the dataset used, and as shown in Figure 4, the ranking of growth rates is not constant along the values of ΔKeq. Indeed, above ~700 MPamm−1/2, the ranking of the FCG rates would be different. With data for Keq = 400 MPamm−1/2 and for Keq = 800 MPamm−1/2, one such example is provided in Table 2.
As mentioned in the introduction section, one aim of the application of Fracture Mechanics to fatigue is to model fatigue crack propagation in real structural components, starting from existing or assumed cracks that progress under a cyclic load up to a larger size or final rupture. Clearly, those applications are successful in mode I, where no doubts exist concerning the transformation of the stress state of the cracked component or structure into a value of KI. However, as seen above, for mixed-mode situations, a variety of Keq definitions are currently in use, and they may lead to rather different FCG predictions.
Recent work by Sajith et al. illustrates the point in several structures and specimen geometries. The work of these authors evaluates the FCG predictability performance of different Keq criteria, using CTS specimens with various precrack inclination values [54]. The experimental a vs. N curve was compared with the predictions. In the region just after the precrack, the differences found were more important, and they diminished as the crack grew. This is consistent with the fact that in CTS specimens, after the initial shift from the precrack direction, most of the FCG takes place under the approximate mode I condition. Interestingly, in [55], the same authors examined plates with an inclined central precrack and found a similar trend of larger errors near the initial precrack. It is worth recalling that the inclined central crack in a plate tends to grow into a mode I situation.
Furthermore, using a single definition of Keq, the same value of Keq may be achieved via an infinity of different combinations of KI and KII, and it is clear that different combinations imply different FCG rates. The still unanswered question is therefore: what could be a definition of Keq that aims at a wide and universal applicability?
A perspective to counteract the shortcomings presented would be to address the modelling methodology in a data-driven fashion. Unsupervised learning may help to reveal hidden patterns that will potentially support our understanding of the material’s behavior. Data-driven modelling and machine learning was already successfully applied, e.g., to materials science [8,56,57], failure of concrete [58] or geology [59]. Using numerical data, Baptista et al. [60] showed that artificial neural networks can be trained to predict an FCG’s path and life, and they reckon that experimental data is required to improve training. Considering that FCG can be described with physical laws, physics-informed data-driven approaches [61,62] can be exploited in analyses involving mixed-mode FCG; however, those approaches require significant experimental data for model training, which is not yet widely available.

5. Concluding Remarks

This article compared several definitions of the equivalent stress intensity factor in mixed-mode situations, currently in use among researchers.
Requirements for candidate definitions were the trends of Keq/KI when KI/KII tends to infinity or to zero. One definition of Keq found in the literature was shown to fail the requirements.
Values of Keq for the different definitions were compared through a determination of Keq/KI over a wide range of values of KI/KII or KII/KI. It was found that the different approaches converged to the same value as KI/KII increased. For large KII/KI, differences between values of Keq persisted, and in the regions 0 < KI/KII < 2 and 0 < KII/KI < 2, no stable result trend could be defined.
The present note aimed at highlighting the difficulties of modelling FCG in mixed-mode situations, created by the coexistence of different Keq definitions. The same set of experimental mixed-mode FCG data leads to different constants C and m of the Paris law equation; consequently, when integrating the law, different lives are found. For the FCG dataset used, it was found that the ranking of different definitions as regarded the FCG rate depended on the ΔKeq value considered—for lower values of ΔKeq, the Chen and Keer definition provided the lower FCG rate, whereas for the higher values of ΔKeq, the lower values of the FCG rate corresponded to the ‘energy’ definition of Keq.
Data-driven modelling, and in particular physics-informed data-driven methodologies, are possible perspectives for overcoming the present shortcomings of mixed-mode FCG modelling. Integrating data-driven approaches such as machine learning or neural networks with FCG equations and with the structural and material behavior of a structural component can create more reliable and accurate models for predicting FCG behavior. However, this approach demands a significant amount of data and an individualized calibration for each structural component, in order to capture the particular material behavior and environmental conditions of that component.

Author Contributions

Conceptualization, investigation, and writing—review and editing: S.M.O.T. and P.M.S.T.d.C. All authors have read and agreed to the published version of the manuscript.

Funding

This research received no external funding.

Institutional Review Board Statement

Not applicable.

Informed Consent Statement

Not applicable.

Data Availability Statement

The data are contained within the article.

Acknowledgments

Students and interns Marco Ferreira, José Baganha Marques, Maria Hermosilla (from Univ. Polit. Cartagena, Spain) and Lucas Gicquel (from Polytech Lille, France) contributed to aspects of the work. Laboratory staff—Miguel Figueiredo and Rui Silva—contributed with aspects of the experimental work. The authors thank the anonymous reviewers for valuable suggestions.

Conflicts of Interest

The authors declare no conflict of interest.

References

  1. Zehnder, A.T. Fracture Mechanics; Springer Science + Business Media, B.V.: London, UK, 2012. [Google Scholar]
  2. Perez, N. Fracture Mechanics, 2nd ed.; Springer International Publishing AG: Cham, Switzerland, 2017. [Google Scholar]
  3. Paris, P.C.; Gomez, M.P.; Anderson, W.E. A rational analytic theory of fatigue. Trend Eng. 1961, 13, 9–14. [Google Scholar]
  4. Paris, P.C. Fracture mechanics and fatigue: A historical perspective. Fatigue Fract. Eng. Mater. Struct. 1998, 21, 535–540. [Google Scholar] [CrossRef]
  5. Baganha-Marques, J.; Tavares, S.M.O.; de Castro, P.M.S.T. Analysis of mode II and mixed mode I-II in fracture and fatigue: A numerical and experimental study. In Materials Design and Applications II; da Silva, L.F.M., Ed.; Springer: Berlin/Heidelberg, Germany, 2018; pp. 403–423. [Google Scholar]
  6. Tavares, S.M.O.; Reis, L.; de Freitas, M.; de Castro, P.M.S.T. Mixed mode fatigue and fracture in planar geometries: Observations on Keq and crack path modelling. Fatigue Fract. Eng. Mater. Struct. 2019, 42, 2441–2456. [Google Scholar] [CrossRef]
  7. ABAQUS. Abaqus/Standard Analysis User’s Manual; Dassault Systems Simulia Corporation: Providence, RI, USA, 2017. [Google Scholar]
  8. Butler, K.T.; Davies, D.W.; Cartwright, H.; Isayev, O.; Walsh, A. Machine learning for molecular and materials science. Nature 2018, 559, 547–555. [Google Scholar] [CrossRef] [PubMed] [Green Version]
  9. Ma, X.; He, X.; Tu, Z.C. Prediction of fatigue–crack growth with neural network-based increment learning scheme. Eng. Fract. Mech. 2021, 241, 107402. [Google Scholar] [CrossRef]
  10. Mortazavi, S.N.S.; Ince, A. An artificial neural network modeling approach for short and long fatigue crack propagation. Comput. Mater. Sci. 2020, 185, 109962. [Google Scholar] [CrossRef]
  11. Raja, A.; Chukka, S.T.; Jayaganthan, R. Prediction of fatigue crack growth behaviour in ultrafine grained Al 2014 alloy using machine learning. Metals 2020, 10, 1349. [Google Scholar] [CrossRef]
  12. Zafar, M.H.; Younis, H.B.; Mansoor, M.; Moosavi, S.K.R.; Khan, N.M.; Akhtar, N. Training deep neural networks with novel metaheuristic algorithms for fatigue crack growth prediction in aluminum aircraft alloys. Materials 2022, 15, 6198. [Google Scholar] [CrossRef]
  13. Irwin, G.R. Analysis of stresses and strains near the end of a crack traversing a plate. J. Appl. Mech. 1957, 24, 361–364. [Google Scholar] [CrossRef]
  14. Radaj, D. Extended stress intensity factor concepts. In Advanced Methods of Fatigue Assessment; Radaj, D., Vormwald, M., Eds.; Springer: Berlin/Heidelberg, Germany, 2013; pp. 101–265. [Google Scholar]
  15. Ramulu, M.; Kobayashi, A.S. Numerical and experimental study of mixed mode fatigue crack propagation. In Handbook of Fatigue Crack Propagation in Metallic Structures; Carpinteri, A., Ed.; Elsevier: Amsterdam, The Netherlands, 1994; Volume 2, pp. 1073–1123. [Google Scholar]
  16. Réthoré, J.; Gravouil, A.; Morestin, F.; Combescure, A. Estimation of mixed-mode stress intensity factors using digital image correlation and an interaction integral. Int. J. Fract. 2005, 132, 65–79. [Google Scholar] [CrossRef]
  17. Rhee, H.C.; Salama, M.M. Mixed-mode stress intensity factor solutions of a warped surface flaw by three-dimensional finite element analysis. Eng. Fract. Mech. 1987, 28, 203–209. [Google Scholar] [CrossRef]
  18. Wang, C.; Zhu, Z.M.; Liu, H.J. On the I–II mixed mode fracture of granite using four-point bend specimen. Fatigue Fract. Eng. Mater. Struct. 2016, 39, 1193–1203. [Google Scholar] [CrossRef]
  19. Bezensek, B.; Hancock, J.W. Mode I and mixed-mode I/II crack tip fields unified by constraint. In Proceedings of the ECF15, Stockholm, Sweden, 11–13 August 2004. [Google Scholar]
  20. Tanaka, K. Fatigue crack propagation from a crack inclined to the cyclic tensile axis. Eng. Fract. Mech. 1974, 6, 493–507. [Google Scholar] [CrossRef]
  21. Qian, J.; Fatemi, A. Mixed mode fatigue crack growth: A literature survey. Eng. Fract. Mech. 1996, 55, 969–990. [Google Scholar] [CrossRef]
  22. Liu, L. Modeling of Mixed-Mode Fatigue Crack Propagation; Vanderbilt University: Nashville, TN, USA, 2008. [Google Scholar]
  23. Kim, J.-K.; Kim, C.-S. Fatigue crack growth behavior of rail steel under mode I and mixed mode loadings. Mater. Sci. Eng. A 2002, A338, 191–201. [Google Scholar] [CrossRef]
  24. Lardner, R.W. A dislocation model for fatigue crack growth in metals. Philos. Mag. A J. Theor. Exp. Appl. Phys. 1968, 17, 71–82. [Google Scholar] [CrossRef]
  25. Chen, W.R.; Keer, L.M. Fatigue crack growth in mixed mode loading. J. Eng. Mater. Technol. ASME Trans. 1991, 113, 222–227. [Google Scholar] [CrossRef]
  26. Pook, L.P. Crack Paths; WIT Press: Southampton, UK, 2002. [Google Scholar]
  27. Demir, O.; Ayhan, A.O.; Iriç, S. A new specimen for mixed mode-I/II fracture tests: Modeling, experiments and criteria development. Eng. Fract. Mech. 2017, 178, 457–476. [Google Scholar] [CrossRef]
  28. Demir, O.; Ayhan, A.O.; Iric, S.; Lekesiz, H. Evaluation of mixed mode-I/II criteria for fatigue crack propagation using experiments and modeling. Chin. J. Aeronaut. 2018, 31, 1525–1534. [Google Scholar] [CrossRef]
  29. Richard, H.A. Grundlagen und Anwendungen der Bruchmechaninik. Tech. Mech. 1990, 11, 69–80. [Google Scholar]
  30. Richard, H.A.; Linning, W.; Henn, K. Fatigue crack propagation under combined loading. Forensic Eng. 1991, 3, 99–109. [Google Scholar]
  31. Henn, K.; Richard, H.A. Some aspects of fatigue crack growth under mixed mode loading. In Proceedings of the 7th International Conference on Fracture—ICF7, Houston, TX, USA, 20–24 March 1989; Salama, K., Taplin, D.M.R., Rama-Rao, P., Ravi-Chandar, K., Eds.; Elsevier: Amsterdam, The Netherlands, 1989. [Google Scholar]
  32. Borrego, L.P.; Antunes, F.V.; Costa, J.M.; Ferreira, J.M. Mixed-mode fatigue crack growth behaviour in aluminium alloy. Int. J. Fatigue 2006, 28, 618–626. [Google Scholar] [CrossRef] [Green Version]
  33. Peixoto, D.F.C.; de Castro, P.M.S.T. Fatigue crack growth of a railway wheel. Eng. Fail. Anal. 2017, 82, 420–434. [Google Scholar] [CrossRef]
  34. Richard, H.-A. Bruchvorhersagen bei überlagerter Normal- und Schubbeanspruchung von Rissen; VDI Forschungsheft; VDI-Verlag: Düsseldorf, Germany, 1985; pp. 1–60. [Google Scholar]
  35. Richard, H.A. Safety estimation for construction units with cracks under complex loading. In Proceedings of the Second International Conference on ‘Structural Failure, Product Liability and Technical Insurance’, Vienna, Austria, 1–3 July 1986; Rossmanith, H.P., Ed.; Inderscience: Geneva, Switzerland, 1986; pp. 423–437. [Google Scholar]
  36. Sander, M.; Richard, H.A. Lifetime predictions for real loading situations—Concepts and experimental results of fatigue crack growth. Int. J. Fatigue 2003, 25, 999–1005. [Google Scholar] [CrossRef]
  37. Richard, H.A. Crack problems under complex loading. In Proceedings of the International Conference on the Role of Fracture Mechanics in Modern Technology, Fukuoka, Japan, 2–6 June 1986; Sih, G.C., Nisitani, H., Ishihara, T., Eds.; North-Holland, 1987; pp. 577–588. [Google Scholar]
  38. Richard, H.A.; Fulland, M.; Buchholz, F.G.; Schöllmann, M. 3D fracture criteria for structures with cracks. Steel Res. 2003, 74, 491–497. [Google Scholar] [CrossRef]
  39. Richard, H.A.; Fulland, M.; Sander, M. Theoretical crack path prediction. Fatigue Fract. Eng. Mater. Struct. 2005, 28, 3–12. [Google Scholar] [CrossRef]
  40. Richard, H.A.; Sander, M.; Fulland, M.; Kullmer, G. Development of fatigue crack growth in real structures. Eng. Fract. Mech. 2008, 75, 331–340. [Google Scholar] [CrossRef]
  41. Richard, H.A.; Sander, M. Ermüdungsrisse—Erkennen, Sicher Beurteilen, Vermeiden, 3rd ed.; Springer Vieweg: Berlin/Heidelberg, Germany, 2012. [Google Scholar]
  42. Amato, D.; Yarullin, R.; Shlyannikov, V.; Citarella, R. Numerical and experimental investigation of mixed-mode crack growth in aluminum alloys. Fatigue Fract. Eng. Mater. Struct. 2022, 45, 2854–2872. [Google Scholar] [CrossRef]
  43. Carvalho, D.; Silva, A.L.L.; Jesus, A.M.P.; Fernandes, A.A. Fatigue behaviour of structural steels. Comparison of strain-life and fatigue crack propagation data. Mec. Exp. 2015, 25, 67–78. [Google Scholar]
  44. Silva, A.L.L.; Jesus, A.M.P.; Xavier, J.; Correia, J.A.F.O.; Fernandes, A.A. Combined analytical-numerical methodologies for the evaluation of mixed-mode (I + II) fatigue crack growth rates in structural steels. Eng. Fract. Mech. 2017, 185, 124–138. [Google Scholar] [CrossRef]
  45. Akama, M. Fatigue crack growth under non-proportional mixed mode loading in rail and wheel steel. Part 1: Sequential mode I and mode II loading. Appl. Sci. 2019, 9, 2006. [Google Scholar] [CrossRef] [Green Version]
  46. Heirani, H.; Farhangdoost, K. Mixed mode I/II fatigue crack growth under tensile or compressive far-field loading. Mater. Res. Express 2017, 4, 116506. [Google Scholar] [CrossRef]
  47. Hong, S.; Kim, S.; Kim, J. Effects of mixed mode loading conditions on fatigue crack growth rate. Key Eng. Mater. 2019, 814, 176–181. [Google Scholar] [CrossRef]
  48. Alshoaibi, A.M.; Fageehi, Y.A. 3D modelling of fatigue crack growth and life predictions using ANSYS. Ain Shams Eng. J. 2022, 13, 101636. [Google Scholar] [CrossRef]
  49. Alshoaibi, A.M.; Fageehi, Y.A. Simulation of quasi-static crack propagation by adaptive finite element method. Metals 2021, 11, 16. [Google Scholar] [CrossRef]
  50. Alshoaibi, A.M. Fatigue crack growth analysis under constant amplitude loading using finite element method. Materials 2022, 15, 2937. [Google Scholar] [CrossRef]
  51. Ferreira, M.A.C.; Tavares, S.M.O.; Belinha, J.; de Castro, P.M.S.T. Mixed mode crack propagation: Numerical and experimental study. In Proceedings of the 7th International Conference on Mechanics and Materials in Design, Albufeira, Portugal, 25 April 2017; Silva-Gomes, J.F., Meguid, S.A., Eds.; INEGI-FEUP: Albufeira, Portugal, 2017. [Google Scholar]
  52. Alshoaibi, A.M. Computational simulation of 3D fatigue crack growth under mixed-mode loading. Appl. Sci. 2021, 11, 5953. [Google Scholar] [CrossRef]
  53. Alshoaibi, A.M. Numerical modeling of crack growth under mixed-mode loading. Appl. Sci. 2021, 11, 2975. [Google Scholar] [CrossRef]
  54. Sajith, S.; Shukla, S.S.; Murthy, K.S.R.K.; Robi, P.S. Mixed mode fatigue crack growth studies in AISI 316 stainless steel. Eur. J. Mech./A Solids 2020, 80, 103898. [Google Scholar] [CrossRef]
  55. Sajith, S.; Murthy, K.S.R.K.; Robi, P.S. Prediction of accurate mixed mode fatigue crack growth curves using the paris’ law. J. Inst. Eng. (India) Ser. C 2019, 100, 165–174. [Google Scholar] [CrossRef]
  56. Mueller, T.; Kusne, A.G.; Ramprasad, R. Machine learning in materials science: Recent progress and emerging applications. Rev. Comput. Chem. 2016, 29, 186–273. [Google Scholar]
  57. Shah, S.; Sarath, S.; Reddy, S. Similarity driven unsupervised learning for materials science terminology extraction. Comput. Sist. 2019, 23, 1005–1013. [Google Scholar] [CrossRef]
  58. Wang, Z. The investigation into the failure criteria of concrete based on the BP neural network. Eng. Fract. Mech. 2022, 275, 108835. [Google Scholar] [CrossRef]
  59. Younes, K.; Grasset, L. Carbohydrates as proxies in ombrotrophic peatland: DFRC molecular method coupled with PCA. Chem. Geol. 2022, 606, 120994. [Google Scholar] [CrossRef]
  60. Baptista, R.; Moita, P.; Infante, V. Fatigue crack growth on modified CT specimens using artificial neural networks. Int. J. Fatigue 2023, 167, 107357. [Google Scholar] [CrossRef]
  61. Athanasiou, C.E.; Padture, N.P.; Sheldon, B.W.; Gao, H. A machine learning approach to fracture mechanics problems. Acta Mater. 2020, 190, 105–112. [Google Scholar]
  62. Jin, H.; Zhang, E.; Espinosa, H.D. Recent advances and applications of machine learning in experimental solid mechanics: A review. arXiv 2023, arXiv:2303.07647. [Google Scholar]
Figure 1. Non-dimensional Keq/KI as a function of KI/KII; region KI/KII < 2.
Applsci 13 04820 g001
Figure 2. Non-dimensional Keq/KI as a function of KII/KI; region KII/KI < 5.
Applsci 13 04820 g002
Figure 3. Demir’s Keq definition: illustration of the limitations of the approach. For comparison, Tanaka’s approach is also included.
Applsci 13 04820 g003
Figure 4. CT specimen modified with a hole, showing the crack path. FCG takes place under the predominant mode I situation, Ferreira et al. [51].
Applsci 13 04820 g004
Figure 5. 4-pont bend test, showing machined V notch, subsequent mode I precrack, and FCG path starting at the precrack; details in [5].
Applsci 13 04820 g005
Figure 6. da/dN vs. ΔKeq using different definitions of Keq.
Applsci 13 04820 g006
Table 1. Tests at R = 0.1, maximum values of KI and KII per cycle, and FCG rate [5].
da/dN [mm/cycle]KI, max
[MPamm−1/2]
KII, max
[MPamm−1/2]
spec. #10.00015172.3512.9
5.9 × 10−5738.69.6
0.001834.651
0.011.08 × 10383.7
spec. #39.70 × 10−5344,7258.9
0.0014574.9100.5
0.0004184050.6
0.006919.4183.5
0.0191169.8132.3
Table 2. FCG rate for 6082 T6 for Keq = 400 MPamm−1/2 and for Keq = 800 MPamm−1/2 (mm/cycle).
Keq = 400 MPamm−1/2Keq = 800 MPamm−1/2
Chen & Keer3.16 × 10−55.12 × 10⁻³
Pook3.40 × 10−54.75 × 10⁻³
Richard4.15 × 10−54.52 × 10⁻³
Lardner5.62 × 10−54.14 × 10⁻³
Tanaka8.76 × 10−54.27 × 10⁻³
Energy/Irwin1.54 × 10−43.78 × 10⁻³
Disclaimer/Publisher’s Note: The statements, opinions and data contained in all publications are solely those of the individual author(s) and contributor(s) and not of MDPI and/or the editor(s). MDPI and/or the editor(s) disclaim responsibility for any injury to people or property resulting from any ideas, methods, instructions or products referred to in the content.

