
Dynamic Analysis and Seat Selection of Bus Driving Comfort under Different Road Conditions


Abstract
Featured Application
Abstract
1. Introduction

| Comfortable Attributes | Authors, Years, Source | Comfortable Attributes | Authors, Years, Source |
|---|---|---|---|
| Noise | Oborne and Clarke, 1973, [7] | Temperature | |
| EN 13816, 2002, [8] | EN 13816, 2002, [8] | ||
| Prashanth et al., 2013, [9] | Zhang et al., 2014, [10] | ||
| Zhang et al., 2014, [10] | Almeida et al., 2020, [11] | ||
| Kilikevičius et al., 2020, [12] | Zhou et al., 2022, [13] | ||
| Mathes et al., 2022, [14] | |||
| Vibration | Lin et al., 2010, [15] | Accelerations | Wåhlberg, 2006, [16] |
| Lin and Chen, 2011, [17] | EN 12299, 2009, [18] | ||
| Sekulić et al., 2013, 2016, 2018, [19,20,21] | Castellanos and Fruett, 2014, [22] | ||
| Castellanos and Fruett, 2014, [22] | Maternini and Cadei, 2014, [23] | ||
| Sekulić and Mladenović, 2016, [24] | Vovsha et al., 2014, [25] | ||
| Zhao et al., 2016, [26] | Eboli et al., 2016, [27] | ||
| Shen et al., 2016, [28] | Barabino et al., 2018, [29] | ||
| Meiping and Wen, 2017, [30] | Nguyen et al., 2019, [31] | ||
| Wang et al., 2020, [32] | Bae et al., 2019, [33] | ||
| Nguyen et al., 2021, [34] | Szumska et al., 2022, [35] |
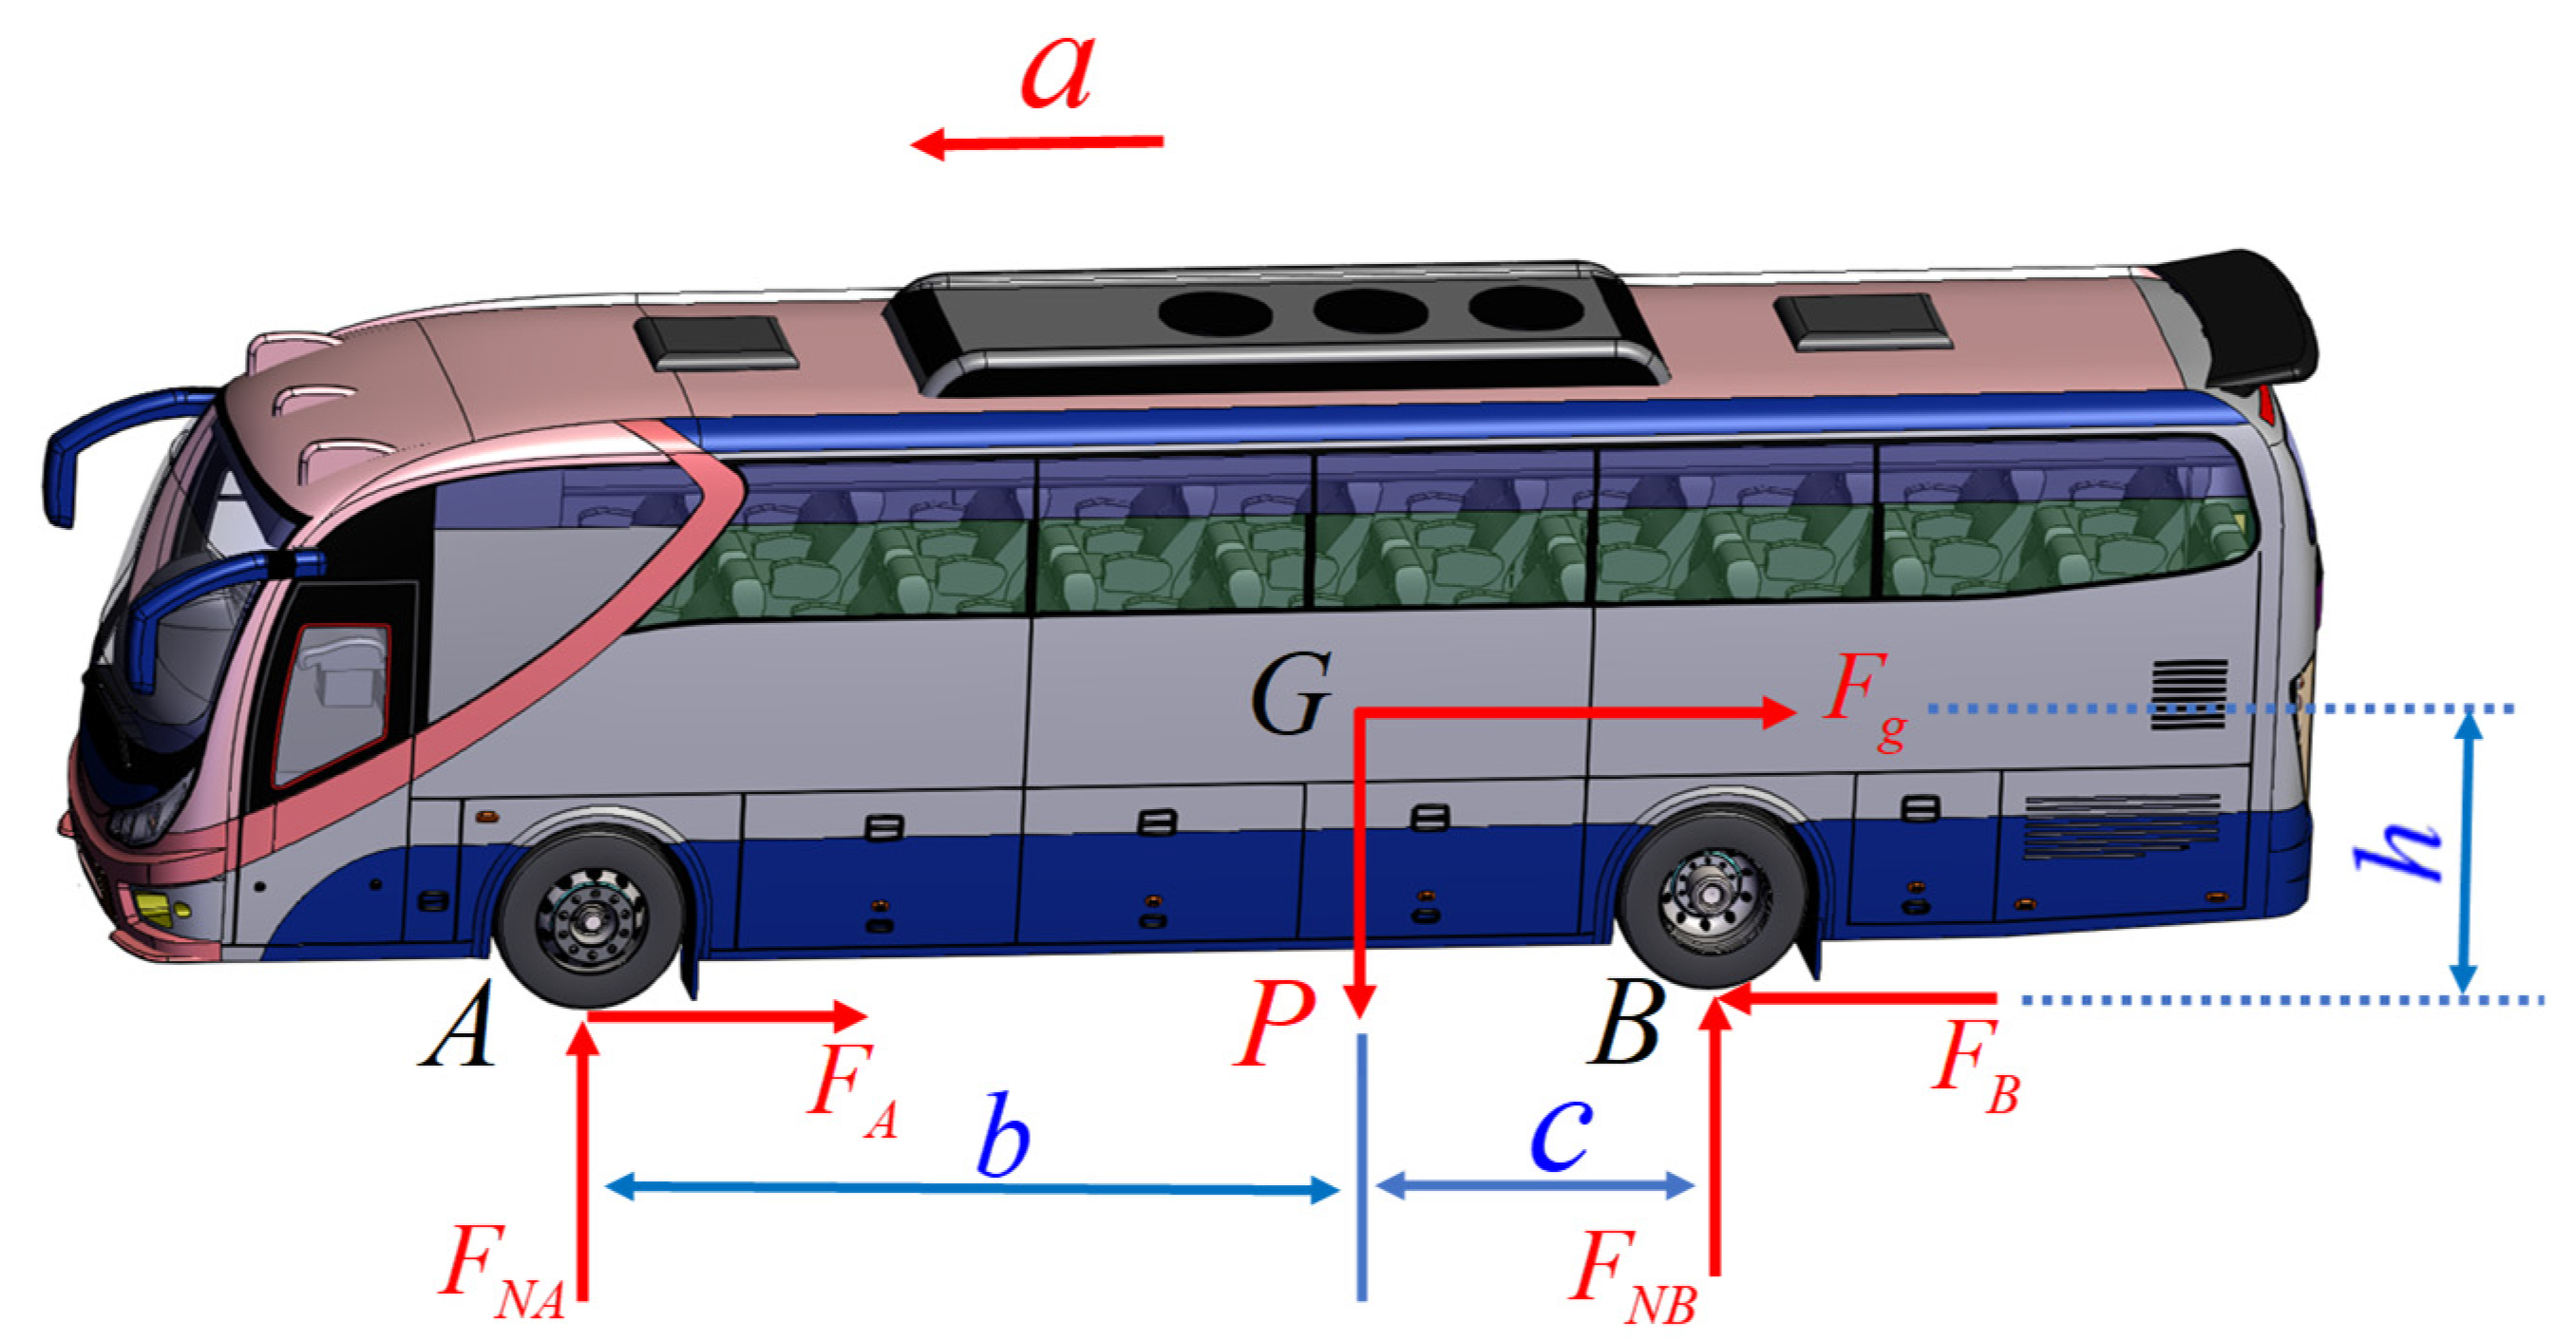
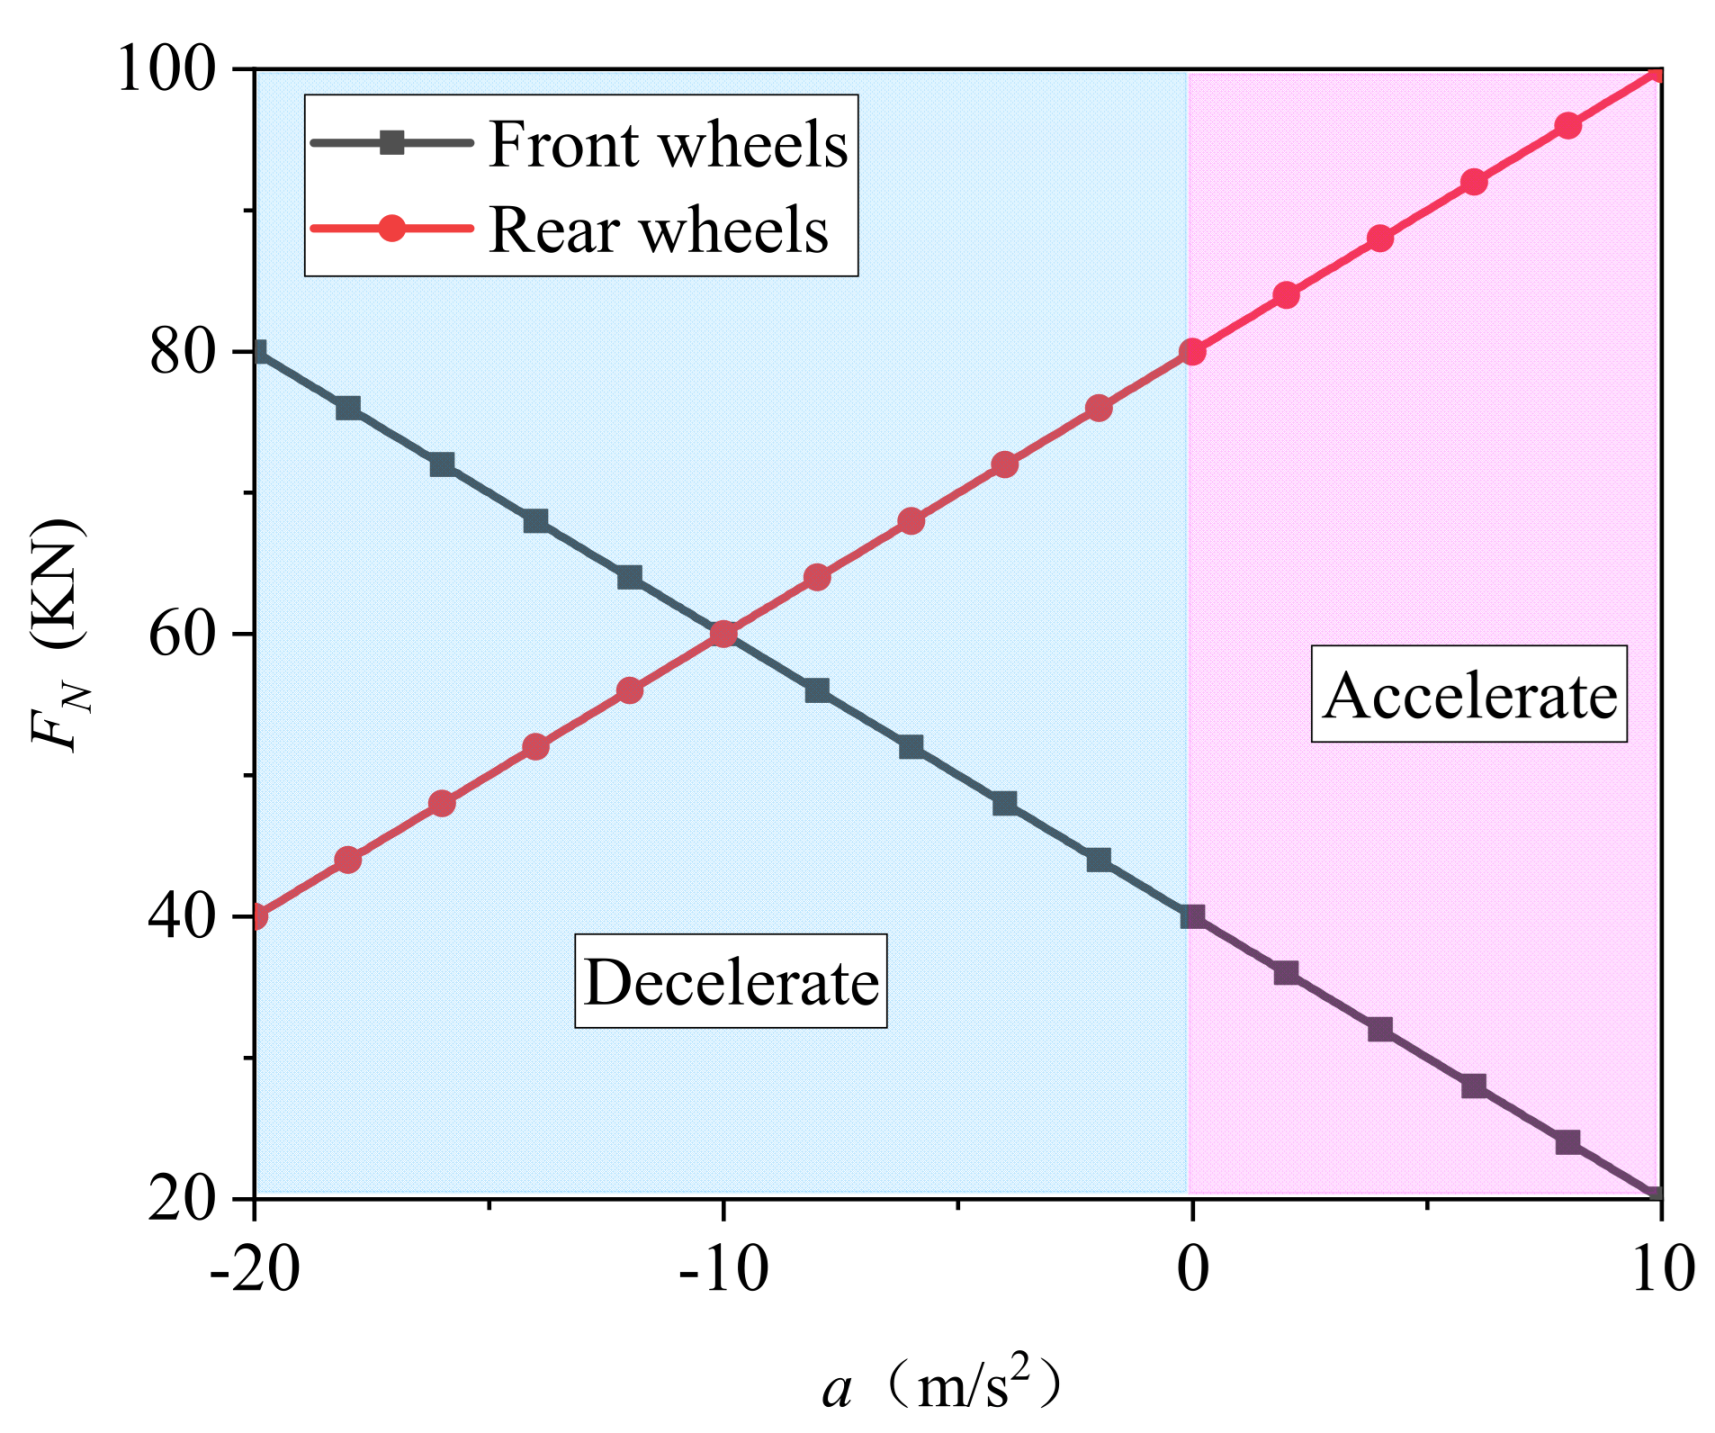
2. Mechanical Analysis of Bus Running on Horizontal Road
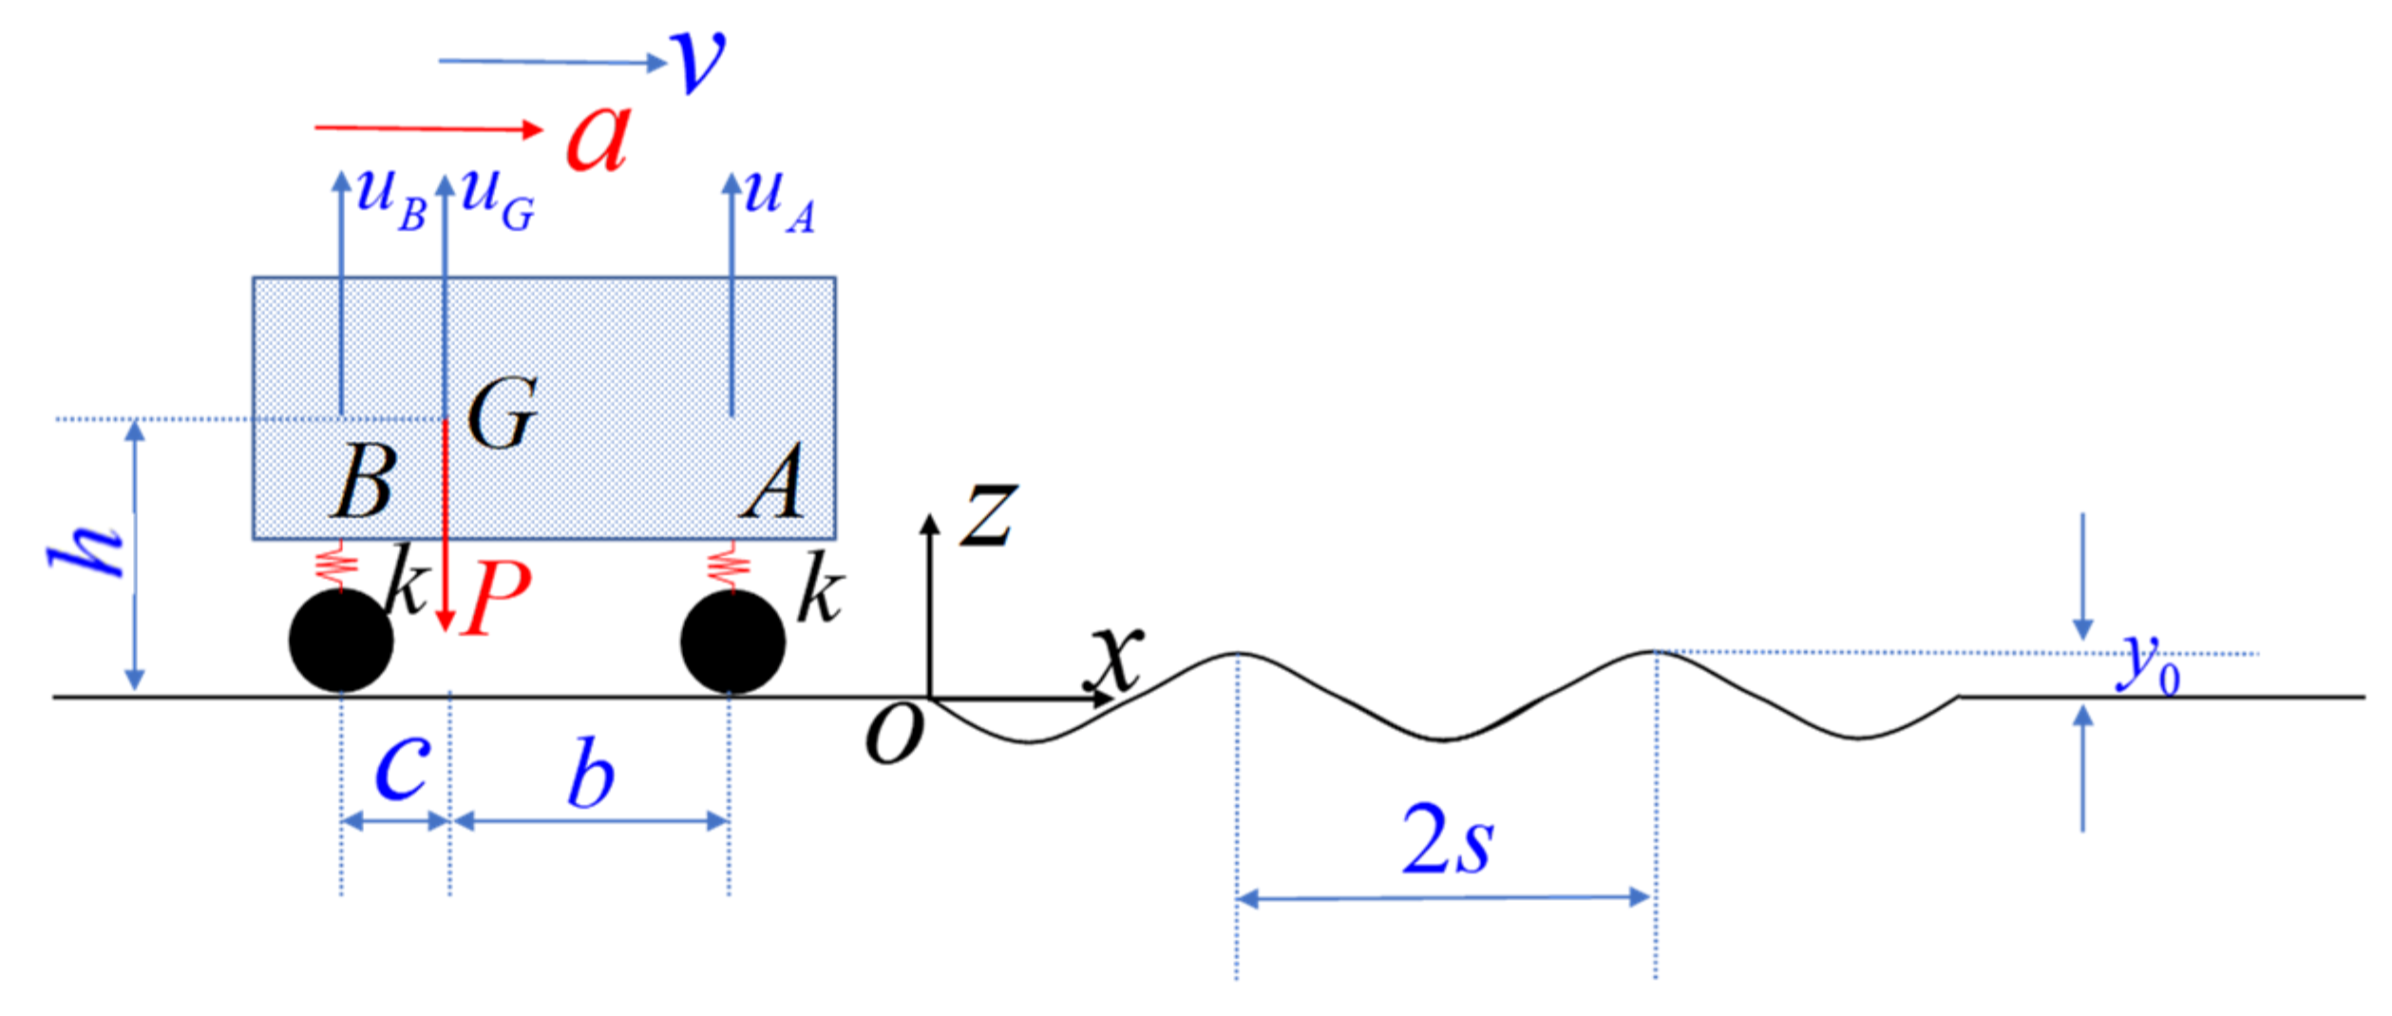
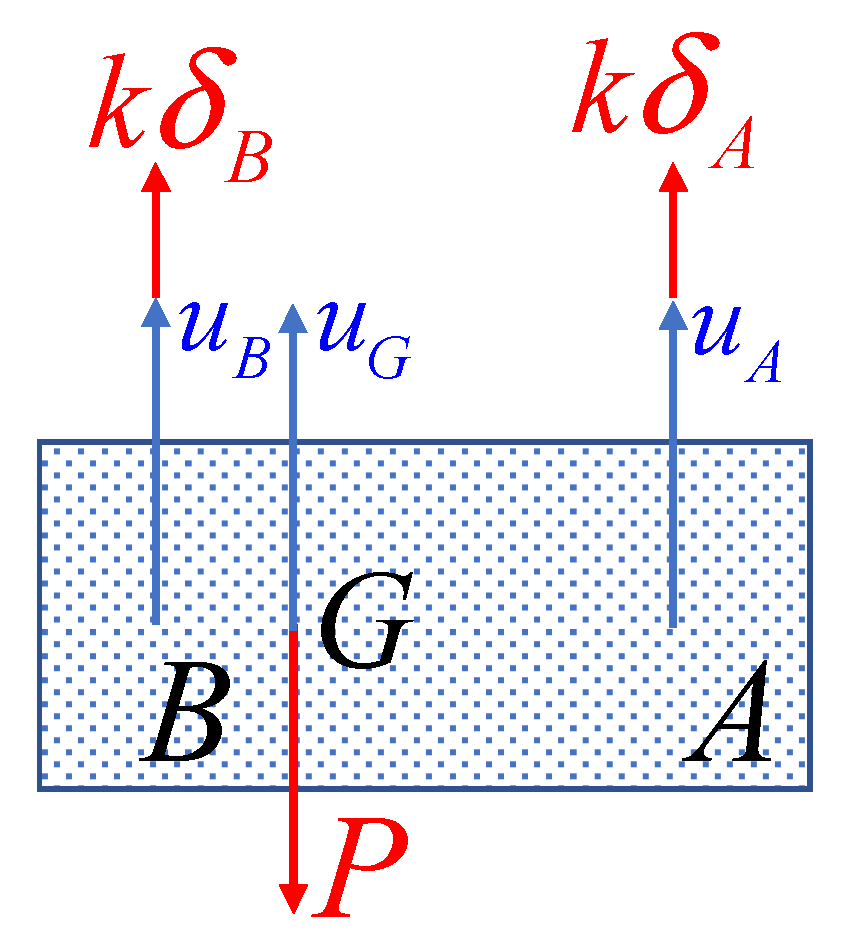
3. Mechanical Analysis of a Bus Running on an Uneven Road
3.1. Road Condition I
3.2. Road Condition II
3.3. Road Condition III
4. Mechanical Responses of Bus in Driving under the Coupling Effect of Speed and Uneven Road Surface
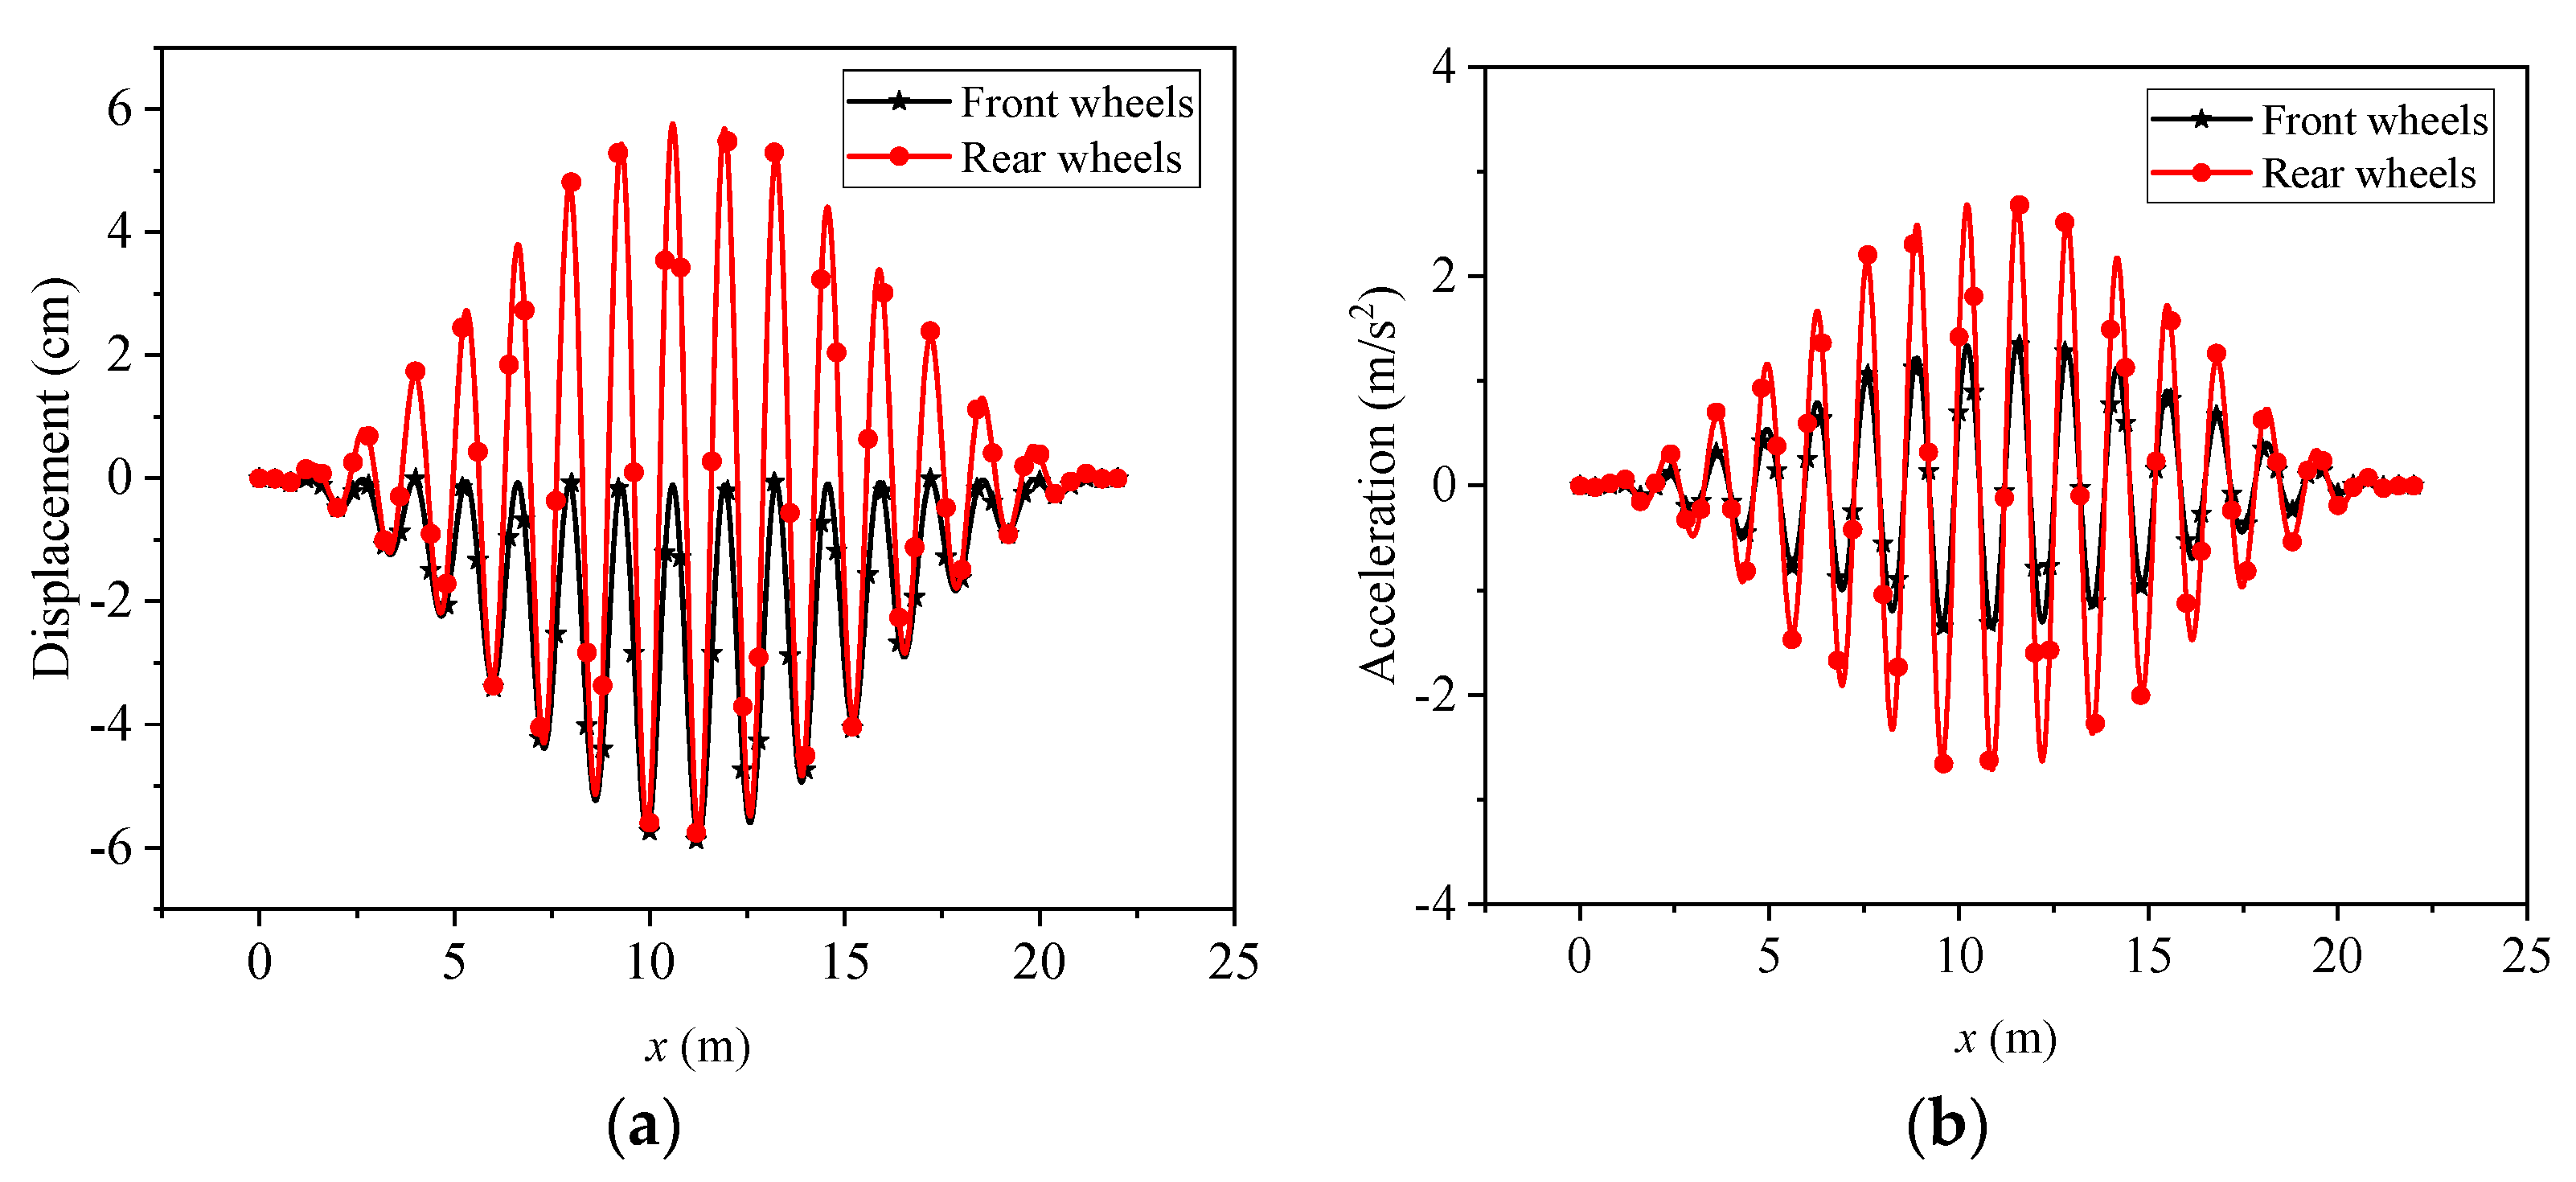
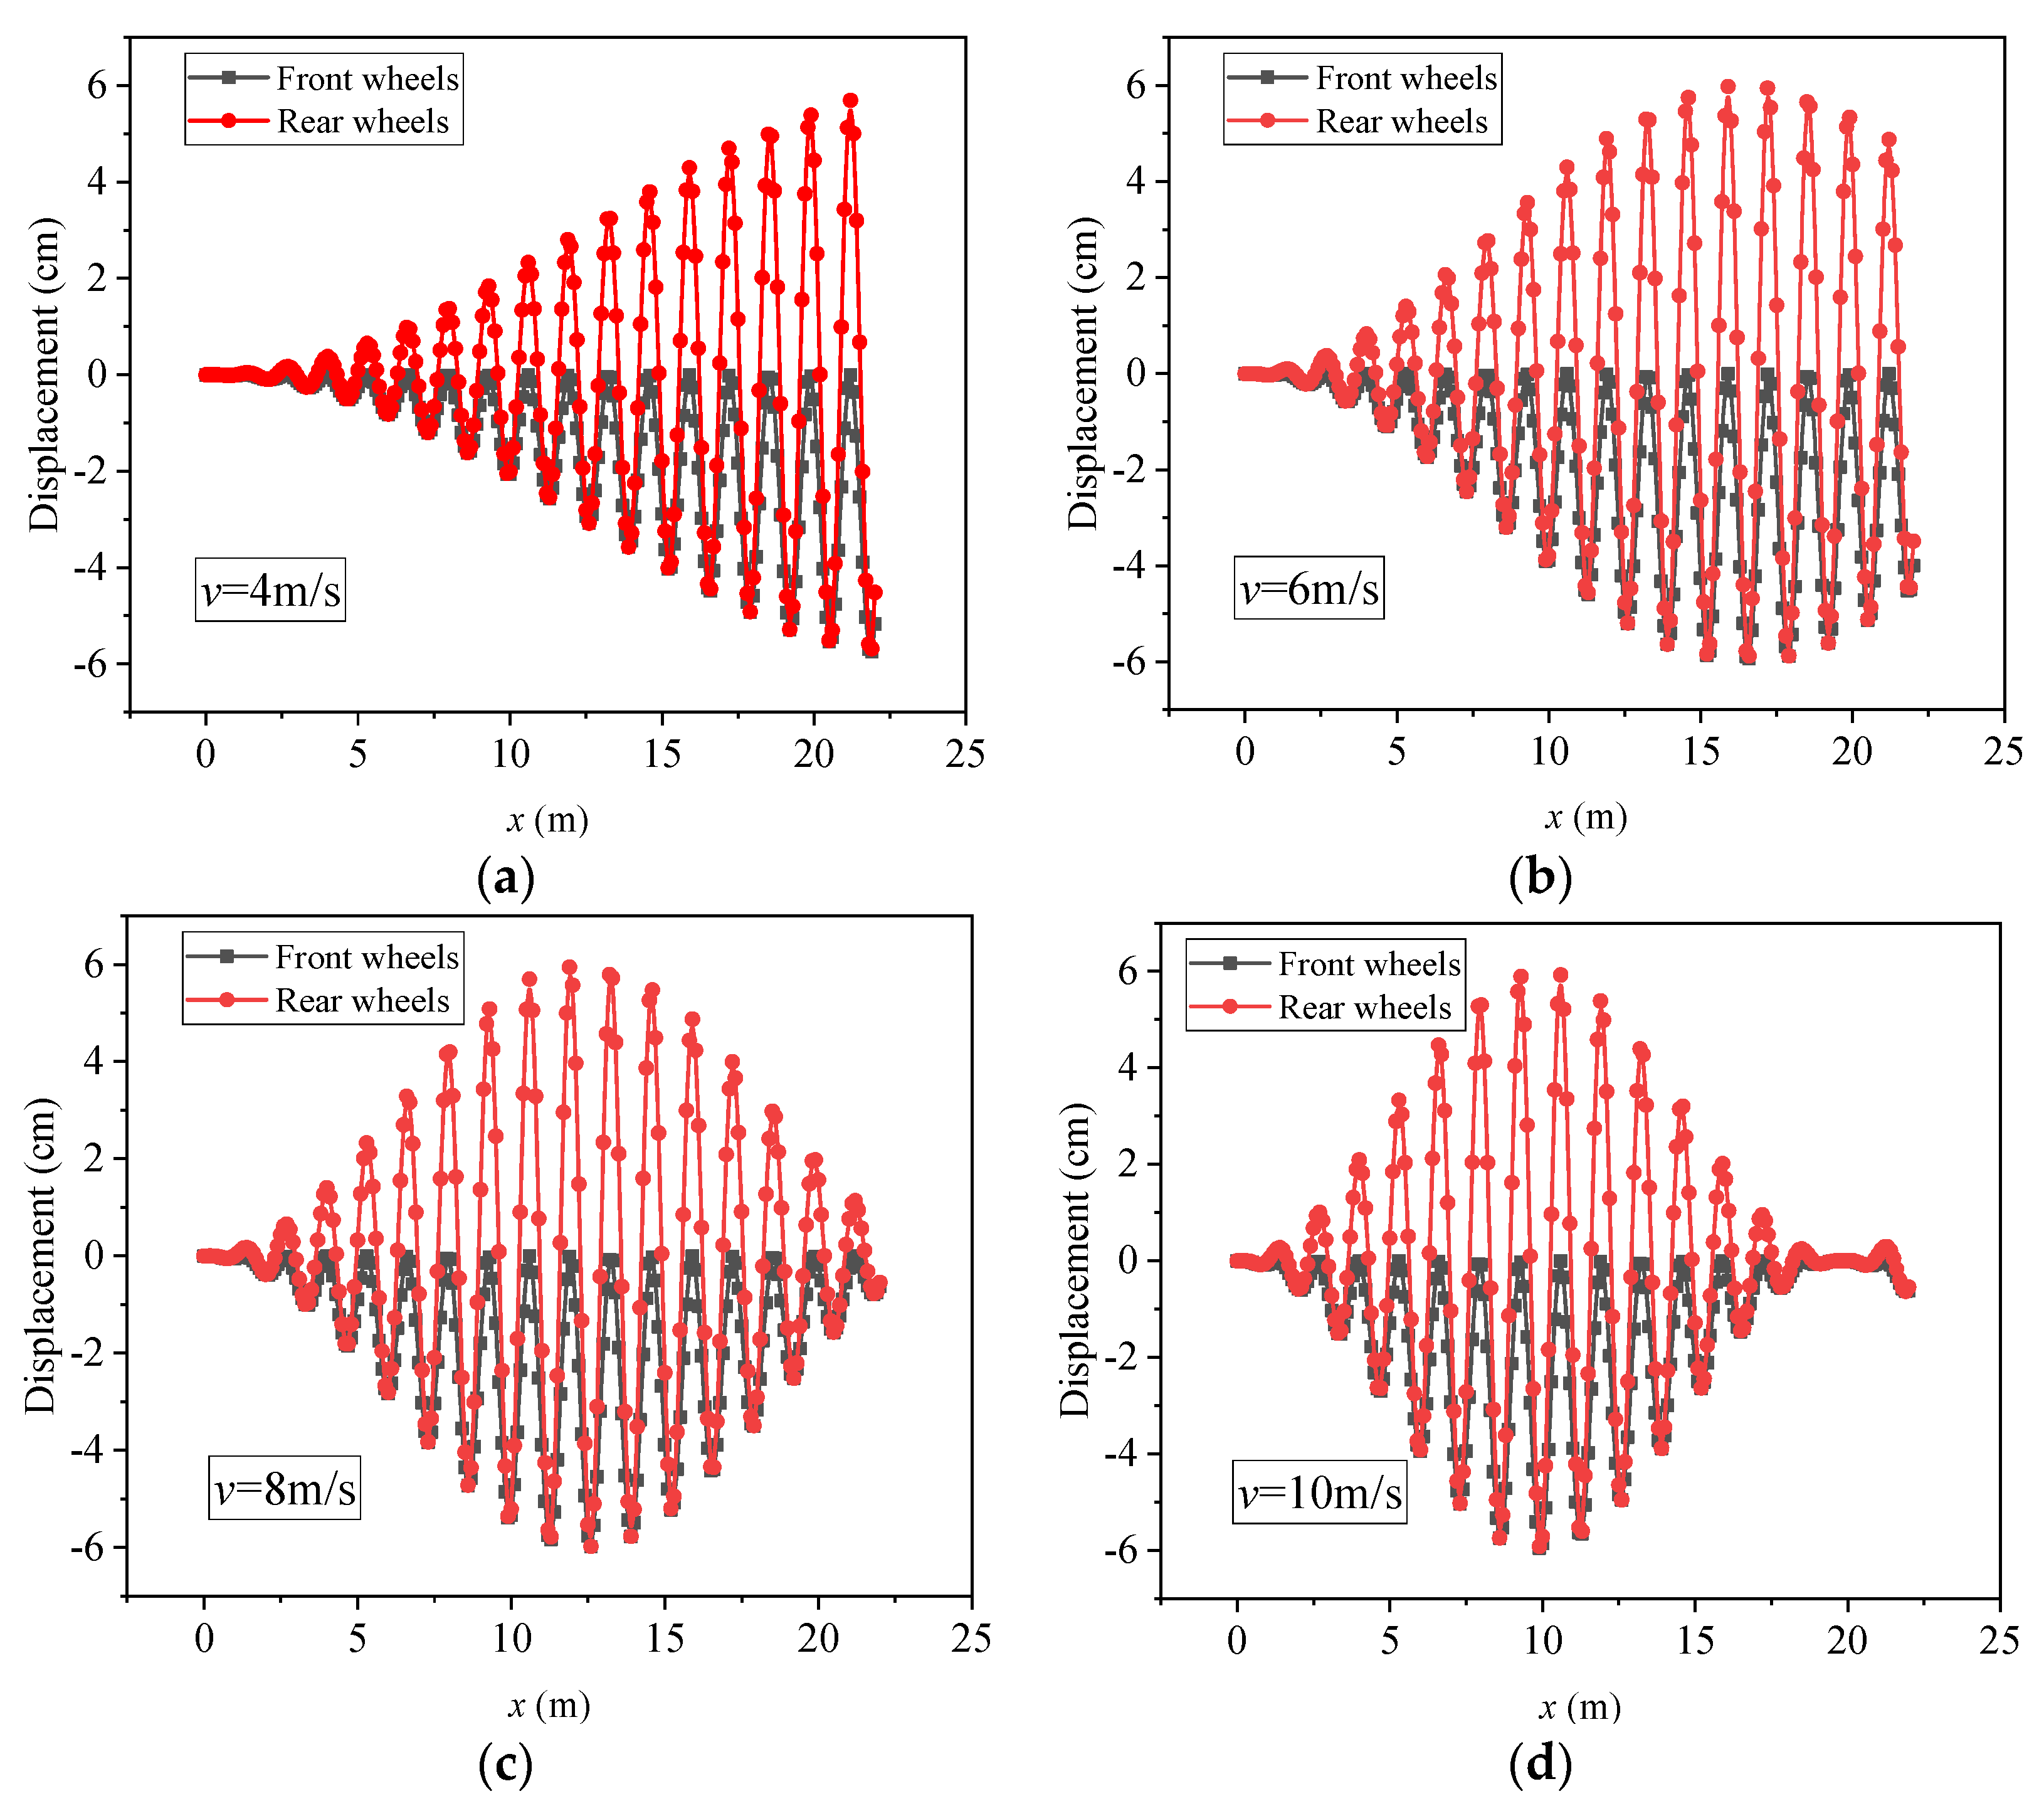
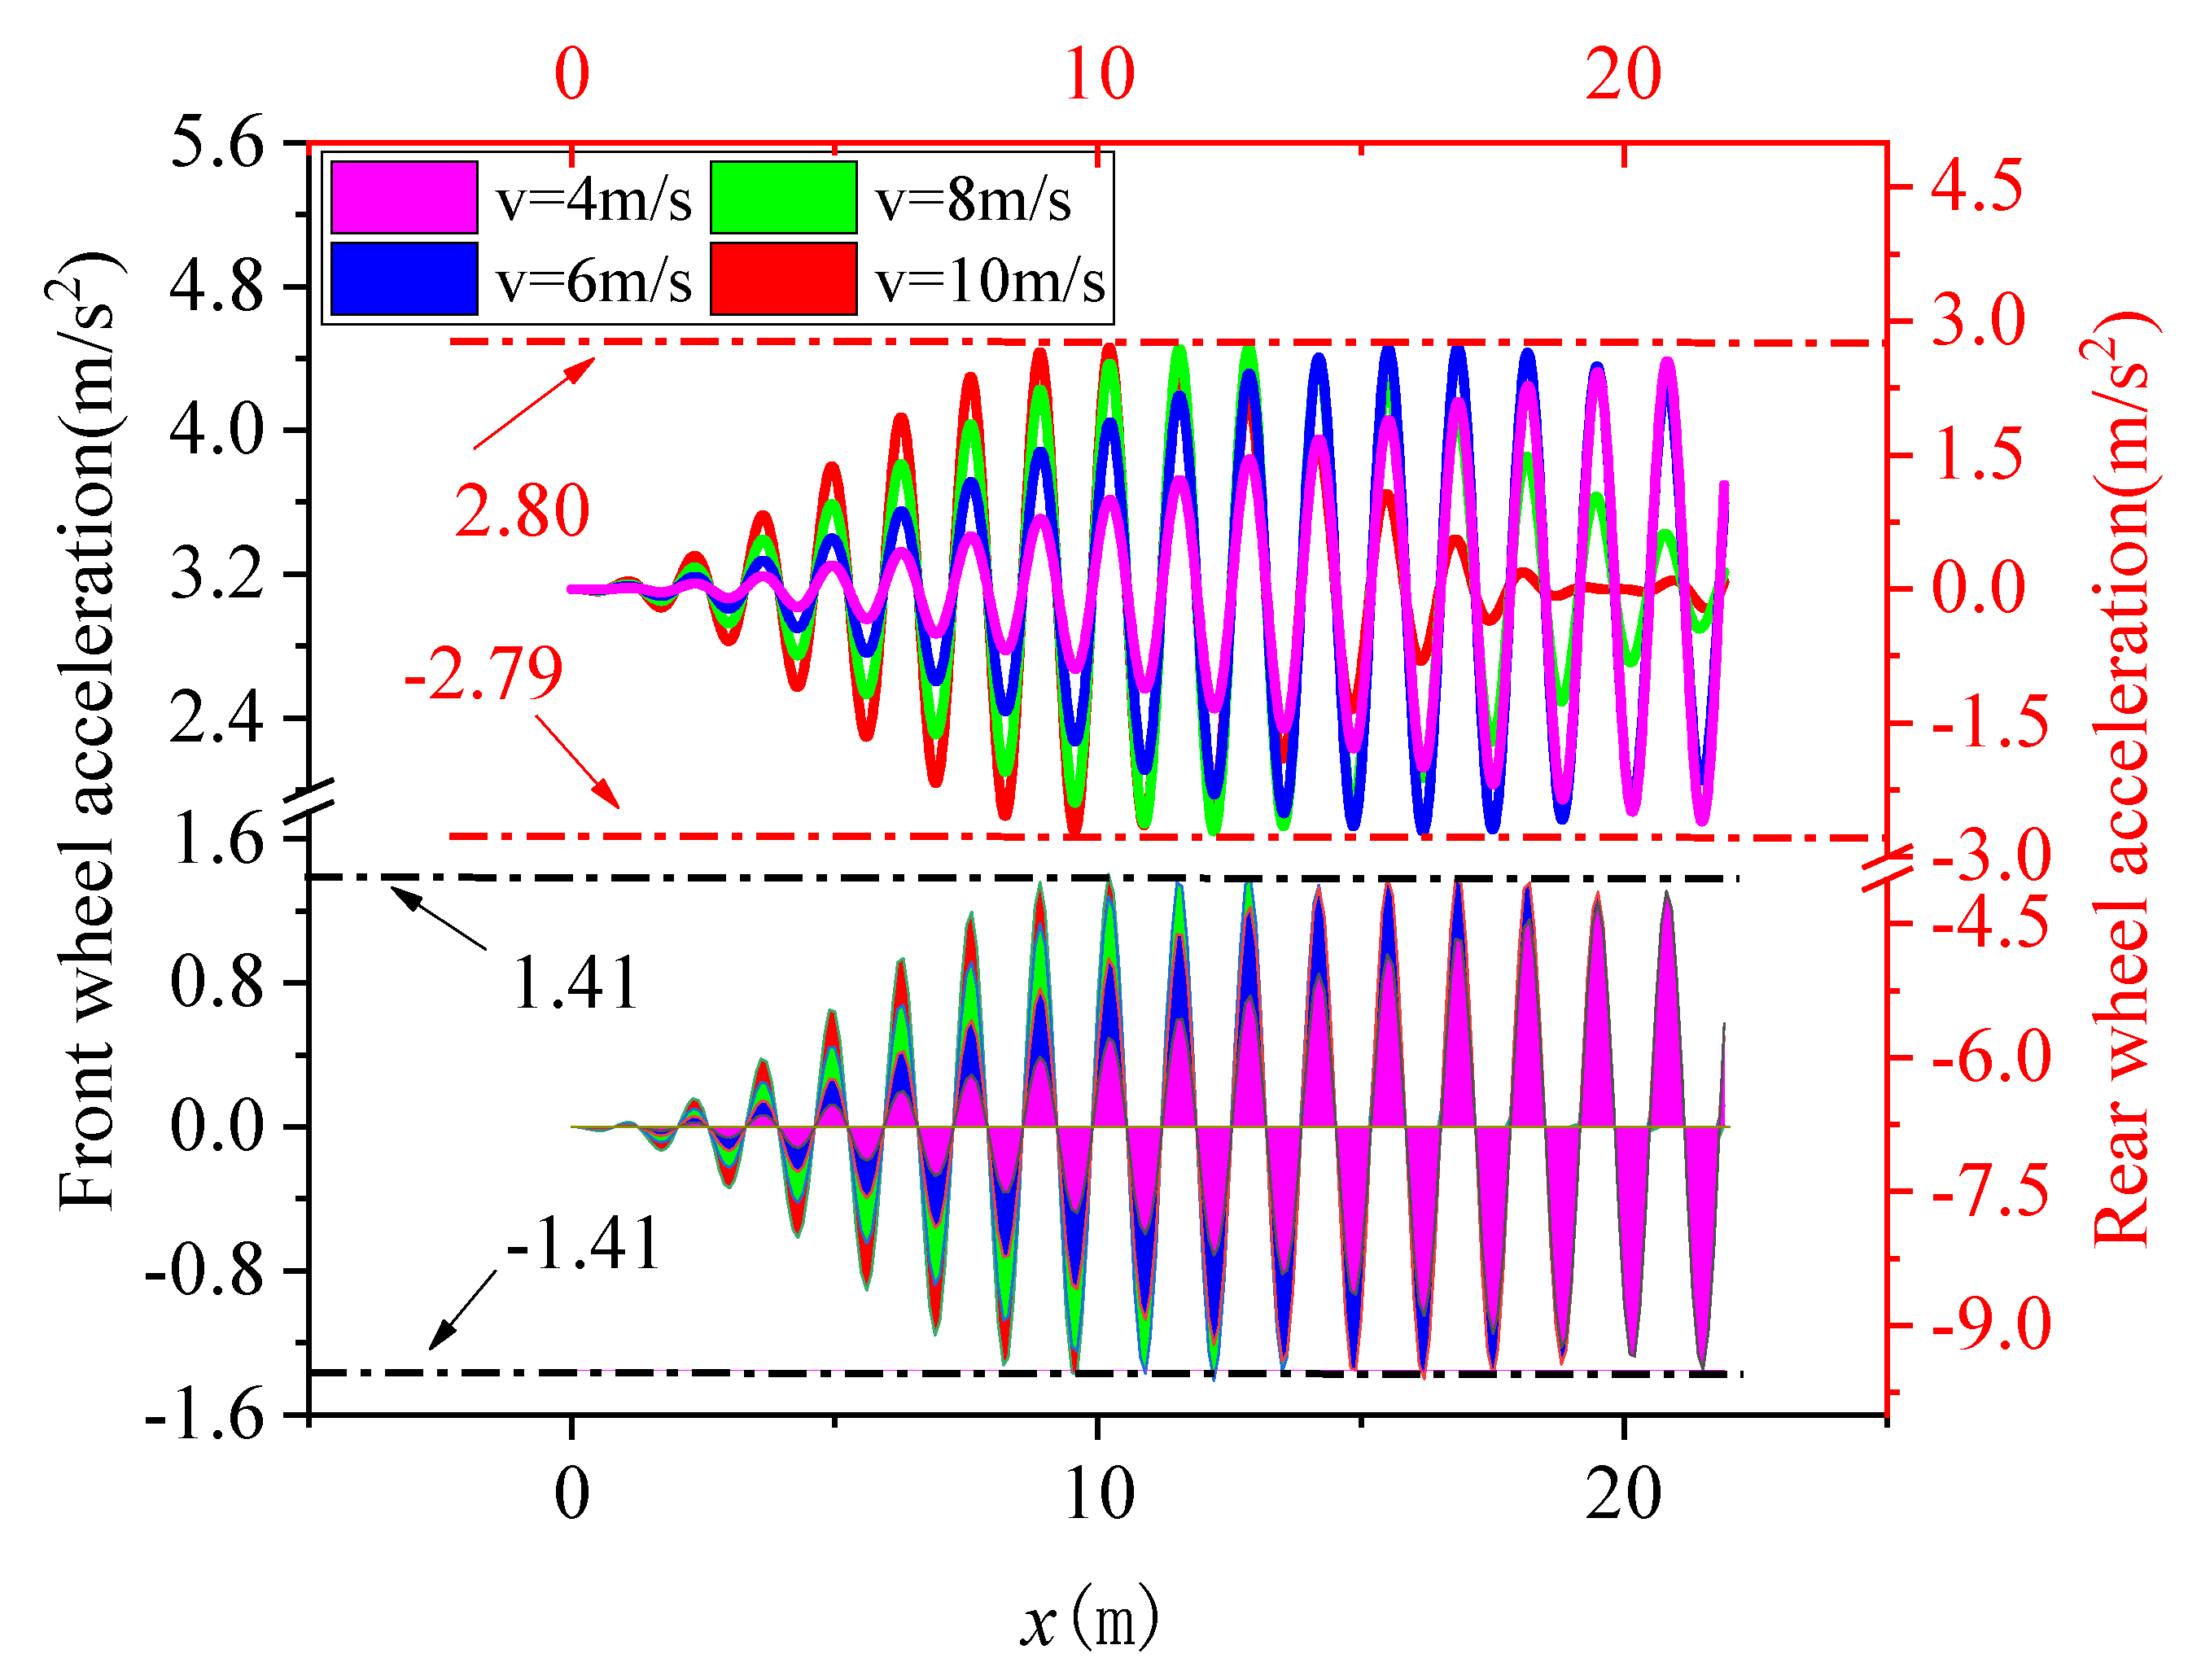
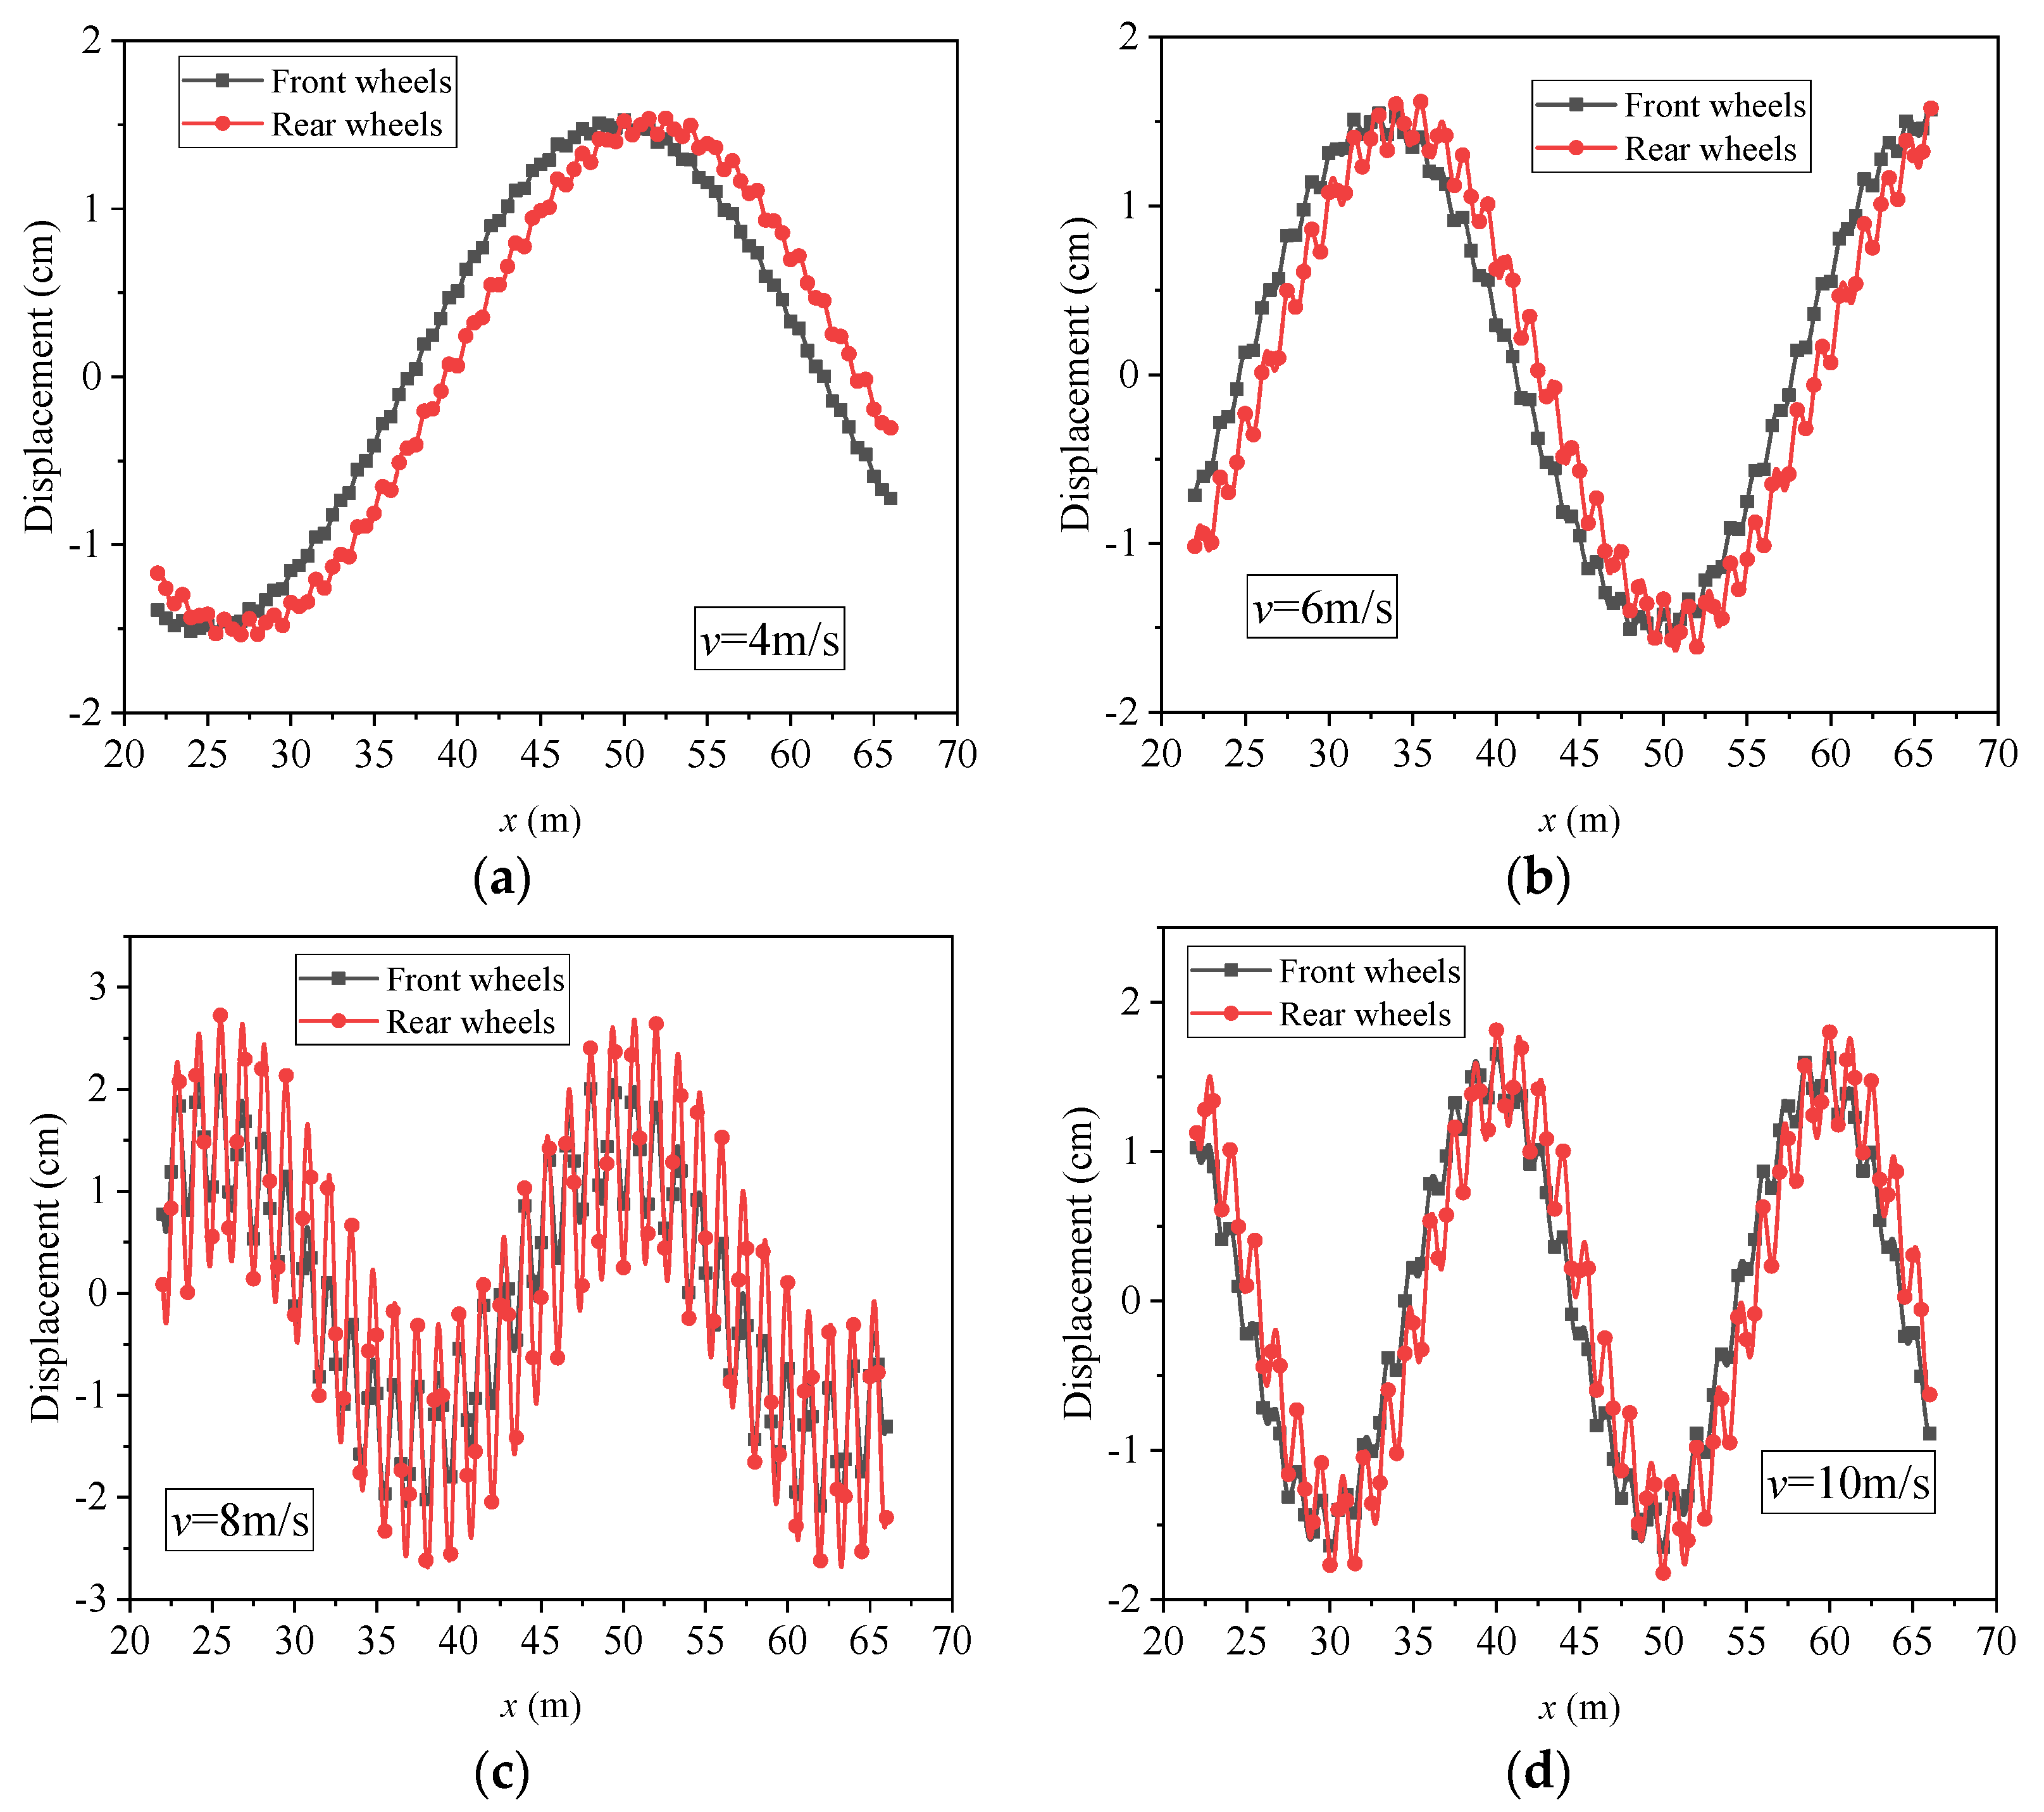
4.1. Road Condition I
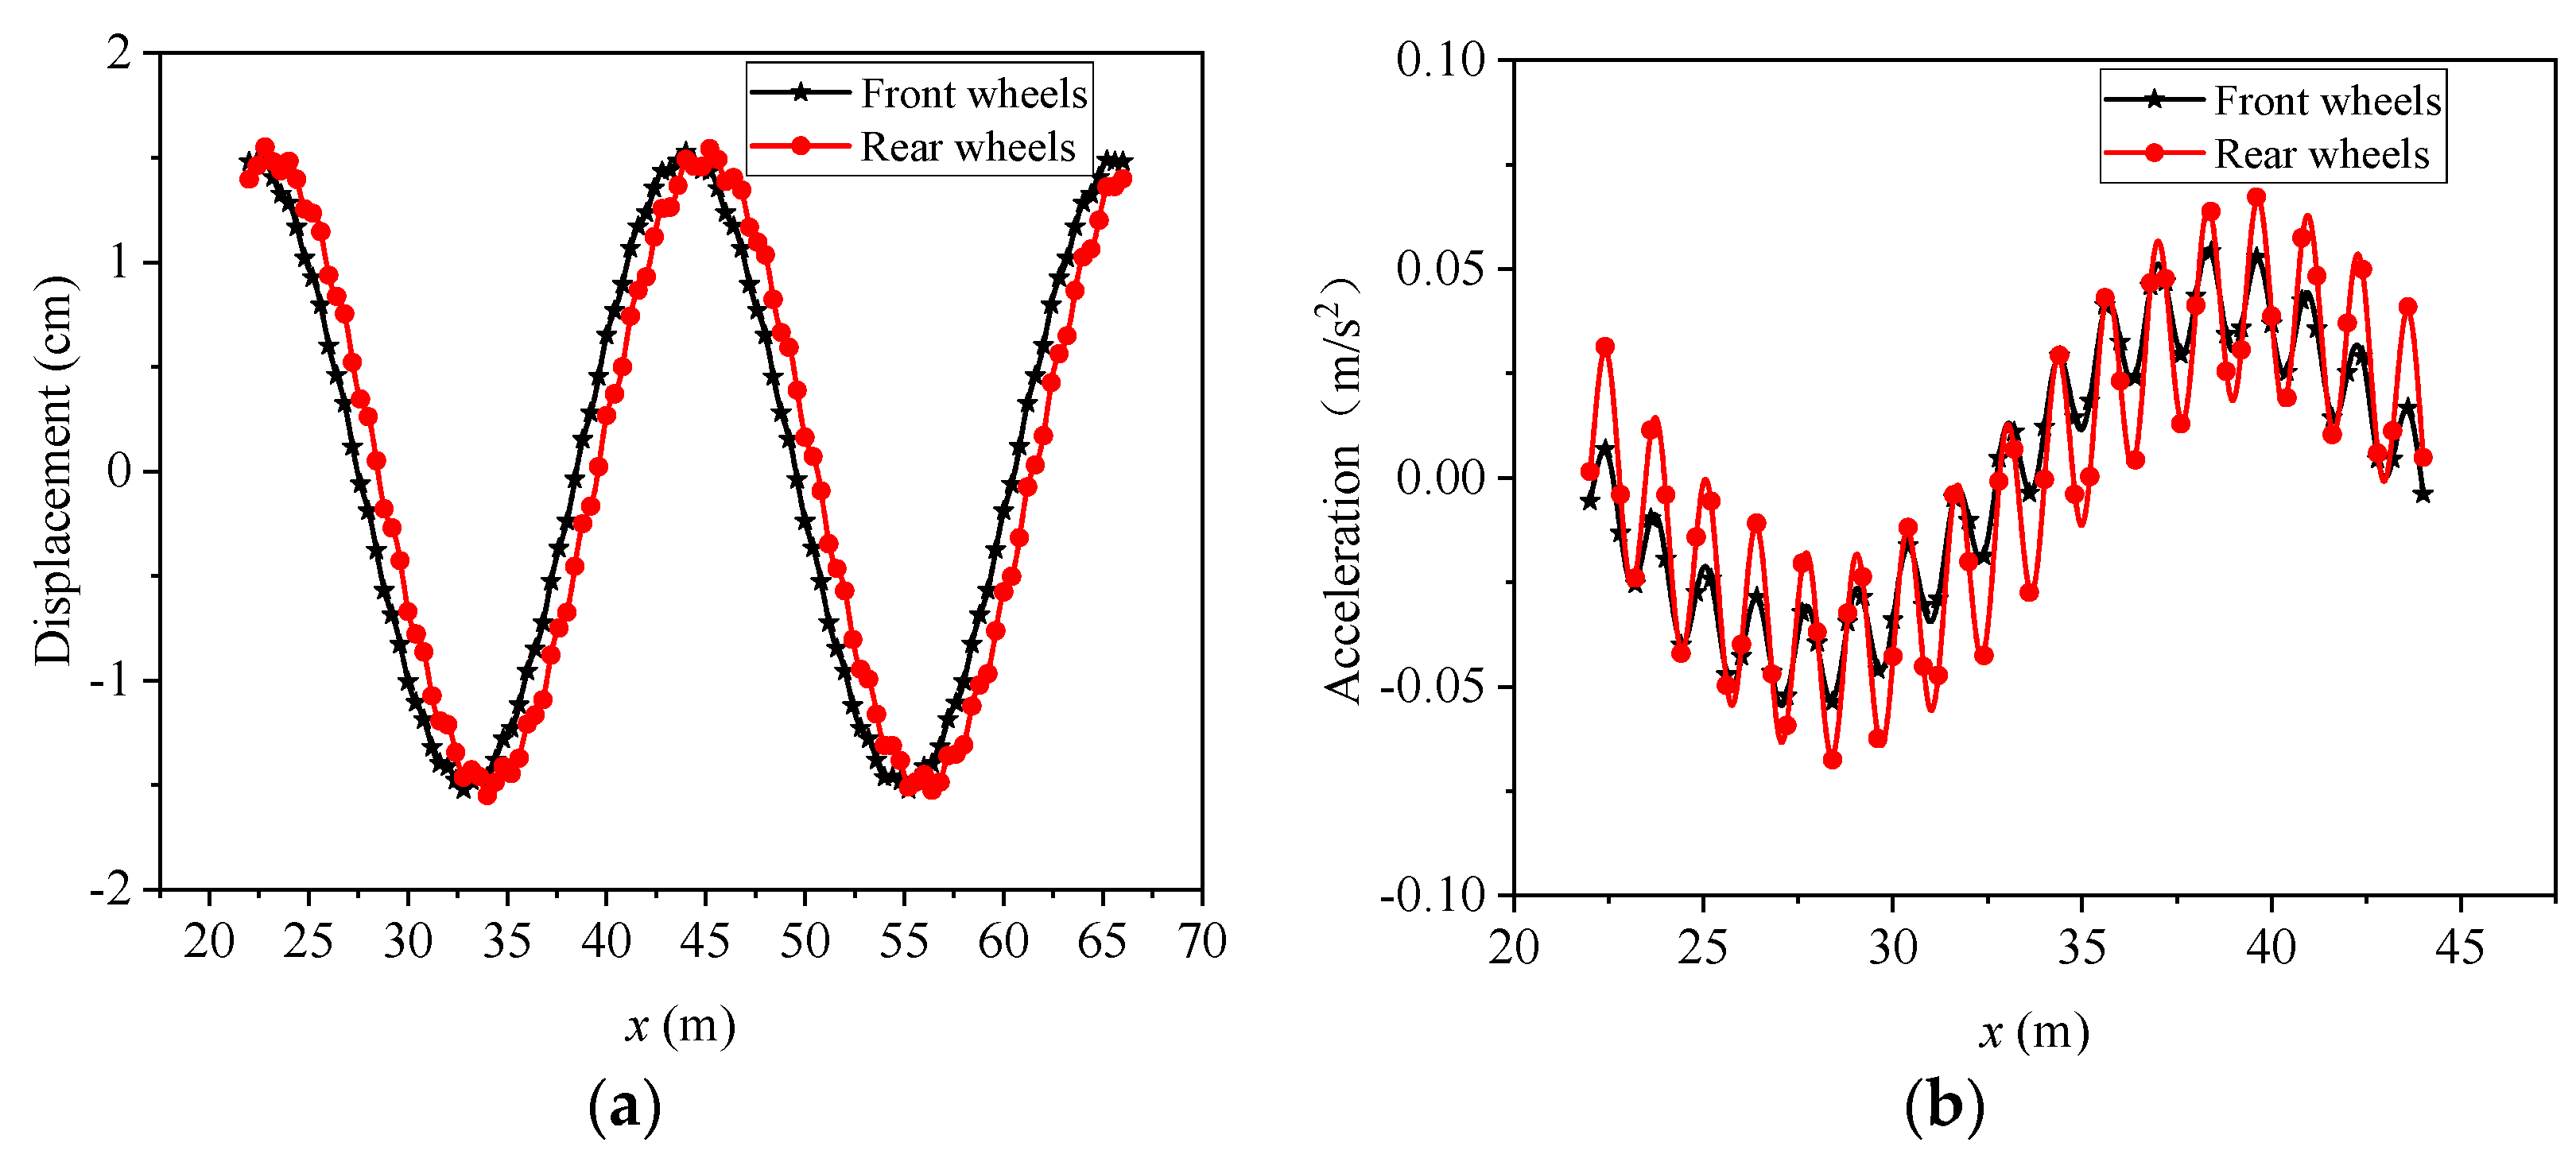
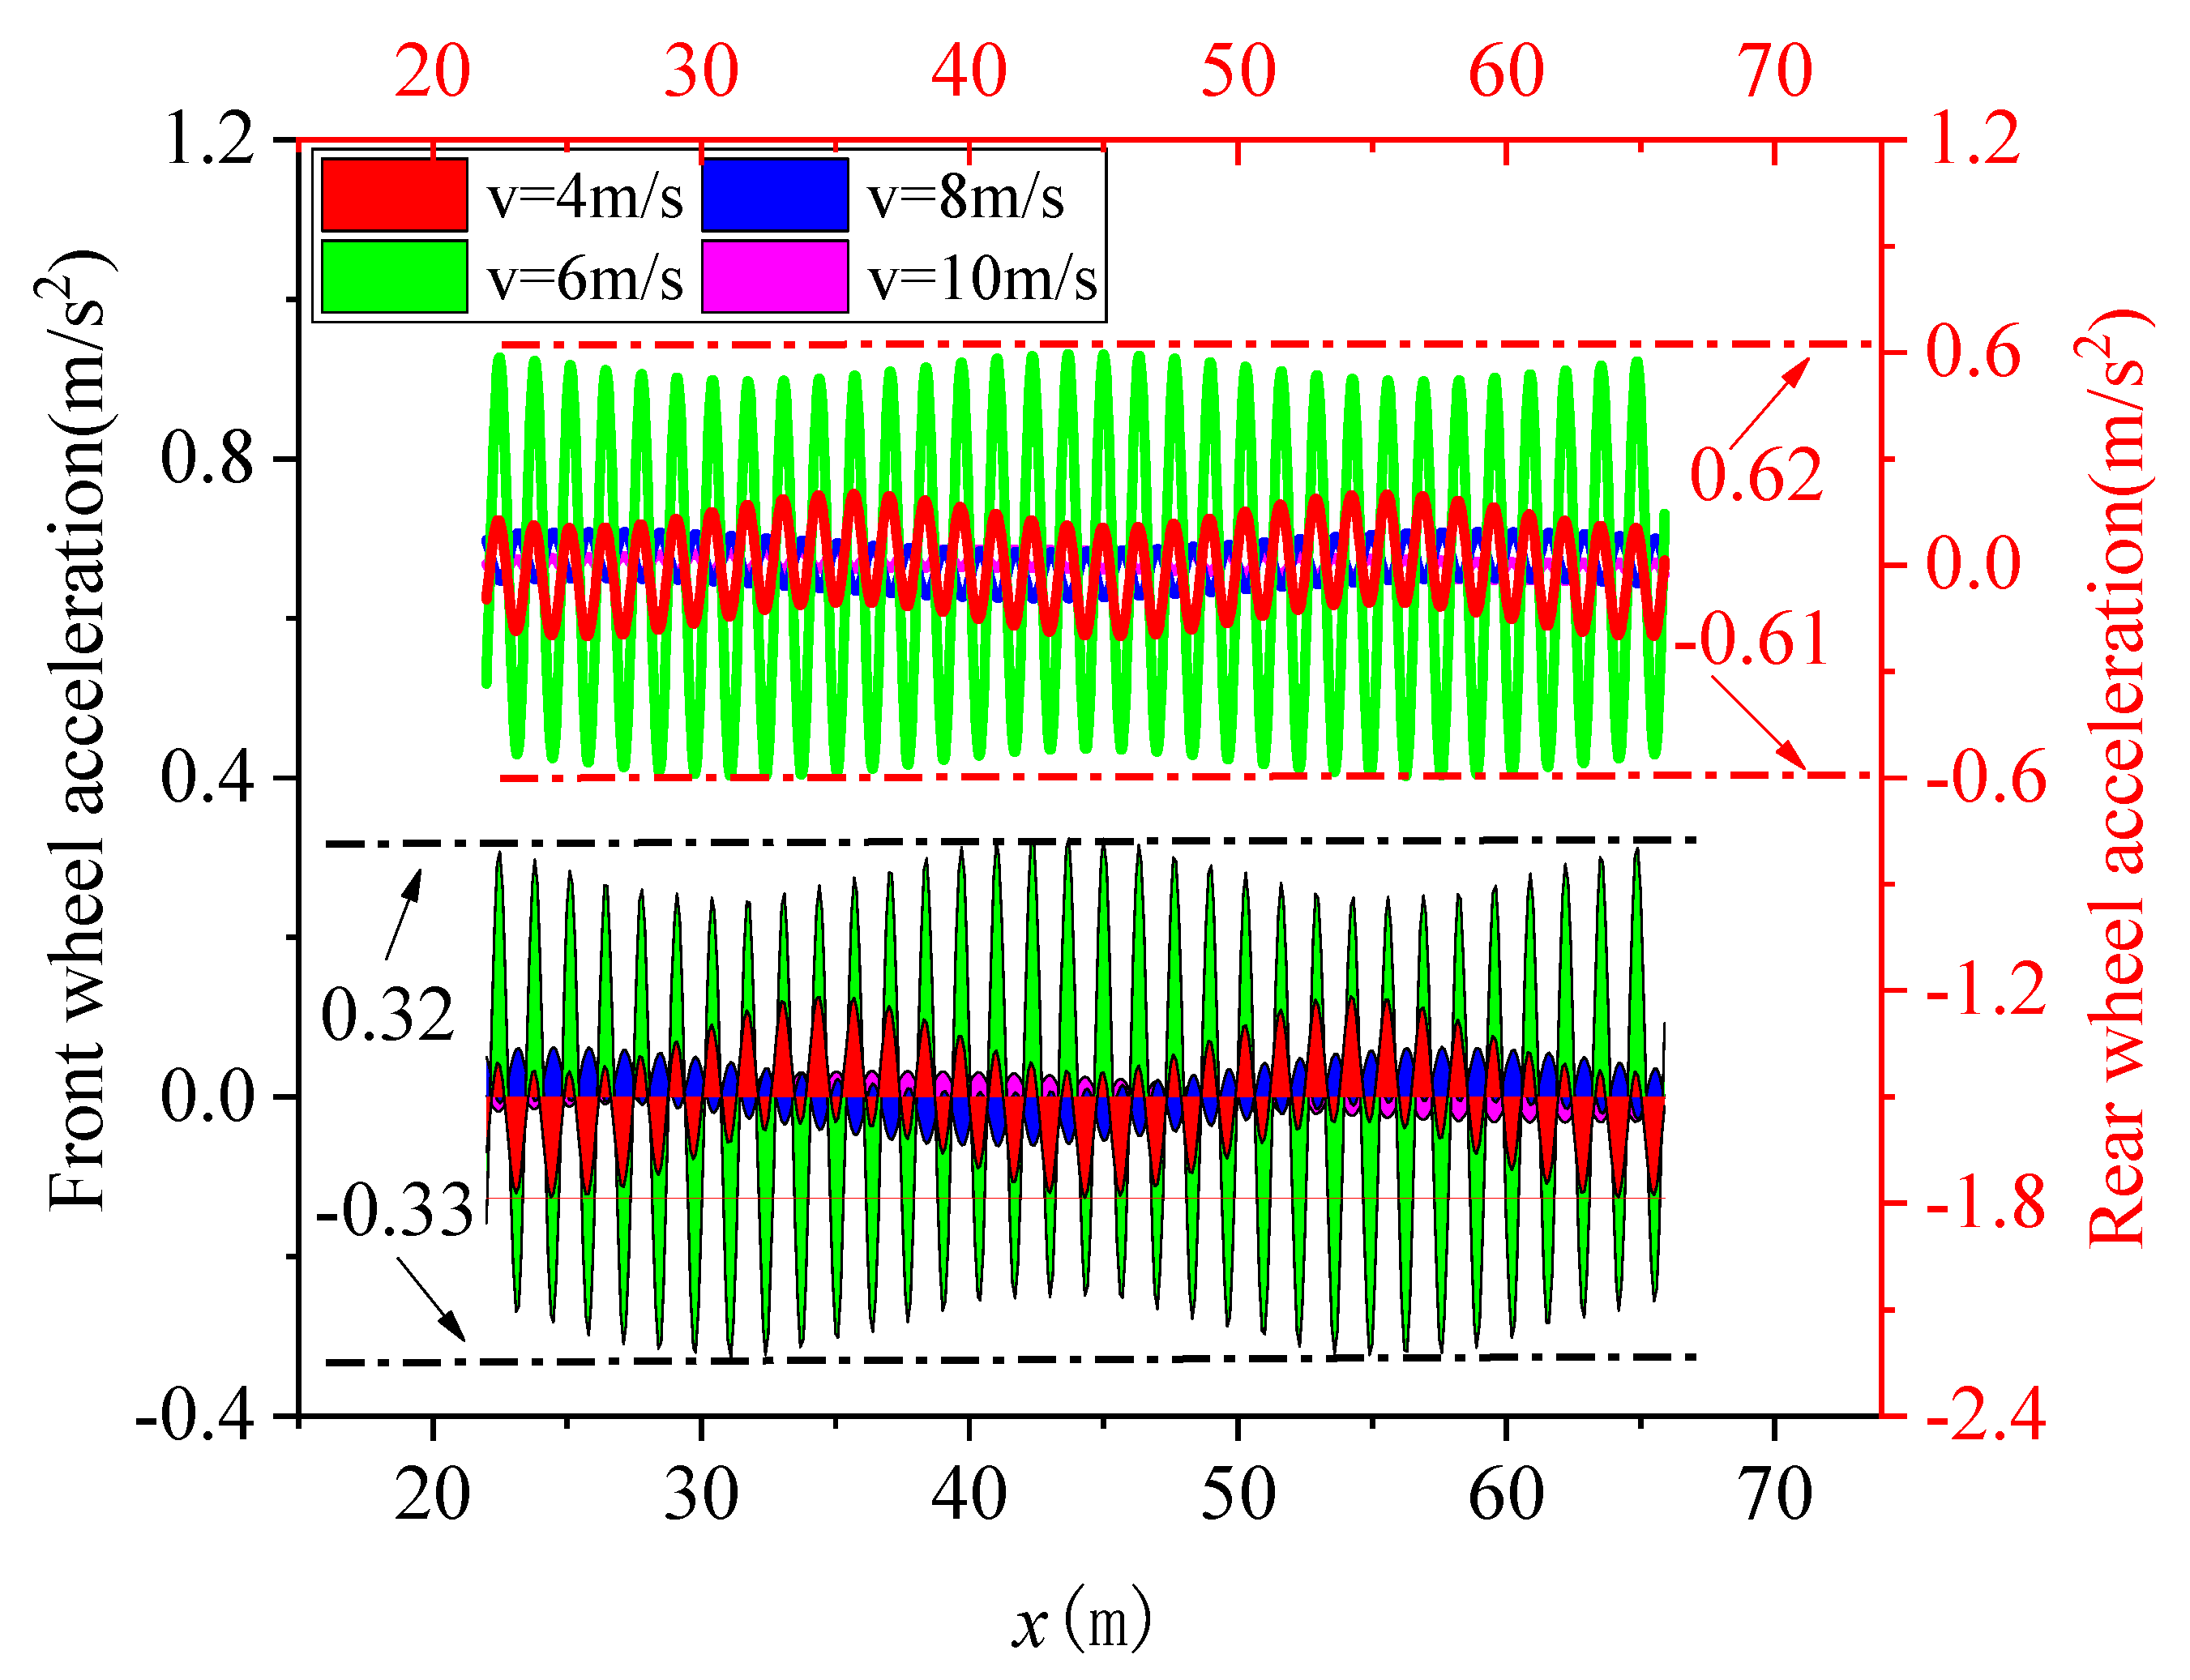
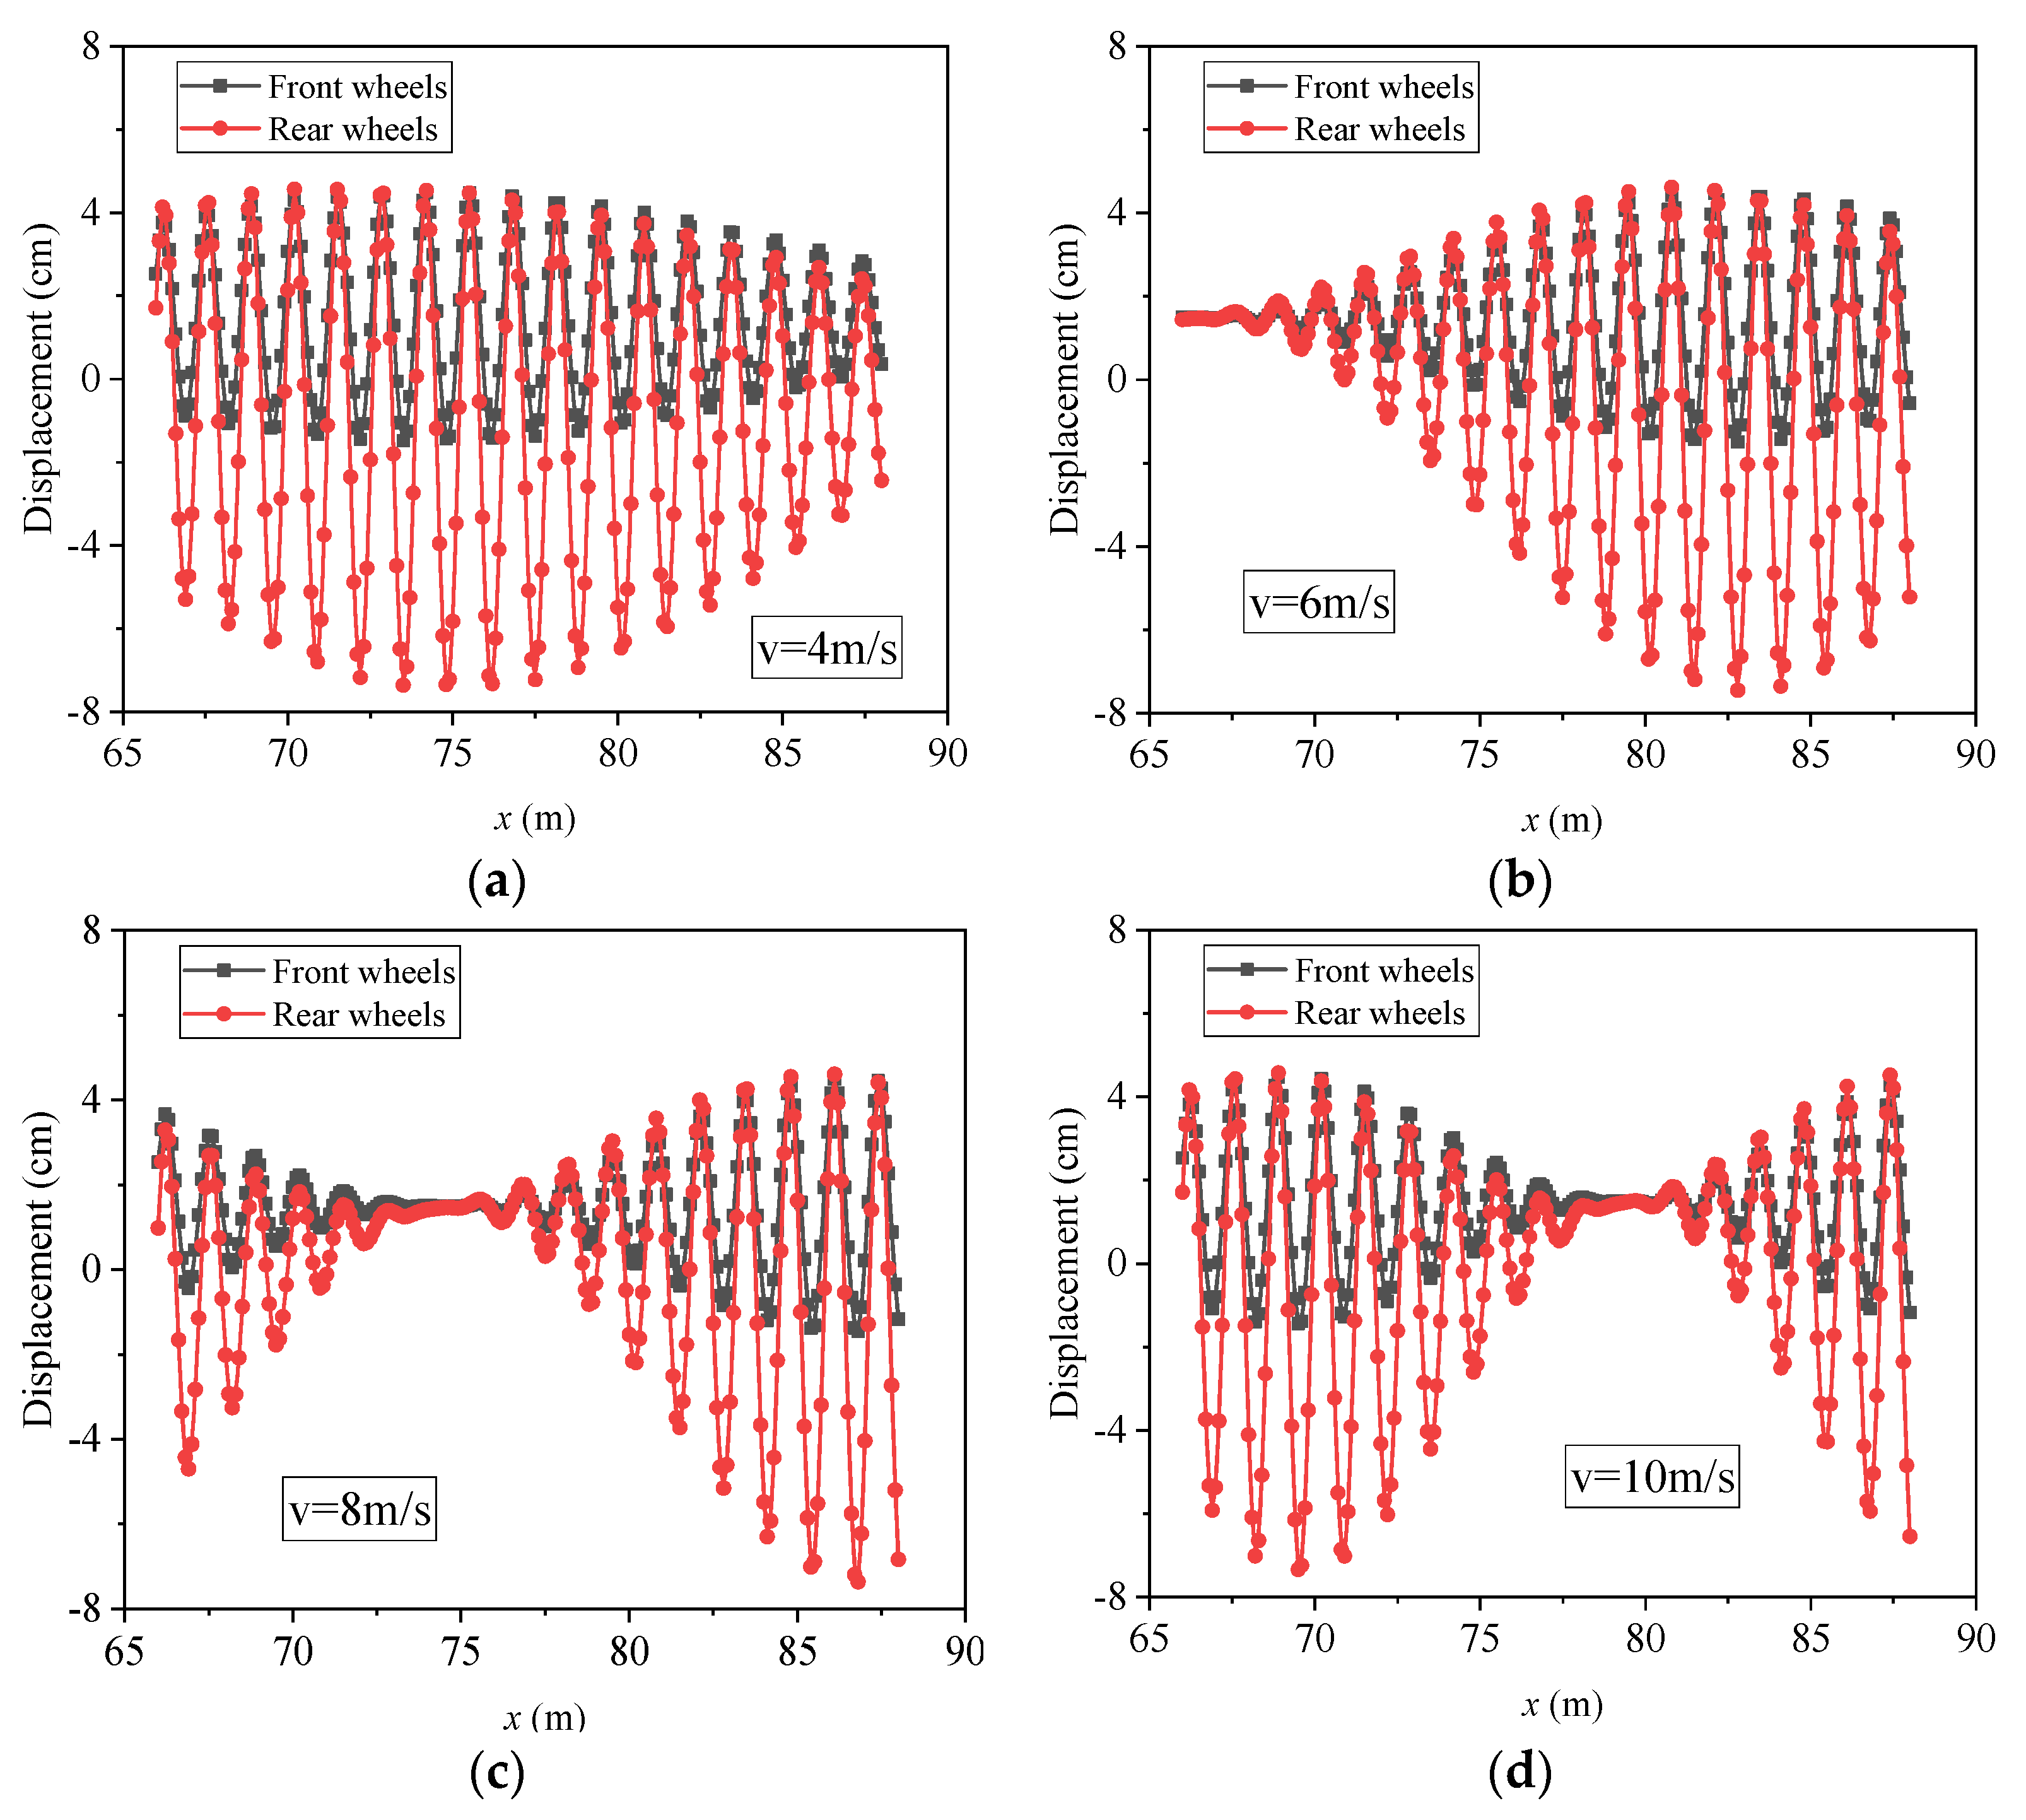
4.2. Road Condition II
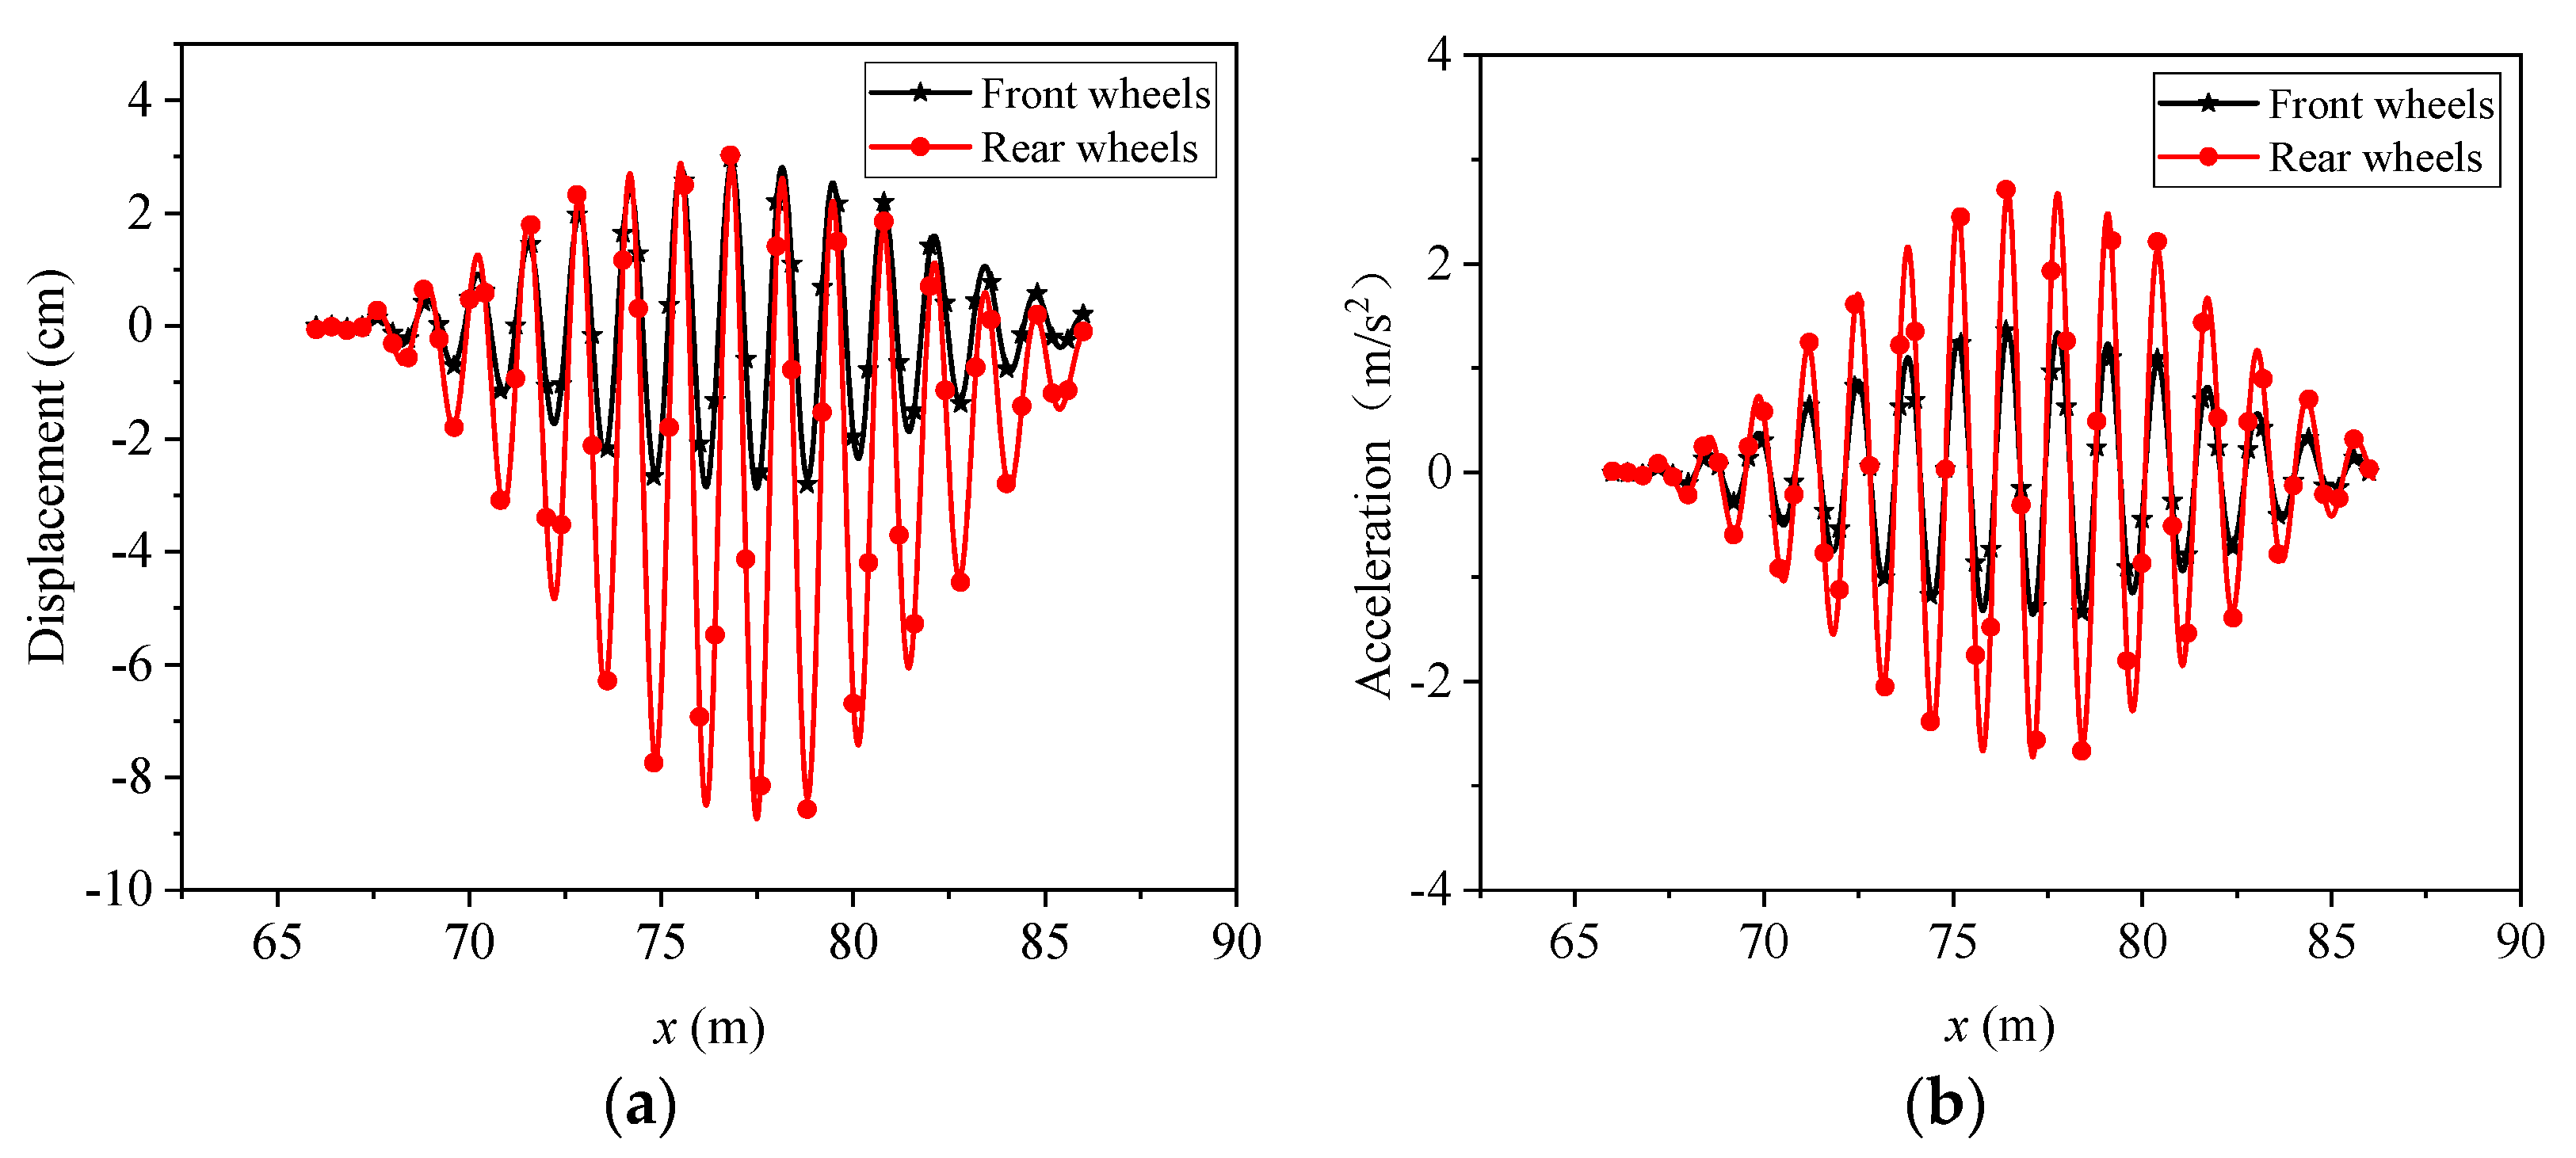
4.3. Road Condition III
5. Mechanical Responses of Bus in Driving under the Coupling of Spring Stiffness and Uneven Pavement
5.1. Road Condition I
5.2. Road Condition II
5.3. Road Condition III
6. Conclusions
Author Contributions
Funding
Informed Consent Statement
Data Availability Statement
Conflicts of Interest
References
- Kuys, J.; Melles, G.; Al Mahmud, A.; Thompson-Whiteside, S.; Kuys, B. Human centred design considerations for the development of sustainable public transportation in Malaysia. Appl. Sci. 2022, 12, 12493. [Google Scholar] [CrossRef]
- Coermann, R.R. The mechanical impedance of the human body in sitting and standing position at low frequencies. Hum. Factors 1962, 4, 227–253. [Google Scholar] [CrossRef]
- Gao, J.H.; Hou, Z.C.; He, L.; Xia, Q.S. Vertical vibration characteristics of seated human bodies and a biodynamic model with two degrees of freedom. Sci. China Technol. Sci. 2011, 54, 2776–2784. (In Chinese) [Google Scholar] [CrossRef]
- Bazil, B.; Griffin, M.J. Equivalent comfort contours for vertical seat vibration: Effect of vibration magnitude and backrest inclination. Ergonomics 2012, 55, 909–922. [Google Scholar]
- Xie, W.P.; Zhang, H.; He, W. Field measurement for vehicle induced vibration of a multi-story 3-D bus station. J. Vib. Shock 2020, 39, 138–245. (In Chinese) [Google Scholar]
- Zhou, Z.; Griffin, M.J. Response of the seated human body to whole-body vertical vibration: Discomfort caused by sinusoidal vibration. Ergonomics 2014, 57, 714–732. [Google Scholar] [CrossRef] [PubMed]
- Oboknb, D.J.; Clarke, M.J. The development of questionnaire surveys for the investigation of passenger comfort. Ergonomics 1973, 16, 855–869. [Google Scholar] [CrossRef]
- EN 13816; Transportation-Logistics and Services, European Standard EN 13816: Public Passenger Transport-Service Quality Definition, Targeting and Measurement. EN: Washington, DC, USA, 2002.
- Prashanth, A.S.; Saran, V.H.; Harsha, S.P. December. Study of subjective responses on ride comfort in public transport Uttarakhand State buses. In Proceedings of the 1st International and 16th National Conference on Machines and Mechanisms (iNaCoMM), Roorkee, India, 18–20 December 2013; pp. 1–5. [Google Scholar]
- Zhang, K.; Zhou, K.; Zhang, F. Evaluating bus transit performance of Chinese cities: Developing an overall bus comfort model. Transp. Res. Part A Policy Pract. 2014, 69, 105–112. [Google Scholar] [CrossRef]
- das Neves Almeida, M.; de Paula Xavier, A.A.; Michaloski, A.O. A review of thermal comfort applied in bus cabin environments. Appl. Sci. 2020, 10, 8648. [Google Scholar] [CrossRef]
- Kilikevičius, A.; Kilikevičienė, K.; Matijošius, J. Investigation of drivers’ comfort factors influencing urban traffic safety. In Vision Zero for Sustainable Road Safety in Baltic Sea Region, Proceedings of the International Conference “Vision Zero for Sustainable Road Safety in Baltic Sea Region”, Vilnius, Lithuania, 5–6 December 2018; Springer International Publishing: Berlin/Heidelberg, Germany, 2020; pp. 159–165. [Google Scholar]
- Zhou, X.; Liu, Y.; Luo, M.; Zheng, S.; Yang, R.; Zhang, X. Overall and thermal comfort under different temperature, noise, and vibration exposures. Indoor Air 2022, 32, e12915. [Google Scholar] [CrossRef]
- Mathes, M.; Schmidt, M.; Käsgen, J.; Fievet, B.; Tichelen, P.V.; Berecibar, M.; Al-Saadi, M. Heavy-duty battery electric buses’ integration in cities based on superfast charging technologies: Impact on the urban life. Sustainability 2022, 14, 4777. [Google Scholar] [CrossRef]
- Lin, C.Y.; Chen, L.J.; Chen, Y.Y.; Lee, W.C. A comfort measuring system for public transportation systems using participatory phone sensing. ACM Phonesense 2010. Available online: https://www.iis.sinica.edu.tw/papers/cclljj/11583-F.pdf (accessed on 4 March 2023).
- Wåhlberg, A.E.A. Short-term effects of training in economical driving: Passenger comfort and driver acceleration behavior. Int. J. Ind. Ergon. 2006, 36, 151–163. [Google Scholar] [CrossRef]
- Lin, C.Y.; Chen, L.J. TPE-CMS: A comfort measuring system for public bus service in Taipei city. In Proceedings of the International Conference on Computer Communication, Nagpur, Maharashtra, India, 21–22 April 2011. [Google Scholar]
- EN 12299; Railway Applications: Ride Comfort for Passengers—Measurement and Evaluation. EN: Washington, DC, USA, 2009.
- Sekulić, D.; Dedović, V.; Rusov, S.; Šalinić, S.; Obradović, A. Analysis of vibration effects on the comfort of intercity bus users by oscillatory model with ten degrees of freedom. Appl. Math. Model. 2013, 37, 8629–8644. [Google Scholar] [CrossRef]
- Sekulić, D.; Dedović, V.; Rusov, S.; Obradović, A.; Šalinić, S. Definition and determination of the bus oscillatory comfort zones. Int. J. Ind. Ergon. 2016, 53, 328–339. [Google Scholar] [CrossRef]
- Sekulić, D.; Rusov, S.; Dedović, V.; Šalinić, S.; Mladenović, D.; Ivković, I. Analysis of bus users’ vibration exposure time. Int. J. Ind. Ergon. 2018, 65, 26–35. [Google Scholar] [CrossRef]
- Castellanos, J.C.; Fruett, F. Embedded system to evaluate the passenger comfort in public transportation based on dynamical vehicle behavior with user’s feedback. Measurement 2014, 47, 442–451. [Google Scholar] [CrossRef]
- Maternini, G.; Cadei, M. A comfort scale for standing bus passengers in relation to certain road characteristics. Transp. Lett. 2014, 6, 136–141. [Google Scholar] [CrossRef]
- Sekulić, D.; Mladenović, D. Evaluation and analysis of vibration effects on bus users. ЗБОРНИК НА ТРУДОВИ 2016, 342, 435–444. [Google Scholar]
- Vovsha, P.; Oliveira, M.G.S.; Davidson, W.; Chu, C.; Farley, R.; Mitchell, M.; Vyas, G. Statistical analysis of transit user preferences including in-vehicle crowding and service reliability. In Proceedings of the Transportation Research Board 93rd Annual Meeting, Washington, DC, USA, 12–16 January 2014. [Google Scholar]
- Zhao, H.; Guo, L.L.; Zeng, X.Y. Evaluation of bus vibration comfort based on passenger crowdsourcing mode. Math. Probl. Eng. 2016, 2016, 2132454. [Google Scholar] [CrossRef]
- Eboli, L.; Mazzulla, G.; Pungillo, G. Measuring bus comfort levels by using acceleration instantaneous values. Transp. Res. Procedia 2016, 18, 27–34. [Google Scholar] [CrossRef]
- Shen, X.; Feng, S.; Li, Z.; Hu, B. Analysis of bus passenger comfort perception based on passenger load factor and in-vehicle time. SpringerPlus 2016, 5, 62. [Google Scholar] [CrossRef] [PubMed]
- Barabino, B.; Eboli, L.; Mazzulla, G.; Mozzoni, S.; Murru, R.; Pungillo, G. An innovative methodology to define the bus comfort level. Transp. Res. Procedia 2019, 41, 461–470. [Google Scholar] [CrossRef]
- Meiping, Y.; Wen, W.A.N.G. Smartphone based research of measurement indexes related to bus riding comfort. J. Tongji Univ. (Nat. Sci.) 2017, 45, 1143–1149. [Google Scholar]
- Nguyen, T.; NguyenDinh, N.; Lechner, B.; Wong, Y.D. Insight into the lateral ride discomfort thresholds of young-adult bus passengers at multiple postures: Case of Singapore. Case Stud. Transp. Policy 2019, 7, 617–627. [Google Scholar] [CrossRef]
- Wang, G.; Zhang, J.; Kong, X. Study on passenger comfort based on human–bus–road coupled vibration. Appl. Sci. 2020, 10, 3254. [Google Scholar] [CrossRef]
- Bae, I.; Moon, J.; Seo, J. Toward a comfortable driving experience for a self-driving shuttle bus. Electronics 2019, 8, 943. [Google Scholar] [CrossRef]
- Nguyen, T.; Nguyen-Phuoc, D.Q.; Wong, Y.D. Developing artificial neural networks to estimate real-time onboard bus ride comfort. Neural Comput. Appl. 2021, 33, 5287–5299. [Google Scholar] [CrossRef]
- Szumska, E.M.; Stańczyk, T.L.; Zuska, A.; Grabski, P.; Jaśkiewicz, M.; Jurecki, R.; Kurczyński, D.; Łagowski, P. Experimental testing of longitudinal acceleration in urban buses. In IOP Conference Series: Materials Science and Engineering; IOP Publishing: Bristol, UK, 2022; Volume 1247, p. 012017. [Google Scholar]
- Zhang, G.X.; Ye, D. Eleven DOF vehicle dynamics model and comfort simulation. Mach. Des. Manuf. 2017, 1, 43–46. (In Chinese) [Google Scholar]
- Tang, C.; Zhang, T.; Li, H.; Zhou, W. Evaluation of ride comfort of a vehicle. J. Vib. Shock 2009, 27, 158–166. (In Chinese) [Google Scholar]
- Bogsjö, K.; Podgórski, K.; Rychlik, I. Models for road surface roughness. Veh. Syst. Dyn. 2012, 50, 725–747. [Google Scholar] [CrossRef]
- Chen, Z.; Liang, Y.; Xue, B.; Sun, L. Relationship between vehicle vibration characteristics and human ride comfort. J. Tongji Univ. (Nat. Sci.) 2020, 48, 1007–1015. (In Chinese) [Google Scholar]
- Agostinacchio, M.; Ciampa, D.; Olita, S. The vibrations induced by surface irregularities in road pavements—A Matlab approach. Eur. Transp. Res. Rev. 2014, 6, 267–275. [Google Scholar] [CrossRef]
- Wu, J.; Hao, L. Why the rear row of a big car bumps more than the front row. Mech. Eng. 2008, 30, 102–103. (In Chinese) [Google Scholar]
- Song, X.Z. The complementarity of “Why back row seats of a bus are more jolty”. Mech. Eng. 2008, 30, 115. (In Chinese) [Google Scholar]
- Barabino, B.; Coni, M.; Olivo, A.; Pungillo, G.; Rassu, N. Standing passenger comfort: A new scale for evaluating the real-time driving style of bus transit services. IEEE Trans. Intell. Transp. Syst. 2019, 20, 4665–4678. [Google Scholar] [CrossRef]
- Nguyen, T.; Swolana, P.; Lechner, B. An experimental comparison of mathematical heavy-duty city bus models to evaluate passenger ride comfort induced by road roughness. Math. Comput. Model. Dyn. Syst. 2021, 27, 203–221. [Google Scholar] [CrossRef]
- Zhang, H.; Li, X.; Zheng, X.; Liu, H. Analysis of bus maneuverability and stability impact elements based on MATLAB. In Proceedings of the 2010 International Conference on Intelligent Computation Technology and Automation, Changsha, China, 11–12 May 2010; Volume 1, pp. 647–650. [Google Scholar]
- Kong, Y.S.; Omar, M.Z.; Chua, L.B.; Abdullah, S. Ride quality assessment of bus suspension system through modal frequency response approach. Adv. Mech. Eng. 2014, 6, 269721. [Google Scholar] [CrossRef]
- Long, L.X.; Quynh, L.V.; Cuong, B.V. Study on the influence of bus suspension parameters on ride comfort. Vibroeng. Procedia 2018, 21, 77–82. [Google Scholar] [CrossRef]
- Olmeda, E.; Li, E.R.C.; Hernández, J.R.; Díaz, V. Lateral dynamic simulation of a bus under variable conditions of camber and curvature radius. Mathematics 2022, 10, 3081. [Google Scholar] [CrossRef]
- Mei, F.X. On D’Alembert’s Principle—The Sixth Reading Notes of Theoretical Mechanics. Mech. Eng. 2009, 31, 61–63. (In Chinese) [Google Scholar]
- Bus Network. Yutong ZK6105HNGS1 Bus Model Parameters. [EB/OL]. Available online: https://www.chinabuses.com/product/buses/8066.html (accessed on 1 December 2022).
- Xu, J.; Yang, K.; Luo, Q.; Shao, Y. Field measurement of automobiles’ lateral accelerations. J. Southwest Jiaotong Univ. 2014, 27, 536–545. (In Chinese) [Google Scholar]
- Zhang, J.; Wang, G.; Ji, Z.; Wang, Y.; Zhang, S. Comfort analysis of large bus considering the effect of braking force. Chin. J. Appl. Mech. 2020, 2, 777–784. (In Chinese) [Google Scholar]
- Cheng, Y.; Li, X.; Sun, S.; Man, X.; Fan, F.; Li, Z. A new method for expression and classification of long wave road surface unevenness in field. J. Vib. Shock. 2022, 11, 41. (In Chinese) [Google Scholar]
- Liu, L.; Zhang, Z.; Lu, H.; Xu, Z. Road roughness identification based on augmented kalman filtering with consideration of vehicle acceleration. Automot. Eng. 2022, 44, 247–255, 297. (In Chinese) [Google Scholar]
- Wang, H. Research on the identification of rural highway deformation diseases based on pavement smoothness index. Sino-Foreign Highw. 2022, 42, 78–82. (In Chinese) [Google Scholar]
- Zhang, J.L.; Chen, R.F.; Yao, K. Analysis on influence of road pavement roughness on vehicle vibration. J. Highw. Transp. Res. Dev. 2019, 36, 129–133. (In Chinese) [Google Scholar]
- Li, W.; Wang, G. Vehicle ride comfort analysis based on bridge deck with irregular pavement. J. Beijing Jiaotong Univ. 2022, 46, 98–104. (In Chinese) [Google Scholar]


| GPS Time | Longitude [°] | Latitude [°] | GPS Speed [m/s] | alat [m/s2] | along [m/s2] |
|---|---|---|---|---|---|
| 10:33:55 | 9.10102 | 39.241895 | 4.01 | −0.7346 | −0.4840 |
| 10:33:56 | 9.101006667 | 39.24183833 | 4.50 | −1.0937 | 0.5383 |
| 10:33:57 | 9.100983333 | 39.24177833 | 5.06 | 0.9893 | −0.2925 |
| 10:33:58 | 9.100963333 | 39.24165 | 5.61 | 0.7977 | −0.1417 |
| 10:33:59 | 9.100926667 | 39.24165 | 6.08 | −0.1169 | 0.1289 |
| 10:34:00 | 9.10092 | 39.24158667 | 6.43 | −0.7346 | 0.1193 |
| 10:34:01 | 9.100905 | 39.241525 | 6.68 | 0.1896 | −0.4098 |
| Velocity [m/s] | Front Wheel Displacement [cm] | Rear Wheel Displacement [cm] | Front Wheel Acceleration [m/s2] | Rear Wheel Acceleration [m/s2] |
|---|---|---|---|---|
| 4 | 5.74 | 11.38 | 2.66 | 5.33 |
| 6 | 5.94 | 11.84 | 2.78 | 5.58 |
| 8 | 5.96 | 11.86 | 2.79 | 5.58 |
| 10 | 5.99 | 11.92 | 2.82 | 5.59 |
| Velocity [m/s] | Front Wheel Displacement [cm] | Rear Wheel Displacement [cm] | Front Wheel Acceleration [m/s2] | Rear Wheel Acceleration [m/s2] |
|---|---|---|---|---|
| 4 | 2.65 | 2.35 | 0.05 | 0.08 |
| 6 | 2.39 | 2.68 | 0.12 | 0.19 |
| 8 | 4.20 | 5.45 | 0.65 | 1.23 |
| 10 | 3.31 | 3.63 | 0.25 | 0.41 |
| Velocity [m/s] | Front Wheel Displacement [cm] | Rear Wheel Displacement [cm] | Front Wheel Acceleration [m/s2] | Rear Wheel Acceleration [m/s2] |
|---|---|---|---|---|
| 4 | 5.97 | 11.93 | 2.76 | 5.24 |
| 6 | 5.97 | 12.06 | 2.76 | 5.25 |
| 8 | 5.94 | 11.96 | 2.75 | 5.22 |
| 10 | 5.91 | 11.91 | 2.74 | 5.51 |
| Position | Low Ratio | Medium Ratio | High Ratio |
|---|---|---|---|
| Front wheel [N/m] | 150,000 | 150,000 | 100,000 |
| Rear wheel [N/m] | 100,000 | 150,000 | 150,000 |
Disclaimer/Publisher’s Note: The statements, opinions and data contained in all publications are solely those of the individual author(s) and contributor(s) and not of MDPI and/or the editor(s). MDPI and/or the editor(s) disclaim responsibility for any injury to people or property resulting from any ideas, methods, instructions or products referred to in the content. |
© 2023 by the authors. Licensee MDPI, Basel, Switzerland. This article is an open access article distributed under the terms and conditions of the Creative Commons Attribution (CC BY) license (https://creativecommons.org/licenses/by/4.0/).
Share and Cite
Sun, R.; Wang, J.; Liu, Y. Dynamic Analysis and Seat Selection of Bus Driving Comfort under Different Road Conditions. Appl. Sci. 2023, 13, 4639. https://doi.org/10.3390/app13074639
Sun R, Wang J, Liu Y. Dynamic Analysis and Seat Selection of Bus Driving Comfort under Different Road Conditions. Applied Sciences. 2023; 13(7):4639. https://doi.org/10.3390/app13074639
Chicago/Turabian StyleSun, Rui, Jianguo Wang, and Ying Liu. 2023. "Dynamic Analysis and Seat Selection of Bus Driving Comfort under Different Road Conditions" Applied Sciences 13, no. 7: 4639. https://doi.org/10.3390/app13074639
APA StyleSun, R., Wang, J., & Liu, Y. (2023). Dynamic Analysis and Seat Selection of Bus Driving Comfort under Different Road Conditions. Applied Sciences, 13(7), 4639. https://doi.org/10.3390/app13074639