1. Introduction
Track failures or rail vehicle derailments represent approximately 50% of overall accidents in railway transport [
1]. The majority of the track integrity problems are related to the track geometry or gauge distortion. Other factors that harmfully impact on properness of wheel–rail contact are badly repaired running gear, discrepancy of rails, and critical dynamical impacts (such as high tractive and braking forces of trains). Furthermore, some railway traffic accidents happen due to the diminishing of reliable wheel/rail contact and due to the unsatisfactory stability of rolling-stock running [
2].
The parameters and shape of the rolling surface of the rail wheel mainly influence the technical condition of rolling stock running gear. The “wheel-rail” contact transfers high vertical static and dynamic loads to the vehicle and the track [
3]. As the wheel rolls, high-impact loads are created by track irregularities and rail junctions [
4]. During rolling-stock exploitation, the interaction between the wheel and the rail may cause damage to the rolling surface of the rail wheel [
5]. They can also be caused by manufacturing inaccuracies [
6] or poor machining [
7]. It should be noted that the occurrence of damage is most affected by braking and track surface irregularities [
8]. The damage of the wheel rolling surface is very destructive to the upper track structure. It can also cause wheel cracks and derailment of the wagons [
9]. Polish scientists Burdzik et al. defined the dynamical properties of the driving train and evaluated the technical state of the rail track by using proprietary measurement software and a mobile device. Authors proposed useful metrics to describe the dynamical properties of the driving train [
10]. Strikes of damaged wheels produce high noise and vibrations that impair passengers’ comfort [
11]. Vertical interactions of the wheel with the rail acquire an impact character when the wheel is damaged. These studies require unique methods since the processes under investigation have a higher frequency [
12]. Polish scientists Celinski et al. defined the dynamical properties of the driving train and the evaluated the technical state of the rail track by using proprietary measurement software and a mobile device [
13]. Furthermore, authors proposed useful metrics to describe the dynamical properties of the driving train. R. Burdzik et al. considered the impact of rail damage on vibration waveforms and vibroacoustic spectrum images of vibrations. The major source of railway vibration is the structural vibration of the wheel and rail, which is generated by the combination of small-scale undulations on the wheel and rail contact surfaces. The inevitable vibration transmitted by running rail vehicles through the rails and wheels causes and propagates various cracks in the metal of running gear elements. The authors revealed the amplification of the signal from the Ai3 sensor located near the damaged place where the frequency oscillated around 4000 Hz, while the spectral analysis of the signal for the Ai2 sensor located 5.4 m away to the damage indicated oscillating values in the range from 50 to 500 Hz [
14]. Depending on the train’s speed, the maximum duration of the force is in the order of several milliseconds. The ATLAS-LG subsystem of wayside equipment is used by Lithuanian Railways (LTG) to detect and prevent damage due to their impact. ATLAS-LG type systems are used by Lithuanian and Swiss Railways and are designed to avoid traffic accidents. These systems detect passing wagon running gear that causes vertical impact loads on the rail track, which can be caused by damage to the wheel rolling surface (e.g., flat, crack, uneven wear, and “out-of-roundness”).
Worldwide rigorous research activities are targeting not only security. A high level of safety and reliability of infrastructure systems also aims to diminish the problems associated with the degradation of performance in terms of train-ride quality and stability, passenger comfort, etc. To ensure the railway transport safety, decision-makers of rail companies need, inevitably, to monitor the geometrical parameters of the track and the condition of the vehicle wheel rolling surfaces. Wheel damage (flats, crumbling, cavities, cracks, wear, out-of-roundness, etc.) endangers traffic safety, i. e., the risk of derailment. The intensive damaging of the rails and track as a whole track geometry also increases.
Mathematical models of the impact of wheel flat damage on the rail usually developed using the reverse Laplace transformation methodology. These models were later developed by researchers from Ukraine and other countries [
15]. It is noted in the literature that it is not entirely clear how short-term loads affect the systemic wear of the wheel surface. It is preliminarily known that the wear processes are influenced by such factors as surface irregularities and roughness, material hardness, and elasticity [
11]. Due to the large number of factors, processes are modeled by simplifying them [
16]. As an example, one can give the fact that elastic and plastic deformations and the formation of metal cracks as a result of them are not always taken into account when modelling processes [
17]. In order to create a more reliable wheel wear prediction tree, it is necessary to evaluate not only one or two factors, but many more, perhaps a dozen or a few tens [
18].
Both when examining wheel damage and when examining the causes of traffic accidents, it can be seen that wheel damage frequently causes traffic accidents (on the railway, traffic accidents are considered not only accidents with drastic consequences, but also minor incidents when train traffic is stopped for a short time) [
19]. Flats and cracks are the most common damage of the rolling surface of the wheel to rail [
20]. As rolling stock speeds increase, increasing dynamic forces affect the development of damages [
21]. According to the impact on traffic safety, it is accepted to preliminarily divide wheel-rolling surface damage into two types [
22]:
Damages that cause a short-term loss of wheel–rail adhesion (cracks, flats, bends);
Damages that do not cause loss of wheel–rail adhesion (e.g., uneven wear).
Some of the wheel damage may go unnoticed during the external inspection due to the human factor, so it is necessary to improve the automatic damage detection systems [
23]. Different diagnostic systems associate the magnitude of the wheel surface damage differently with the impact force (the data processing algorithms used for this purpose may differ).
This study aimed to determine whether the repeatability of force measurement is more determined by the nature of the wheel damage or the driving speed, and to determine whether it is possible to detect the laws of the dependence of the repeatability of this measurement on the cause.
2. Analysis of Rolling-Stock Wheel-Rolling Surface Damage
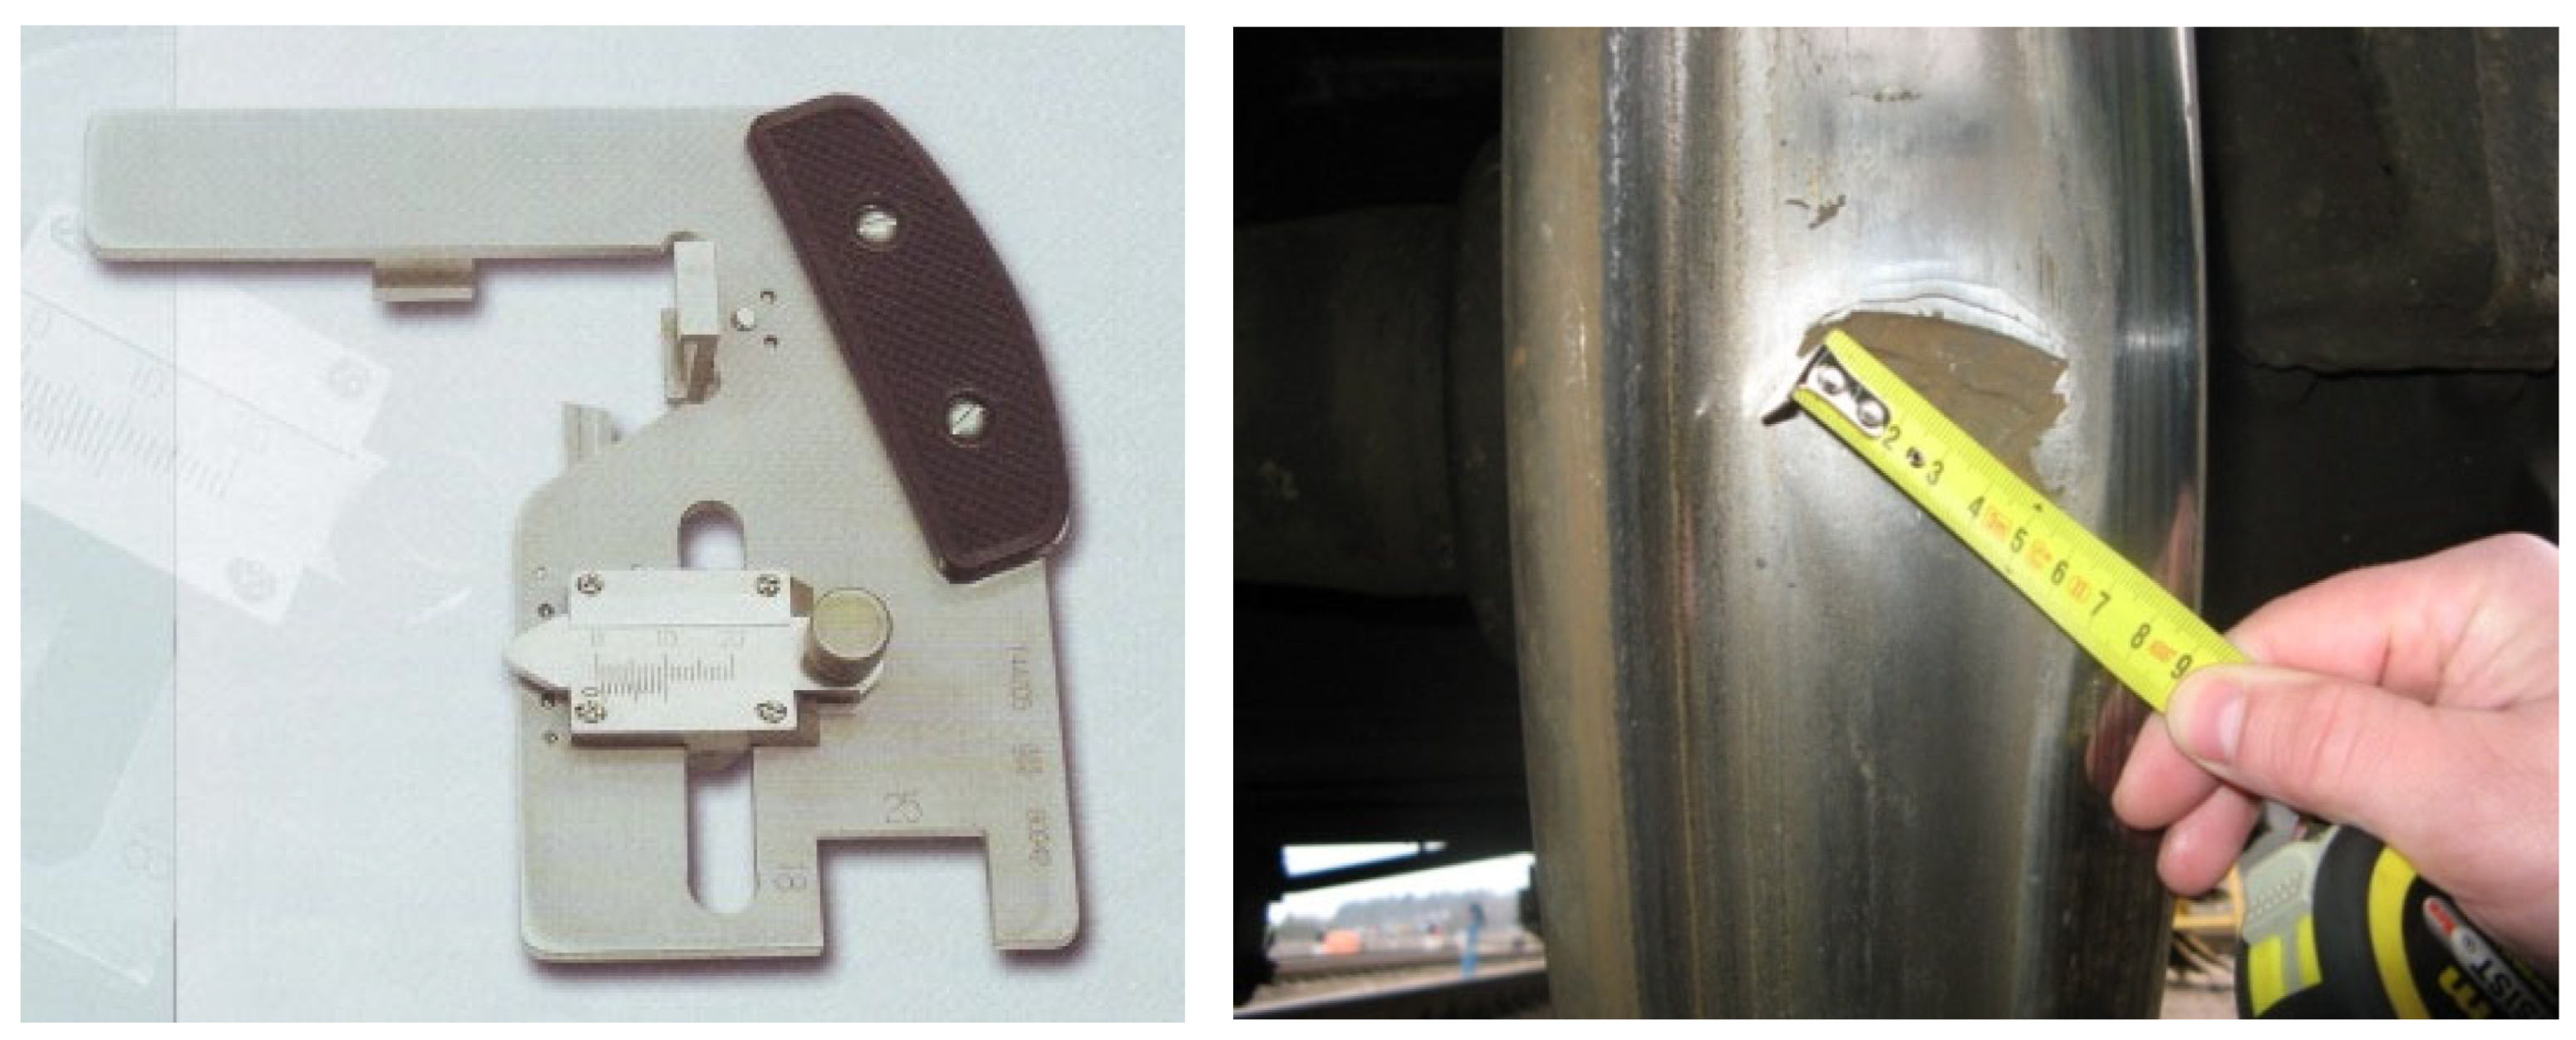
During rolling stock inspections at railway stations, wheel damage is detected by templates and other devices (
Figure 1). An external inspection identifies visible damages, such as wheel flats or cracks, and templates are used to inspect the wheel profile. Ultrasonic and magnetic defectoscopes are used to detect cracks in the wheel.
The main damages of the rail wheels are the wear of the rolling surface, thinning of the flange, flats, cracks, and metal folds of the surface. The main types (shapes) of wheel-rolling surface damages are shown in
Figure 2.
Flange damage. The wheel flange prevents the wheel from derailing. A wheel is considered damaged when its flange is critically thinned (up to 25 mm).
Metal folds. Metal folds occur in the presence of thermomechanical damage [
24]. Intense plastic deformation of the metal occurs due to sudden braking, short-term wheel slip, wheel jumping, or sudden heating of the wheel metal, and then sudden cooling [
25]. Several metal folds can be formed on the rolling surface of the wheel, as well as being in one or several layers. When the wheel of a passenger car has a metal fold up to 0.5 mm, or a freight wagon up to 1 mm, operation of the wagon is prohibited.
Rolling surface wear. Most publications on the long-term interaction between rolling stock and track deal with the wear of rail and wheel [
26,
27,
28]. The phenomenon of wheel wear has been extensively studied [
29]. With the wear of the rolling surface of the wheel, train resistance to movement and the wheel/rail adhesion increase [
30]. The wear of the rolling surface of the wheel is divided into even and uneven.
Uneven wear. This wear is special in that it does not have a dimensional extremity (such as the deepest point), so sometimes this type of wear is difficult to detect by the values of the dynamic diagnostic indicators [
31]. The consequence of such wear is isolated wheel irregularities [
32].
Flats. These are the most common wheel damage caused by wheel slip or a brake pad stuck [
33], as shown in
Figure 3.
Wheel flats also occur from wheel slippage, wheel jamming, or braking equipment failures. Flats occur much more often in winter than in summer. The main reasons for the formation of the wheel flat are shown in
Figure 4.
Dynamic measurement methods include the vibration acceleration method, machine vision method, and YOLO deep learning network methods for wheel-rolling surface damage discovery. The operation of automatic crack detection system implemented based on YOLOv2 target detection, which improves the detection accuracy, is analyzed in the study [
34]. Chinese researchers developed [
35] a YOLOv3-based railway track line detection method that improved detection accuracy and speed. Furthermore, it preferred to incorporate lasers with images and, therefore, resulted in an structured light vision sensor (SLVS) sensor for assessing localized faults on wheel, such as a crack or wheel flat.
Various diagnostic systems can determine the magnitude of the damage based on the impact force. There are a lot of methods in the scientific literature to determine the correlation between these values [
12] and the principles by which these systems operate [
36]. On the other hand, rolling-stock wheelsets oscillate when rolling on a rail track [
37] (see
Figure 5), so the wheel–rail contact points are not always on the same circle of the wheel rolling surface [
38].
Different detection methods have their advantages and disadvantages. Some methods have low detection accuracy or high actual operating costs. Therefore, the search for a more precise method has become a relevant issue.
Due to oscillation processes, the damaged wheel impacts on the rail at different surface points at each time, and the impact force varies. In operation, it is impossible to determine which of the measured values of the impact force is the most accurate (actual). It needs to be clarified on which basis the diagnostic equipment should estimate the magnitude of the damage.
3. Research Methodology
At first, the study compares the results of measuring vertical forces by different systems. In the same graph, the force values obtained from the ATLAS LG system are plotted on one axis and the special designed measurement system IC VEIP on the other. The view of both used measurement systems is presented in
Figure 6.
The measuring range consists of 14 sleeper reaction measuring points (R-points) and 12 axle load measuring points (T-points). The last T-point is used for identifying wheelsets. Vertical impact on rail and static axle load of wheels is measured by strain gauges mounted on the rail neck. The main particularities are: ATLAS-LG system measures directly the vertical force, while the IC-VEIP system measures the rail acceleration and then converts it into a force value.
The best result is when the readings of both systems coincide. This result would indicate that both systems are equally suitable for studies on the influence of wagon wheelset damage on the nature of vertical forces. If all values are in a straight line and the line is formed at a different angle with the axes, it would mean that there is a systematic error in at least one of the systems. If the values are not in a straight line (scattered in the plane), then the measurement results are not related to different systems, and at least one system is unsuitable for the test. Another important issue is estimating the scattering field for the measured force values. The box and whisker principle is used in the study [
39].
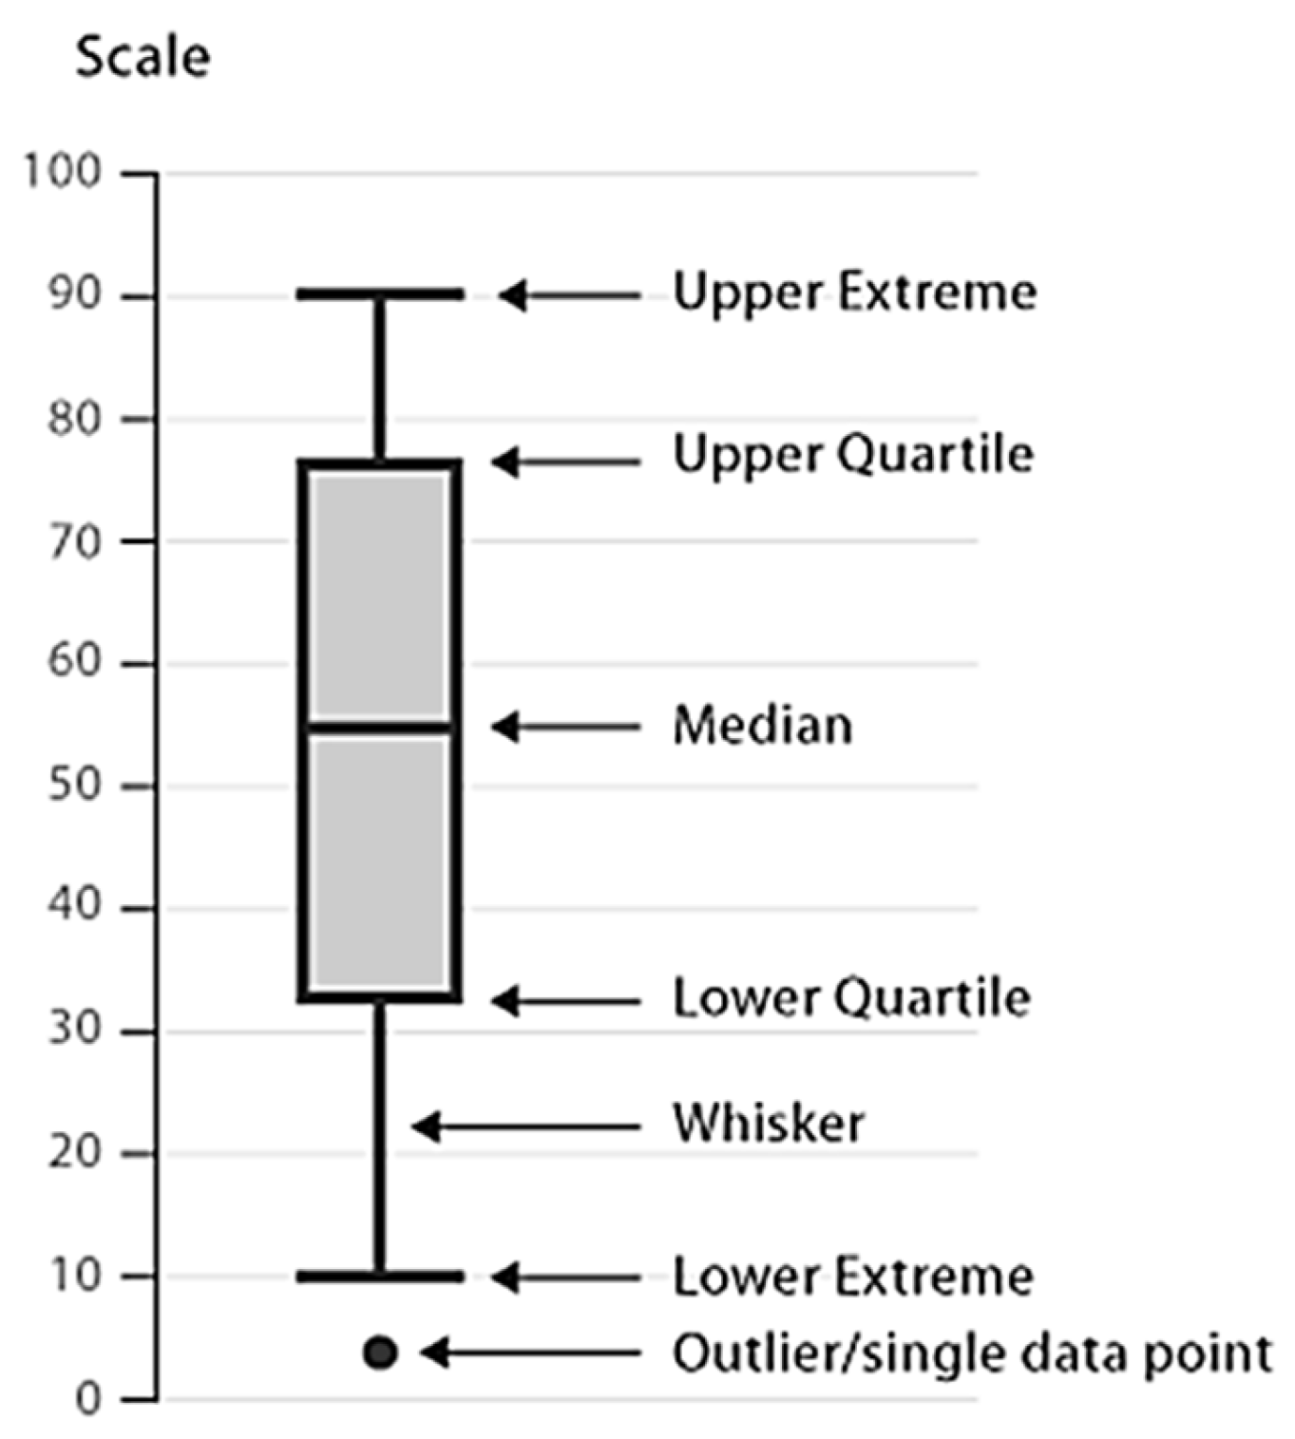
The box and whisker graph is convenient in that it shows where the median of the values is (see
Figure 7). It also shows where the 50% of values closest to the median (upper quartile and lower quartile) are distributed, the range of the remaining values (upper extreme and lower extreme). In addition, this type of graph can show individual values that stand out from the whole (outlier). A median value is used, taking into account the specific algorithm of the box and whisker method. This type of graph is very suitable for evaluating the repeatability of experimental results. Understandably, the better the repeatability of the results, the smaller the scatter fields of the values. An example of the application of the box and whisker principle is shown in
Figure 7.
In the middle of the diagram in
Figure 7, there are two middle quartiles. They are the limits between which half of all measurement values are distributed (twice 25%—two quartiles). In the middle of these quartiles, there is a median–mean value. The remaining values are outside these limits, and the authors did not analyze these values.
The ratio of the total width of the two middle quartiles to the median in estimating the wagon wheel damage magnitudes is calculated as:
where
Qu—upper quartile;
QL—lower quartile;
M—median (
Figure 6).
For simplicity, this indicator name is sometimes abbreviated to indicator QM. This methodology estimates the ratio of the wheel-to-rail scattering field to the median QM. Such an indicator is important in proving that the size of the scatter field of impact values is less significant at high force values. Therefore, the lower value of the indicator QM shows better repeatability of the measured vertical force. The value of QM is calculated under different operating conditions of the rolling stock (in this case—different speeds). Comparing the QM values in different cases determined the states that are best suited to relate the magnitude of the damage to its vertical impact on the rail.
5. Distribution of Values of Wheel Vertical Forces
The authors propose to use the ratio of the total width of the two middle quartiles of the scattering field of the vertical force values to the median (indicator QM, Formula (1)) to examine the impact of the wheel-rolling surface damage on the measurement repeatability of the vertical forces. Two wheel-rolling surface damage types were selected for this study. For each damage type (shape), the vertical forces caused by the wheel damage were measured in four dimensions. Four data sets were obtained: mean values of vertical forces of unloaded wagon and of loaded; values of maximal vertical forces of unloaded wagon and of loaded wagon.
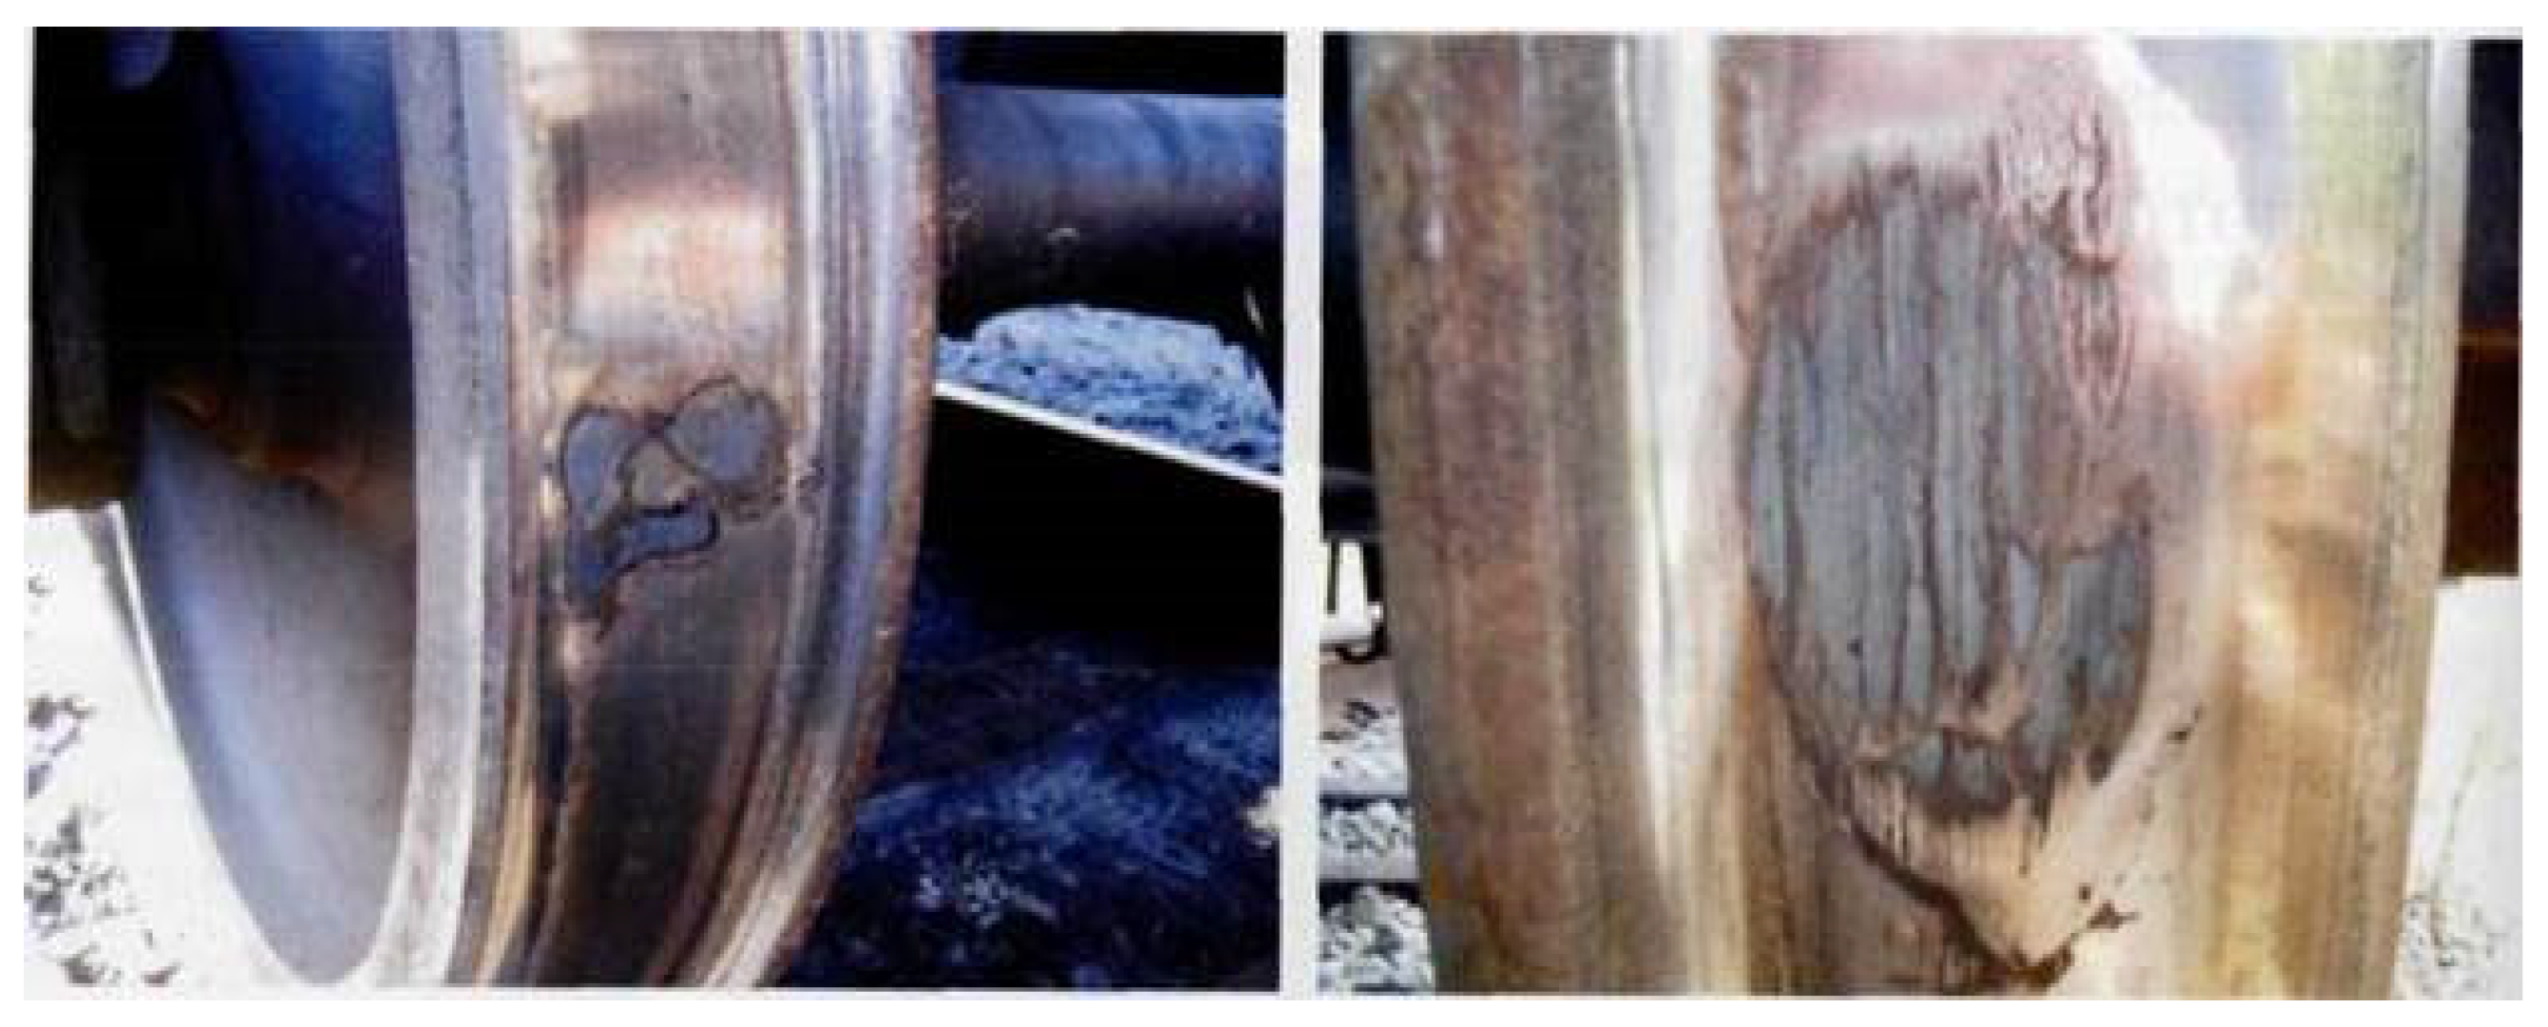
First, the test was performed with the damaged left wheel of the first wheelset. The wheel has two 20 × 10 × 4 mm and 15 × 40 × 3 mm cracks. Wheel damages provided in
Figure 10.
Box and whisker values of the maximal vertical forces of loaded goods wagon are shown
Figure 11.
The values of the indicator
QM, calculated by the Formula (1) of maximal vertical forces of the loaded wagon are provided in
Figure 12.
The data in
Figure 12 reveal that the influence of wagon wheel damage on the measurement of repeatability vertical forces is the highest at 30 km/h—lowest
QM value, and the highest value is at a speed of 60 km/h. When wagon running speed increases, this impact on measurement repeatability decreases. It is inappropriate to perform tests at a speed of fewer than 30 km/h because, in this case, the amplitude of the carriage’s oscillations may be lower than when driving at higher speeds, which would distort the adequacy of the results (equipment may not capture all damage). Since the tests are carried out on freight wagons, it is not appropriate to conduct them at speeds higher than 80 km/h. More test results were analyzed to better examine the dependences of wheel damage nature on repeatability. The values of the maximal vertical forces are given in the form of a box and whisker graph in
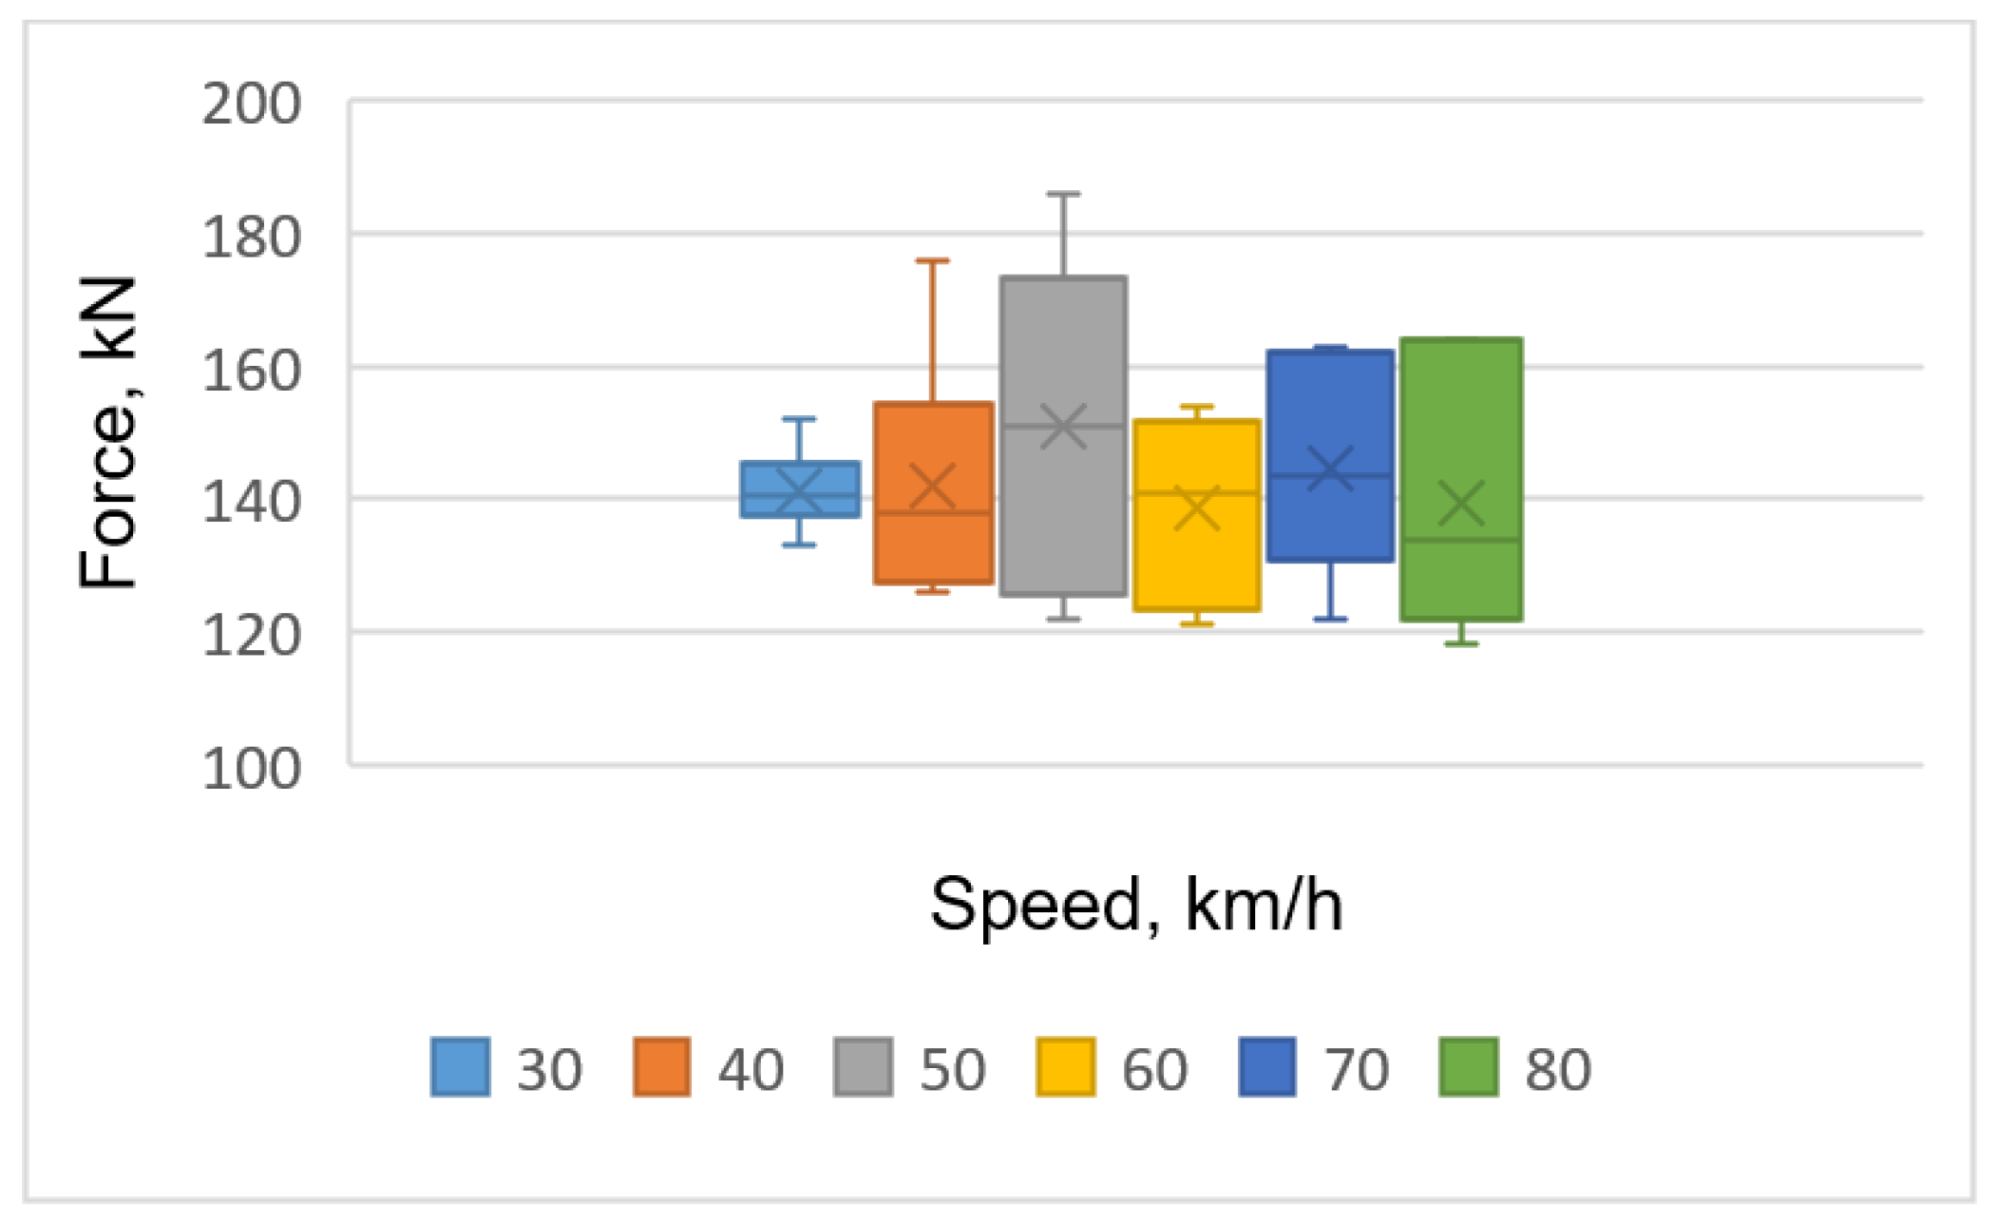
Figure 13 when the goods wagon is unloaded.
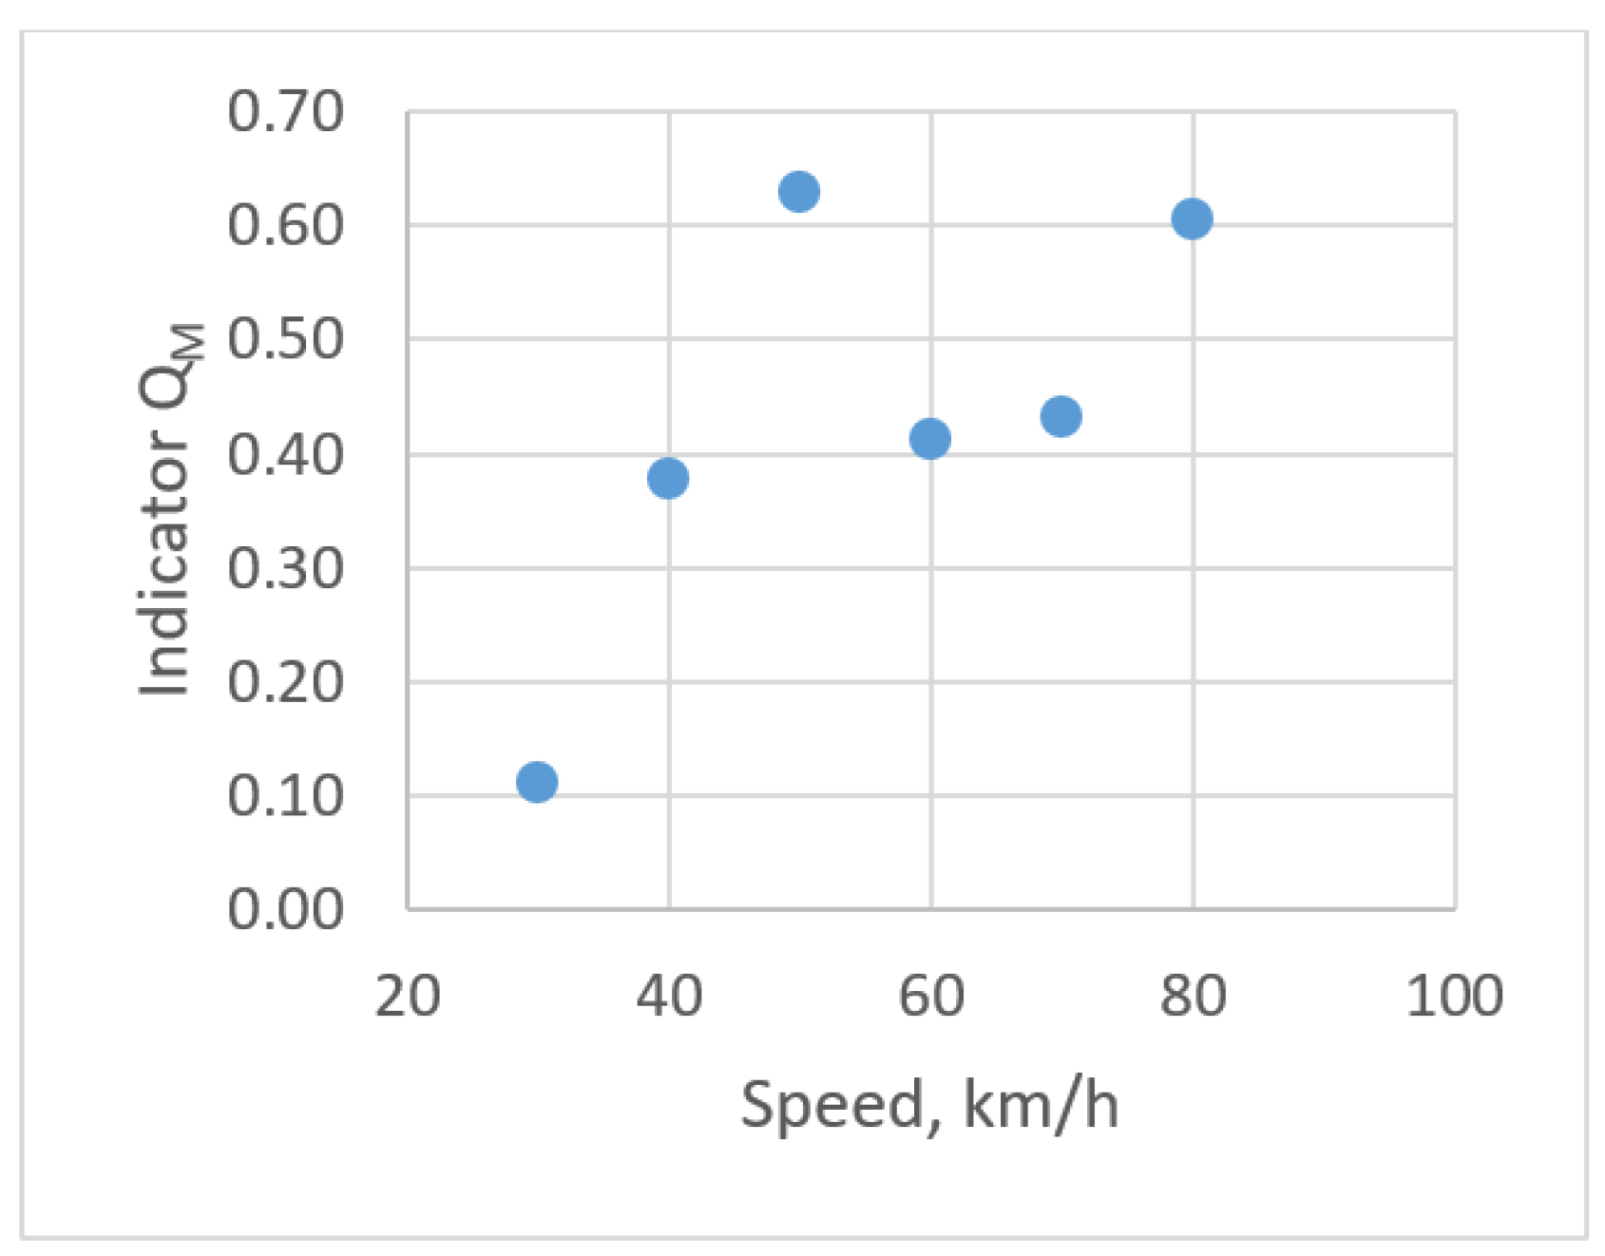
The chart of
Figure 13 shows that the maximal scatter of the force values is at a speed level of 70 km/h. The values of
QM, calculated according to Formula (1) for the maximal forces when the goods wagon is unloaded, are given in
Figure 14.
The data in
Figure 14 reveal that the impact of wheel damage on the repeatability of measurement of vertical forces is the best (the lowest values of the indicator
QM) at a speed of 40–60 km/h. More test results were analyzed to examine these dependencies better. The values of the mean vertical forces of loaded goods wagon are given in
Figure 15.
The chart of
Figure 15 clearly disclose that as the wagon speed increases, the dispersion of the mean vertical forces increases. The values of
QM with the loaded wagon are shown in
Figure 16.
The data in
Figure 16 disclose that the impact of wheel damage on measurement repeatability of vertical forces is best at speeds of 40 and 60 km/h. No clear law is seen here. More test results were analyzed to examine the correlations with measurement repeatability better. The values of the mean forces of unloaded wagon are given in
Figure 17.
The chart of
Figure 17 shows that the force dissipation is lowest at a speed of 30 km/h. The values of
QM when the wagon is unloaded are given in
Figure 18.
The data of
Figure 18 show that the impact of wheel damage nature on the measurement repeatability of the vertical forces is best at a speed of 30 km/h.
For the second iteration of wheel damage testing, the damaged fourth wheel set’s (in running direction) left wheel of the first wagon was selected: 87 × 30 × 2.0 mm flat and 30 × 40 × 2 mm cracks. Photos of wheel damage are provided in
Figure 19.
Examples of the distribution of vertical forces caused by wheel damage (flat and cracks) in rail cross-sections are provided in the literature [
12].
Vertical force maximal values of loaded wagon are given in
Figure 20.
The chart of
Figure 20 shows that the scatter of the maximal vertical force values are lowest at the speed 30 km/h. The values of
QM for the maximal vertical forces of loaded wagon are shown in
Figure 20.
The data of
Figure 21 reveal that the wagon wheel damage impact on measurement repeatability of vertical forces is best at a speed of 30 km/h. The values of the maximal forces of unloaded wagon are given in
Figure 22.
The data of
Figure 23 show that the scattering field of the maximal vertical forces is the lowest at speed of 40 km/h and 60 km/h. The values of
QM for the maximal vertical forces are given in
Figure 22.
The data of
Figure 23 show that the wheel damage impact on measurement repeatability of vertical forces is best at speed of 40 km/h and 60 km/h. However, no clear pattern is seen here. In the case of the goods wagon being loaded, the vertical force mean values are given in
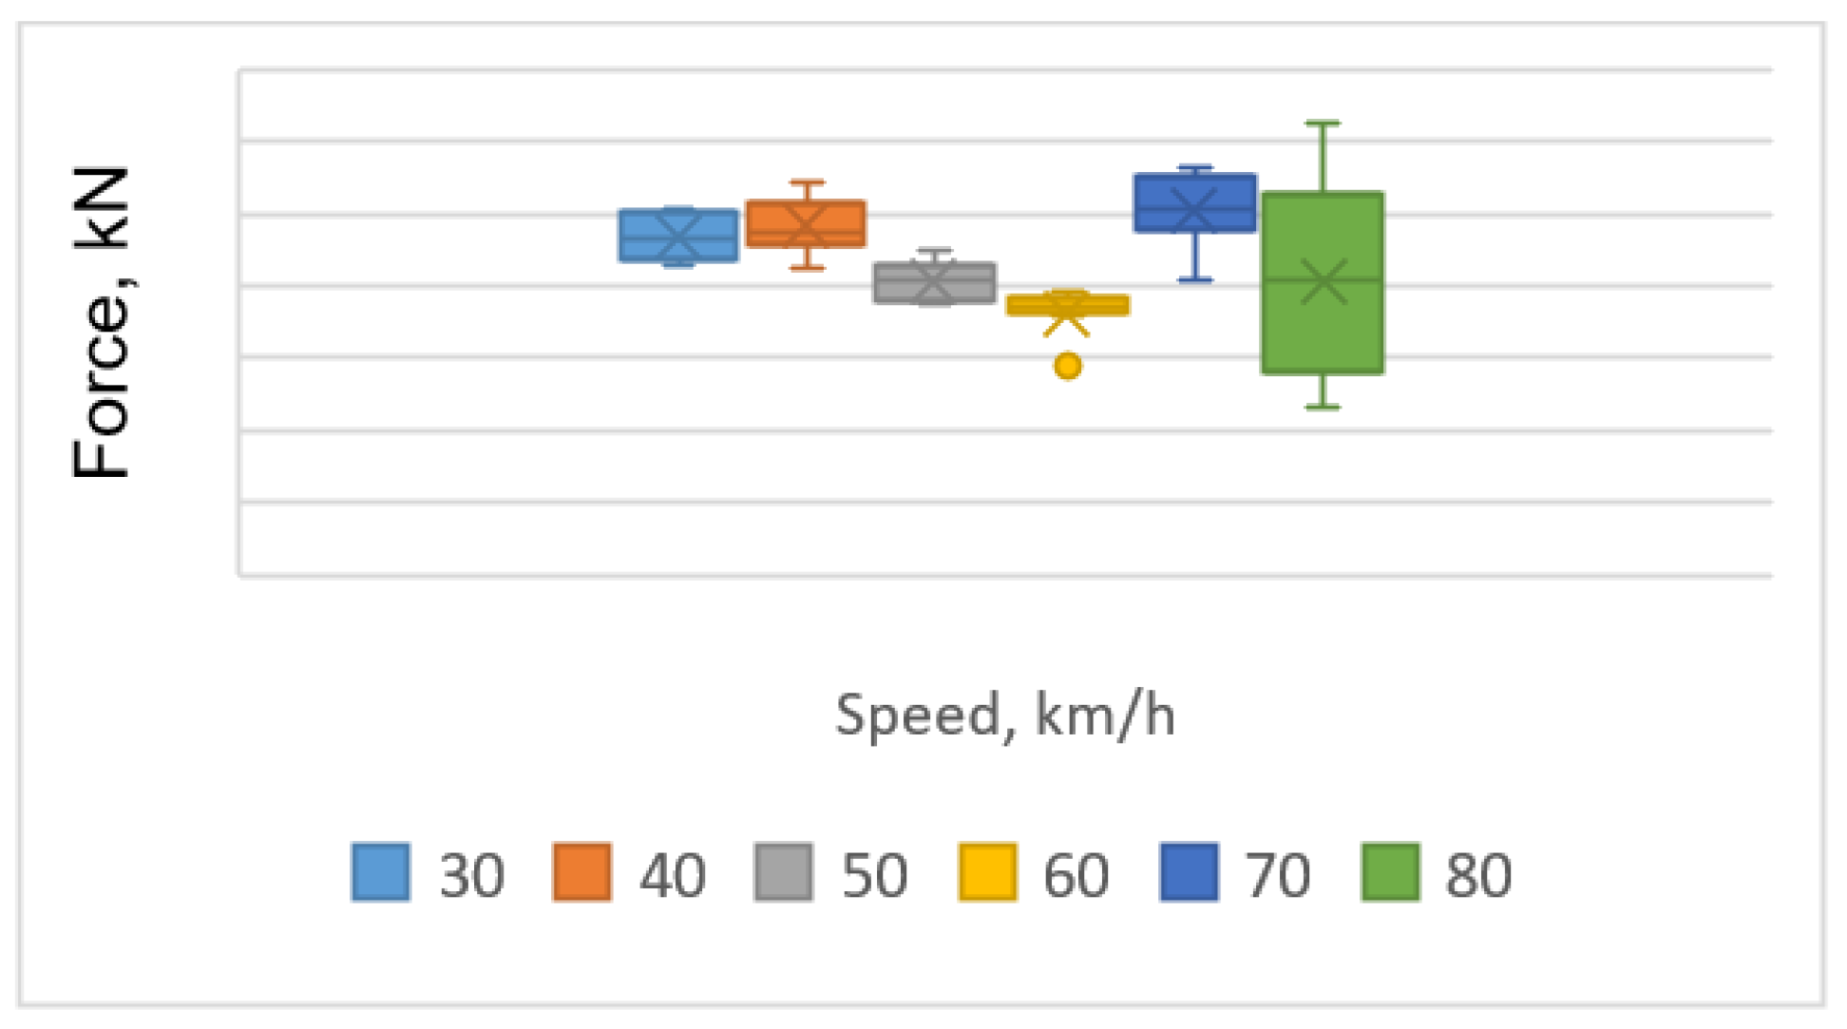
Figure 24.
The chart of
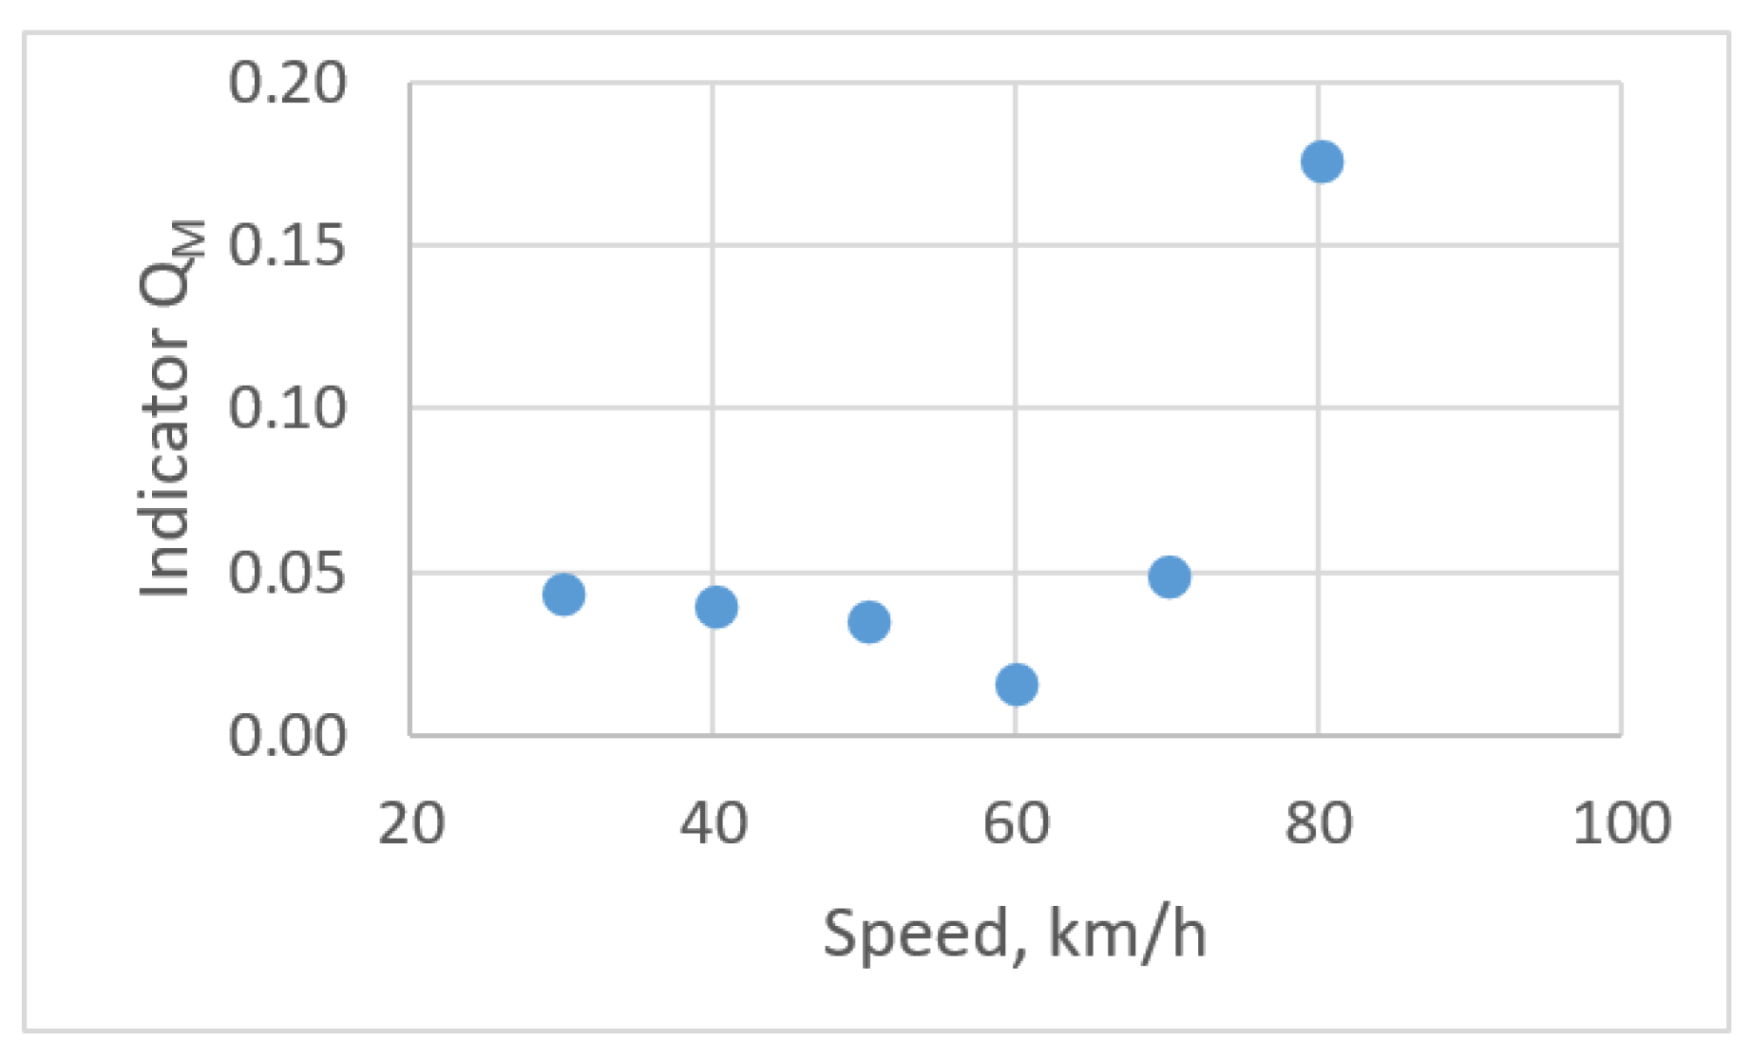
Figure 24 shows that the dissipation of the mean forces is lowest when the wagon is at speed 30 km/h. The indicator
QM values of loaded wagon are presented in
Figure 25.
The data of
Figure 25 show that the impact of wheel damage on measurement repeatability of vertical forces is best at a speed of 30 km/h. The mean values of the vertical forces of unloaded wagon are given in
Figure 26.
The chart of
Figure 26 shows that the force dissipation field is the most significant at the speed of 80 km/h. The values of the indicator
QM unloaded wagon are given in
Figure 27.
The data of
Figure 27 show that the impact of wheel damage on measurement repeatability of vertical forces is best at a speed from 30 km/h to 60 km/h.
Summarized
QM values are compiled based on the performed research. The final gained results are presented in
Table 1.
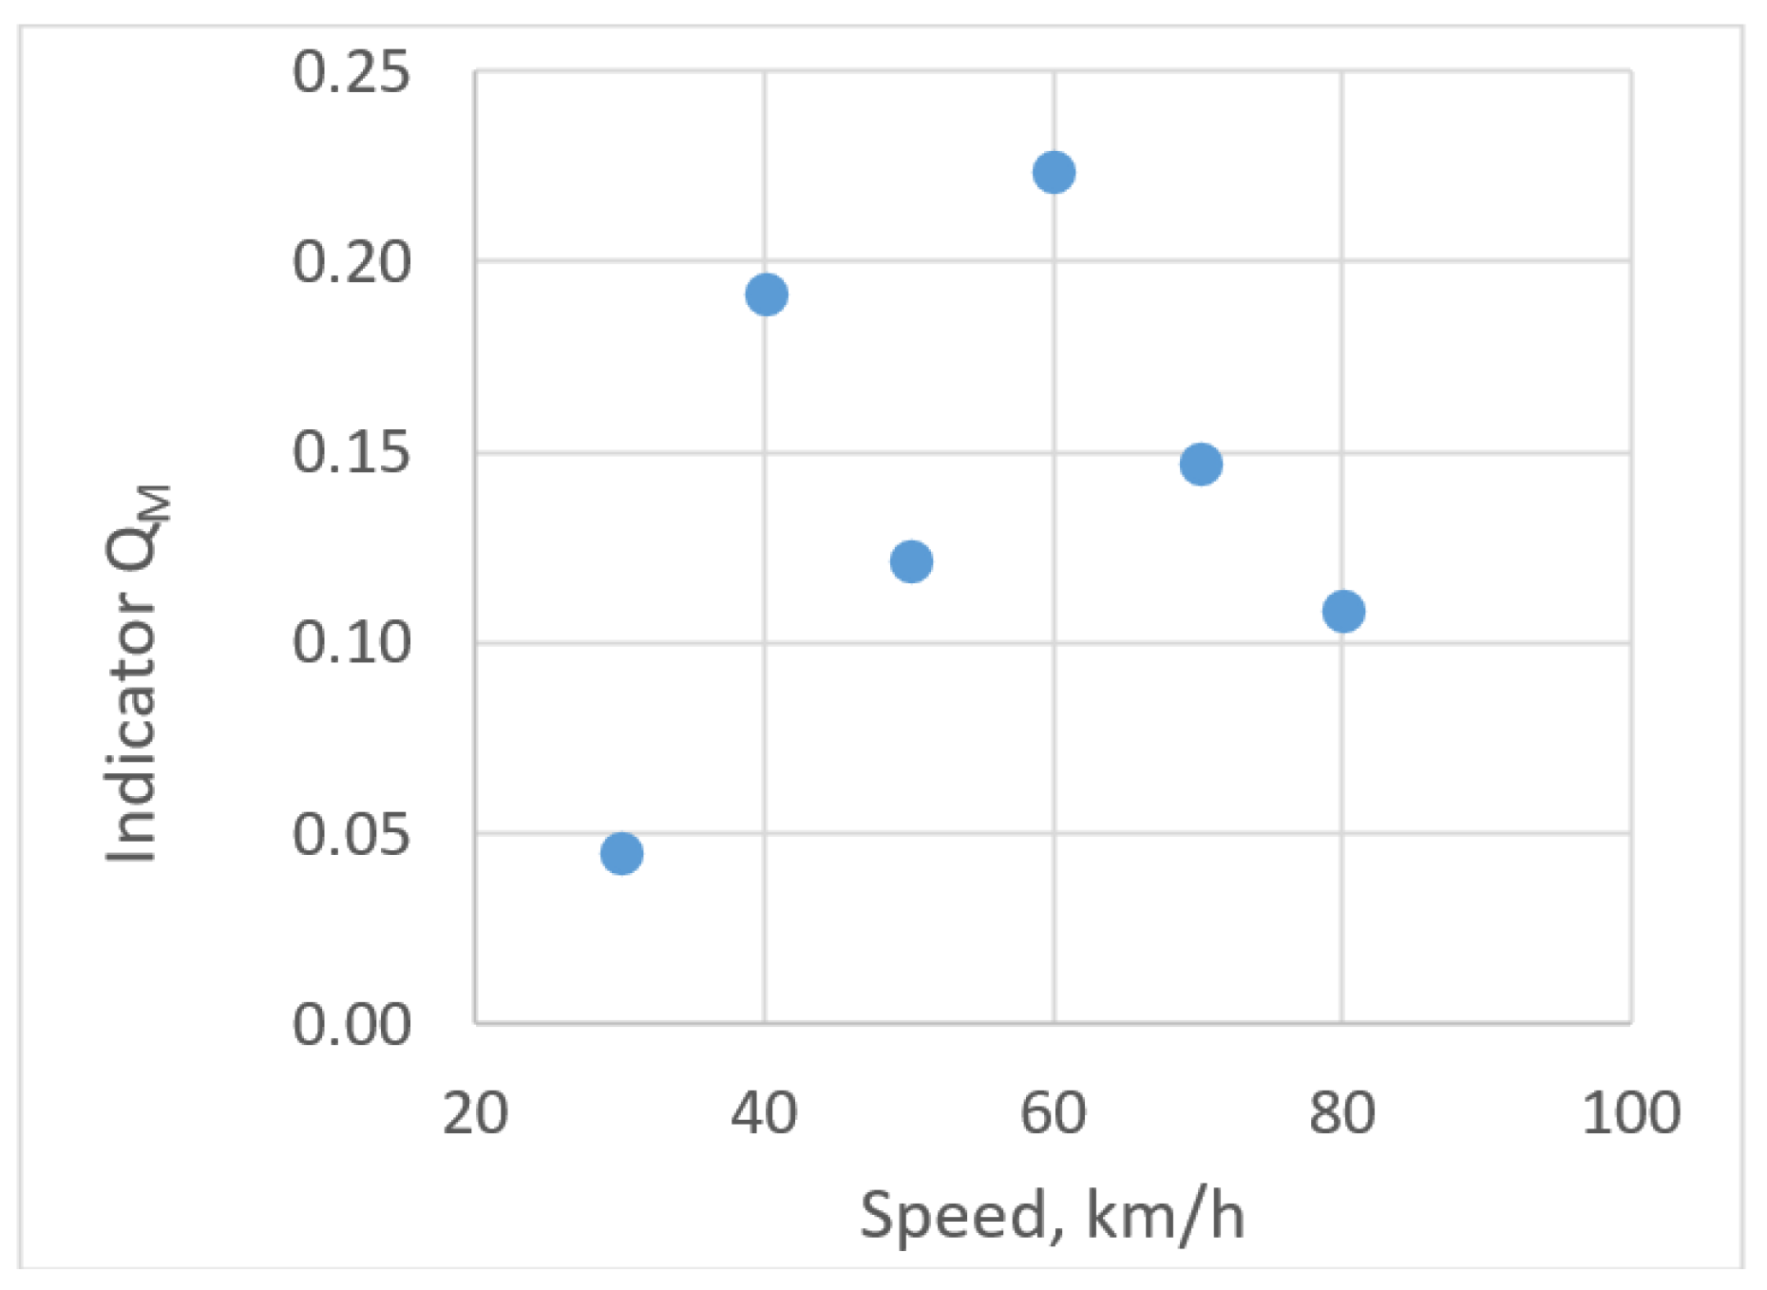
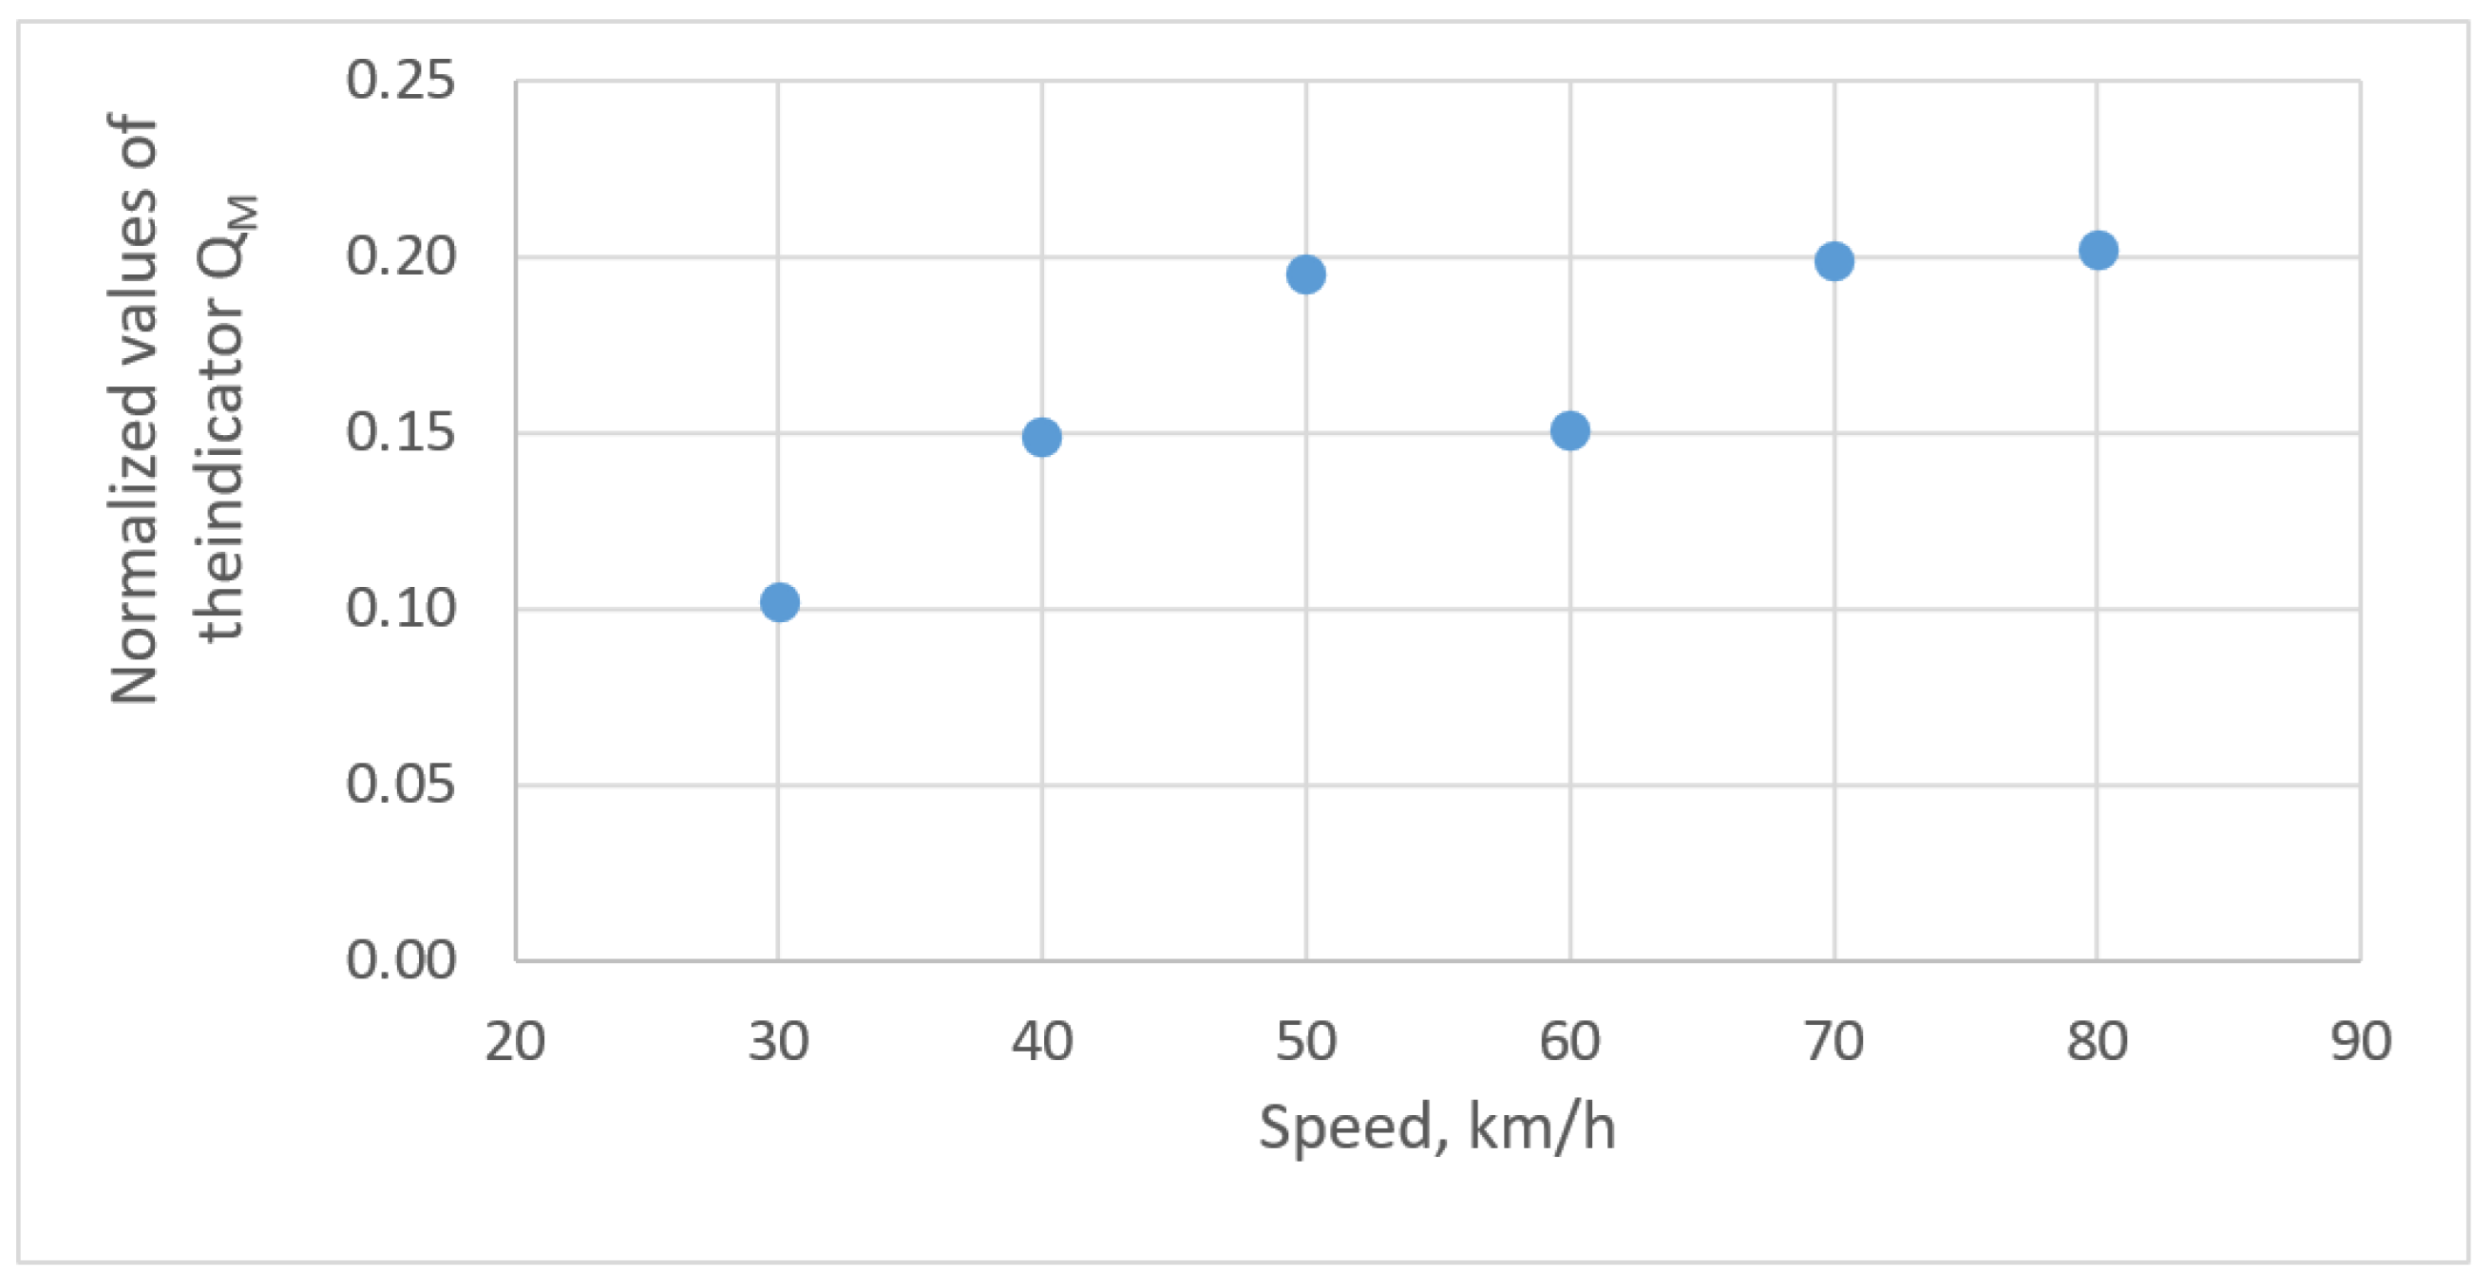
The arithmetic mean of the values is calculated for each row of
Table 1 (running speed from 30 km/h to 80 km/h). Normalized values of this mean for appropriate speed are shown in
Figure 28.
The indicator
QM is needed to assess the wheel damage influence on the repeatability of vertical force measurement values (Formula (1)). A lower
QM value means better measurement repeatability. Summarizing the results, the
QM values are presented (
Figure 28) in normalized form. It can be seen that decrease in running speed from 80 km/h to 50–60 km/h does not improve the correlation between the wheel damage and the vertical forces. To improve this correlation, reducing the speed to 30–40 km/h is needed.
6. Conclusions
Rolling stock wheelsets oscillate on the rail track, so the wheel–rail contact points are never on the same circle of the wheel rolling (contacting) surface. As a result of these processes, the wheel damage contacts the rail at different surface points at each moment, and the vertical impact force changes. During rolling-stock operation, it is impossible to determine which of the measured values of the impact force is the most accurate. The scattering field of the values is obtained during the measurements, and a methodology is required to process it. The investigation reveals that the box and whisker method is well-suited for analysing the scattering field of force measurement results.
The ratio of the total width of the two middle quartiles and the median is proven as the suitable indicator for assessing the effect of the car wheel clearance on the repeatability of vertical force measurements.
The authors reveal that of all the various factors that affect the repeatability of the measurement of wheel vertical force, speed is the only factor that has an obvious correlation. For other factors (e.g., type of measuring system, nature of wheel damage), no clear correlation is observed during the study.
The other disclosed aspect is that decreasing the running speed from 80 km/h to 50–60 km/h does not strengthen the correlation between the wheel damage nature and the repeatability of vertical force measurement. Greater reducing levels of train speed were applied to improve the quality of wagon wheel damage nature impact identification. Reduction in the train speed from 80 km/h to 30–40 km/h reduces the value of the indicator QM proposed by the authors by 1.5–2 times.
When operating the rolling stock and knowing the conditions under which the values of QM are the lowest, the repeatability of measurement of wheel/rail vertical forces is the highest.
In the future, the authors plan to study the repeatability of measurement results of systems operating on other principles. Furthermore, a limitation of this research is the incompatibility of the measuring systems ATLAS-LG and IC VEIP with other diagnostic systems used in railways. This devise incompatibility causes the low reproducibility of the results of the present study.


