Featured Application
Adding level set method to V-Net model in order to improve the performance of CT image segmentation.
Abstract
Region of interest (ROI) segmentation is a key step in computer-aided diagnosis (CAD). With the problems of blurred tissue edges and imprecise boundaries of ROI in medical images, it is hard to extract satisfactory ROIs from medical images. In order to overcome the shortcomings in segmentation from the V-Net model or the level set method (LSM), we propose in this paper a new image segmentation method, the VLSM-Net model, combining these two methods. Specifically, we first use the V-Net model to segment the ROIs, and set the segmentation result as the initial contour. It is then fed through the hybrid LSM for further fine segmentation. That is, the complete segmentation of the V-Net model can be obtained by successively combining the V-Net model and the hybrid LSM. The experimental results conducted in the public datasets LiTS and LUNA show that, compared with the V-Net model or LSM alone, our VLSM-Net model greatly improves the sensitivity, precision and dice coefficient values (DCV) in 3D image segmentation, thus validating our model’s effectiveness.
1. Introduction
Medical image segmentation is a basic and challenging task in CAD, whose goal is to segment target organs, tissues or diseased regions accurately. Because of the limitations of imaging technology and imaging devices, medical images always have complex textures, unlike natural scenes, and have boundaries blurred with noise. In addition, medical image annotations rely heavily on the knowledge and experience of experts, so the annotation data size available for training is small, including annotation errors. Therefore, the CAD system which is based on the traditional image segmentation algorithm, can hardly meet the requirements of medical applications. Nowadays, compared with traditional image segmentation methods which are based on thresholding, edge, region, or graph theory, methods based on deep learning have improved segmentation accuracy and have significant advantages in medical and complex image segmentation.
Image segmentation methods based on deep learning can process various image datatypes. A deep neural network (DNN) was used to segment biological neuron membranes for electron microscopy (EM) images [1]. An automatic discrimination model based on a full convolutional network (FCN) and transfer learning was used to segment lung regions for X-ray images, and the accuracy was more than 80% [2]. An adaptive full-density neural network was proposed for CT image segmentation by adding horizontal connections to the U-Net model, which can extract more edge information from the image [3]. Furthermore, even a network-combined CNN and LSM can be applied to segment polarimetric synthetic aperture radar images [4].
Specifically, a variety of segmentation tasks in medical images can be processed effectively by use of deep learning networks. An end-to-end solution for multi-class semantic segmentation using FCN and transfer learning was proposed to achieve the automatic segmentation of three targets: corneal, melanoma, and benign lesion [5]. A 3D medical image segmentation method was proposed, which performed outstandingly on prostate and heart segmentation [6]. A new U-Net architecture was built by integrating inception-resnet with CNN, and replacing standard convolutional blocks with inception-resnet, which can achieve an average Dice score of 0.9857 or higher on lung and brain tumor segmentation [7]. Super-pixel and CNN networks were combined to segment cervical cancer cell images, which can reach 94.50% accuracy in core region detection [8]. The RDCTrans U-Net was used for liver tumor segmentation, achieving SOTA results [9]. A U-Net network was applied for lung nodule segmentation, which can reach 92.11% overlap with annotation [10]. Then, the results of the lung nodule segmentation kept improving through the use of Mask R-CNN, NRU, and 3D U-Net successively [11,12,13].
In this current work, we will mainly focus on the CT image, which comprises a series of slice images of the human body; and provides valuable information about the internal structure and composition of organs, tissues, and bones; making it an important diagnostic tool for diagnosis, treatment, and monitoring of a wide range of medical conditions. CT images can help doctors to identify tumors and other abnormalities in the body that may not be visible with other imaging techniques.
Figure 1 shows an example of the three-view drawing of the liver CT. All the slice images can form a 3D image which can be used for a variety of disease screening. These segmentation methods, through using 2D cross-section, ignore the correlation between slices. Furthermore, to minimize the loss of spatial information, more and more 3D networks were researched in order to segment images directly. A 3D Faster R-CNN model was used to generate candidate nodules by designing a deep 3D two-way network [14]. An end-to-end multitasking neural network, based on 3D V-Net, was applied to detect and segment lung nodules simultaneously [15]. The results show that the 3D detection methods generally outperform the 2D method, but the segmentation results are not smooth and fine enough.
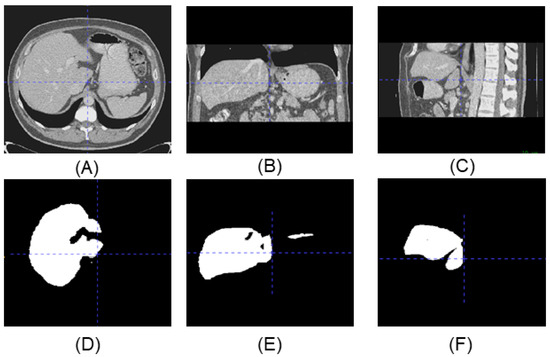
Figure 1.
Upper line is the three-view drawing of the liver CT, lower line is the corresponding label. (A) Top view of the CT. (B) Side view of the CT. (C) Front view of the CT. (D) Top view of the label. (E) Side view of the label. (F) Front view of the label.
To solve these problems, we added the hybrid LSM into V-Net. The LSM is a segmentation method which combines image information into an energy equation [16]. It implements the segmentation of the target region by solving the minimization energy equation and driving the initial contour curve evolution. The Mumford-Shah (MS) proposed to use not only the edge gradient information of the whole image, but also the global location information and length information of the ROI to optimize the global energy equation of the image [17]. The Chan-Vese (CV) model was proposed by improving the energy equation to simplify the model-solving process [18]. An LSM without re-initialization was used to further improve the application in segmenting medical images [19]. Based on this, other scholars combined the LSM and neural network model together [20,21,22]. By using a neural network to extract the deep information of the image, obtaining a priori information on the image, and using the LSM to segment the target image, a smoother and more accurate segmentation result can be obtained.
In this paper, we propose the VLSM-Net model by combining the V-Net model and hybrid LSM in order to solve the problems of ROI segmentation of medical images. In the training period, a priori V-Net model is trained by using the labeled dataset, and the outputs of the priori are regarded as preliminary segmentations. Then, we send the preliminary segmentations to the LSM for curve evolution, and treat the evolved results as the real label. In the test period, the unlabeled data are first sent to the V-Net model to obtain the coarse segmentation results, and then the coarse segmentation results are sent to the LSM for curve evolution to obtain the final fine segmentation results. The next sections will introduce the VLSM-Net in detail.
2. Methods
Figure 2 shows the architecture of the VLSM-Net model. First, the training data are fed into the V-Net model to obtain more image information. Next, according to the target region segmented by the V-Net model, the approximate pixel region of the target can be obtained, which is then used as the initial contour of the LSM to further evolve the curve and segment the target region. In the training period, as shown in Figure 2A, the labeled data are added to train the parameters of the V-Net model, and the corresponding network obtained at this step is called the priori network. Then, the result of the priori network is used as the initial contour of the LSM for curve evolution, whose result is then served as the true label. In the testing period, as shown in Figure 2B, the data are first fed into the prior network for coarse segmentation, and the segmentation result is then fed into the LSM for fine segmentation, which gives the final output. The detailed descriptions of each module can be found in the following subsections.
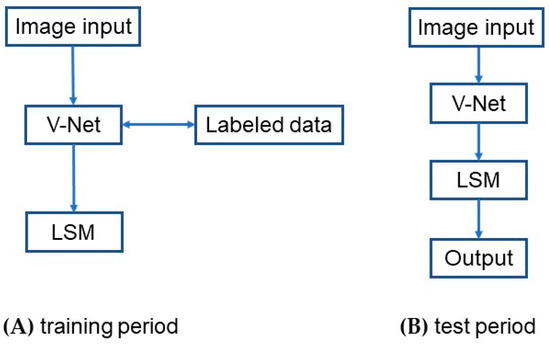
Figure 2.
The structure of the VLSM-Net model: (A) training period; (B) test period.
2.1. V-Net Model
The V-Net model plays a role in generating accurate initial segmentation results by using its 3D CNN architecture. The structure of the V-Net model is shown in Figure 3.
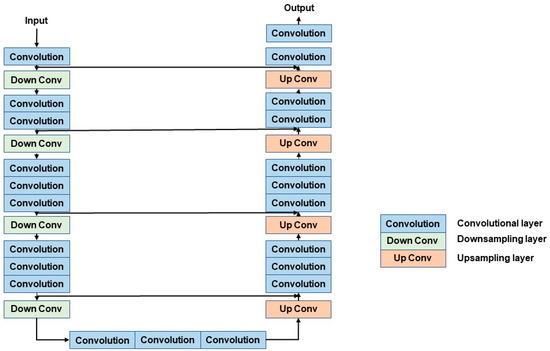
Figure 3.
The structure of the V-Net model. The left encoder includes four down-sampling modules, the right decoder includes four up-sampling modules.
The V-Net model mainly comprises an encoder path and a decoder path [23]. The encoder path is on the left side; it aims to encode the input and extract the features. The encoder path includes four stages, and each stage includes 1 to 3 convolutional layers and down-sampling layers. The role of convolutional layers is to extract characteristics from the image. On the other hand, the role of the down-sampling layer is to down-sample the feature map in order to decrease the size of input and increase its receptive field. The model avoids information loss through the use of a 2 × 2 × 2 convolutional kernel instead of a max-pooling.
The decoder, on the right side, aims to decode the extracted feature maps and recover the size of the input. The decoder path has many commonalities with the encoder path. The decoder section includes four stages which contain 1 to 3 convolutional layers and use short cut, too. In the up-sampling stage, our purpose is to recover the size of the feature map by using the deconvolution operation. The encoder path and the decoder path are connected by 3 convolutional layers.
The V-Net module uses a short cut to connect convolutional layers in different stages, which can significantly improve the gradient flow. It helps to solve the problem of network degradation.
In addition, in the last output stage, the classifier contains a convolutional layer and a SoftMax layer, where the convolutional layer is applied to reduce the number of feature maps, while the SoftMax layer is applied to obtain probabilistic segmentation of the foreground and background regions.
In conclusion, the V-Net model is a deep learning network that combines a 3D convolutional neural network and U-Net model with short cut connections. This model can extract detail features from medical images and improve segmentation accuracy. V-Net has been shown to achieve great performance in many medical image segmentation tasks.
In our paper, dice loss is adopted as the loss function, and Laplace smoothing is added to avoid the division by zero and overfitting. The loss function is represented as:
where is the predicted value, is the true value, and is the intersection of predicted and true values. Total dice loss consists of nodules dice loss and non-nodules dice loss.
2.2. Hybrid Level Set Method
The LSM is a commonly used method for medical image segmentation. The basic view is to express an active profile implicitly as a zero level set of an embedding function in a higher dimensional space. In other words, the zero level set curve can be found at any moment by obtaining its level set embedding function [24]. As shown in Figure 4, the zero set of the embedding function is the active contour , in which the points all obtain positive values inside, while the outside points obtain the opposite. Furthermore, the outside part is the direction of the curve normal vector . Thus, LSM can effectively combine the object’s boundary and region information to achieve better segmentation results by constructing an effective embedding function .
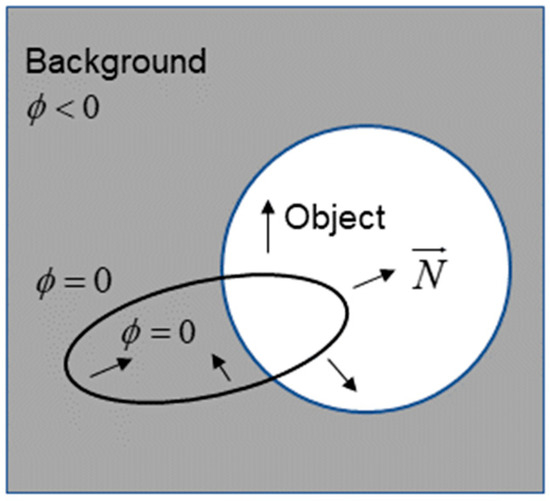
Figure 4.
Representation chart of the LSM.
The LSM, firstly proposed by Zhang et al. [25], defines the minimization function as:
where represents the input, represents the boundary feature map associated with the image gradient (g is a decreasing function), is the image region, and is the predefined weights, and is the Heaviside function [25]. The first integral part represents the region term, where is the predefined lower limit of the gray level of the object. It is easy to know the first part promotes the contour to surround the region with gray level bigger than . In other words, the image is binary segmented with a threshold . The second integral part represents the boundary term, which promotes the contour to approach the boundary with a high gradient.
The partial differential equation (PDE) of the minimization functional response is expressed as:
where div(·) means the divergence. Osher proved that the PDE of Equation (3) describes the same curve evolution when and . According to Equation (3), the specific form of is:
where the normal vector , curvature . From Equation (4), it can be found that the points in the curve all move along the normal direction. The first term of Equation (4) represents the propagation term of the internal curve expansion motion and the external curve contraction motion of the object. The second term is caused by the gradient of the boundary feature map, which is able to promote the curve to the boundary of the object. The last term represents the curvature flow, which is used to smooth the boundary.
In the LSM, to describe the same curve transformation, if is a signed distance function, the derivative of the embedding function transformed with time is:
Equation (5) shows that this is a stable numerical iteration method to replace the PDE. Obtain and represent the embedding functions in the k-th and (k + 1)-st iterations, and the numerical method from updating to includes the following three steps:
- Step 1.
- Initialization . Re-initialize the embedding function with the embedding curve (zero point setting) unchanged. The fast marching method is an effective method [26].
- Step 2.
- Update , then use the predefined time step and the equation to get .
- Step 3.
- Use and solve the PDE to obtain .
2.3. VLSM-Net Model
In the LSM, the selection of the initial contour has a crucial role in the curve evolution to reach the correct segmentation boundary, and the initial contour contains information about the location, size, and shape of the ROIs. If the initial contour is set randomly, it is possible that it will be set too far from the target; the segmentation result may miss the target completely. If the initial contour is set close to the target, the result can be more accurate. Therefore, the VLSM-Net model uses the segmentation results of the V-Net model as a priori for the LSM, sets accurate initial contours, and uses the LSM to further refine the segmentation results. A robust and accurate segmentation model of CT images can be obtained.
3. Experiment Design
3.1. Dataset
To verify the improvement of the VLSM-Net, the data for this experiment are all obtained from the LUNA16 dataset and the LiTS17 dataset.
The LUNA16 dataset is a subset of the dataset LIDC-IDRI, which is the largest public lung nodules dataset. After excluding some CT scans that were too thick, there were 888 CT scans and approximately 1,186 nodule states left. Then, preprocessing operations were performed on the data, including CT value cropping, data resampling, and cutting. After that, lung nodules labeled with the same dimensions as the CT scans in datasets were generated according to the annotation. The dataset was randomly assigned as the training set, validation set and test set in the ratio of 8:1:1.
On the other hand, the LiTS liver dataset contains 131 CT scans. All the data are acquired from different scanners, with size of 512 × 512 for each CT image, which are labeled as background, liver, or liver tumor. The same preprocessing operations are performed on the LiTS data, including CT value cropping, data resampling, and cutting. The number of training datasets, validation datasets, and test datasets is 88, 23, and 20, respectively.
3.2. Learning Curve
In order to understand the performance of the proposed method, we analyzed the learning curve of the model. The learning curve is a plot of the training and validation error or accuracy as a function of the number of training iterations.
The learning curve helps to evaluate how the model is learning and whether it is overfitting or underfitting the data. If the training error decreases with the number of iterations, but the validation error increases, then the model is overfitting the data. On the other hand, if both training and validation errors decrease with iterations, then the model is learning well.
In Figure 5, we plot the learning curve of the proposed approach in the training and validation LiTS datasets. The results show that the training and validation loss decrease, and dice increase with the epochs, indicating that the model is learning well and not overfitting the data.
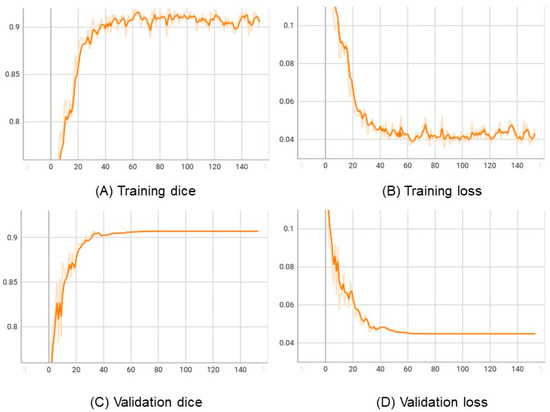
Figure 5.
The learning curves of the VLSM-Net in LiTS: horizontal axes represents epochs. (A) Vertical axis represents training dice. (B) Vertical axis represents training loss. (C) Vertical axis represents validation dice. (D) Vertical axis represents validation loss.
3.3. Evaluation Metrics
Several common evaluation metrics are selected to measure the model’s advantages and disadvantages, which are Sensitivity, Dice similarity coefficient (DSC) and accuracy (Precision) as the evaluation metrics for segmentation. They are defined as follows:
where TP is true positive, FP is false positive, FN is false negative.
4. Results and Discussion
4.1. Ablation Experiment
To verify the validity of the model, we make comparisons between the V-Net model, the LSM and the VLSM-Net in the same publicly available datasets.
The segmentation performance of different network structures is compared in the LiTS dataset, as shown in Table 1. In this dataset, it can be seen that the VLSM-Net model can achieve optimal segmentation results in the liver, in which the DSC is 92.73%, Sensitivity is 94.59% and Precision is 95.13%. Compared to the original LSM and the V-Net model, it shows that the segmentation results of the improved VLSM-Net model achieve improvements of 11.5% and 0.57% in DSC, respectively. The reason for this is the LSM lacks a deep convolutional neural network, thus it cannot utilize the deep information of the image, and has limitations in image segmentation with blurred edges. On the other hand, the V-Net model is insufficiently accurate and smooth for image edge prediction.

Table 1.
Results of the different algorithm models in LiTS17.
Figure 6 shows the predicted images of different segmentation models in the LiTS dataset from the front view. In Figure 6C, compared with the original input image and the label, the predicted result of the LSM include several disconnected parts, and its main area is smaller than that in the label (see Figure 6B). In Figure 6D, the predicted result of the V-Net model includes fewer disconnected parts, and in which the main area is similar with the label. The result of the VLSN-Net model is depicted in Figure 6E; there is only one area recognized, which is identical to the label, although a small part is missing.
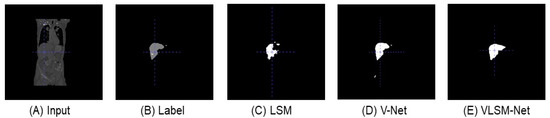
Figure 6.
From the front view, the predicted images of different segmentation models in LiTS dataset. (A) The original input image. (B) The label image. (C) The predicted image of the LSM. (D) The predicted image of the V-Net model. (E) The predicted image of the VLSM-Net.
Figure 7 displays the same predicted images generated from the top view. By comparing with the original input image and label in Figure 7B, the predicted result of the LSM (see Figure 7C) includes only one part, but its segmentation boundary is quite rough. In Figure 7D, the predicted result of the V-Net model includes a smaller extra part, and the main area bears a closer resemblance to the label. In Figure 7E, the VLSN-Net model provides a more precise prediction of the main area without any additional parts.
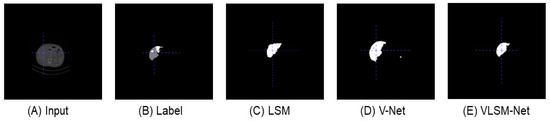
Figure 7.
This is a top view display of the predicted images generated by different segmentation models in the LiTS dataset. (A) The original input image. (B) The label image. (C) The predicted image of the LSM. (D) The predicted image of the V-Net model. (E) The predicted image of the VLSM-Net.
Compared with the predicted image of the VLSM-Net model, the predicted image of the LSM has more disconnected parts and its main area contains lots of extra parts. When compared with the traditional V-Net model, the predicted image of the VLSM-Net model is also more accurate, and closer to the real annotation.
From the above results, the predicted image of the VLSM-Net model proposed in this paper is the most effective of the three methods. Compared with the VLSM-Net model’s prediction, the predicted image of the LSM has more disconnected parts, and its main area contains lots of extra parts because the LSM is more sensitive to the problems of gray scale inhomogeneity and blurred edges in the original CT images. On the other hand, the VLSM-Net model is also more accurate and similar to the real annotation than the traditional V-Net model because of the use of the LSM, from which some boundary information is learned and used in the final prediction.
Therefore, the VLSM-Net model can achieve better performance by combining the structural features of the V-Net model and the LSM in the LiTS dataset. Next, in order to demonstrate the validity and universality of the model, we make a further comparative experiment in a LUNA dataset.
Similarly, in the LUNA dataset, various network structures are compared to assess their segmentation performance. Table 2 illustrates that the VLSM-Net model outperforms other models in terms of lung nodules segmentation, with a DSC of 82.27%, Sensitivity of 89.91%, and Precision of 86.12%. Compared to the initial LSM and the V-Net model, the VLSM-Net model provides more precise segmentation results in the LUNA dataset.
Table 2.
Results of the different algorithm models in LUNA16.
The above ablation experiments in the LiTS and LUNA datasets show that the VLSM-Net model proposed in this paper can reduce the number of disconnected parts, and improve the accuracy of the segmentation. In conclusion, the VLSM-Net model can obviously achieve better performance and results than LSM and V-Net alone.
4.2. Benchmark
After ablation experiments, to evaluate and improve the performance of the model, we made comparisons between the VLSM-Net model and other segmentation methods in the LiTS and LUNA dataset.
As can been seen in Table 3 in LiTS, VLSM-Net achieves better DSC compared to many other models, such as SegNet, U-Net and Net01 [27,28,29]. This is due to the change of structure from 2D to 3D, and the added shortcut to connect different convolutional layers. The result in LUNA is similar to the analysis of LiTS. Compared to the U-Net, U-Det, InceptionV3, and RUNet models, better performance is achieved by our VLSM-Net model.
Table 3.
Comparison of models in LiTS17 and LUNA16.
Although VLSM-Net has been shown to obtain good results in previous experiments, there are many ways to enhance it. First, more effective steps can be taken in the pre-processing stage, such as the normalization of inputs and clipping of HU values. Then, there are plenty of ways to modify the structure, by adding more short and long skip connections, adjusting as weighted cross-entropy loss functions, such as Jaccard distance, and using some ensemble learning methods which can combine the benefits of multiple models.
However, it is worth stating that our model is a universal structure, which may have fewer advantages in specific segmentation tasks. In addition, our goal at this stage is to prove that our model can effectively achieve the segmentation of 3D CT images, and adding the LSM into the V-Net model can improve its performance. In future research, we will use more tricks in pre-processing, structure, and training to improve performance and try to combine more models with LSM.
5. Conclusions
In this work, we propose a medical segmentation model VLSM-Net, which combines the structural features of the V-Net and the LSM. After our experiment, compared to the V-Net, the segmentation results of our model are finer. Compared to the LSM, our model can more accurately segment the ROIs. We not only prove the effectiveness of the VLSM-Net model in 3D CT image segmentation, but also show that it is feasible to improve performance by adding the LSM into the V-Net model.
In future work, we will concentrate on the improvement of the DSC, and adding the LSM into more CNN models to assess their segmentation performances.
Author Contributions
Y.G., J.G. and S.C. designed the research and wrote the manuscript. Y.G., J.G., C.F. and Y.W. performed the experiments. All authors have read and agreed to the published version of the manuscript.
Funding
This research is partially supported by the National Natural Science Foundation of China (Grant Nos. 71601030, 62276049) and the Science and Technology Department of Sichuan Province (Grant No.2020YJ0266).
Institutional Review Board Statement
Not applicable.
Informed Consent Statement
Not applicable.
Data Availability Statement
The original contributions presented in the study are included in the article; further inquiries can be directed to the corresponding author.
Acknowledgments
The authors would like to thank the anonymous reviewers for their valuable comments and suggestions which helped improve the quality of this manuscript.
Conflicts of Interest
The authors declare that the research was conducted in the absence of any commercial or financial relationships that could be construed as a potential conflict of interest.
References
- Ciresan, D.; Giusti, A.; Gambardella, L.; Schmidhuber, J. Deep neural networks segment neuronal membranes in electron microscopy images. In Proceedings of the Advances in Neural Information Processing Systems 25, Lake Tahoe, NV, USA, 3–6 December 2012. [Google Scholar]
- Pan, L.; Liang, H. Classification model for pathogen types in pediatric pneumonia based on deep learning. China Digit. Med. 2019, 14, 59–61. [Google Scholar] [CrossRef]
- Wang, E.K.; Chen, C.-M.; Hassan, M.M.; Almogren, A. A deep learning based medical image segmentation technique in Internet-of-Medical-Things domain. Future Gener. Comput. Syst. 2020, 108, 135–144. [Google Scholar] [CrossRef]
- Liu, C.; Yang, J.; Ou, J.; Fan, D. Offshore Oil Platform Detection in Polarimetric SAR Images Using Level Set Segmentation of Limited Initial Region and Convolutional Neural Network. Remote Sens. 2022, 14, 1729. [Google Scholar] [CrossRef]
- Goyal, M.S.; Hawrylycz, M.; Miller, J.A.; Snyder, A.Z.; Raichle, M.E. Aerobic glycolysis in the human brain is associated with development and neotenous gene expression. Cell Metab. 2014, 19, 49–57. [Google Scholar] [CrossRef]
- Calisto, M.B.; Lai-Yuen, S.K. AdaEn-Net: An ensemble of adaptive 2D–3D Fully Convolutional Networks for medical image segmentation. Neural Netw. 2020, 126, 76–94. [Google Scholar] [CrossRef]
- Zhang, Z.; Wu, C.; Coleman, S.; Kerr, D. DENSE-INception U-net for medical image segmentation. Comput. Methods Programs Biomed. 2020, 192, 105395. [Google Scholar] [CrossRef]
- Song, Y.; Zhang, L.; Chen, S.; Ni, D.; Li, B.; Zhou, Y.; Lei, B.; Wang, T. A deep learning based framework for accurate segmentation of cervical cytoplasm and nuclei. In Proceedings of the 2014 36th Annual International Conference of the IEEE Engineering in Medicine and Biology Society, Chicago, IL, USA, 26–30 August 2014; pp. 2903–2906. [Google Scholar]
- Li, L.; Ma, H. RDCTrans U-Net: A Hybrid Variable Architecture for Liver CT Image Segmentation. Sensors 2022, 22, 2452. [Google Scholar] [CrossRef]
- Zhang, Y.; Xu, L.; Bai, Y. Liver CT image segmentation based on fusion of U-Net and level set. Electron. Meas. Technol. 2021, 44, 116–121. [Google Scholar] [CrossRef]
- Pan, X.; Wei, D.; Zhao, Y. Detection of lung nodule based on mask R-CNN and contextual convolutional neural network. J. Jilin Univ. 2022, 52, 2419–2427. [Google Scholar] [CrossRef]
- Xu, Q.; Li, B. Method for detecting pulmonary nodules based on NRU network. Comput. Eng. Appl. 2021, 57, 83–90. [Google Scholar] [CrossRef]
- Wang, P.; Qiang, Y.; Yang, X.; Hou, T. Network model for lung nodule segmentation based on double attention 3D-Unet. Comput. Eng. Appl. 2021, 47, 307–313. [Google Scholar] [CrossRef]
- Zhu, W.; Liu, C.; Fan, W.; Xie, X. Deeplung: Deep 3d dual path nets for automated pulmonary nodule detection and classification. In Proceedings of the 2018 IEEE Winter Conference on Applications of Computer Vision (WACV), Lake Tahoe, NV, USA, 12–15 March 2018; pp. 673–681. [Google Scholar]
- Li, J.; Wang, K.; Yang, D.; Zhang, X.; Liu, C. Deepnodule: Multi-Task Learning of Segmentation Bootstrap for Pulmonary Nodule Detection. In Proceedings of the ICASSP 2021–2021 IEEE International Conference on Acoustics, Speech and Signal Processing (ICASSP), Toronto, ON, Canada, 6–11 June 2021; pp. 1215–1219. [Google Scholar]
- Osher, S.; Sethian, J.A. Fronts propagating with curvature-dependent speed: Algorithms based on Hamilton-Jacobi formulations. J. Comput. Phys. 1988, 79, 12–49. [Google Scholar] [CrossRef]
- Mumford, D.B.; Shah, J. Optimal approximations by piecewise smooth functions and associated variational problems. Commun. Pure Appl. Math. 1989, 2, 577–685. [Google Scholar] [CrossRef]
- Chan, T.F.; Vese, L.A. Active contours without edges. IEEE Trans. Image Process. 2001, 10, 266–277. [Google Scholar] [CrossRef]
- Li, C.; Xu, C.; Gui, C.; Fox, M.D. Level set evolution without re-initialization: A new variational formulation. In Proceedings of the 2005 IEEE Computer Society Conference on Computer Vision and Pattern Recognition (CVPR’05), San Diego, CA, USA, 20–25 June 2005; pp. 430–436. [Google Scholar]
- Zhao, L. The Research of 3D Brain Tumor Image Segmentation Integrating Improved Fully Convolutional Neural Network And Hy-Brid Level Set Method; Tianjin University: Tianjin, China, 2019. [Google Scholar]
- Liu, M.; Yang, S.; Gao, C. Surface shape vision measurement for scratch based on level set. Chin. J. Sci. Instrum. 2020, 41, 184–194. [Google Scholar] [CrossRef]
- Zhang, B. Research on Aortic CT Image Segmentation Based on Level Set Method and Deep Learning; Chongqing University of Technology: Chongqing, China, 2022. [Google Scholar]
- Milletari, F.; Navab, N.; Ahmadi, S.A. V-net: Fully convolutional neural networks for volumetric medical image segmentation. In Proceedings of the 2016 Fourth International Conference on 3D Vision (3DV), Stanford, CA, USA, 25–28 October 2016; pp. 565–571. [Google Scholar] [CrossRef]
- Tong, Y.; Li, Q.; Guan, X. An improved multi-modal brain tumor segmentation hybrid algorithm. J. Signal Process. 2018, 34, 11. [Google Scholar] [CrossRef]
- Zhang, Y.; Matuszewski, B.J.; Shark, L.-K.; Moore, C.J. Medical image segmentation using new hybrid level-set method. In Proceedings of the 2008 Fifth International Conference Biomedical Visualization: Information Visualization in Medical and Biomedical Informatics, London, UK, 9–11 July 2008; pp. 71–76. [Google Scholar]
- Sethian, J.A. Level set Methods and Fast Marching Methods: Evolving Interfaces in Computational Geometry, Fluid Mechanics, Computer Vision, and Materials Science; Cambridge University Press: Cambridge, UK, 1999; Volume 3. [Google Scholar]
- Badrinarayanan, V.; Kendall, A.; Cipolla, R. Segnet: A deep convolutional encoder-decoder architecture for image segmentation. IEEE Trans. Pattern Anal. Mach. Intell. 2017, 39, 2481–2495. [Google Scholar] [CrossRef]
- Ronneberger, O.; Fischer, P.; Brox, T. U-net: Convolutional networks for biomedical image segmentation. In Proceedings of the Medical Image Computing and Computer-Assisted Intervention–MICCAI 2015: 18th International Conference, Munich, Germany, 5–9 October 2015; Springer: Berlin/Heidelberg, Germany, 2015; Volume 18, pp. 234–241. [Google Scholar]
- Wardhana, G.; Naghibi, H.; Sirmacek, B.; Abayazid, M. Toward reliable automatic liver and tumor segmentation using convolutional neural network based on 2.5 D models. Int. J. Comput. Assist. Radiol. Surg. 2021, 16, 41–51. [Google Scholar] [CrossRef]
- Keetha, N.; Annavarapu, C.S.R. U-Det: A modified U-Net architecture with bidirectional feature network for lung nodule segmentation. arXiv 2020, arXiv:2003.09293. [Google Scholar]
- Nam, C.; Kim, J.; Lee, K.J. Lung nodule segmentation with convolutional neural network trained by simple diameter information. In Proceedings of the Medical Imaging with Deep Learning, Amsterdam, The Netherlands, 4–6 July 2018. [Google Scholar]
- Joshi, K.; Tripathi, V.; Bose, C.; Bhardwaj, C. Robust sports image classification using InceptionV3 and neural networks. Procedia Comput. Sci. 2020, 167, 2374–2381. [Google Scholar] [CrossRef]
- Ma, Q.; Liang, H.; Lang, Y. Lung nodule detection algorithm combining U-Net residual module. Comput. Eng. Des. 2021, 42, 1058–1064. [Google Scholar] [CrossRef]


Disclaimer/Publisher’s Note: The statements, opinions and data contained in all publications are solely those of the individual author(s) and contributor(s) and not of MDPI and/or the editor(s). MDPI and/or the editor(s) disclaim responsibility for any injury to people or property resulting from any ideas, methods, instructions or products referred to in the content. |
© 2023 by the authors. Licensee MDPI, Basel, Switzerland. This article is an open access article distributed under the terms and conditions of the Creative Commons Attribution (CC BY) license (https://creativecommons.org/licenses/by/4.0/).