Abstract
This paper describes the production and performance characteristics of lightweight concrete (LWC) made from porous aggregates, such as expanded glass (EG), made from glass waste, and crushed expanded polystyrene waste (CEPW), obtained by crushing packaging waste from household appliances and ordinary Portland cement (OPC). During the study, the LWC density, thermal conductivity, compressive strength, bending strength, water absorption, deformations, composite structure, and freeze–thaw resistance were evaluated. By changing the amount of OPC and replacing part of the EG with CEPW, it was possible to reduce the thermal conductivity from 0.0977 to 0.0720 W/(mK). The presence of CEPW did not degrade compressive and bending strength or long-term water absorption of LWC. The influence of the amount of porous aggregates and OPC on the resistance to freezing and thawing was investigated by two methods. In one case, the freezing resistance was studied by the method of one-sided freezing of LWC structural indicators and, in the other case, the freezing resistance was determined by the decrease in compressive strength after 25, 100, and 200 freeze–thaw cycles. By modifying the structure with CEPW aggregate the durability of LWC products was increased and deformations were decreased.
1. Introduction
Lightweight concrete (LWC) is one of the types of concrete that receives the most attention. Research studies typically focus on its production technologies and the use of porous aggregate [1]. The variety of porous aggregates is very large. Depending on the intended use, LWC can be used for load transfer with the lowest possible density or as thermal insulation, in the form of floor-to-ceiling walls [2]. Shtrepi et al. [3] investigated the sound absorption of LWC and found that these materials are also useful for effective practical applications in indoor and outdoor environments. Lightweight aggregate (LWA) concrete is widely used in special projects or structures because it is lightweight, frost resistant, crack resistant, seismic resistant, and has energy dissipation and energy absorption properties [4]. In recent decades, expanded glass (EG) has been used as LWA. LWC made using EG as LWA, which is comparatively much lighter than conventional LWA, might lead to different performance in lightweight reinforced concrete elements [5]. Limbachiya et al. [6] stated that EG has been used in construction as a lightweight non-structural and semi-structural material. Due to the low density of the EG aggregate, the compressive strength of this material is relatively low [7,8]. EG is a fine, porous building material with porosity of 85–90%. Its density may vary from 187 to 1600 kg/m3 [9] and it is clean, light, flame resistant, efficient, environmentally friendly, and easy to handle. Despite the low density of the material, it has sufficient strength to be used in building constructions (0.45–0.55 N/mm2), having low water absorption, and high resistance to chemicals and frost action [10,11,12,13,14]. As described in [15], as the EG aggregate content increases, the density value drops from 2328 kg/m3 (for the control mix) to 1401 kg/m3, for concrete with 100% EG aggregate, and the compressive strength value drops from 30.67 to 14.97 MPa.
To further lighten the LWC, polystyrene foam beads can be used. LWC made with polystyrene foam beads reduces thermal conductivity and water absorption [1]. Kligys [16] studied a composite material made of polystyrene foam waste, Portland cement, and various additives. The density of the obtained material ranged from 150–350 kg/m3. The author found that the compressive strength of such a composite material was low (0.05–0.42 MPa) but reducing the density and compressive strength allowed a low thermal conductivity coefficient to be obtained, ranging from 0.0493–0.0955 W/(mK). Souza et al. [17] performed tests on cellular concrete specimens using polystyrene foam pellets. They found that replacing sand with polystyrene foam beads in cellular concrete reduced compressive strength by 47.2%. The authors used 1.54–1.65 kg of polystyrene foam beads per 1 m3 of cellular concrete.
EG and expanded polystyrene (EP) aggregate are a lightweight potential replacement for thermal insulating LWC, because there are large amounts of glass and EP waste in the world, which can be used as a secondary, and environmentally friendly, raw material [18].
Several authors have emphasised that materials containing light aggregate are less resistant to frost but have sufficient frost resistance to be used in wall constructions [19,20,21]. The frost resistance of LWC especially decreases when the amount of LWA and the size of the aggregates themselves increase [22]. Gencel et al. [23] noted that the freezing resistance of LWC is mainly determined by the porosity of the product. Pospíchal et al. [24] indicated that a concrete’s resistance to freezing is not only determined by the system of air gaps in the product, but also by the connections between the aggregate and the matrix. In order to increase the frost resistance of materials containing light aggregate, it is not necessary to increase the density (as in the case of heavy concrete), but either the open porosity needs to be decreased or the density of cement stone needs to be increased [25]. Sufficient frost resistance is obtained by using porous aggregate or using air-entraining admixture (AEA) in cement stone. The frost resistance of these materials can be increased by using hydrophobic additives [26]. As indicated by Buževič [25], if the composition of the materials is chosen accordingly, the resistance to frost on the basis of the cement and light aggregate can reach up to 500 cycles (by the volume freeze–thaw method). In practice, without the use of surfactants (PAMs), 10 to 200 (or more) cycles are achieved, depending on the nature of the aggregate. A reliable way to increase frost resistance is by reducing the V/C ratio within certain limits and using PAM (hydrophobic additives and air entraining admixtures) [27].
The novelty of this work is the modification of the LWC structure with CEPW aggregate. The developed LWC was characterised by low thermal conductivity and sufficient strength characteristics required for the installation of building envelopes because of the use of CEPW. In addition, the introduction of CEPW into the structure of LWC allowed the reduction of deformation due to drying and humidity and an increase in the durability of the products. In this work, the influence of CEPW additives on the performance characteristics of LWC was evaluated. The compressive and bending strength, thermal conductivity, and long-term water absorption of LWC specimens were determined and the dependences of these indicators on density were described by regression equations. The effect of CEPW on deformation was evaluated by determining the shrinkage and expansion of the LWC. In order to evaluate the durability of LWC, indirect tests of freezing and thawing, based on structure indicators, and direct tests, based on changes in compressive strength values, were applied.
2. Materials and Methods
2.1. Materials
In this study, ordinary Portland cement CEM I 42.5 R (OPC) was used as a binder for LWC specimens. OPC was produced by JSC “Akmenės Cementas” (Akmenė, Lithuania) according to the requirements of the EN 197-1 [28] standard. The main characteristics of OPC are presented in Table 1.

Table 1.
Main characteristics of OPC.
To reduce the viscosity of the Portland cement matrix, a polymeric dispersant (PD), Castament® FS 40, was used. PD Castament® FS 40 is a spray-dried, free-flowing powder of a polymerisation product based on polyethylene glycol. Castament® FS 40 was produced by BASF Construction Solutions GmbH (Trostberg, Germany). The main characteristics of PD are presented in Table 2.
Table 2.
Main characteristics of PD.
Metakaolin waste (MKW) is formed during the technological processes required to produce expanded glass and was used as a pozzolanic microfiller. Ten percent of the OPC was replaced with MKW. MKW accelerates the hydration of Portland cement and participates in the pozzolanic reaction with portlandite, formed by the hydration of the main cement minerals. MKW also slightly performs the functions of a superplastic and ensures the formation of fine pores in concrete, increasing its durability. MKW was obtained from the company JSC “Stikloporas” (Druskininkai, Lithuania). The main characteristics of MKW are presented in Table 3.
Table 3.
Main characteristics of MKW.
The air-entraining admixture (AEA) “UFAPORE TCO” was used to ensure the formation of small pores in the cement matrix and to hydrophilise the crushed polystyrene foam waste. AEA is an admixture based on sodium alkene sulphonate. AEA was produced at Unger Fabrikker AS (Fredrikstad, Norway). The main characteristics of AEA are presented in Table 4.
Table 4.
Main characteristics of AEA.
The expanded glass (EG) aggregate of three different fractions (0–2, 4–8, and 8–16 mm) were produced by JSC “Stikloporas” (Druskininkai, Lithuania) and used as LWA in LWC. The main characteristics of the EG aggregate are presented in Table 5.
Table 5.
Main characteristics of the EG aggregate.
In this study, crushed aggregate of polystyrene foam packaging waste containers (CEPW) (0–2 mm), were supplied by “Virginijus ir Co” (Plungė, Lithuania) and used to significantly facilitate LWC. The bulk density of the (0–2) mm fraction was 15.0 kg/m3.
2.2. Preparation of Forming Mixtures and Specimens
The compositions of the mixtures that make up the LWC are provided in Table 6. The composition was formed as follows: first, the water was mixed with AEA, SP, OPC, and MW and the entire amount of OPC was mixed for 5 min. Then, the necessary amount of aggregate (fraction 0–2 mm) (in one case: EG, in the other: CEPW) was added to the forming mixture. After mixing, the necessary amounts of the 4–8 mm and 8–16 mm fractions of EG aggregate were added. The components were mixed until a homogeneous formation mixture was obtained. This was poured into metal moulds and slightly compacted with a 500 × 50 × 20 mm wooden stick, to avoid damaging the aggregate structure, and then additionally compacted on a vibrating table for 1 min. The dimensions of the formed specimens were selected according to the requirements of a specific test method. All forming mixtures were prepared by forced mixing at 125 rpm, in a laboratory mixer with a vertical rotation axis.
Table 6.
Compositions of mixtures of LWAC specimens.
For the determination of the properties of the hardened LWC specimens, the moulds were kept in hermetically sealed plastic bags for two days, and then the specimens were demoulded and kept for 7 and 28 days at 50% RH and (20 ± 5) °C, in a conditioning room.
2.3. Test Methods
The compressive strength of the LWC specimens was determined according to the requirements of the EN 826 standard [29]. The dimensions of the specimens were 100 × 100 × 100 mm. Seven specimens were prepared for testing. Before each test, the specimens were conditioned for 72 h in an environment of (50 ± 5)% RH and temperature of (23 ± 2) °C. The tests were performed after 28 days of curing. Strength characteristic testing was performed using a Hounsfield H10KS computerised universal testing machine (Hounsfield. Ltd., Salfords, UK).
The thermal conductivity coefficient of the LWC specimens was determined at an average temperature of 10 °C, according to the requirements of the EN 12,664 standard [30]. Three specimens were prepared for testing. Before each test, the specimens were conditioned for 72 h in an environment of (50 ± 5)% RH and temperature of (23 ± 2) °C. The length and width of the specimens were 500 × 500 mm, and the height was (100 ± 5) mm. Measurements were made with a λ-Meter EP-500 computerised thermal conductivity measuring device (Germany).
The bending strength of the specimens was determined according to the requirements of the EN 12,089 standard [31]. Prism-shaped specimens, with dimensions of 160 × 40 × 40 mm, were prepared for testing. Before each test, the specimens were conditioned for 72 h in an environment of (50 ± 5)% RH and temperature of (23 ± 2) °C. The tests were performed after 28 days of curing.
The long-term immersion of the specimens in water was determined according to the requirements of method A of the EN ISO 16,535 standard [32]. Five specimens of each composition, with dimensions of 100 × 100 × 100 mm, were prepared for testing. Before the tests, the specimens were conditioned for 72 h in an environment of (50 ± 5)% RH and temperature of (23 ± 2) °C. The water temperature in the test bath was maintained at (20 ± 2) °C throughout the test.
The sizes of the wet expansion and drying shrinkage deformations of the specimens were determined according to the methodology of the EN 772-14 standard [33]. Six prism-shaped specimens, with dimensions of 160 × 40 × 40 mm, were prepared for the tests. The length changes of the LWC specimens were measured with a Mitutoyo ID-C12D digital indicator (Mitutoyo America Corporation, Aurora, CO, USA) and using the DMX Viewer computer programme.
The durability of the LWC specimens was evaluated in two ways. In the first case, the durability of the specimens was evaluated by determining structural indicators and predicting the operational resistance to cold, which shows the durability potential of the material when evaluated by one-sided freezing and thawing. In the second case, durability was determined directly by bulk freezing and thawing.
The predicted operational resistance to cold was calculated according to the methodology for determining the macrostructural indicators of the specimens [34,35].
When the effective porosity , the beginning of decay in the specimen was calculated in conditional cycles according to Equation (1):
and the end of the decomposition, was calculated according to Equation (2):
where R is the reserve of the pore space, characterising the number of reserves and capillaries into which water or plastic ice penetrates with great difficulty. The porous space reserve was calculated according to Equation (3):
where is the effective porosity, which characterises the effective pore and capillary potential of the specimen, i.e., those pores and capillaries that easily fill with water. The effective porosity of the specimen was calculated according to Equation (4):
where is the mass of the specimen soaked under normal conditions, in g; is the mass of the specimen dried to a constant mass, in g; is the is the density of the specimen, in g/cm3; and is the total open porosity index, which characterises the entire open communicating pore space of the composite specimen, in terms of macrostructure and microstructure. The total porosity of the specimen was calculated according to Equation (5):
where is the mass of the vacuum-soaked specimen, in g.
The relative thickness of the pore and capillary wall was calculated according to Equation (6):
The flow rate of the capillary mass in a vacuum (perpendicular to the cooling direction) was calculated according to Equation (7):
where is the mass of the specimen saturated by capillary suction in a vacuum (when saturated through a plane which, in operation, would be perpendicular to the refrigerated plane, after 10 min), in g; and is the area of the working surface of the specimen, in cm2.
The flow rate of the capillary mass in a vacuum (in the cooling direction) was calculated according to Equation (8):
where is the mass of the specimen vacuum-saturated by capillary suction when saturated through a plane that would be refrigerated in service after 10 min, in g.
The degree of heterogeneity of the structure makes it possible to estimate the non-uniformity of the effective capillaries, according to their equivalent length. The degree of structural heterogeneity was calculated according to Equation (9):
where is the maximum value of the capillary rise along the wetting front, in mm; and is the minimum value of the capillary rise along the wetting front, in mm.
The flow rate of the capillary mass under normal conditions in the cooling direction , after 30 min, was calculated according to Equation (10):
where is the mass of the specimen after suction under normal conditions in the cooling direction, in g.
In the second case, the cold resistance of specimens of different compositions was determined according to LST L 1428-17 [36], by volume freezing and thawing. The specimens were placed in a bath where the water temperature was maintained at (18 ± 5) °C. Before soaking, the specimens were fixed to a grid with clamps, designed to ensure a water level of at least 20 mm on the bottom surface of the specimens. On the first day, the bath was filled with enough water to cover one third of the height of the specimens. Specimens covered in this way were kept for 24 h. After that, enough water was added to the bath to cover two thirds of the height of the specimens. Such immersed specimens were, again, kept for 24 h. Water was then added in such a way that it completely covered the specimens and the thickness of its layer above the specimens, and on all their sides, was not less than 20 mm. Specimens immersed in this way were kept for 48 h (in total, the soaking of the specimens in water took 4 days). After saturation with water, the compressive strength of the control specimens was determined according to EN 826 [29]. The specimens intended for testing were placed in a refrigeration chamber, where the temperature was maintained at minus (18 ± 2) °C. The holding time of one cycle after reaching a temperature of minus 16 °C was at least 3 h. At the end of the cooling period, the specimens were kept in a bath with water at a temperature of (18 ± 5) °C and kept there for at least 3 h. Figure 1 shows a view of the test specimens in the refrigeration chamber.
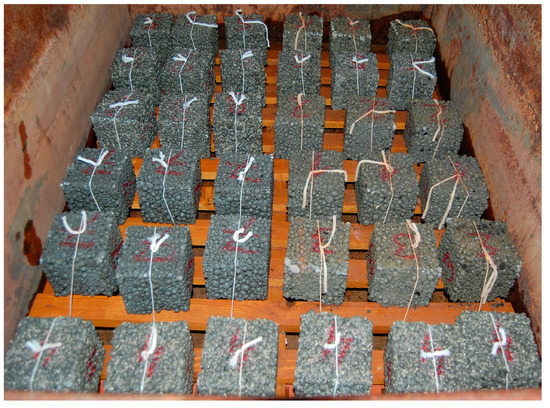
Figure 1.
Test specimens in a bath in a refrigeration chamber before soaking.
After a set number of freezing and thawing cycles (25, 100, and 200 cycles), the compressive strengths of the specimens were determined according to EN 826 [29].
Measurement errors were calculated using the following procedure: first, the mean value of the measurements was calculated using the following Equation (11):
where is the result of successive measurements and n is the number of measurements. Second, the mean square deviation was calculated using the following Equation (12):
For the analysis of the macrostructure of the specimens, photographs of the specimens prepared for the compression tests were taken. The photographs were taken with the help of a Canon EOS 6D Mark II camera. To analyse the microstructure of the composites, specimens of 40 × 40 × 40 mm were prepared. The specimens were inspected on a Zeiss EVO-50 EP scanning electron microscope (SEM) (Carl Zeiss SMT GmbH, Oberkochen, Germany). The analysis was performed in variable pressure mode at an accelerating voltage of 20 keV and a working distance of 10 to 15 mm.
3. Research Results and Discussion
The density dependencies of the compressive strength and thermal conductivity of the prepared LWC specimens are presented in Figure 2. From the presented figure, it can be seen that the compressive strength and thermal conductivity of LWC also increase with increasing density. Two methods were used to analyse the experimental data: regression analysis and analysis of variance (ANOVA). Regression analysis made it possible to assess the dependence of the values of one quantity on another. The ANOVA statistical model allowed us to assess whether the means of different groups are the same. With a dashed line, Figure 2a shows the minimum possible compressive strength values and Figure 2b shows the maximum possible thermal conductivity values calculated with a 95% confidence interval.
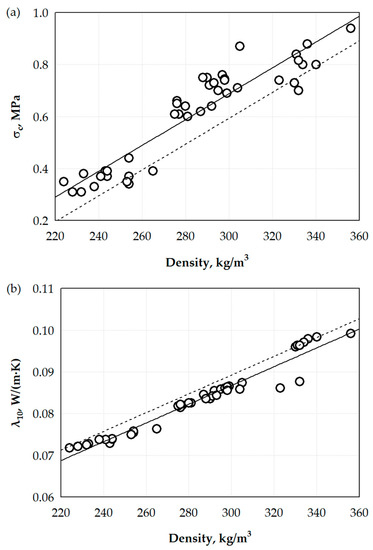
Figure 2.
Dependencies of compressive strength (a) and thermal conductivity (b) on the density of the LWC; ○—experimental values.
The dependencies of compressive strength and thermal conductivity coefficient are described by the regression Equations (13) and (14), respectively:
with a determination coefficient and standard deviation , where is LWC density, in kg/m3, and
with a determination coefficient and standard deviation .
Basically, OPC affects the density. The higher the amount of OPC we add to the prepared mixture, the higher the LWC density we obtain. In this study, we were most interested not in the effect of OPC on density but in the effect of CEPW on both compressive strength and thermal conductivity. In Figure 3, an analysis of the effect of CEPW on the compressive strength and thermal conductivity of the specimens is presented. In the first case (Figure 3a), the compressive strength results were compared, when only EG beads were used and when part of the EG was replaced by CEPW aggregate. In the figure, and according to the ANOVA statistical model, the mean of the results is marked with a solid line and the two-sided confidence interval is marked with dashed lines. Analysis of the results shows that the difference in results is not significant.
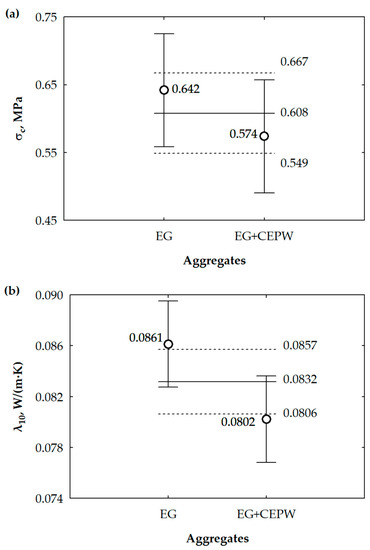
Figure 3.
Analysis of the effect of CEPW on compressive strength (a) and thermal conductivity (b).
The average values obtained for compressive strength meet the 95% confidence limits, and this indicates that the replacement of part of the EG aggregate with the CEPW aggregate does not affect the compressive strength (or that the influence is insignificant). In the second case, the thermal conductivity results were evaluated (Figure 3b). The analysis of the results showed that the use of CEPW aggregate affects the reduction of thermal conductivity. The average values of the thermal conductivity measurements obtained are not within the range and this means that the results of the specimens made with only EG aggregate, and the specimens with partially replaced aggregate from CEPW, differ significantly. With CEPW, we achieved our goal of significantly reducing thermal conductivity with little or no reduction in compressive strength.
Figure 4 shows the dependence of the bending strength on the density. The bending strength values not only allow a more accurate assessment of the effects of density, binder content, and aggregate on the strength characteristics but, also, a comparison with the obtained LWC values obtained in the studies of other authors. Figure 4 shows that, as the LWC density increases, an increase in flexural strength is also observed. To describe the dependence between density and bending strength, we obtained Equation (15):
with a coefficient of determination and standard deviation .
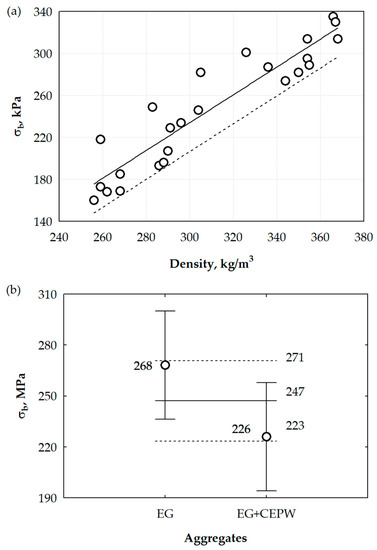
Figure 4.
Dependence of the bending strength on density (a) and analysis of the effect of CEPW on the bending strength (b).
Then, an analysis of the effect of CEPW on the bending strength of the specimens was carried out. A comparison of the flexural strength results was only made when the EG aggregate was used and when part of the EG was replaced with the CEPW aggregate.
Analysis indicates that the differences in the results are not significant. The obtained average values of flexural strength meet the 95% confidence interval, and this indicates that the replacement of the EG aggregate with the CEPW aggregate does not influence flexural strength (or that the influence is insignificant). To summarise the results, it can be stated that replacing the EG aggregate with the CEPW aggregate does not affect the strength parameters.
The macrostructural studies of the LWC specimens are presented in Figure 5. The purpose of the study was to evaluate the effect of the CEPW aggregate on the macrostructure of the LWC and to explain its effects on the strength characteristics and thermal conductivity. Figure 5a shows a general view of the LWC when only EG aggregate is used, and Figure 5b shows when the 0–2 mm fraction of EG is replaced by CEPW. In the first case, we observe the formation of large voids in the LWC structure. The width of the spaces in the individual zones exceeds 5 mm. Through these voids, intensive heat transfer through the air can occur. Meanwhile, the EG aggregates themselves are well connected to each other by the touching surfaces, which allows us to ensure sufficient strength of the LWC.
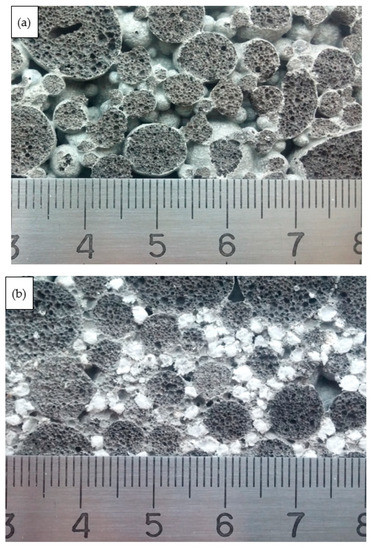
Figure 5.
View of the macrostructure of LWC: (a) with the EG aggregate; (b) with the EG and CEPW aggregate.
In the second case, we observe that almost all voids are filled with CEPW. Very small gaps were formed between the CEPW aggregates themselves, which are even smaller than the pores formed between the EG aggregates themselves. This good filling is due to the fact that the CEPW aggregate is very soft and fits well between the larger EG aggregates and so, in most cases, the CEPW aggregate appears slightly deformed. Deformation is likely to occur during compaction, so good void filling was observed, and there were no gaps between CEPW and EG. Since CEPW aggregates are soft and mechanically damaged during crushing, mixing, and compaction, their influence on the strength of LWC is unobservable or very insignificant. In addition, as already mentioned, EG aggregates are well connected to each other by their contact surfaces, and so the load primarily affects the EG aggregate, which has a significantly higher strength than CEPW.
The operational properties of LWC products, particularly the resistance to freezing and thawing, are closely related to the effects of water. In this work, we evaluated the effect of water on LWC by long-term immersion in water and moisture deformations.
In Figure 6a, the dependence of the long-term water absorption of the specimens on the density is presented. The figure shows that the long-term water absorption of LWC decreases with increasing density. The test results are described by the regression Equation (16):
where the determination coefficient and standard deviation .
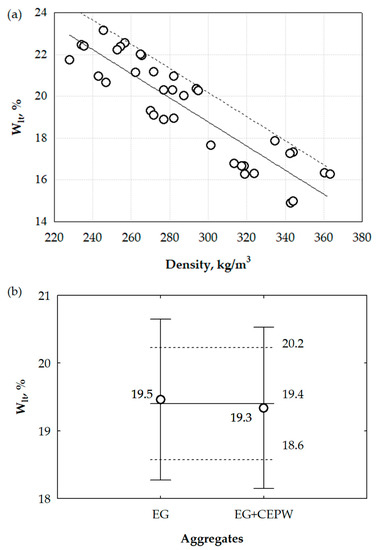
Figure 6.
Dependence of the long-term water absorption of the specimens on the density (a) and analysis of the effect of CEPW on the water absorption (b).
The upper limit of the results is indicated by the dashed line in Figure 6, calculated with a 95% confidence interval.
The resulting dependence shows that, with a 1.5-times increase in LWC density, the long-term absorption decreases by approximately 1.41 times; by increasing the LWC density by 1 kg, the long-term absorption decreases by approximately 0.057%. Figure 6b shows the evaluation of the effect of the CEPW on the water absorption of the specimens. Analysis shows that there is almost no difference in the results when there is only EG aggregate or when part of the EG aggregate is replaced by CEPW aggregate. In both cases, the average values of the results are similar and close to the overall average of the results. This means that the water absorption is not affected by CEPW.
During operations, building materials become wet in the case of higher relative air humidity and dry out in dry periods. During the moisture sorption and desorption processes, most materials expand by absorbing moisture from the surrounding air and shrink by drying. Such a change in material dimensions can cause damage or collapse of structures. In Figure 7, the results of LWC expansion–shrinkage tests with light aggregate are presented.
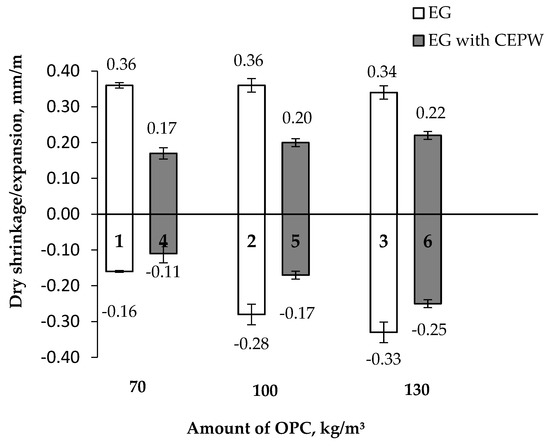
Figure 7.
Dependence of LWC shrinkage/expansion on the amount of cement: 1–6—designation of the composite composition (see Table 6).
The conducted studies have shown that the use of CEPW aggregate reduces the shrinkage and expansion of the thermal insulation composite, especially at the lowest PC content (70 kg/m3). Higher amounts of OPC are likely to result in higher internal stresses, which, in turn, lead to greater expansion or shrinkage. Additionally, it is likely that some of the moisture from the EG is taken up by the CEPW. As CEPW is sufficiently plastic, both drying shrinkage and moisture expansion have no (or negligible) influence on CEPW aggregate dimensions, and CEPW itself reduces internal stresses due to drying or wetting. Drying shrinkage is explained by the loss of moisture in the concrete, usually due to interaction with the surrounding environment, causing internal shrinkage stress, which can lead to cracking and loss of physical and mechanical properties of the concrete [37].
The average values of the structural indicators determined for LWC with EG aggregate and LWC specimens with mixed EG and CEPW aggregate are presented in Table 7.
Table 7.
Average values of LWC structural indicators and calculated operational frost resistance.
The calculated values of operational cold resistance of the specimens with EG aggregate FRE1 varied from 216 to 230 conditional cycles and FRE2 varied from 782 to 1539 conditional cycles. For specimens with EG and CEPW aggregate, the values of operational cold resistance FRE1 varied from 142 to 268 conditional cycles, and FRE2 varied from 727 to 1239 conditional cycles (see Figure 8).
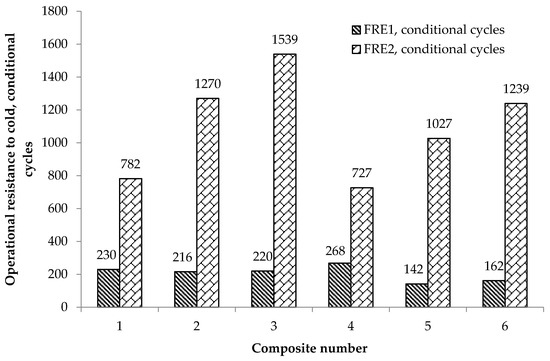
Figure 8.
Predicted operational cold resistance values for the conditional cycles at the start of decomposition and the end of decomposition: 1–6—composition number of the LWC (see Table 6).
By analysing the operational frost resistance values, calculated according to the methodology adapted to predict the frost resistance of porous building materials in a one-sided method [34,35], we can see that LWC (taking into account the various aggregates used but not their composition) has a relatively high durability potential.
The minimum value of the operational cold resistance (FRE1) of the composite specimens with the EG and CEPW aggregates was 142 conditional cycles and the highest FRE2 was 1539 conditional cycles. In our opinion, the higher durability potential was determined by the porous macrostructure formed by the specimens. The reserve of porous space, which defines the amount of reserve pores and capillaries through which water or plastic ice penetrates with great difficulty, but gradually fills up during cyclic freezing and thawing, varied from 57.2–80.5%. Effective porosity, which describes the effective pores of the specimen and the capillary potential, i.e., those pores and capillaries that are easily filled with water, varied from 8.8–12.2%, and the total open porosity index, which characterises the entire open communicating pore space of the composite specimen, varied from 23.7–46.4%.
The predicted service life of materials suitable for unprotected use under direct exposure to aggressive environmental conditions, characterised by high values of pore space reserve (54–71%), but low values of effective porosity (2–3%) and total open porosity (5–9%), varies from 722 to 1263 conditional cycles [38]. It is also stated that the values of the beginning and end of the decomposition of individual compositions are close. Therefore, when evaluating the durability potential of LWC specimens containing porous aggregates, despite the high values of pore space reserve and the high predicted in-service cold resistance based on the end of degradation (but considering the higher values of effective porosity, total open porosity, and the wide range of start and end values of the individual composition interval), it can be said that such LWC (1–6 mixture compositions) can be used in moderately aggressive environmental conditions, i.e., in structures protected from direct environmental impacts.
The direct cold resistance of the thermal insulation LWC specimens was evaluated according to changes in their compressive strength, comparing the compressive strength of the control specimens and specimens that were frozen and thawed for 25, 100, and 200 cycles by volume freezing and thawing according to the LST 1428-17 [36] methodology.
The results of compressive strength determined from the control specimens and after 25, 100, and 200 freezing and thawing cycles are presented in Figure 9; the calculated changes in compressive strength are presented in Table 8.
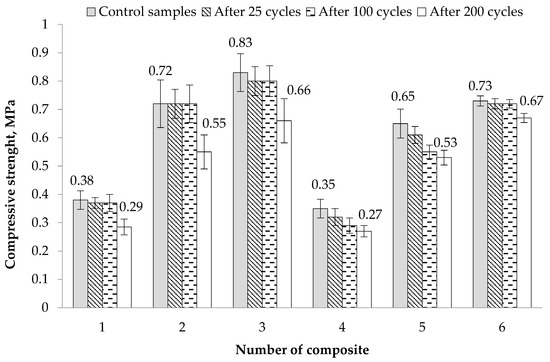
Figure 9.
Compressive strength of the control specimens and after 25, 100, and 200 freeze–thaw cycles.
Table 8.
Changes in compressive strength after 25, 100, and 200 freeze–thaw cycles.
Evaluating the obtained results, Figure 9 and Table 8 show that the decrease in the compressive strength of the specimens with EG aggregate, after 25 and 100 cycles of freezing and thawing, is uniform and small, with the values of ∆f varying from 0.0 to 3.6%. Here, the decrease in compressive strength of the samples after 200 cycles of freezing and thawing is large and the values of ∆f vary from 20.5–25.0%.
The reduction in compressive strength of the specimens with EG and CEPW aggregate after 25 freeze–thaw cycles was greater, the maximum value of ∆f being 9.1%. After 100 freeze–thaw cycles, the maximum value of ∆f was 18.2% and after 200 freeze–thaw cycles and defrosting cycles, the maximum value of ∆f reached 24.2%. The compressive strength of composition 6 of the specimens with the highest binder content is increased.
To summarise the research results obtained, we can say that: although LWC structures are exposed to changes in humidity and freezing and thawing, using LWC structures which are effectively protected from the direct effects of climatic conditions significantly increases their durability; they can be considered frost resistant in moderately aggressive environmental conditions.
In Figure 10a, we can see the contact zone between the bead and the binder before freezing. In this zone, the formation of a solid mass is observed. There are no cracks or other types of damage, either in the binder or in the EG bead. In Figure 10b, the view of the specimen after freezing is shown. Smaller or larger cracks are observed throughout the volume of the specimen. The largest cracks are observed in the pore walls of the EG bead, whereas individual small cracks are observed in the contact zone between the bead and the binder and in the binder layer itself. Since the pore walls of the EG beads are thin and weak, a large number of cracks form due to the freezing of water. Meanwhile, the small cracks that appeared in the contact zones between the bead and the binder and in the walls of the binder could have been caused both by the formation of small ice crystals and by the large stresses created in the EG aggregate during freezing.
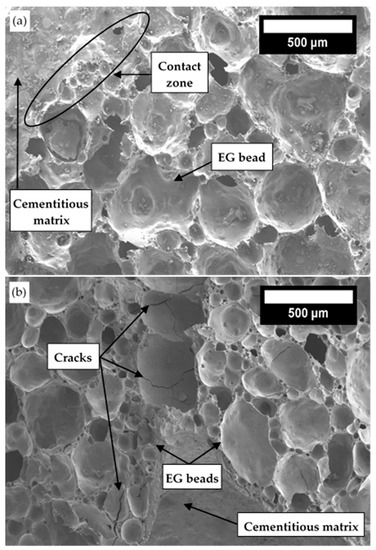
Figure 10.
View of the LWC with EG aggregate: (a) before freezing test; (b) after 200 freeze–thaw cycles.
In Figure 11, a comparison of the microstructure of LWC with EG beads and CEPW aggregate, before and after freezing tests, is shown.
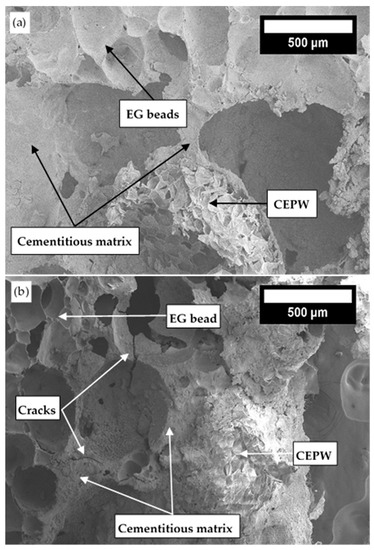
Figure 11.
View of the LWC with mixed aggregate: (a) before freezing; (b) after 200 freeze–thaw cycles.
Figure 11a shows a view of the specimen before the freezing tests. Well-formed contact zones between EG, CEPW, and the cementitious matrix are observed. Several very small cracks are observed in the pore walls of EG beads, which may have appeared during the compaction of the mixture. There are no cracks in other areas, i.e., the cementitious matrix or CEPW. Figure 11b shows the view of the specimen after the freezing test. Some lager cracks are observed in the EG bead and cementitious matrix. These cracks terminate when they make contact with the CEPW. This means that CEPW has the potential to reduce cracking in LWC products. Since CEPW is sufficiently plastic, when water freezes in it, its walls do not crack but can move toward free space or expand.
The comparison of LWC is complicated by the different compositions of the mixtures, and the amount of binder, additives, fillers, densities, production technologies, etc. Density mostly reflects the main performance characteristics of LWC. In terms of density, the LWC specimens obtained are very close to modified foam concrete products or specimens prepared with polystyrene foam beads [17,23,39]. Genzel et al. [23] indicated that after using blown perlite, glass sand, and foaming agent for the production of LWC, when 1 m3 of concrete is composed of 100 kg of foam, the compressive strength obtained is close to 1 MPa, the flexural strength ranges from 0.24–0.63 MPa, the compressive strength (after freezing) decreases to 36.2% after 25 cycles, and the bending strength decreases to 12.7%.
The authors obtained a minimum density of 594 kg/m3, so the thermal conductivity is much higher than in our research (0.17 W/(mK)). It should be noted that the authors obtained a very high absorption in water, which reached 54.5%, and, after almost doubling the density, they reduced the absorption to 21.6%. Additionally, the amount of foam was larger. When the authors used only 50 kg/m3 foam, the absorption ranged from 25.1–15.3%. In another work [39], at a foam concrete density of 200–300 kg/m3, the thermal conductivity varied from 0.06–0.08 W/(mK), and the compressive stress from 0.8–1.1 MPa. Souza et al. [17] used EPS beads to replace part of the sand in the preparation of LWC. These authors used 1.54, 1.60, and 1.65 kg/m3 polystyrene foam beads, while, in our work, 5 kg/m3 was used. The authors obtained higher densities of 453, 482, and 510 kg/m3, respectively. At this density, the compressive strength after 28 days of curing was 1.0–1.6 MPa and the water absorption was 60–85%.
In summary, we can say that in the work we managed to create LWC with good operational characteristics, which is suitable for operations under moderately aggressive environmental conditions.
4. Conclusions
In this study, investigation of performance characteristics of LWC with porous aggregates such as EG and CEPW was performed. During the study, LWC density, thermal conductivity, compressive strength, bending strength, water absorption, deformations, composite structure, and freezing–thawing resistance were analysed and the following results were obtained:
The modification of LWC with CEPW aggregate allows improvement of the thermal characteristics of the material without deteriorating the compressive and bending strength values. Incorporation of CEPW leads to changes in the macrostructure and results in a decrease in the number of large voids in the LWC, leading to an overall decrease in thermal conductivity from 0.0977 to 0.0720 W/(mK).
It was determined that, with a 1.5-times increase in LWC density, the long-term absorption decreases by approximately 1.41 times. The evaluation of the effect of the CEPW on the water absorption of the specimens shows that only with EG aggregate and when part of the EG aggregate is replaced by CEPW aggregate are the average values of the results similar to the overall average of the results.
The amount of LWC deformations, due to increased or decreased humidity, can be reduced by using CEPW aggregate. The lowest shrinkage value of 0.11 mm/m and an expansion value of 0.17 mm/m are observed when the LWC structure is modified with CEPW aggregate and 70 kg/m3 of OPC is used.
The durability of LWC products increases, not only by increasing the amount of cement in the material, but also by modifying the structure with CEPW aggregate. The degradation of the compressive strength value of the specimens with EG and CEPW aggregate after 200 freeze–thaw cycles with the highest binder content of 130 kg/m3 was about 3 times lower than of the specimens without CEPW aggregate. Microstructural studies confirmed that the CEPW contained in the LWC is not damaged during freezing and does not allow the formation of continuous cracks throughout the volume of the LWC.
In order to produce an effective thermal insulation material from LWC with sufficient strength characteristics, the influence of the CEPW size on strength characteristics and the influence of the ratio of EG and CEPW should be analysed in more detail in the future, in order to further reduce thermal conductivity, improve macrostructure, and increase durability.
Author Contributions
Conceptualisation, S.V. (Sigitas Vėjelis) and J.Š.-J.; methodology, S.V. (Sigitas Vėjelis), J.Š.-J. and V.K.; software, J.Š.-J. and S.V. (Saulius Vaitkus); validation, J.Š.-J. and V.K.; formal analysis, S.V. (Sigitas Vėjelis) and S.V. (Saulius Vaitkus); investigation, S.V. (Sigitas Vėjelis), A.K., V.K., S.V. (Saulius Vaitkus) and J.Š.-J.; resources, J.Š.-J. and S.V. (Sigitas Vėjelis); data curation, S.V. (Sigitas Vėjelis); writing—S.V. (Sigitas Vėjelis) and J.Š.-J.; writing—review and editing, S.V. (Sigitas Vėjelis) and J.Š.-J. and A.K.; visualisation, A.K.; supervision, S.V. (Sigitas Vėjelis) and J.Š.-J. All authors have read and agreed to the published version of the manuscript.
Funding
This research received no external funding.
Institutional Review Board Statement
Not applicable.
Informed Consent Statement
Not applicable.
Data Availability Statement
Not applicable.
Conflicts of Interest
The authors declare no conflict of interest. The funders had no role in the design of the study; in the collection, analyses, or interpretation of data; in the writing of the manuscript; or in the decision to publish the results.
References
- Amran, M.; Onaizi, A.M.; Fediuk, R.; Danish, A.; Vatin, N.I.; Murali, G.; Abdelgader, H.S.; Mosaberpanah, M.A.; Cecchin, D.; Azevedo, A. An ultra-lightweight cellular concrete for geotechnical applications—A review. Case Stud. Constr. Mater. 2022, 16, e01096. [Google Scholar] [CrossRef]
- Haller, T.; Beuntner, N.; Gutsch, H.; Thienel, K.C. Challenges on pumping infra-lightweight concrete based on highly porous aggregates. J. Build. Eng. 2023, 65, 105761. [Google Scholar] [CrossRef]
- Shtrepi, L.; Astolfi, A.; Badino, E.; Volpatti, G.; Zampini, D. More Than Just Concrete: Acoustically Efficient Porous Concrete with Different Aggregate Shape and Gradation. Appl. Sci. 2021, 11, 4835. [Google Scholar] [CrossRef]
- Yang, K.-H.; Kim, H.-Y.; Lee, H.-J. Mechanical Properties of Lightweight Aggregate Concrete Reinforced with Various Steel Fibers. Int. J. Concr. Struct. Mater. 2022, 16, 48. [Google Scholar] [CrossRef]
- Lombardi, R.; Jünemann, R.; Lopez, M. Experimental assessment of the behavior of expanded glass lightweight reinforced concrete walls. J. Build. Eng. 2022, 49, 104043. [Google Scholar] [CrossRef]
- Limbachiya, M.; Meddah, M.S.; Fotiadou, S. Performance of granulated foam glass concrete. Constr. Build. Mater. 2012, 28, 759–768. [Google Scholar] [CrossRef]
- Macedo, P.M.B. Strong, Lower Density Composite Concrete Building Material with Foam Glass Aggregate. U.S. Patent 7695560, 13 April 2010. [Google Scholar]
- Bumanis, G.; Bajare, D.; Korjakins, A. Mechanical and Thermal Properties of Lightweight Concrete Made from Expanded Glass. J. Sustain. Archit. Civ. 2013, 2, 26–32. [Google Scholar] [CrossRef]
- Nemes, R. Lightweight Concrete Made with Expanded Glass Aggregate. Ph.D. Thesis, University of Technology and Economics, Budapest, Hungary, 2006; p. 13. [Google Scholar]
- Vereshagin, V.I.; Sokolova, S.N. Granulated foam glass-ceramic material from zeolitic rocks. Constr. Build. Mater. 2008, 22, 999–1003. [Google Scholar] [CrossRef]
- Hurley, J.A. UK Market Survey for Foam Glass. Glass: Research and Development Final Report; WRAP Report; The Waste and Resources Action Programme: Banbury, UK, 2003. [Google Scholar]
- Ducman, V.; Mladenovič, A.; Šuput, J.S. Lightweight aggregate based on waste glass and its alkali–silica reactivity. Cem. Concr. Res. 2002, 32, 223–226. [Google Scholar] [CrossRef]
- Ozguven, A.; Gunduz, L. Examination of effective parameters for the production of expanded clay aggregate. Cem. Concr. Compos. 2012, 34, 781–787. [Google Scholar] [CrossRef]
- Jasaitiene, J.; Ivanauskas, E.; Dauksys, M. Investigation of lightweight concrete with porous aggregates. In Proceedings of the 2nd International Conference Advanced Construction, Kaunas, Lithuania, 11–12 November 2010. [Google Scholar]
- Khatib, J.M.; Shariff, S.; Negim, E.M. Effect of Incorporating Foamed Glass on the Flexural Behaviour of Reinforced Concrete Beams. World. Appl. Sci. J. 2012, 19, 47–51. [Google Scholar] [CrossRef]
- Kligys, M. Production Technology and Properties of Composite Material Made out of Porous Cement Paste and Crushed Expanded Polystyrene. Doctoral Dissertation, Vilnius Gediminas Technical University, Vilnius, Lithuania, 2009; p. 138. [Google Scholar]
- Souza, T.B.; Lima, V.M.E.; Araújo, F.W.C.; Miranda, L.F.R.; Neto, A.A.M. Alkali-activated slag cellular concrete with expanded polystyrene (EPS)—Physical, mechanical, and mineralogical properties. J. Build. Eng. 2021, 44, 103387. [Google Scholar] [CrossRef]
- Šeputytė-Jucikė, J.; Sinica, M. The effect of expanded glass and polystyrene waste on the properties of lightweight aggregate concrete. Eng. Struct. 2016, 8, 31–40. [Google Scholar] [CrossRef]
- Rustamov, S.; Kim, S.W.; Kwon, M.; Kim, J. Mechanical behavior of fiber-reinforced lightweight concrete subjected to repeated freezing and thawing. Constr. Build. Mater. 2021, 273, 121710. [Google Scholar] [CrossRef]
- Yuan, J.; Li, D.; Li, W.; Yang, H.; Zhang, W.; Wang, L.; Wang, J.; Xiong, Z. Study on frost resistance of EPS concrete based on EPS beads wrapping modification. Constr. Build. Mater. 2022, 345, 128400. [Google Scholar] [CrossRef]
- Bayraktar, O.Y.; Soylemez, H.; Kaplan, G.; Benli, A.; Gencel, O.; Turkoglu, M. Effect of cement dosage and waste tire rubber on the mechanical, transport and abrasion characteristics of foam concretes subjected to H2SO4 and freeze–thaw. Constr. Build. Mater. 2021, 302, 124229. [Google Scholar] [CrossRef]
- Wang, H.-T.; Zhou, Y.; Shen, J.-Y. Experimental study of dynamic biaxial compressive properties of full grade aggregate concrete after freeze thaw cycles. Cold Reg. Sci. Technol. 2023, 205, 103710. [Google Scholar] [CrossRef]
- Gencel, O.; Bayraktar, O.Y.; Kaplan, G.; Arslan, O.; Nodehi, M.; Benli, A.; Aliakbar Gholampour, A.; Ozbakkaloglu, T. Lightweight foam concrete containing expanded perlite and glass sand: Physico-mechanical, durability, and insulation properties. Constr. Build. Mater. 2022, 320, 126187. [Google Scholar] [CrossRef]
- Pospíchal, O.; Kucharczyková, B.; Misák, P.; Vymazal, T. Freeze-thaw resistance of concrete with porous aggregate. Procedia Eng. 2010, 2, 521–529. [Google Scholar] [CrossRef]
- Buzhevich, G.A. Lightweight Concretes on Porous Aggregates; Publishing House of Literature on Construction: Moscow, Russia, 1970; 272p. [Google Scholar]
- Komar, A.G. Building Materials and Products; Higher School: Moscow, Russia, 1988; p. 527. [Google Scholar]
- Szwabowski, J.; Lazniewska-Piekarczyk, B. Air-entrainment problem in self-compacting concrete. J. Civ. Eng. Manag. 2009, 15, 137–147. [Google Scholar] [CrossRef]
- EN 197-1; Cement—Part 1: Composition, Specifications and Conformity Criteria for Common Cements. European Committee for Standardization: Brussels, Belgium, 2011.
- EN 826; Thermal Insulating Products for Building Applications—Determination of Compression Behaviour. European Committee for Standardization: Brussels, Belgium, 2013.
- EN 12664; Thermal Performance of Building Materials and Products—Determination of Thermal Resistance by Means of Guarded Hot Plate and Heat Flow Meter Methods—Dry and Moist Products of Medium and Low Thermal Resistance. European Committee for Standardization: Brussels, Belgium, 2001.
- EN 12089; Thermal Insulating Products for Building Applications—Determination of Bending Behaviour. European Committee for Standardization: Brussels, Belgium, 2013.
- EN ISO 16535; Thermal Insulating Products for Building Applications—Determination of Long-Term Water Absorption by Immersion. European Committee for Standardization: Brussels, Belgium, 2019.
- EN 772-14; Methods of Test for Masonry Units—Part 14: Determination of Moisture Movement of Aggregate Concrete and Manufactured Stone Masonry Units. European Committee for Standardization: Brussels, Belgium, 2001.
- Mačiulaitis, R. Frost Resistance and Durability of Facade Bricks [Frostwiderstand und Dauerhaftigkeit keramischer Fassadenerzeugnisse]; Technika: Vilnius, Lithuania, 1996; 132p. [Google Scholar]
- Mačiulaitis, R.; Malaiškienė, J.; Kičaitė, A. The regulation of physical and mechanical parameters of ceramic bricks depending on the drying regime. J. Civ. Eng. Manag. 2008, 14, 263–268. [Google Scholar] [CrossRef]
- LST 1428-17; Concrete—Test Methods—Part 17: Determination of Frost Resistance to Volumetric Freezing and Thawing. Lithuanian Department of Standardization: Vilnius, Lithuania, 2016.
- Nodehi, M.; Mohamad Taghvaee, V. Sustainable concrete for circular economy: A review on use of waste glass. Glass Struct. Eng. 2022, 7, 3–22. [Google Scholar] [CrossRef]
- Kizinievič, V. The Effect of Technological Factors on the Cold Resistance of Ceramic Masonry Products. Doctoral Dissertation, Vilnius Gediminas Technical University, Vilnius, Lithuania, 2008; p. 139. [Google Scholar]
- Huang, Z.; Zhang, T.; Wen, Z. Proportioning and characterization of Portland cement-based ultra-lightweight foam concretes. Constr. Build. Mater. 2015, 79, 390–396. [Google Scholar] [CrossRef]
Disclaimer/Publisher’s Note: The statements, opinions and data contained in all publications are solely those of the individual author(s) and contributor(s) and not of MDPI and/or the editor(s). MDPI and/or the editor(s) disclaim responsibility for any injury to people or property resulting from any ideas, methods, instructions or products referred to in the content. |
© 2023 by the authors. Licensee MDPI, Basel, Switzerland. This article is an open access article distributed under the terms and conditions of the Creative Commons Attribution (CC BY) license (https://creativecommons.org/licenses/by/4.0/).