Article

Multi-Analytical Investigation on a Renaissance Polychrome Earthenware Attributed to Giovanni Antonio Amadeo

1
Dipartimento di Chimica, Università degli Studi di Milano, 20133 Milano, Italy
2
Dipartimento di Scienze dell’Antichità, Sapienza Università di Roma, 00185 Roma, Italy
3
Dipartimento di Musicologia e Beni Culturali, Università di Pavia, 26100 Cremona, Italy
4
Laboratorio Arvedi di Diagnostica Non Invasiva, CISRiC, Università di Pavia, 26100 Cremona, Italy
5
Centro Studio e Conservazione Piccolo Chiostro, Via Riviera 20/22, 27100 Pavia, Italy
*
Author to whom correspondence should be addressed.
Appl. Sci. 2023, 13(6), 3924; https://doi.org/10.3390/app13063924
Submission received: 12 February 2023 / Revised: 2 March 2023 / Accepted: 15 March 2023 / Published: 20 March 2023

Abstract

:
This research aimed to characterise pigments used to decorate a polychrome earthenware bas-relief of the 15th century entitled “Madonna with Child, Saint Catherine of Siena, and a Carthusian Prior”, attributed to Giovanni Antonio Amadeo (Pavia, 1447–Milan, 1522) and owned by the Sforzesco Castle Museum of Milan. The artwork underwent a cleaning procedure whose aims were the removal of the dark coating that obscured its surface and restoration work that could bring back its original features. Before the cleaning, six microsamples were collected and analysed using optical microscopy (OM), scanning electron microscopy coupled with energy-dispersive X-ray spectroscopy (SEM-EDXS), and Fourier-transform infrared microspectroscopy in ATR mode (ATR-FTIR), providing the restorers with decisive information on the materials underlying the coating. After the cleaning, the terracotta appeared vibrantly coloured, mainly with bright red, blue, green, black, and white tones. Then, some in situ, non-destructive, spectroscopic measurements were performed by a portable Raman spectrometer on some of the areas that could not otherwise have been sampled. The analyses revealed the presence of natural pigments, including lead white, azurite, yellow ochre, carbon black, calcite, cinnabar, and gypsum. For Madonna’s mantle, cobalt and Prussian blue were employed. Furthermore, the presence of barium sulphate was widely evidenced on the bas-relief. Albeit cobalt blue is of synthetic origin, its presence is compatible with the 15th-century palette, whereas Prussian blue and barium sulphate could be imputed to a previous restoration. Finally, the use of true gold for the background of the earthenware attests to the artwork’s importance and value.

1. Introduction

One of the widely recognised purposes in the study of painted artworks is the identification of the materials employed in their production since it could be an inestimable source of information on the colour palette and the painting techniques [1,2,3,4,5,6].
In most cases, this kind of research deals with problems of dating, restoration procedures, attribution to certain artist’s studios, identification of previous restoration works, or even the authentication of artwork [7,8,9,10,11]. All the aforementioned issues can take advantage of the application of modern instrumental analytical techniques for the identification of the composing materials of the work of art. This is because that information, linked and combined with the ones coming from researchers of historic and artistic expertise, could respond to the different questions and requirements of authorities, museums, private collectors, etcetera [12,13,14]. Furthermore, in the scope of those kinds of research, it is also crucial to detect and characterise degradation processes, often due to the interaction of the materials within themselves and/or to the action of environmental agents to develop the most appropriate conservation procedures [15,16,17,18,19].
The present research wedges into the great number of studies related to the identification of materials and techniques used in the production of works of art. The paper’s main goal was the chemical-physical characterisation of pigments employed for the decoration of a Renaissance polychrome earthenware bas-relief. Moreover, the characterisation of the dark coating that covered the artwork was approached to obtain information on the presence and type of organic substances.
The bas-relief has a long and complex story, characterised by many transfers of ownership, which were documented from the end of the 19th century until it arrived in its current place [20,21]. Therefore, besides the iconographic interpretations of the represented scene (Catherine of Siena accompanies the Carthusian monk to the Virgin and Child), the majority of the collecting history and that concerning its provenance are also well-known. Additionally, the attribution issues appear to have been eventually resolved. The comparison of several works dating from the early days of the young Amadeo led to a clarified correspondence of style, definitively reconfirming the position of the relief within the corpus of the sculptor’s works, about which critics have debated for over a century [20,21].
The artwork definitely attributed to the workshop of the great Italian master Giovanni Antonio Amadeo is now owned and stored by the Ancient Art Museum of Castello Sforzesco in Milan.
Recently, the bas-relief underwent an important and required cleaning treatment to remove a dark layer of material that settled over the decades [12,22,23]. To support the conservation procedures, a diagnostic campaign of the artwork was also engaged. It aimed at the identification of the pigments and the possible presence of non-original materials resulting from previous, non-documented repainting works on the earthenware.
It is also worth mentioning that, during this research, it so happened that a private collector, who owns a very similar piece of earthenware, wanted to delve deeper into the study of his artwork. Indeed, when he heard about the restoration and diagnostic research on the Antonio Amadeo bas-relief, the topic of this paper, he wanted to begin a historical, iconographic, and scientific study of the materials of his own artwork, which is ongoing. Therefore, the analyses performed on the actual Amadeo artwork acquired even more important since they will be part of the complicated path toward the possible recognition of the artwork from the private collection as an original Giovanni Antonio Amadeo work [20].
Before cleaning, the restorer chose a few spots on the painting to collect microsamples from. These included a white sample, two blue samples, a reddish-brown sample, a red sample, and a tiny golden splinter. Subsequently, the samples were analysed in the laboratory by optical/UV microscopy, scanning electron microscopy coupled with energy dispersive X-ray fluorescence spectroscopy (SEM-EDXS), and micro-FTIR. Each of these techniques has been extensively used for the characterisation of pigments and, more generally, art materials [24,25,26,27]. Moreover, the synergic use of different analytical methods is usually the most effective way to identify samples coming from painted artwork since they are usually complex mixtures of diverse substances, both inorganic and organic nature [24,26,28,29,30,31,32]. Indeed, both the identification of the pigments and, where possible, the stratigraphies were achieved.
After the cleaning process, portable Raman spectroscopy was used to perform a second round of non-invasive analysis on the earthenware. The latter is one of the most suitable techniques in this kind of research since it is completely non-destructive towards the artwork in addition to being extremely effective at pigment identification [31,33,34,35,36,37]. Indeed, it made possible the in-situ characterization of the compounds utilised for decorating red, white, and black areas, in addition to the mixture of substances employed for the complexions and the one used for creating the darker shades on the cushion where the baby sits.

2. Materials and Methods

2.1. The Bas-Relief

The work traditionally attributed to Giovanni Antonio Amadeo (1447–1522) and to his workshop is made of cold-painted and gilded terracotta. The bas-relief presents some portions executed in tutto tondo, like the child’s left arm, almost entirely his head, and that of the monk kneeling in front of the Madonna.
It portrays a traditional subject of Renaissance painting of the Carthusian area, with particular reference to one of the corbels on the north side of the large cloister of the Certosa of Pavia. According to the literature, the young Carthusian monk could be Saint Bruno or even, due to the absence of the halo, Blessed Stefano Maconi, formerly prior to the Pavia convent. However, the saint turned out to be Saint Catherine [21].
Before the restoration, the work appeared utterly covered with a heavy and dark coating (Figure 1a). In particular, it can be seen how the light tones of the saint’s tunic and veil had irremediably absorbed the dirt, a process probably conveyed by the heavy protective layers present on the surface, probably applied during previous restoration interventions.
The polychrome terracotta Madonna and Child with Saint Catherine of Siena and a Carthusian monk, today in Castello Sforzesco, comes from the antique market, from which it was purchased in 1892 by Achille Cantoni (1844–1914). It then passed into the collections of many important Italian and German collectors until returning to Lombardy in the collection of Cristoforo Benigno Crespi (1833–1920) and donated by them to the Museo Patrio di Archeologia di Brera; from here, on 28 May 1903, it moved to its current location at the Museum of Ancient Art of Sforzesco Castle in Milan.
In the Certosa di Pavia, in the outside lunette of the old north portal of the refectory, there is a copy of this old and valuable terracotta. It is probably a cast copy made with impalpable cocciopesto powder and a hydraulic binder. The copy relates, regarding production technology and style, to the important transformations and maintenance undergone by the monumental complex after the suppression of the Carthusian order, which happened between the Napoleonic period and the early years of the twentieth century [20].

2.2. The Samples

A first in-situ observation under the microscope showed that the colours seemed to be applied to a thin white preparation. Moreover, some gildings were present, especially on the yellow background and on the baby’s hair. The sampling was made only at those points that were already a little detached from the surface.
Overall, six samples were collected, by using a scalpel from the Carthusian priest’s robe, Madonna’s blue mantle and blue robe, the dark-ochre background, the golden area on the background, and Madonna’s red sleeve (Figure 1a).
After an accurate observation was performed by an optical stereomicroscope, some of the pieces were selected based on their number and size in order to both prepare polished cross-sections of the samples and be able to preserve a residual portion. Microsamples 1, 2, 3, and 6 were embedded into epoxy resin (Epofix Struers and Epofix hardener with a ratio of 15:2) and then polished with silicon carbide fine sandpaper (2400–1200 mesh). The exposed cross-sections were observed using an Olympus (Tokyo, Japan) BX51TF polarised-light optical microscope equipped with visible (Olympus TH4-200) and UV (Olympus U-RFL-T) illuminants.

2.3. Analytical Techniques

2.3.1. Scanning Electron Microscopy Coupled with an Energy-Dispersive X-ray Spectroscopy

Before embedding, the samples were analysed by a SEM-EDX, a Hitachi (Tokyo, Japan) TM-1000 scanning electron microscope equipped with a SwiftED energy-dispersive X-ray spectrometer (Oxford Instruments, Abingdon, Oxfordshire, UK). For each sample analysed, a minimum of three EDX analyses have been acquired on different areas of approximately 1 mm2 by moving the probe to different positions on the sample surface.
Then, a Hitachi TM-4000 scanning electron microscope equipped with a 4-quadrant BSE detector, a low-vacuum S.E. detector, and an Oxford AztecOne EDX system was used. The latter have been basically employed to assess the distribution of the whole samples of the previously identified elements, especially where the polished sections could not be prepared.
All the SEM-EDX analyses have been initially carried out on the samples as such at low vacuum conditions, and no coating application was required [38,39].
The polished cross-sections 1, 2, 3, and 6 were observed and analysed by a Thermo Fisher Scientific (Waltham, MA, USA) PHENOM XL G2 set with an accelerating voltage of 15–20 kV in a low vacuum equipped with an energy-dispersive X-ray (EDX) spectrometer.

2.3.2. Vibrational Spectroscopy

A Nicolet 380 spectrometer with an ATR accessory called Smart Orbit and a diamond crystal was used to perform ATR-FTIR analyses on tiny pieces of the samples. The spectra were taken on microsamples of about 1 mm2 in the spectral range 4000–400 cm−1 with 4 cm−1 resolution. All the spectra were obtained as the result of at least 64 up to 256 scans in order to achieve a satisfying signal-to-noise ratio.
ATR-FTIR measurements on polished cross-sections were performed using a Thermo Scientific NICOLET iN10 micro-spectrometer (Waltham, MA, USA) equipped with a Ge micro-tip ATR crystal. All infrared spectra were recorded within the range 4000–675 cm−1 with 4 cm−1 resolution and 32 scans. The OMNIC 7.2 software package was employed for the study of bands produced by the effect of the treatments on ATR non-corrected spectra.
Raman analyses were performed using a BWTek i-Raman EX portable spectrometer equipped with a fibre optic probe of 85-micron diameter and a Nd-YAG laser (excitation wavelength: 1064 nm).
The measurements were carried out in situ, i.e., at the restorer's laboratory, directly on the earthenware’s surface, after the cleaning procedure. The analysed points are shown in Figure 1b.
Raman spectra were recorded with 4 cm−1 resolution in the spectral range 100–2500 cm−1 and obtained as the average of 20–40 scans. The spectrometer was also provided with a convenient control that permitted the fine-tuning of the laser power on the terracotta.
The identification of pigments was accomplished by comparing the FTIR and Raman spectra obtained from samples to those available in the laboratory’s database or disposable in the literature [29,32,40].

3. Results

3.1. Analyses of Microsamples

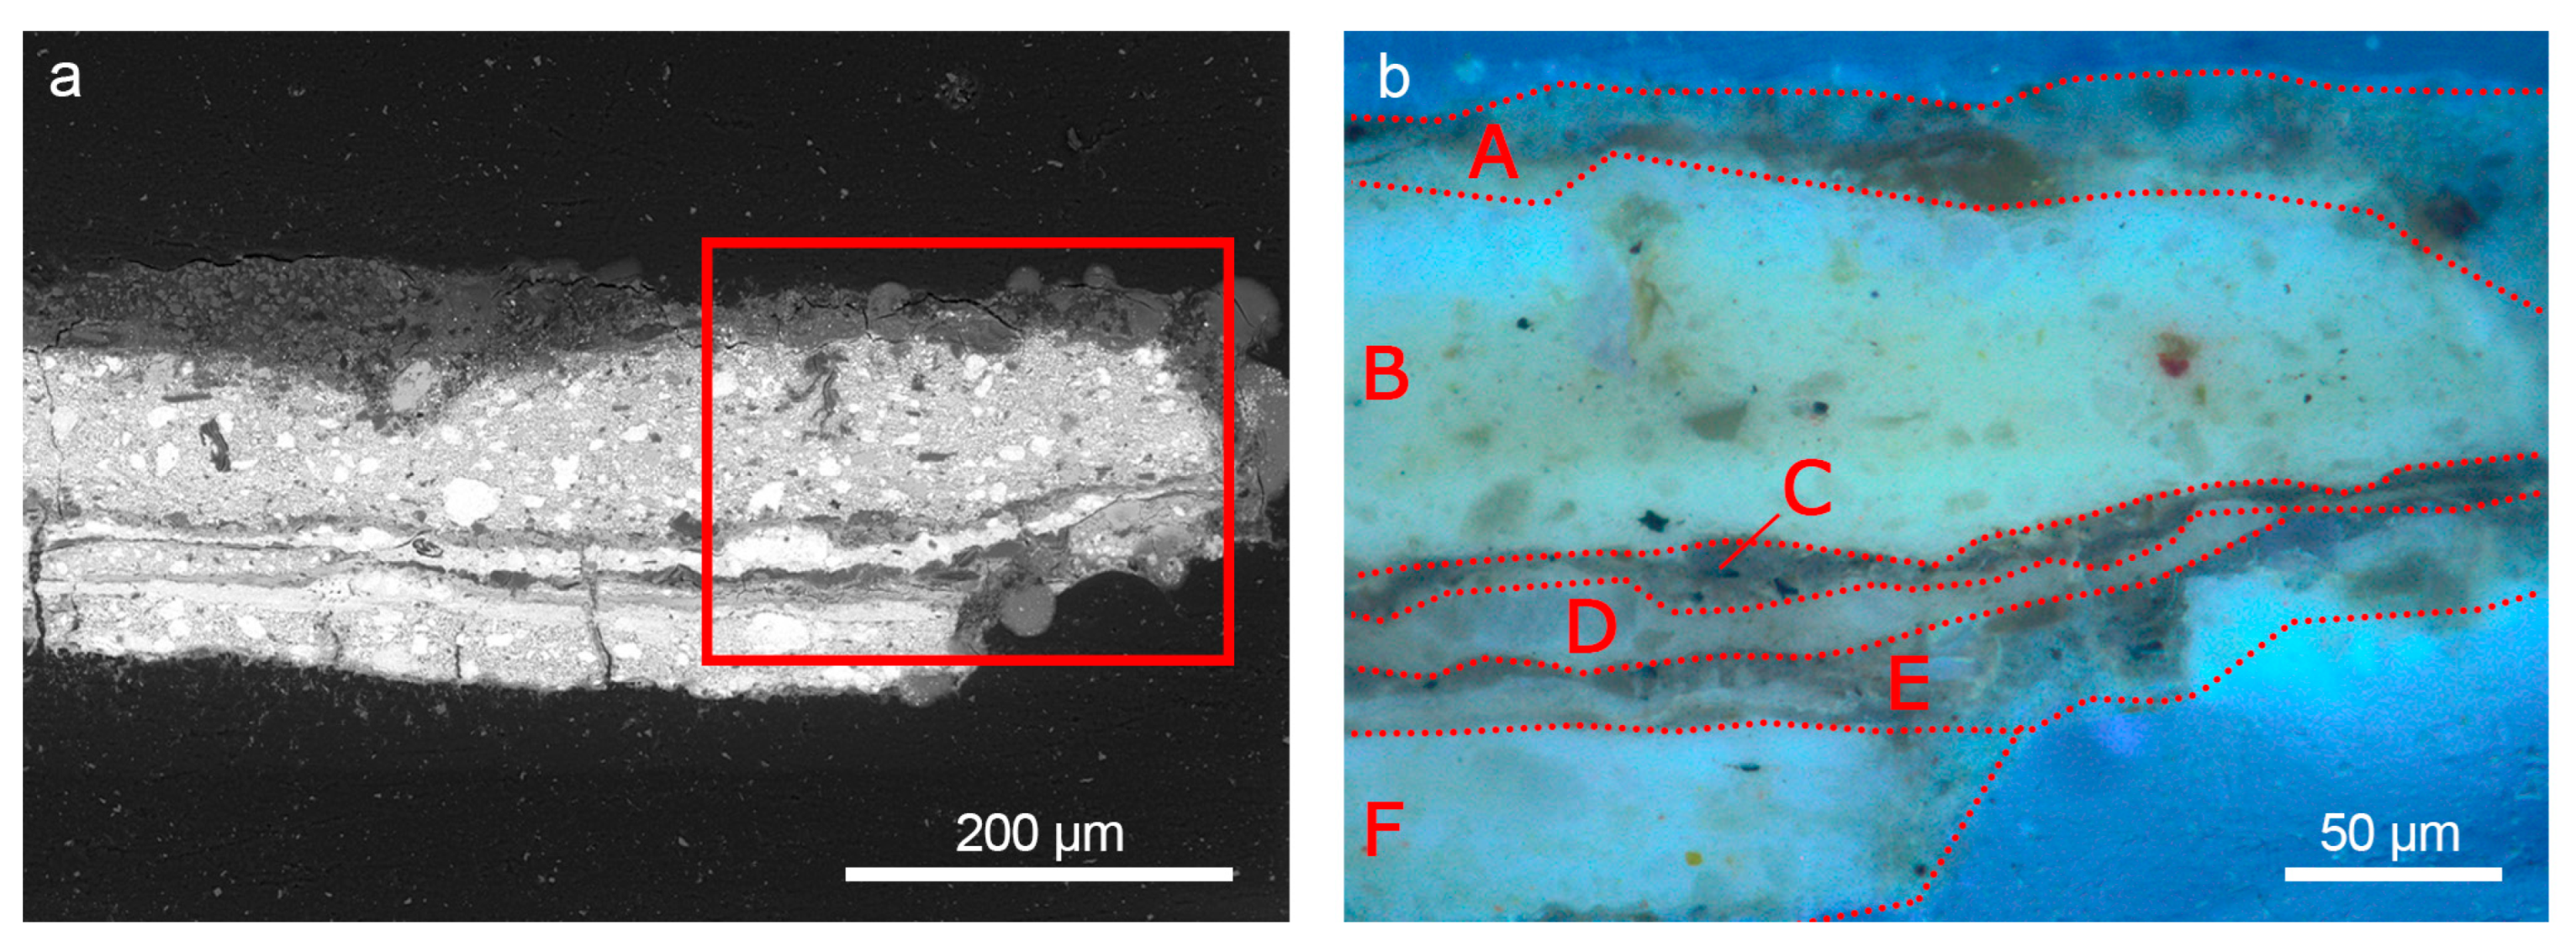
3.1.1. White Sample 1

Sample 1 was taken from the white habit of the Carthusian priest, visible on the left side of the artwork. It was composed of a whitish fragment of about 3 × 2 mm and of a little powder of the same colour.
The macroscopic visual observation of the sample, particularly the one performed by using the stereo microscope with 3× magnification, showed that the sampling also removed part of the underlying substrate, a condition that often occurs at this stage, as we will see in subsequent cases. The size of the sample permitted dividing it; therefore, part of it was embedded and cross-sectioned to highlight and characterise each overlapped layer.
The SEM-EDX analyses performed on the sample surface clearly revealed that lead was the main element, whose presence was attributable to the use of lead white, the so-called biacca (2PbCO3·Pb(OH)2). Moreover, the presence of sulphur and barium were attributed to the possible presence of barium sulphate (also known as barium white or barite), whereas a small amount of calcium was thought to be associated with the presence of calcite (CaCO3). All those white substances could have been used as white pigments, even though, as we will also discuss further, it is more likely that biacca was the original material and barium white was added afterwards. Indeed, the latter is a white pigment of artificial origin whose use in artwork dates to the 19th century [41,42,43]. Other elements such as silicon, aluminium, chlorine, bromine, iron, and potassium, also present in the sample, were attributed to the earthenware substrate.
Then, ATR-FTIR tests on a small grain of the same sample confirmed some of the results that had already been found. In particular, the analysis brought to light the unequivocal presence of lead white because of the characteristic bands around 1400 cm−1, 1042 cm−1, and 678 cm−1 [44].
The additional bands at 3300 (br), 2920, 2849, 1651, and 1538 cm−1 were attributed to the presence of a kind of proteinaceous organic substance, especially because amide I and amide II bands were detected [8,30,45].
The micro-invasive analyses carried out on the embedded and cross-sectioned white sample 1 provided crucial information on the layering and the distribution of materials. The microscopic observation under visible and UV light highlighted a complex stratigraphy composed of several overlapped pigmented layers, as visible in Figure 2.
The micro-ATR-FTIR and EDX results confirmed the presence of biacca as the main white pigment in the entire stratigraphy. In particular, the FTIR spectra acquired in correspondence with layers B (Figure 3a) and F revealed the strong absorption band at 1400 cm−1 together with the characteristic bands at 3435, 1045, and 770 cm−1 [46]. Additionally, the EDX was performed on several particles dispersed in the same layers and the results revealed high counts of Pb. As for layer D, the ATR-FTIR spectra also suggested the presence of barite because of the bands at 1180, 1085, and 985 cm−1, and the shoulder at 1120 cm−1 [25,47,48]. The EDX analysis confirmed this hypothesis thanks to the signals of sulphur (S) and barium (Ba) related to barite pigment. In addition, signals of calcium (Ca), were identified in some particles dispersed into layers A, C, and E. This pointed to the presence of calcite and signals of silicon (Si) could indicate the presence of some silicate compounds in layers A and C, which were not clearly revealed by ATR-FTIR. In correspondence to layers A and E, the well-defined bands at 1650 and 1550 cm−1, together with the typical sharp bands at 2930 and 2860 cm−1 (Figure 3b), confirm the presence of proteinaceous material. While the proteinaceous material in layer A was likely to be part of the dark coating, the one in layer E could have possibly been used as a binder or adhesive [49]. No traces of oil-based binders were identified.

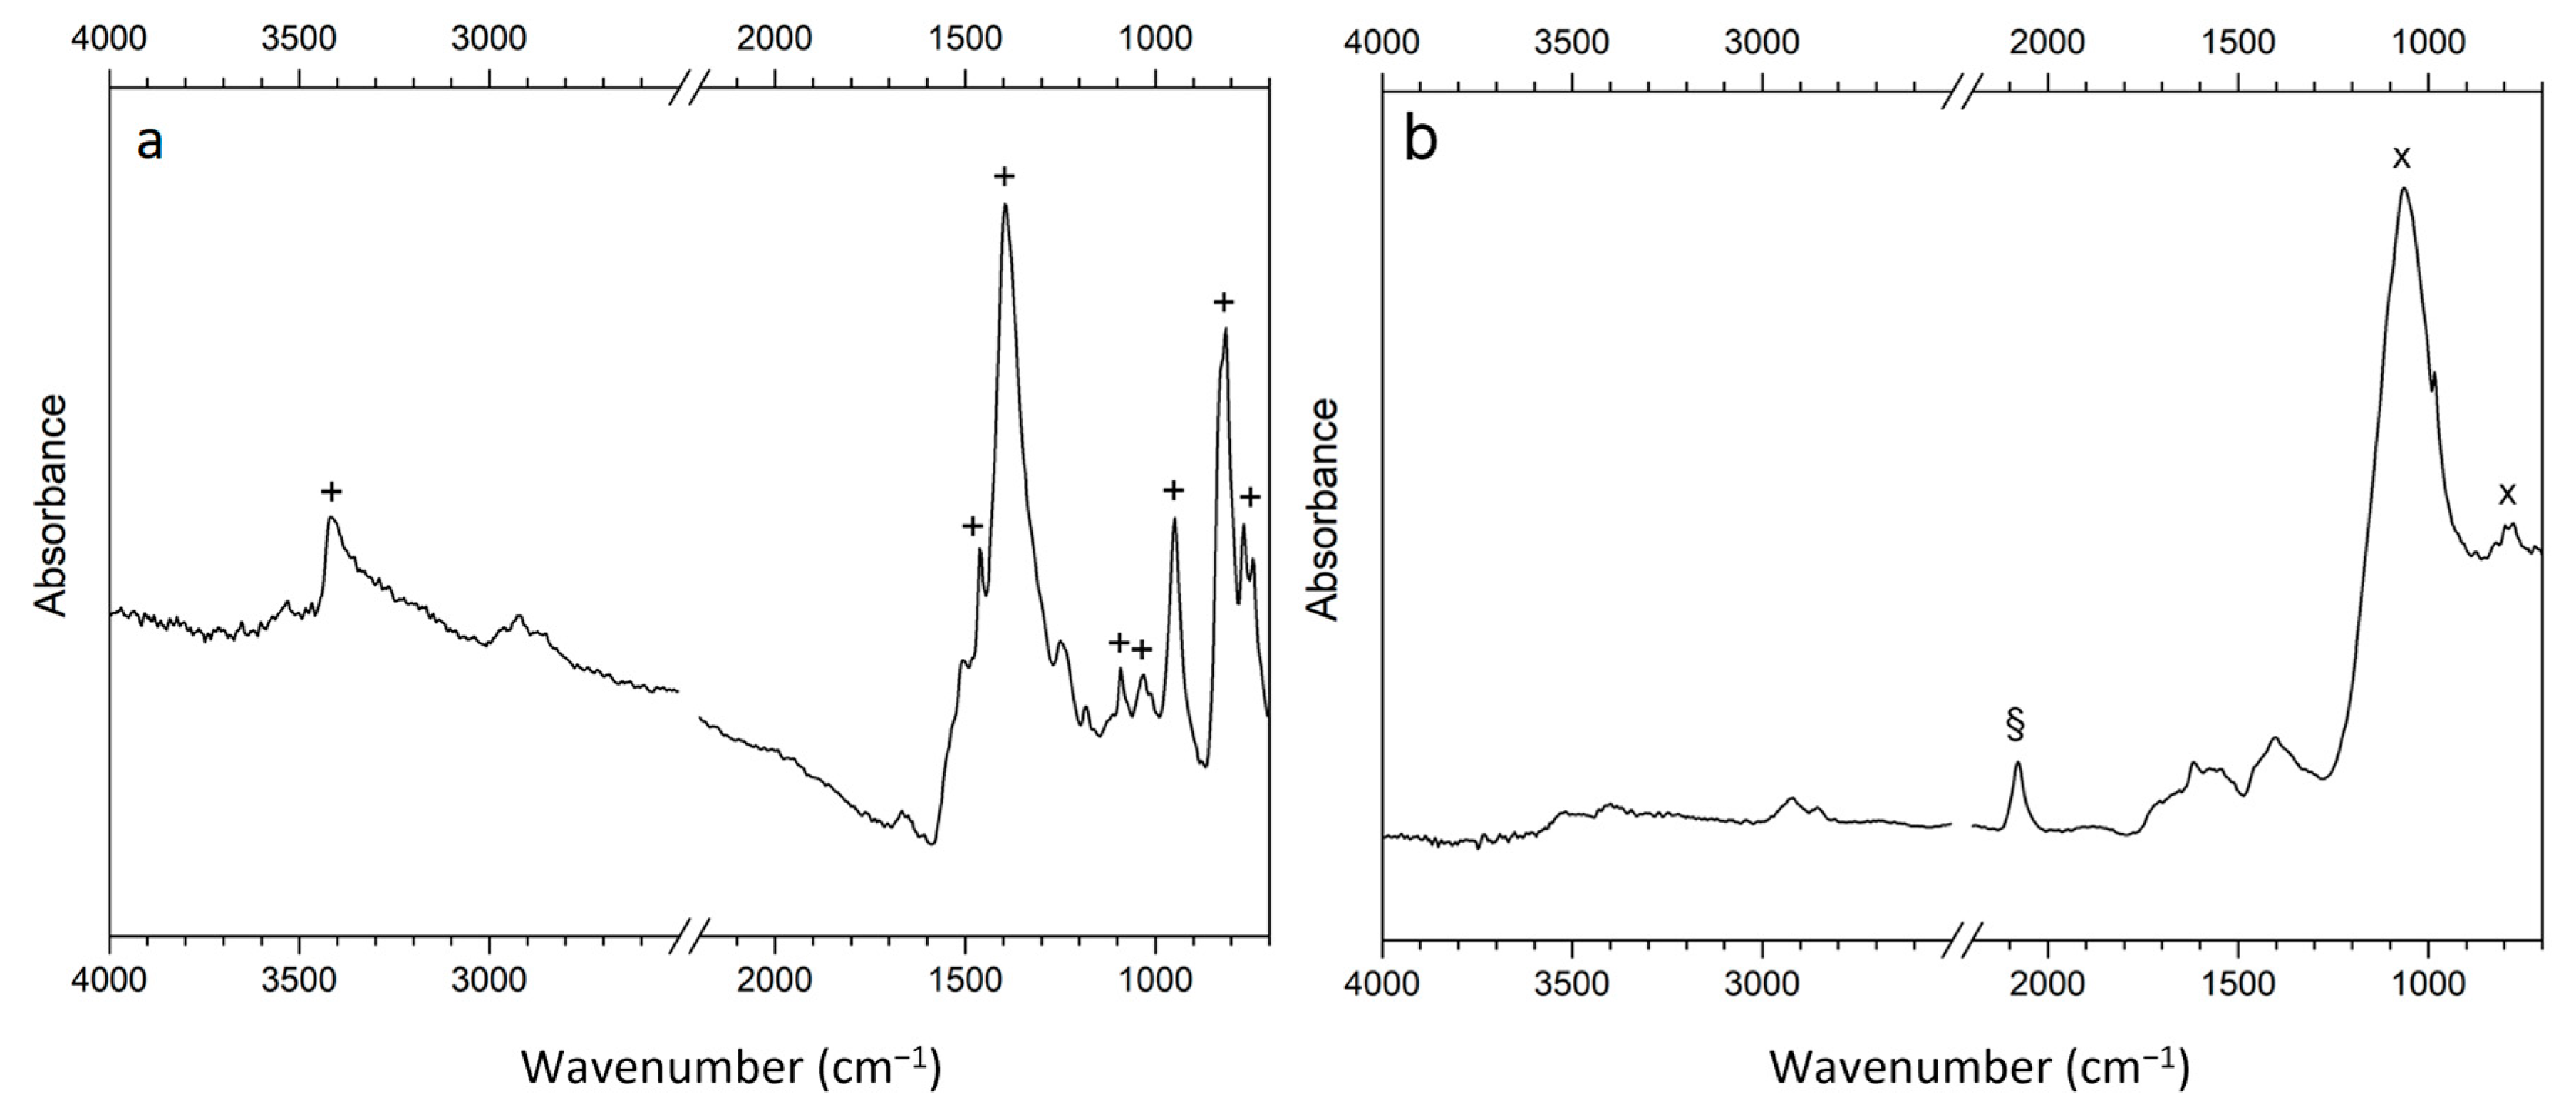
3.1.2. Blue Sample 2

Sample 2 was taken from Madonna’s mantle, and it was composed of three intense blue micro-fragments (about 5 mm in diameter each).
Lead was the most common element in all of the point-like SEM-EDXS analyses. This was again due to the use of lead white. Additionally, copper was found widespread on the surface of the sample. This is probably because of the presence of a blue copper-based pigment that explained the sample’s colour as well. The signals of sulphur and calcium suggested the presence of gypsum and calcite, whose use could be related to the preparation of the artefact’s surface before applying the paint film. The presence of silicon was instead considered part of the terracotta substrate. It is worth noting that high percentages of iron marked that blue sample. This fact was initially attributed to the earthenware substrate.
Then, the elements present on the sample’s blue surface were mapped using the other SEM-EDX instrument. Copper and lead were found to be the most common elements and were confirmed to be the main ones. Furthermore, the presence of cobalt was evidenced. This was attributed to cobalt blue, also known as smaltino. It is a blue glassy pigment composed of silicon oxide, potassium oxide, and cobalt oxide, whose use started in the Renaissance and whose blue colour is due to the presence of cobalt [24,50].
Subsequently, the ATR-FTIR analysis was performed on a small portion taken from one of the samples. The main bands of lead white were detected around 1400 cm−1 and at 680 cm−1, whereas the characteristic bands of azurite were found placed at 3420, 1400 (overlapping with those of biacca), 1091, 952, 833, 815, 740, and 446 cm−1 [47,51]. Only FTIR analysis enabled conclusive confirmation of the presence of the copper-based blue pigment in the sample, as detailed further on. Additionally, the very strong bands at 2080 and 602 cm−1 allowed the identification of another blue pigment, i.e., Prussian blue (Fe4[Fe(CN)6]3) [52,53]. The latter result was likely to be correlated to the high percentage of iron detected by SEM-EDXS analysis [54]. The other main band in the spectrum, namely the ones at about 3300 (br), 2920, 2849, 1650, and 1538 cm−1 could be associated with proteinaceous organic substances, but it was not possible to attribute them to any specific compound. The additional band at 1025 cm−1 pertains to silicates, and they are possibly due to chrysocolla Cu2H2Si2O5(OH)4·nH2O [46,47]. Chrysocolla is a blue–green, or at times black, silicate mineral with an exceptional variety of formulae and properties used since antiquity in the soldering of gold, in jewelry, and as a pigment [55,56]. Its correlation with azurite can be made clear because of the frequent contemporary presence of the two minerals in nature [57].
As for that sample, a multi-layer stratigraphy, composed in this case of four overlapped layers, was observed (Figure 4).
The ATR-FTIR analysis performed on the cross-section revealed that in layer A, a mixture of white pigments made of calcium carbonate and barium sulphate was present. They were identified thanks mainly to the absorption bands at around 1410 cm−1 [58] and 1180, 1110, and 1060 cm−1 [47,48] and to the related presence of calcium- and barium-based particles. Some particles mainly composed of titanium (Ti) were also identified in layer A by SEM-EDXS. Moreover, the results of both ATR-FTIR and SEM-EDXS techniques revealed the widespread presence of lead white in layer B, as well as that of organic material that was not clearly identified.
About layer C, smalt and Prussian blue were recognised by the characteristic FTIR bands (Figure 5a), respectively at 1060 and 790 cm−1 [59] and 2080 cm−1 [52,53]. SEM-EDXS results partially confirmed this hypothesis: the existence of numerous silicon- and potassium-based particles supported the assignment to smalt, even though only traces of cobalt were detected, and the presence of rare iron-based particles indicated the distributed presence of Prussian blue in the layer.
Concerning the lower layer D, it is mainly composed of azurite, as revealed by the strong absorption bands at 1400, 950, and 820 cm−1, together with those at 3420, 1465, 1090, and 1026 cm−1 (Figure 5b) [60]. The attribution was also confirmed by SEM-EDX analysis, which revealed high counts of copper in the particles composing layer D.

3.1.3. Blue Sample 3

Sample 3 was taken from the lower area of Madonna’s robe and placed on the right side of the work (Figure 1). The sample was made of two tiny fragments, whose size was around 2 × 1 mm. Under 3× magnified optical observation, the shards appeared painted with a homogeneous dark blue colour, but with a duller shade compared to the previously discussed blue sample 2. Moreover, those fragments showed a whitish hue on the other side, probably caused by the presence of the preparation layer.
The SEM investigation showed the presence of a few dark spots spread here and there in the sample area (Figure 6).
The “globular”, not crystalline, shape of those spots and the fact that they were not characterised by any metal led to thinking that they were probably mainly made of carbon, either in its elemental form or present as some organic compound. It is to be stressed that the SEM instrument used to take this picture is equipped with an EDX detector that does not allow the detecting elements less heavy than sodium (23 u). Therefore, it was not possible to acquire an EDX spectrum that showed the major presence of carbon in those spots.
Furthermore, when the SEM-EDXS analyses were performed with the other instrument, we could not find the same spots to validate our hypothesis. Notwithstanding, it seemed plausible that some carbon-based particles were on the analysed surface since, as mentioned earlier, the earthenware was covered by a dirty coating when the samples were collected.
Apart from that, the most abundant element was copper, which again suggested the use of copper-based pigment for the blue colour (Figure 7d). Additionally, it is important to mention that barium was found widespread on the sample’s surface and that the correspondence of the areas where both barium and sulphur were found (Figure 7d) is compatible with the presence of barium sulphate (BaSO4).
The subsequent ATR-FTIR analysis brought to light several components. The characteristic features of azurite are visible at 3425, 1492, 1463 1412, 952, 833, 815, 770, 740, 490, and 446 cm−1 [51]. Those features confirmed the use of this specific copper-based pigment in this case, as well. The presence of barite, previously suggested by the SEM-EDXS analyses, was then confirmed since the characteristic bands at 1185, 1080, 635, and 603 cm−1 [47,48] are clearly distinguishable in Figure 8.
The bands at 2922 and 2850 cm−1 were attributed to a kind of organic substance, and their detection accorded with the hypothesis that the spots in Figure 6 were due to the presence of a kind of unidentified carbon-based material on the surface. Finally, the presence of the strong band at 1637 cm−1 and the peak visible as a shoulder at 1318 cm−1 in Figure 8 are typical of calcium oxalate [59].
It is important to mention that one of the two minuscule pieces, of which sample 3 consisted, was embedded and prepared as a polished section. However, the results of both SEM-EDXS and ATR-FTIR were too poor, as they were dominated by the signals of the epoxy resin. This is probably because of the extremely limited size of the original fragment. As a consequence, it was then decided not to prepare polished sections with samples 4 and 5, which were even tinier.

3.1.4. Dark-Yellow Sample 4

Sample 4 was taken from the brownish background of the terracotta, from a point just next to Madonna’s veil (Figure 1). The sample was composed of several ochre-coloured tiny fragments, each measuring about 1 mm in diameter.
The elemental composition was especially characterised by a high percentage of iron, whose average value was about 10%. Moreover, the contemporary presence of silicon, potassium, and aluminium and, also, the colour of the sample, led to thinking of the use of a yellow-brown ochre in this case. As in other samples, a high percentage of lead was found, suggesting once more the presence of biacca. According to the ATR-FTIR spectrum obtained on one of the fragments, it was possible to reveal the characteristic features of lead white (bands at 1393 (br) and 678 cm−1), of a proteinaceous organic compound (bands at 2920, 2849, 1651, and 1550). This is while the component at 1318 cm−1 was attributed to the presence of calcium oxalate (the component at about 1630 is probably obscured by the amide II peak) [59]. Moreover, the bands at about 1088, 1032, 913, 798, 779, 530, and 470 cm−1 should be ascribed to the presence of silicate containing iron oxide. The whole spectrum is ascribable to goethite, i.e., an iron oxyhydroxide, mixed with quartz and other silicates [1,61,62]. Since elemental analysis indicated iron as the only possible chromophore, and because of the just mentioned bands of yellow iron oxide, the pigment was recognised as yellow/brown ochre. Finally, it is also worth mentioning the presence of a little bit of gypsum, identified by the features at 3525, 3400, 1460, 667, and 598 cm−1 [46,63], and traces of calcite, whose characteristic bands stand at 874 and 713 cm−1 [58].

3.1.5. Gilded Sample 5

Sample 5 was taken from the right part of the bas-relief’s background, very close to sample 4, but in correspondence to one of the areas that seemed to be more light-reflecting. The sample is composed of several very tiny fragments of about 1 × 0.5 mm, some of which are intensely golden coloured.
In Figure 9, one of the gilded fragments can be observed. The lighter area of the micrograph in Figure 9a, acquired in backscattering mode, gave unmistakable signals of gold. Figure 9b depicts a magnified image of the applied gold leaf in which its extreme thinness may be observed but not measured.
The analyses were also performed on the ungilded areas, and the signals of lead, calcium, sulphur, silicon, iron, and aluminium were detected in such proportions that, except for iron (whose percentage was around 1%). They were comparable to the dark-yellow sample 4. In this case, it was not possible to prepare a polished section. Nevertheless, one of the maps acquired for the sample (Figure 9e,f) shows partially where the main elements are positioned in the sample’s section. It is important to note that the fragment was placed in a way that permitted seeing part of the section since the gilded/coloured layer was not perfectly parallel to the sample holder. Apart from gold, clearly visible in the upper-left side of the BSE image and its map (Figure 9d,e), what emerges is that lead is the main component of the preparation layer (Figure 9f), whereas silicon, calcium, aluminium, and sulphur are spread over the ungilded surface. Moreover, it is important to notice that sulphur and, to a lesser extent, calcium seem to be mainly present at the interface of the painting layer with the underlying one. This leads to the idea of an additional layer (mostly composed of calcium- and sulphur-based compounds) placed in between the painting and the biacca preparation layer. Far from being the result of a complete stratigraphy, those observations allowed stating that the sample’s surface was composed of just clay decorated with gold leaf; a mid-layer containing barite and calcite, and a substrate made especially of lead white were also present.
The ATR-FTIR spectrum of the sample, taken on an ungilded grain, was very poor with regard to its signal-to-noise ratio, probably because of the extremely tininess of the particle. However, lead white, calcite, silicates, gypsum, and barite were detected together with an organic component that was not better identified.

3.1.6. Bright-Red Sample 6

Sample 6 was taken from the red arm of the Madonna (Figure 1). The sample was composed of two intense red–coloured fragments of about 4 × 2 mm. As in previous cases, in this one, the whitish substrate was present on the reverse part of the samples.
The elemental analysis of the fragment as a whole revealed, in addition to lead, calcium, silicon, aluminum, and traces of barium, as in the other samples, a high concentration of mercury and sulphur, indicating the presence of cinnabar (HgS) on the red surface [64].
FTIR analyses performed on the same sample could just confirm the presence of lead white, barium sulphate, silicates, and proteinaceous organic material. Analyses conducted on the polished part revealed further information.
As visible in Figure 10, the stratigraphy of sample 6 is composed of two layers. ATR-FTIR and SEM-EDX analyses on the red layer A revealed the main presence of cinnabar, lead white (biacca), and barium sulphate.
In particular, cinnabar was identified thanks to the high EDX counts of sulphur (S) and mercury (Hg) [60].
Lead white and barium sulphate pigments were recognised respectively through SEM-EDX analyses because of the presence of lead- and barium-based particles, and by FTIR because of the typical bands at, respectively, 1390, 1180, and 1060 cm−1 (Figure 11) [47]. In addition, as visible in the spectra shown in Figure 11, the characteristic bands of an organic binder or a residue of an external varnish were identified at 2925, 2860, and 1715 cm−1 [65]. The underlying layer B was identified as calcium carbonate by the FTIR bands at around 1400 and 870 cm−1 [58], in addition to the high calcium counts observed in the EDX spectra collected on its surface.

3.2. In Situ Raman Measurements

After the cleaning, it was possible to perform some in-situ Raman analyses at the restorer’s place. This was necessary to confirm the results obtained from the collected samples as well as from larger portions of the earthenware and also to attempt to characterise the colours that were not analysed in the laboratory.
All the colours were then investigated, and the main results are presented in the following.
On the white areas, i.e., the Carthusian priest’s cloth and the S. Caterina’s veil, above all, lead white was recognised, in some cases as a mixture with other pigments. In Figure 12a, for example, the spectrum of the Carthusian priest's sleeve showed that the main colour was white lead. This was shown by the strong band at 1050 cm−1. Furthermore, the presence to a lesser extent of barium white and cinnabar, characterised respectively by the band at 988 cm−1 [66] and by a couple of peaks at 254, 282, and 343 cm−1, was also evidenced [29,32].
Concerning the skin tones, the right cheek and the left hand of S. Caterina and Madonna’s right hand were extensively analysed. As can be seen in Figure 12b–d, the skin’s colour was obtained by mixing different proportions of white lead and cinnabar.
The white ribbon and the black inscription were also analysed. As regards the white colour, just white lead was found. The letters, instead, were performed with a carbon-based pigment, since their Raman spectra are characterised by the broad, intense bands of amorphous carbon at 1590 and 1320 cm−1 [67,68].
The red areas, such as Madonna’s sleeve and the cushion where the baby is sitting, were mainly characterised by cinnabar. It is worth mentioning that on the darker red areas, for instance, on the bottom side of the cushion, some carbon black was found, whereas, on the lighter ones, some lead white was here and there. Additionally, some barium sulphate was found almost everywhere on the terracotta (Figure 12).
It should be pointed out that, in general, Raman analyses performed with the 1064 nm excitation line are suitable for a variety of pigments [29].
Nevertheless, no results were obtained on the blue, green, and brown areas, probably on account of the concurring effects due to the presence of a high fluorescence background and the relative weakness of the bands of the pigments that covered the examined areas.

4. Discussion

In Table 1, the results of the analyses for each sample are shown, along with the recognised pigments. Moreover, where the stratigraphy was made, the materials identified for each layer were indicated.
Basically, the sectioned and analysed samples 1 and 2 presented a whitish layer, or better yet, a coating, on top that was made of a mixture of lead white, barite, and calcium carbonate. Moreover, the coating contained a kind of proteinaceous substance that was not better identified. As neither carboxylic acids nor esters were detected, the substance is likely animal glue.
It is also worth mentioning that white sample 1 was made of multiple layers where it is quite evident the alternation of pigment (biacca) with the mix of barite/calcite/glue as if it was painted and coated more times.
Sample 2 instead presented two coloured layers under the whitish coating: the lowest, i.e., the older one, was made of azurite, whereas the earlier one was painted with smaltino and Prussian blue.
The bright red sample’s 6 surfaces had a completely different composition. Indeed, besides barite and lead white, in this case, the top layer contained the pigment (cinnabar) as well as the residue of varnish or resin, whereas the lower layer is just a white preparation made of calcite.
In the samples that were not prepared in polished sections, a composition of the matrix similar to samples 1 and 2 was found. In this case, it was not possible to establish whether it was an analogous layer, but it seems likely that above the azurite of sample 3, the yellow ochre of sample 4, and the gold leaf of sample 5, there was a coating made of barite, calcite, and animal glue. Lead white, also present in these samples, was attributed to the presence of a white preparation layer.
As for the samples, it is important to notice that in all of the cases, there was the contemporary presence of materials compatible with the Renaissance and materials of synthetic origin, due to later interventions in the artwork. In particular, barite appeared spread all over the artwork, denoting a wide intervention between the end of the 18th and the beginning of the 19th century.
In more detail, the original white pigment was probably white basic lead carbonate. This hypothesis was suggested by its presence in the layer that was closer to the terracotta’s surface in white sample 1.
As barium sulphate (barite) started to be employed as a pigment and as an extender around the end of the 18th century, the presence of consecutive layers of barite indicates previous restoration work. Particularly for lead white, in the early 19th century [69], when its use became more common because of the availability of synthetic pigment [25].
With regard to sample 2, in this case, the stratigraphy clearly indicates that the blue layer was restored as well. Indeed, the coating layer contained barite together with calcite and glue, and the immediately underlying layer was Prussian blue, whose use in artwork began after 1704 [70]. Therefore, the latter pigment does not have to be considered part of the original painting.
The presence of smaltino could instead be considered controversial. It is an inorganic pigment, a potassium and cobalt double silicate with metal oxides, which has been used in painting since the Renaissance [24]. However, since the layer with the smaltino also contained Prussian blue, it was assumed to be the result of the same restoration and not part of the original painting as well. It seems possible that the mixture of Prussian blue with smaltino was made to better imitate the colour of the original pigment, i.e., azurite. Ultimately, sample 2 shows how the lowest layer, i.e., the oldest one, was made with one of the most precious pigments, which was also established in the workshop of Giovanni Antonio Amadeo: azurite. This thin blue layer was applied cold, retouched, and chromatically revived in the modern era, first with subtle blue colours and then with common Prussian blue. Therefore, the stratigraphy seems also to confirm the passages documented in the historical-artistic research on the artwork, namely both the provenance from the Amadean workshop in Certosa di Pavia and some of the modern passages in the antique market in Milan. Until now, the durability of the work in the German region, where the tradition of using blue smalt as a pigment endured longer than in the rest of Europe, where cheaper Prussian blue was already the predominant hue, was the most important factor.
Sample 6, the bright red one, seems to confirm the origin of the masterpiece as probably Carthusian, or, in any case, consistent with the Lombard tradition in terms of executive technology and artistic practice. In fact, cinnabar appears to spread out on a calcite base and not on a protein medium as, for example, in the Tuscan tradition or painting on wooden panels. The Lombard workshops, especially Amadeo's, stayed true to the classical tradition and then the Campionese tradition of spreading this rare red mineral on a preparation that was also made of minerals, such as calcite. In this way, the chemical-physical interaction of the pigment with its base was able to better bring out the red brilliance of the layer.
As regards the gilding, the analysis did not indicate the presence of a plaster or Armenian bole preparation, thus excluding the gouache gilding. A mission gilding is therefore hypothesised, which was a technique traditionally used in Lombard Renaissance modelling, especially on stucco, wood, metal, and stone, and less commonly on terracotta. More precisely, the absence of mission varnishes or oils suggests a simple water mission. This could justify the rather poor state of conservation of the artwork’s gilded background, too.
Finally, it should be emphasised that the removal of the dark coating has revealed a generally lively chromatic range also accompanied by a rather unusual accord, such as the green veil of the Virgin (Figure 1b).
Unfortunately, since no samples were collected from the green area and the Raman measurements were not able to recognise that pigment, it still remains uncertain.

5. Conclusions

The presented research was devoted to the characterisation of the pigments utilised for the decoration of a valuable artwork attributed to the workshop of the esteemed and well-known Italian artist Giovanni Antonio Amadeo.
The diagnostics of the pigments used to paint the earthenware attributed to Antonio Amadeo revealed themselves to be not only an important step in characterising the masterpiece from the valuable collection of Castello Sforzesco in Milan but also a significant help for the possible attribution of another artwork to the same workshop.
The colour palette was almost entirely identified, and what was evident above all was the presence of original materials, such as azurite, cinnabar, biacca, yellow ochre, smaltino, and gold leaf, together with synthetic substances, i.e., barium sulphate and Prussian blue.
This attests to extended and presumably repeated restoration work. Specifically, the presence of six layers in sample 1 and the three blue pigments in sample 2 seems to be the result of more consolidation and painting interventions throughout the centuries.
It is worth mentioning that one of the weirdest characteristics of the earthenware decoration just came out after the cleaning process: the green veil of the Madonna is indeed quite unusual and something into which one should delve deeper.
The preliminary Raman measurements were not suitable for the identification of that green layer. However, given the good results of this work, a further analysis campaign is already planned that just requires the as-yet-to-be-received permission from the Castello Sforzesco’s Museum to proceed.
Moreover, a study of the coatings has also been planned to determine the environmental circumstances that caused such a thick, dark layer of dirt on the terracotta and, therefore, help the conservators find the best prevention procedures.

Author Contributions

Conceptualization, V.G. and P.F.; methodology, V.G., P.F. and V.C.; formal analysis, V.G., C.A.L., G.F. and M.A.; investigation, A.B., M.B., M.C. and M.M.; data curation, V.G., G.F., V.C. and M.A.; writing—original draft preparation, V.G. and G.F.; writing—review and editing, V.G. and C.A.L.; supervision, M.C.; project administration, V.G. and P.F. All authors have read and agreed to the published version of the manuscript.

Funding

Authors have received no external funding.

Institutional Review Board Statement

Not applicable.

Informed Consent Statement

Not applicable.

Data Availability Statement

Not applicable.

Acknowledgments

We would like to acknowledge Francesca Tasso (Museum of Ancient Art, Sforzesco Castle, Milan) e Laura Paola Gnaccolini (Superintendency of Archaeology, Fine Arts and Landscape, Milan), Daniel Barchewitz (B&W Tek), Massimo Tagliaferro (Nanovision), Curzio Merlo (Laboratory of Diagnostics for Cultural Heritage Cr.Forma), Dario Bozzo and Giuseppe Saffioti (Alfatest). We are also grateful to Steven Corradi and Alessandro Bonizzoni for their valuable proofreading.

Conflicts of Interest

The authors declare no conflict of interest.

References

  1. Guglielmi, V.; Comite, V.; Andreoli, M.; Demartin, F.; Lombardi, C.A.; Fermo, P. Pigments on Roman Wall Painting and Stucco Fragments from the Monte d’Oro Area (Rome): A Multi-Technique Approach. Appl. Sci. 2020, 10, 7121. [Google Scholar] [CrossRef]
  2. Bonizzoni, L.; Bruni, S.; Guglielmi, V.; Milazzo, M.; Neri, O. Field and laboratory multi-technique analysis of pigments and organic painting media from an egyptian coffin (26TH dynasty). Archaeometry 2011, 53, 1212–1230. [Google Scholar] [CrossRef]
  3. Fermo, P.; Piazzalunga, A.; de Vos, M.; Andreoli, M. A multi-analytical approach for the study of the pigments used in the wall paintings from a building complex on the Caelian Hill (Rome). Appl. Phys. A 2013, 113, 1109–1119. [Google Scholar] [CrossRef]
  4. Gargano, M.; Bonizzoni, L.; Grifoni, E.; Melada, J.; Guglielmi, V.; Bruni, S.; Ludwig, N. Multi-analytical investigation of panel, pigments and varnish of The Martyirdom of St. Catherine by Gaudenzio Ferrari (16th century). J. Cult. Heritage 2020, 46, 289–297. [Google Scholar] [CrossRef]
  5. Westlake, P.; Siozos, P.; Philippidis, A.; Apostolaki, C.; Derham, B.; Terlixi, A.; Perdikatsis, V.; Jones, R.; Anglos, D. Studying pigments on painted plaster in Minoan, Roman and Early Byzantine Crete. A multi-analytical technique approach. Anal. Bioanal. Chem. 2011, 402, 1413–1432. [Google Scholar] [CrossRef]
  6. Barni, M.; Pelagotti, A.; Piva, A. Image processing for the analysis and conservation of paintings: Opportunities and challenges. IEEE Signal Process. Mag. 2005, 22, 141–144. [Google Scholar] [CrossRef]
  7. Bonizzoni, L.; Bruni, S.; Gargano, M.; Guglielmi, V.; Zaffino, C.; Pezzotta, A.; Pilato, A.; Auricchio, T.; Delvaux, L.; Ludwig, N. Use of integrated non-invasive analyses for pigment characterization and indirect dating of old restorations on one Egyptian coffin of the XXI dynasty. Microchem. J. 2018, 138, 122–131. [Google Scholar] [CrossRef]
  8. Lombardi, C.A.; Comite, V.; Fermo, P.; Bergomi, A.; Trombino, L.; Guglielmi, V. A Multi-Analytical Approach for the Characterisation of Pigments from an Egyptian Sarcophagus Cover of the Late Dynastic Period: A Case Study. Sustainability 2023, 15, 2002. [Google Scholar] [CrossRef]
  9. Fiocco, G.; Albano, M.; Merlo, C.; Rovetta, T.; Lee, C.; Volpi, F.; Bergomi, A.; Pini, C.; Lombardi, C.A.; Mariani, C.; et al. Non-Invasive Characterization of Bernardino Luini’s Color Palette: A Spectroscopic Campaign on the Frescos of Santuario Della Beata Vergine Dei Miracoli in Saronno (Italy). In Proceedings of the 2022 IMEKO TC-4 International Conference on Metrology for Archaeology and Cultural Heritage, Cosenza, Italy, 19–21 October 2022. [Google Scholar]
  10. Burgio, L.; Clark, R.J.H. Comparative Pigment Analysis of Six Modern Egyptian Papyri and an Authentic One of the 13th Century BC by Raman Microscopy Other Techniques. J. Raman Spectrosc. 2000, 31, 395–401. [Google Scholar] [CrossRef]
  11. Bednarik, R.G. Direct Dating of Chinese Immovable Cultural Heritage. Quaternary 2021, 4, 42. [Google Scholar] [CrossRef]
  12. Fermo, P.; Colella, M.; Malagodi, M.; Fiocco, G.; Albano, M.; Marchioron, S.; Guglielmi, V.; Comite, V. Study of a surface coating present on a Renaissance Piety from the Museum of Ancient Art (Castello Sforzesco, Milan). Environ. Sci. Pollut. Res. 2021, 29, 29498–29509. [Google Scholar] [CrossRef] [PubMed]
  13. Bruni, S.; Guglielmi, V.; Della Foglia, E.; Castoldi, M.; Gianni, G.B. A non-destructive spectroscopic study of the decoration of archaeological pottery: From matt-painted bichrome ceramic sherds (southern Italy, VIII-VII B.C.) to an intact Etruscan cinerary urn. Spectrochim. Acta Part A Mol. Biomol. Spectrosc. 2018, 191, 88–97. [Google Scholar] [CrossRef] [PubMed] [Green Version]
  14. Pessanha, S.; Guiherme, A.; Manso, M.; de Carvalho, M.L. X-Ray fluorescence applications to art and cultural heritage: Study of a Japanese print. Environ. Sci. Pollut. Res. 2008, 20, 9–11. [Google Scholar]
  15. Comite, V.; Andreoli, M.; Atzei, D.; Barca, D.; Fantauzzi, M.; La Russa, M.F.; Rossi, A.; Guglielmi, V.; Fermo, P. Degradation Products on Byzantine Glasses from Northern Tunisia. Appl. Sci. 2020, 10, 7523. [Google Scholar] [CrossRef]
  16. Zaffino, C.; Russo, B.; Bruni, S. Surface-enhanced Raman scattering (SERS) study of anthocyanidins. Spectrochim. Acta Part A Mol. Biomol. Spectrosc. 2015, 149, 41–47. [Google Scholar] [CrossRef]
  17. Zaffino, C.; Bruni, S.; Russo, B.; Pilu, R.; Lago, C.; Colonna, G.M. Identification of anthocyanins in plant sources and textiles by surface-enhanced Raman spectroscopy (SERS). J. Raman Spectrosc. 2015, 47, 269–276. [Google Scholar] [CrossRef]
  18. Daniels, V.; Stacey, R.; Middleton, A. The Blackening of Paint Containing Egyptian Blue. Stud. Conserv. 2004, 49, 217–230. [Google Scholar]
  19. Li, Z.; Wang, L.; Chen, H.; Ma, Q. Degradation of emerald green: Scientific studies on multi-polychrome Vairocana Statue in Dazu Rock Carvings, Chongqing, China. Heritage Sci. 2020, 8, 1–12. [Google Scholar] [CrossRef]
  20. Mezzabotta, P. Giovanni Antonio Amadeo e La Tecnica Della Terracotta. La Madonna Col Bambino, Santa Caterina Da Siena e un Monaco Certosino, La Versione Del Museo d’Arte Antica del Castello Sforzesco e Quella Proveniente Da Una Collezione Privata. Analisi scientifica e storia collezionistica. Master’s Thesis, Università degli Studi di Milano, Milan, Italy, 2021. [Google Scholar]
  21. Cavazzini, L., II. Giovane Amadeo e La Terracotta; Terracotte Del Ducato Di Milano: Milan, Italy, 2011. [Google Scholar]
  22. Barreca, S.; Bruno, M.; Oddo, L.; Orecchio, S. Preliminary study on analysis and removal of wax from a Carrara marble statue. Nat. Prod. Res. 2019, 33, 947–955. [Google Scholar] [CrossRef]
  23. Ciofini, D.; Oujja, M.; Cañamares, M.V.; Siano, S.; Castillejo, M. Detecting molecular changes in UV laser-ablated oil/diterpenoid resin coatings using micro-Raman spectroscopy and Laser Induced Fluorescence. Microchem. J. 2018, 141, 12–24. [Google Scholar] [CrossRef] [Green Version]
  24. Ashok, R. Artists’ Pigments A Handbook of Their History and Characteristics; National Gallery of Art: Washington, DC, USA, 2012; Volume 2. [Google Scholar]
  25. Feller, R.L. Artists’ Pigments, A Handbook of Their History and Characteristics; National Gallery of Art: Washington, DC, USA, 2012; Volume 1. [Google Scholar]
  26. FitzHugh, E.W. Artists’ Pigments, A Handbook of Their History and Characteristics; National Gallery of Art: Washington, DC, USA, 2012; Volume 3. [Google Scholar]
  27. Madariaga, J.M. Analytical chemistry in the field of cultural heritage. Anal. Methods 2015, 7, 4848–4876. [Google Scholar] [CrossRef]
  28. Bruni, S.; Cariati, F.; Casadio, F.; Toniolo, L. Spectrochemical characterization by micro-FTIR spectroscopy of blue pigments in different polychrome works of art. Vib. Spectrosc. 1999, 20, 15–25. [Google Scholar] [CrossRef]
  29. Burgio, L.; Clark, R.J.H. Library of FT-Raman Spectra of Pigments, Minerals, Pigment Media and Varnishes, and Supplement to Existing Library of Raman Spectra of Pigments with Visible Excitation. Spectrochim. Acta Part A 2001, 57, 1491–1521. [Google Scholar] [CrossRef] [PubMed]
  30. Nodari, L.; Ricciardi, P. Non-invasive identification of paint binders in illuminated manuscripts by ER-FTIR spectroscopy: A systematic study of the influence of different pigments on the binders’ characteristic spectral features. Herit. Sci. 2019, 7, 7. [Google Scholar] [CrossRef]
  31. Edwards, H.G.M.; Villar, S.E.J.; Eremin, K.A. Raman spectroscopic analysis of pigments from dynastic Egyptian funerary artefacts. J. Raman Spectrosc. 2004, 35, 786–795. [Google Scholar] [CrossRef]
  32. Bell, I.M.; Clark, R.J.H.; Gibbs, P.J. Raman Spectroscopic Library of Natural and Synthetic Pigments (Pre-1850 AD). Spectrochim. Part A 1997, 53, 2159–2179. [Google Scholar] [CrossRef]
  33. Vandenabeele, P.; Garcia-Moreno, R.; Mathis, F.; Leterme, K.; Van Elslande, E.; Hocquet, F.-P.; Rakkaa, S.; Laboury, D.; Moens, L.; Strivay, D.; et al. Multi-disciplinary investigation of the tomb of Menna (TT69), Theban Necropolis, Egypt. Spectrochim. Acta Part A Mol. Biomol. Spectrosc. 2009, 73, 546–552. [Google Scholar] [CrossRef]
  34. Clark, R.J.H. Pigment identification by spectroscopic means: An arts/science interface. Comptes Rendus Chim. 2002, 5, 7–20. [Google Scholar] [CrossRef]
  35. Kock, L.D.; De Waal, D. Raman analysis of ancient pigments on a tile from the Citadel of Algiers. Spectrochim. Acta Part A Mol. Biomol. Spectrosc. 2008, 71, 1348–1354. [Google Scholar] [CrossRef] [Green Version]
  36. Bonizzoni, L.; Bruni, S.; Galli, A.; Gargano, M.; Guglielmi, V.; Ludwig, N.; Lodi, L.; Martini, M. Non-invasive in situ analytical techniques working in synergy: The application on graduals held in the Certosa di Pavia. Microchem. J. 2016, 126, 172–180. [Google Scholar] [CrossRef]
  37. Venuti, V.; Caridi, F.; Colica, E.; Crupi, V.; D’Amico, S.; Guido, S.; Majolino, D.; Paladini, G.; Mantella, G. Diagnostic Investigation of the Cycle of the New Church of Sarria (Floriana, Malta) by Mattia Preti. Proc. J. Phys. Conf. Ser. Inst. Phys. 2022, 2204, 012023. [Google Scholar] [CrossRef]
  38. Guglielmi, V.; Andreoli, M.; Comite, V.; Baroni, A.; Fermo, P. The combined use of SEM-EDX, Raman, ATR-FTIR and visible reflectance techniques for the characterisation of Roman wall painting pigments from Monte d’Oro area (Rome): An insight into red, yellow and pink shades. Environ. Sci. Pollut. Res. 2022, 29, 29419–29437. [Google Scholar] [CrossRef]
  39. Cappelletti, G.; Ardizzone, S.; Fermo, P.; Gilardoni, S. The influence of iron content on the promotion of the zircon structure and the optical properties of pink coral pigments. J. Eur. Ceram. Soc. 2005, 25, 911–917. [Google Scholar] [CrossRef]
  40. Vahur, S.; Teearu, A.; Peets, P.; Joosu, L.; Leito, I. ATR-FT-IR spectral collection of conservation materials in the extended region of 4000-80 cm–1. Anal. Bioanal. Chem. 2016, 408, 3373–3379. [Google Scholar] [CrossRef] [PubMed]
  41. Harroun, S.G.; Bergman, J.; Jablonski, E.; Brosseau, C.L. Surface-enhanced Raman spectroscopy analysis of house paint and wallpaper samples from an 18th century historic property. Analyst 2011, 136, 3453–3460. [Google Scholar] [CrossRef] [PubMed]
  42. Matteini, M.; Moles, A. La Chimica Del Restauro; Nardini Editore: Firenze, Italy, 2004. [Google Scholar]
  43. Campanella, L.; Casoli, A.; Colombini, M.P.; Marini Bettolo, R.; Matteini, M.; Migneco, L.M.; Montenero, A.; Nodari, L.; Piccioli, C.; Plossi Zappalà, M.; et al. Chimica Per L’arte; Zanichelli: Bologna, Italy, 2011. [Google Scholar]
  44. Database of ATR-FT-IR Spectra of Various Materials. Available online: https://Spectra.Chem.Ut.Ee/Paint/Pigments/Lead-White/ (accessed on 27 January 2023).
  45. Pellegrini, D.; Duce, C.; Bonaduce, I.; Biagi, S.; Ghezzi, L.; Colombini, M.P.; Tinè, M.R.; Bramanti, E. Fourier transform infrared spectroscopic study of rabbit glue/inorganic pigments mixtures in fresh and aged reference paint reconstructions. Microchem. J. 2016, 124, 31–35. [Google Scholar] [CrossRef]
  46. Chukanov, N.V.; Chervonnyi, A.D. Infrared Spectroscopy of Minerals and Related Compounds; Springer: Berlino, Germany, 2016. [Google Scholar]
  47. Chukanov, N.V. Infrared Spectra of Mineral Species, 3rd ed.; Springer: Berlino, Germany, 2014; pp. 14–1726. [Google Scholar] [CrossRef]
  48. Gadsden, J.A. Infrared Spectra of Mineral and Related Inorganic Compounds; Butterworths: London, UK, 1975. [Google Scholar]
  49. Derrick, M.R.; Stulik, D.; Landry, J.M. Scientific Tools for Conservation Infrared S Pectrosco p y in Conservation Science; The Getty Conservation Institute: Los Angeles, CA, USA, 1999. [Google Scholar]
  50. Cavallo, G.; Riccardi, M.P. Glass-based pigments in painting: Smalt blue and lead–tin yellow type II. Archaeol. Anthr. Sci. 2021, 13, 13. [Google Scholar] [CrossRef]
  51. Jones, G.C.; Jackson, B. Infrared Transmission Spectra of Carbonate Minerals; Springer: Dordrecht, The Netherlands, 1993. [Google Scholar]
  52. Franquelo, M.L.; Duran, A.; Herrera, L.K.; Jimenez de Haro, M.C.; Perez-Rodriguez, J.L. Comparison between micro-Raman and micro-FTIR spectroscopy techniques for the characterization of pigments from Southern Spain Cultural Heritage. J. Mol. Struct. 2009, 924-926, 404–412. [Google Scholar] [CrossRef]
  53. Database of ATR-FT-IR Spectra of Various Materials. Available online: https://Spectra.Chem.Ut.Ee/Paint/Pigments/Prussian-Blue/ (accessed on 27 January 2023).
  54. Doménech-Carbó, A.; Doménech-Carbó, M.T.; Osete-Cortina, L.; Donnici, M.; Guasch-Ferré, N.; Gasol-Fargas, R.M.; Iglesias-Campos, M. Electrochemical assessment of pigments-binding medium interactions in oil paint deterioration: A case study on indigo and Prussian blue. Heritage Sci. 2020, 8, 1–17. [Google Scholar] [CrossRef]
  55. Scott, D.A. Copper and Bronze in Art: Corrosion, Colorants, Conservation; Getty Trust Publications: Los Angeles, CA, USA, 2002; pp. 253–255. [Google Scholar]
  56. Bianucci, R.; Mattutino, G.; Lallo, R.; Torre, C. Identification of a chrysocolla amulet in an Early Dynastic child mummy. J. Archaeol. Sci. 2009, 36, 592–595. [Google Scholar] [CrossRef]
  57. Mugnaini, S.; Bagnoli, A.; Bensi, P.; Droghini, F.; Scala, A.; Guasparri, G. Thirteenth century wall paintings under the Siena Cathedral (Italy). Mineralogical and petrographic study of materials, painting techniques and state of conservation. J. Cult. Heritage 2006, 7, 171–185. [Google Scholar] [CrossRef]
  58. Andersen, F.A.; Brecevic, L. Infrared Spectra of Amorphous and Crystalline Calcium Carbonate. Acta Chem. Scand. 1991, 45, 1018–1024. [Google Scholar] [CrossRef]
  59. IRUG-Infrared Raman Users Group. Available online: http://www.irug.org (accessed on 27 January 2023).
  60. Bevilacqua, N.; Borgioli, L.; Adrover Gracia, I. I Pigmenti Nell’arte: Dalla Preistoria Alla Rivoluzione Industriale; il Prato Publishing House: Saonara, Italy, 2010. [Google Scholar]
  61. Bikiaris, D.; Daniilia, S.; Sotiropoulou, S.; Katsimbiri, O.; Pavlidou, E.; Moutsatsou, A.; Chryssoulakis, Y. Ochre-differentiation through micro-Raman and micro-FTIR spectroscopies: Application on wall paintings at Meteora and Mount Athos, Greece. Spectrochim. Acta A Mol. Biomol. Spectrosc. 1999, 56, 3–18. [Google Scholar] [CrossRef]
  62. Di Lernia, S.; Bruni, S.; Cislaghi, I.; Cremaschi, M.; Gallinaro, M.; Guglielmi, V.; Mercuri, A.M.; Poggi, G.; Zerboni, A. Colour in context. Pigments and other coloured residues from the Early-Middle Holocene site of Takarkori (SW Libya). Archaeol. Anthr. Sci. 2016, 8, 381–402. [Google Scholar] [CrossRef]
  63. Vahur, S.; Teearu, A.; Leito, I. ATR-FT-IR spectroscopy in the region of 550–230 cm−1 for identification of inorganic pigments. Spectrochim. Acta Part A Mol. Biomol. Spectrosc. 2010, 75, 1061–1072. [Google Scholar] [CrossRef]
  64. Domingo, I.; García-Borja, P.; Roldán, C. Identification, processing and use of red pigments (hematite and cinnabar) in the valencian early neolithic (Spain). Archaeometry 2012, 54, 868–892. [Google Scholar] [CrossRef]
  65. Invernizzi, C.; Daveri, A.; Vagnini, M.; Malagodi, M. Non-invasive identification of organic materials in historical stringed musical instruments by reflection infrared spectroscopy: A methodological approach. Anal. Bioanal. Chem. 2017, 409, 3281–3288. [Google Scholar] [CrossRef]
  66. Shukshin, V.E.; Fedorov, P.P.; Generalov, M.E. Low-Frequency Raman Lines as an Indicator of the Presence of Lead in Oxide Materials. Russ. J. Inorg. Chem. 2019, 64, 1442–1445. [Google Scholar] [CrossRef]
  67. Pargoletti, E.; Tricoli, A.; Pifferi, V.; Orsini, S.; Longhi, M.; Guglielmi, V.; Cerrato, G.; Falciola, L.; Derudi, M.; Cappelletti, G. An electrochemical outlook upon the gaseous ethanol sensing by graphene oxide-SnO2 hybrid materials. Appl. Surf. Sci. 2019, 483, 1081–1089. [Google Scholar] [CrossRef]
  68. Tomasini, E.P.; Halac, E.B.; Reinoso, M.; di Liscia, E.J.; Maier, M.S. Micro-Raman Spectroscopy of Carbon-Based Black Pigments. J. Raman Spectrosc. 2012, 43, 1671–1675. [Google Scholar] [CrossRef]
  69. Correia, A.M.; Clark, R.J.H.; Ribeiro, M.I.M.; Duarte, M.L.T.S. Pigment study by Raman microscopy of 23 paintings by the Portuguese artist Henrique Pousão (1859–1884). J. Raman Spectrosc. 2007, 38, 1390–1405. [Google Scholar] [CrossRef]
  70. Grandjean, F.; Samain, L.; Long, G.J. Characterization and utilization of Prussian blue and its pigments. Dalton Trans. 2016, 45, 18018–18044. [Google Scholar] [CrossRef] [PubMed]
Figure 1. The bas-relief in polychrome terracotta by G. A. Amadeo (1465–1470) (a) before and (b) after the cleaning. In Figure 1a, the sampled points are also evidenced as follows: 1—the Carthusian priest’s robe; 2—Madonna’s blue mantle; 3—Madonna’s blue robe; 4—A dark-ochre background; 5—A gilded area on the background; 6—Madonna’s red sleeve. In (b), the points where the colours were characterised by in situ Raman spectroscopy are indicated.
Applsci 13 03924 g001
Figure 2. (a) SEM image and (b) optical microscopic image under UV light of cross-sectioned sample 1. The red square in (a) highlights the area shown at a higher magnification in (b). The overlapped layers from A to F composing the stratigraphy are marked in (b) by the red dotted lines.
Applsci 13 03924 g002
Figure 3. FTIR spectra related to (a) layer B and (b) layer A of embedded and cross-sectioned sample 1. Marker bands of biacca (∗), and proteinaceous material (o) are highlighted.
Applsci 13 03924 g003
Figure 4. Optical microscopic images under UV light (a,b) of cross-sectioned sample 2. The red square in (a) highlights the area shown at a higher magnification in (b). The overlapped layers from A to D composing the stratigraphy are marked in (a,b) by the red dotted lines.
Applsci 13 03924 g004
Figure 5. FTIR spectra were collected in correspondence with A (a) and B (b) layers of sample 2, an embedded and cross-sectioned sample. Marker bands of azurite (+), Prussian blue (§), and smalt (×) are highlighted.
Applsci 13 03924 g005
Figure 6. BSE image of the blue sample 3.
Applsci 13 03924 g006
Figure 7. SEM-EDXS analysis of sample 3: (a) BSE image; (b) SEM-EDS map in false colours obtained from the analysis of the sample surface; (c) EDS spectrum obtained from the analysis of the sample surface and relative table with the percentage weight of the detected elements; (d) SEM-EDS map in false colours of Cu, C, Pb, S, Ba.
Applsci 13 03924 g007
Figure 8. ATR-FTIR spectrum obtained on a small grain of the blue sample 3. Marker bands of azurite (+), barium sulphate (◇), organic material (o), and calcium oxalate (•) are highlighted.
Applsci 13 03924 g008
Figure 9. SEM-EDXS analysis of sample 5: (a) micrograph in backscattering mode; (b) magnified image of (a); (c) EDS spectrum obtained from the analysis of the sample surface and relative table with the percentage weight of the detected elements; (d) BSE image; (e) SEM-EDS map in false colours obtained from the analysis of the sample surface; (f) SEM-EDS map in false colours of Au, C, Pb, Ca, Ba, Si, Al, and S.
Applsci 13 03924 g009
Figure 10. SEM image (a) and optical microscopic image under UV light (b) of cross-sectioned sample 6. The overlapped layers A and B composing the stratigraphy are marked in (b) by the red dotted lines.
Applsci 13 03924 g010
Figure 11. FTIR spectra were collected in correspondence with layer A of the embedded and cross-sectioned sample 6. Marker bands of binder (•), biacca (∗), barium sulphate (◇), and silicates (||) are highlighted.
Applsci 13 03924 g011
Figure 12. Raman spectra (λext 1064 nm) were collected on: (a) the Carthusian priest’s sleeve; (b) S. Caterina’s right cheek; (c) S. Caterina’s left hand; (d) Madonna’s right hand; the inscription in the ribbon and in detail; (e) the letter T; and (f) the white background.
Applsci 13 03924 g012
Table 1. Summary of the results obtained and composition of the samples.
SampleLayerColourSEM-EDS
(Characterising Elements)
ATR-FTIR
(Peaks, cm−1)
Composition
1Awhite/greyCa, Si2930, 2860, 1650, 1550, ~1400 (br), ~1000 (br), 873calcite, silicate, proteinaceous compound
BwhitePb3435, 1400, 1045, 770biacca
Cwhite/greyCa, Si~1400 (br), ~1000 (br), 873calcite, silicate
DwhitishBa1180, 1120 (sh), 1085, 985barite
Ewhite/greyCa, Si2930, 2860, 1650, 1550calcite, proteinaceous compound
FwhitePb3435, 1400, 1045, 770biacca
2Awhite/greyCa, Ba, S1410, 1180, 1110, 1060Calcite, barite
BwhitePb2930, 2860, 1650, 1550, 1400biacca and
proteinaceous material
CblueFe, Co,2080 (PB), 1060, 790 smaltino and Prussian blue
DblueCu3420, 1465, 1090, 1026, 1400, 950, 820 Azurite
3-blueCu, Ba, S3425, 1492, 1463, 1412, 952, 833, 815, 770, 740, 490, 446
1185, 1080, 635, 603
Azurite,
Barite
4-dark yellowFe, Si, K, Al, Pb, Ca1393 (br), 678
2920, 2849, 1651, 1550
1318, 1088, 1032, 913, 798, 779, 530, 470, 3325, 3400, 1460, 667, 598,874, 713
Lead white, yellow ochre
5-goldAu, Si, Al, Pb, Ca, S, Ba1400, 874,713
1185, 1080, 635, 603 (ba), 1088, 1032, 913, 798, 779, 1393 (br), 678 (lw)
Gold, Lead white, Calcite, Barite, silicate
6AredHg, Pb, Ba, S2925, 2860, 1715, 1390, 1180, 1060, 1400, 678Cinnabar, lead white, barite, organic material
Bwhite/greyCa~1400, 870Calcite
Disclaimer/Publisher’s Note: The statements, opinions and data contained in all publications are solely those of the individual author(s) and contributor(s) and not of MDPI and/or the editor(s). MDPI and/or the editor(s) disclaim responsibility for any injury to people or property resulting from any ideas, methods, instructions or products referred to in the content.

