Abstract
In today’s era, the e-government plays a significant role in providing better services to citizens. As a result, citizens are crucial in ensuring the success of the e-government and are involved in the government’s policies. Hence, the protection of personal information must be taken into consideration when designing any e-government model. Previous studies have shown that privacy and security are the main challenges in implementing an e-government in developing countries. This study aims to evaluate an e-government stage model that is proposed based on protecting personal information in developing countries. The methodology of this study uses SOAR (Strengths, Opportunities, Aspirations, and Results) analysis to evaluate the stages and combines it with the Analytic Hierarchy Process (AHP) to determine the feasibility of the model. The results of the study show that the model is acceptable and suitable for adoption. Therefore, the model is a viable option for implementing an e-government in developing countries.
1. Introduction
Governments all over the world are changing the way they provide information and public services to citizens, as well as the way they interact with those who use governmental services. This change is a result of the introduction of the Internet and the enormous advancements in Information and Communications Technologies (ICTs). Governments, both on a local and national scale, are posting critical information on the Internet, automating their major and minor procedures, and communicating electronically with their citizens in nearly every corner of the world. This phenomenon is referred to as “digital governance” or “e-government”. One of the main challenges in the creation and implementation of an e-government is the security and privacy concerns, which have been the subject of much research [1]. Verifying and authenticating user identities; ensuring data confidentiality, integrity, and availability; and protecting user privacy are the key security and privacy concerns related to e-government services. These problems also exist, although to a lesser extent, with online apps. Strong authentication mechanisms are necessary to confirm the identities of users of these services, given the increasing availability of advanced e-government services, and to provide secure and trustworthy information that is only accessible to authorized individuals. To utilize these linked services, these authentication mechanisms require users to provide personally identifiable information to government websites. However, the use of these security measures to confirm user identities while providing e-government services, and the potential for data sharing across government agencies, have raised privacy concerns and hindered user adoption of these services [2,3,4]. Numerous attempts have been made to address this conundrum in previous studies. In order to ensure the security of their systems and the privacy of their citizens, governments must focus their efforts on implementing high-security protocols. Such actions will enhance the public’s perception of the government and encourage the use of its services. Secure communication must be guaranteed at all times. As potential attack vectors, network participants could be breached and misused. For example, during communication, an attacker may intercept and alter messages [5]. How frequently users use the service and visit the website can be a good indicator of their satisfaction. It has been found that offering secure and privacy-focused solutions to individuals can improve their satisfaction and trust in an e-government. Protecting citizens’ online privacy is crucial for the development of an e-government. The acceptance and use of e-government services in developing countries continue to pose significant challenges, including the digital divide among the population, inadequate e-government services, and limited access to technology [6]. These issues will likely persist in developing countries, but governments can enhance stakeholder participation in e-government programs by incorporating appropriate protection measures when planning e-government projects. E-government maturity models, often referred to as stage models, can serve as guidelines for creating e-government projects. According to [7], an increasing number of e-government initiatives in developing countries are not following current e-government trends.
Statistics show that cyberattacks and data breaches are becoming more prevalent in developing countries, while the occurrence of major breaches is decreasing in the West. To foster trust among users, the protection of personal information is crucial in e-government systems, as it provides citizens with a sense of ownership. E-government installations maintain citizens’ personal information using secure protocols to ensure their protection. To preserve privacy, measures such as organizational, social, legal, and technical measures must be in place [8]. Some scholars argue that passing laws to protect data privacy is of utmost importance. They stress the importance of enacting and enforcing such legislation, which can also support e-business efforts. The responsible parties in e-government initiatives, particularly the government, should establish information security objectives and ensure that the necessary resources are available to achieve them. It is essential to improve security procedures to enhance security and privacy, as issues related to user privacy significantly impact the effectiveness of e-government [4,9,10].
In order to identify the strengths, weaknesses, and success factors of e-government models, the authors have analyzed various e-government stage models in the literature. Although they are based on different perspectives and employ a variety of e-government concepts, these models appear to vary from one another. For local governance in developing countries, the authors propose an e-government stage model based on several factors such as legal, organizational, technical, and social considerations. These are important to take into account when starting an e-government project in developing countries. The six phases of the proposed e-government stage model (Requirements, Information, Awareness, Interaction, Transaction, and Integration) are centered on protecting personal information [8].
The purpose of this study is to develop a systematic strategy and provide assistance for a decision scenario regarding the implementation of an e-government stage model focused on personal data protection in developing countries. To analyze both the supply and demand side, the SOAR (Strengths, Opportunities, Aspirations, and Results) technique is utilized as a tool. However, it is challenging to choose an e-government stage model using only the SOAR analysis, as many qualitative factors must be considered. These aspects are nearly linguistically ambiguous and have no definite value [11]. To overcome this challenge and analyze the SOAR components methodically, as well as take these variables into account in a hierarchical structure, the Analytic Hierarchy Process (AHP) approach is used.
The proposed stage model and the algorithm for the study’s personal data flow process are both illustrated in the section on the proposed stage model. The assessment methodology section follows, which includes a discussion of the SOAR group factors and the methods involved in computing AHP. This section also covers the calculation of the combined approaches. The study’s findings are illustrated with figures and discussed in the discussion section. The study concludes with the references section.
2. The Proposed Stage Model
Many different e-government stage models have been presented by individual researchers. The models offered by researchers vary in terms of phases. They are offered models that are based on numerous terms and events. There are four to seven stages in all. The general stages are web presence, interaction, communication, transaction, integration, and e-democracy [12]. These models are not mainly focused on security issues. The majority of them claim that the models place too much emphasis on stage names while ignoring stage security issues. Some models do not take into consideration the organizational, sociological, political, and technological needs that affect whether e-government implementations are successful or unsuccessful. The majority of the models in prior studies emphasize that the adoption of electronic government happens consistently, with e-government initiatives moving from basic to complex technologies. All current e-government maturity models recommend that the transaction stage be implemented before the integration stage. However, without the integration of e-government services at multiple levels and the current provision of sufficient security, transactions will not be completed. On the other hand, starting at the bottom and ascending from there up is not required. It is required to start at the beginning and build the system step by step, without skipping any stages, in order to correctly complete it. This is due to how intricately each step is woven into the others, due to their social and cultural views toward technology, particularly in developing countries [8].
The proposed stage model consists of six phases, as shown in Figure 1. The first stage is the Requirements phase, which focuses on the ICT infrastructure. Shortages in legal and organizational factors can be addressed in this stage. It is possible to prepare for security in terms of hardware and software and to adopt a data protection statute or standard. The influence of legal and organizational elements on the progression of information is crucial at this stage. The second stage is the Information phase, which involves the creation of a static website displaying basic information about each organization. It is important to ensure that the website is free of technical issues or other actions that may negatively impact citizens’ opinions.
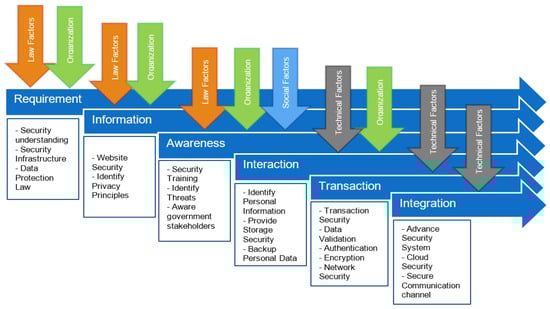
Figure 1.
Proposed E-government Model [8].
Based on international norms, the privacy concept should be addressed. The Requirements and Awareness phases are unique to this model since they were not present in prior models that were proposed to the developing countries. In countries where people have just opened up to new technologies, awareness is a different stage that requires greater attention. Employees of government stakeholders should be taught at this point to ensure that they have a sufficient understanding of security and the protection of personal information. After this step, the government may carry out everyday operations in their companies using forms, and consumers can download the forms and manually submit their requests. Personal information is backed up in each organization while maintaining a high level of storage. Organizations and technological factors are assessed at this stage. Because the transaction stage involves a two-way communication between government agencies and individuals, the most technical challenges arise in the transaction and integration stages. As a result, the majority of security techniques, such as transaction security, data validation, encryption, authentication, and network security, are necessary at this point. All government websites are shown on one page during the engagement stage. To offer a secure channel across all websites and data operations, both advanced security and cloud security methods are required.
An illustration of a personal data flow algorithm using the proposed stage model is shown in Figure 2. Consider a scenario where an organization offers a website. S1 and S2 are the two primary systems that make up the website. S1 collects a set of personal data (PD) from its users. Three processes via three servers, namely, the Local Server (LS), Encryption Server (ES), and Central Server (CS), are involved in processing PD. Users interact with the LS in S1 via a Public Interface (PI). In the LS, the users argued about PD collection and obtaining their consent on processing PD. However, the LS distinguished PD from Public Data, then it sends them to Encryption Server. The PD is stored in a Local Data Store (LDS) in an encrypted manner. The Local Admin Interface (LAI) allows the Local Admin (LA) to interact with the LS in S1. In the third system (S3), the Central Server retrieves the encrypted PD from the LDS, then processes it by the Central Admin (CA), which is manipulated via the Central Admin interface (CAI). In S3, there are two data stores, which are the Central Data Store (CDS) and the External Data Store (EDS). The Central Server replicates the PD in both data stores. The proposed model suggests a mix of legal, social, organizational, and technological control measures because technical security control is generally nonexistent in developing countries. The General Data Protection Regulation (GDPR) and international standards such as the Personal Data Protection and its Critical Security Controls (CIS CSC), ISO 27001, COBIT 5, and NIST 800-53 serve as the foundation for these controls. The measures relate to internal security, perimeter security, risk management awareness, and personal information security in terms of physical and logical assets. These procedures will guarantee that personal data are protected during every stage of its existence. The number of impacted factors, compliance with security measures for each factor, and the anticipated level of security based on the necessary measure for that factor may all be used to determine the security level of each stage. For instance, using Formula (1), according to the above algorithm, we can evaluate the security of personal data at a stage such as the Interaction Stage [8].
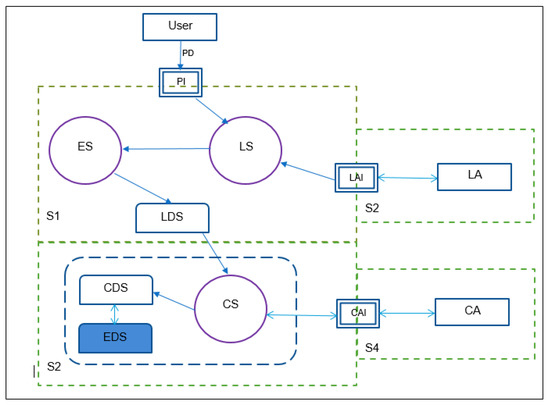
Figure 2.
Data Flow Algorithm of Proposed Stage Model.
PISL = Personal Information Security Level
PLM = Practiced Technical Measure
ELM = Expected Technical Measure
POM = Practiced Organization Model
EOM = Expected Organization Model
Thus, the personal information security level of integration stage determines as the compliance levels of the technical and organizational measures of the model to the expected level of security based on required control measures that come from the collection of international standards.
3. Assessment Methodology
E-government is a crucial tool for transforming how the government delivers services to its people and other stakeholders whenever and wherever they need them. There has been a lot of research performed on monitoring and benchmarking e-government systems. However, little research has been conducted to evaluate e-government stage models as a whole [9]. With little-to-none in-depth study of the e-government stage model as a whole, the majority of research on evaluating e-government systems has often focused on the various features or sections within a model, such as strategy, policies, service provision, and ICT projects [8]. Furthermore, this area has not been properly examined from the perspective of system adoption. For example, some advisors, government leaders, and consultants may use benchmarks, key performance indicators (KPI), may look at user satisfaction questionnaires, and use other assessment and monitoring tools as another method for assessing the effectiveness of the e-government stage model [12,13]. According to the authors, it is crucial to assess e-government systems before they are put into use, since doing so would be a budget-wasting waste. Contributors who invest in e-government initiatives are increasingly insistent that the financed programs utilize qualitative and quantitative methods to assess their impact and performance.
Over the past ten years, the Strength, Opportunities, Aspirations, and Results (SOAR) analytical approach has become a popular tool for planning and analyzing strategic initiatives. An organization can interact with its surroundings and develop business strategies by using this method to determine environmental correlations. For more than 20 years, SOAR has gained a reputation as a framework that offers an adaptable method for strategic thinking and strategy development. By involving pertinent stakeholders, SOAR facilitates planners’ understandings of the entire system and encourages those in charge of strategic planning to involve stakeholders beyond top management. Citizens, workers, clients, suppliers, and the communities that the system affects can all be considered stakeholders. Therefore, it is very suitable for use in assessing e-government stage models [14,15]. On the other hand, it is crucial to utilize a calculating approach that aids decision makers in order to determine the feasibility of the suggested model’s component parts for implementation. The Analytic Hierarchical Process (AHP) is a multi-criteria decision-making process that makes use of hierarchical formation to illustrate an issue and then generate priorities for alternatives depending on the user’s decision [16].
3.1. SOAR
The abbreviation for SOAR is Strengths, Opportunities, Aspirations, and Results. According to its inventors, SOAR is intended to be a “positive approach to strategic thinking and planning that enables an organization to shape its future via collaboration, common knowledge, and a commitment to action”. Since the stage model is a strategic plan for the government to serve its stakeholders, SOAR is a very effective tool for studying e-government from the first stages to execution. The SOAR framework provides a flexible way to create and consider strategies [14].
By bringing in relevant parties, it helps planners comprehend the overall system and encourages people in charge of strategic planning to bring in parties other than top management. Citizens, governmental entities, and non-governmental communities that the government touches may all be included in these stakeholders. It is simpler to comprehend how a corporation operates and what it may develop into in the future when it is seen as a whole, and many different points of view are taken into account. SOAR first reframes vulnerabilities and threats that arise throughout strategic discussion in order to construct the strategic core of what the government organization aims to become and to ground those goals in quantifiable future results [15].
Comparing the SOAR framework to a SWOT study is not an accident. In contrast to SWOT, which focuses on both internal and external opportunities and threats, SOAR starts with a strategic inquiry employing an appreciating purpose via a discussion of the possibilities and strengths that are accessible to the organization. When strengths-based concepts turn the conventional SWOT analysis into SOAR by concentrating specifically on the factors that provide for the organization’s future life and vitality, strategic planning processes are hastened. SOAR is more suitable for analyzing and planning e-government implementation because it serves as a crucial link between strengths-based theory and practice by emphasizing essential inputs, processes, and outcomes. In previous research, SWAT was mostly used by the authors to evaluate the models [15,16], but this method is inadequate and unsuitable for evaluating this type of model since it is influenced by numerous factors, as stated on [17,18]. Since the stage model acts as a blueprint for implementing e-government, it is necessary to focus on strengths, opportunities, and execution, rather than threats or analyses as depended on by SWAT. There is no published research for evaluating e-government stage modes using SOAR. Table 1 provides a summary of the similarities and differences between SWOT and SOAR. A purposeful shift in conversational themes from problems to opportunities and from weaknesses to strengths is encouraged by SOAR. As a result, this strategy seeks to identify, develop, and capitalize on the organization’s strengths as the foundation for strategic growth. The discourse changes from the standpoint of “we have problems that must be fixed if we are to advance” to “this is what we specialize in and can help us prepare ourselves for, for the future”. The SOAR framework promotes conversations and tactical possibility thinking [14,18]. An organization may, for example, present this as an opportunity rather than a vulnerability. The SOAR can be dissected into its component pieces, with respect to the proposed e-government stage model’s approach to securing personal data.

Table 1.
Different between SOAR and SWOT [14].
Figure 3 illustrates the SOAR group factors corresponding to the stages in the proposed model.
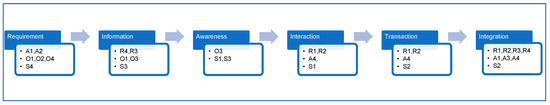
Figure 3.
SOAR group factors corresponding to the stages of proposed model.
The first factor is strength that can be attained in the stage models:
- S1: Protecting personal information in one-way communication.
- S2: Protecting personal information in two-way communication.
- S3: Personal information protection awareness among e-government stakeholders.
- S4: Personal information security protocol.
The opportunity factors are:
- O1: Providing a proper personal data protection law context.
- O2: Developing security information infrastructure.
- O3: Identify personal information.
- O4: Enhance security of communication and storage.
Via the stage model the government will have the following aspirations:
- A1: Reduce cost.
- A2: Obtain law framework for protecting personal information.
- A3: Provide transparency.
- A4: Improve e-service.
The results that can be obtained through implementing this model are:
- R1: Enhance security of communication channels.
- R2: Provide high level of security for personal information within government organizations.
- R3: Increase trust of people towards the e-government.
- R4: Increase e-participation.
3.2. Analytic Hierarchy Process (AHP)
Making choices includes the weighting of several elements while making decisions. We have a number of alternatives to pick from and a number of criteria or factors to bear in mind when making each of these decisions. When making decisions collectively, these criteria and options will be more obvious, thus we must choose them before giving them a judgment score or assessment value. The Analytic Hierarchy Process (AHP), one of the methods for making multi-criteria decisions, was developed by Prof. Thomas L. Saaty. Fundamentally, it is a method for creating ratio scales from paired comparisons. Both objective measurements such as price, weight, etc., and objective judgments such as gratified feelings and preferences can be sources of input. AHP allows for a small bit of judgmental inconsistency because humans are not always consistent [16,19]. The ratio scales are produced from the major Eigen vectors, whereas the consistency index is formed from the primary Eigen value. When there are several criteria and options, AHP is the best strategy for reaching a selection. The analysis’ objective Level 0 may be represented as the hierarchy’s structure. Level 1 has many requirements made up of different elements. Additional tiers of sub criterion and sub-sub criteria may also be added. The alternate options are the level after that, as shown in Figure 4 [16,20]. The lines separating levels show how variables, options, and the objective are related. The following steps explain how to calculate AHP.
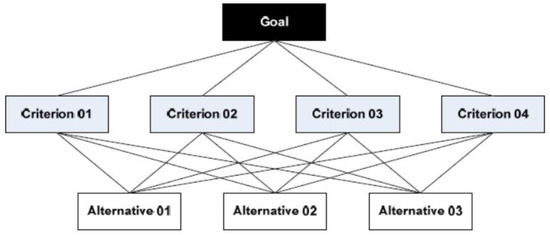
Figure 4.
AHP Structure [18].
- Developing a hierarchical structure with a goal at the top level. The attributes/criteria at the second level and the alternatives at the third level.
- Determine the relative importance of different attributes or criteria, with respect to the goal (using the fundamental scale values from Table 2). In this step, a pairwise comparison matrix is created with the help of scale of relative importance, as shown in Saaty’s table.
Table 2. Fundamental Scale Values of Saaty [19].
- 3.
- A normalized pairwise matrix is calculated by all of the elements of the column divided by the sum of the column (Equation (2)).
is the weight of alternative j associated with the criterion map k.
k is the number of criteria, and j is the number of alternatives.
- 4.
- Calculate the criteria weights by averaging all the elements in the row (Equation (3)).
k is the element of the row.
- 5.
- Multiply each value in the column by the criteria weight in order to determine whether the calculated value is correct or not for this or another pairwise comparison matrix that is not normalized.
- 6.
- Calculate the weighted sum value by taking the sum of each value in the row.
- 7.
- Calculate the ratio of the weighted sum value and the criteria weight (Equation (4)).
- 8.
- Calculate Lambda max (λmax) by taking the average of all values that come from step 7 (Equation (4)).
is number of the calculated ratio .
- 9.
- The consistency index CI, which is given by the formula lambda max minus n upon n minus 1 (Equation (6)).
- 10.
- The consistency ratio is given by dividing the consistency index with random index RI (Equation (7)). Random index is the consistency index of the randomly generated pairwise matrix. Table 3 shows the random index table for up to 10 criteria.
Table 3. Random Index Values Based on Matrix Scales [19].
- 11.
- Checking for consistency in the hierarchy provided that if the consistency ratio (Equation (7)) is less than or equal to 0.1 then the result of the calculation is declared true [10]. IR values can be seen in Table 2 [16,20,21].
Analytical Hierarchy Process (AHP) and the computation of their Eigen values are combined with SOAR analysis in this study. A quantitative assessment of the importance of each aspect of decision-making will be provided by the AHP technique.
3.3. AHP-SOAR Calculation
The purpose of SOAR analysis is to quantitatively assess the criteria or elements of SOAR and determine their relative importance. This technique scans both the supply and demand sides. It will be challenging to assess the factors that have the most influence on decision making. Therefore, it is impossible to make an accurate decision using the SOAR analysis alone. The Analytical Hierarchy Process (AHP) and the computation of its Eigen values are combined with SOAR analysis in this study. A quantitative assessment of the impact of each element on decision-making will be provided using the AHP technique.
The SOAR factors attributed to each SOAR group are represented at the lowest (third) level. This is shown in Figure 5.
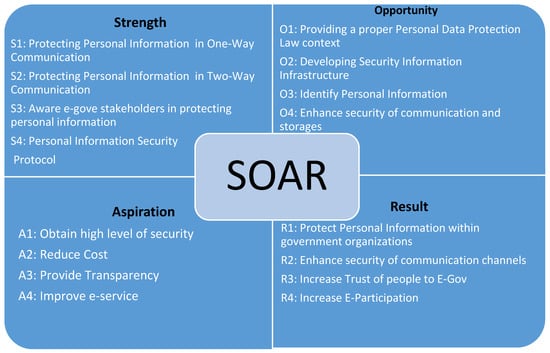
Figure 5.
SOAR Group Factors for the Proposed Model.
The hierarchical structure of the evaluation process is achieved in this section. As explained in Figure 6, the AHP structure consists of different levels. The upper level is the main goal (G), which is evaluating proposed e-government stage model with considerations of protecting personal data. The level below the upper level (second level) represents the essential targets (T) of the proposed model such as:
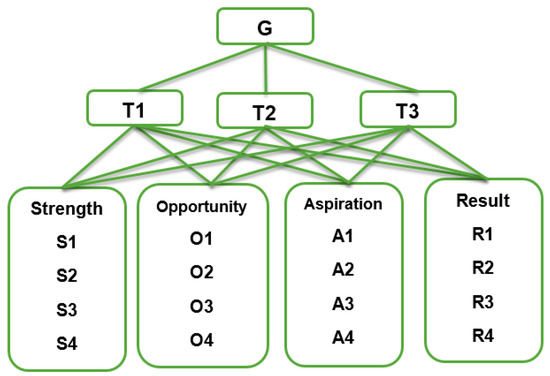
Figure 6.
AHP Structure combined with SOAR Group Factors.
- T1: Improve security of personal information.
- T2: Achieve trust to e-government services.
- T3: Provide a reliable communication between the government and its stakeholders.
Figure 6 shows the hierarchical structure of the AHP paired with the SOAR factors of the proposed e-government stage model.
To assess any system accurately, it is crucial to choose an appropriate and accurate approach to use. The methodology of this study mainly depends on two approaches that have roles in evaluating and determining the viability of the proposed stage model. Figure 7 shows the steps and the combination of the two approaches.
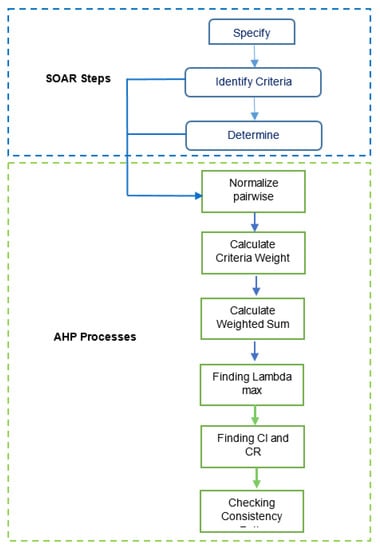
Figure 7.
The methodology process flow of combining SOAR and AHP.
Numerous factors need be taken into account. In AHP, the number of pairwise comparisons increases exponentially as the number of factors increases. As a result, the current method included four criteria for each of the four SOAR groups, but only four of these factors will be used in this scenario. It is important to remember that, in accordance with [20], no more than 10 components should be included in each SOAR category. One comparison matrix will be used at level one to provide pairwise comparisons of essential targets in relation to the assessment’s goal. To determine the most important goal and use its values as a scaling factor, the first comparison matrix is 3 by 3 in size.
In order to determine the scaling factors for the following level, pairwise comparisons of SOAR factors are performed inside each individual SOAR group, with respect to the targets. Following this, comparisons are made based on Saaty’s scale, taking into account the relative importance of two elements’ intensities, applying the verbal scale connected to the 1–9 scale, as shown in Table 2 [21]. Additionally, it may accommodate both qualitative and quantitative data, as necessary by the AHP’s pairwise comparison style. The local priorities of the elements are determined via the Eigen value technique using these comparisons as the input, as described in section (AHP). These rankings mirror the decision-makers’ perceptions of the elements’ pertinent importance. Pairwise comparisons at the next level were performed to determine which factor in the group had the greatest value. As a result, the first and second tiers’ comparison matrices are, respectively, 3 by 3 and 4 by 4 in size.
In terms of the first level, which is about essential targets, the pairwise comparison utilizes a 3 by 3 matrix to determine the factors by dividing each row element by the total of each target column. The Eigen vectors are then normalized by averaging the factor values over the new rows or adding each new row and dividing by the number of factors, which, in this case, is three. The matrix below shows the pairwise comparison matrix for targets in relation to the goal. For selecting the values of Saaty’s table, a questionnaire survey was performed among 20 information security experts from government organizations (8 participants) and IT companies (12 participants) in the Kurdistan region of Iraq.
After dividing each matrix element by the sum of its corresponding column, the normalized relative weight will arrive. Each column’s total is 1.
The principal Eigen vector (Criteria Weight) that is normalized can be derived by averaging the rows.
For calculating the consistency, which is to check whether the calculated value is correct or not, the same pairwise comparison matrix, which is not normalized, must be taken, then one must multiply each value in the column by the criteria weighted value in the criteria weight.
Calculate the weighted sum value by taking the sum of each value in the row, which is
Calculate the ratio of weighted sum value and criteria weight.
Calculate Lambda max by taking the average of all values that come from R.
The consistency index can obtain by Formula (6) in Section 3.2:
The consistency ratio is given by dividing the consistency index with the random index RI. The random index for the targets matrix is 0.58 because the matrix is 3 × 3.
Thus, the matrix is consistent and acceptable because the consistency ration is less than 0.1, therefore, the result of the calculation is true.
The same process will also be used for the comparison of SOAR factors to identify the weight of factors within the SOAR group at the second level. In this level, the matrix is 4 by 4. The value of the Weighted factors, Lambda max, and Consistency ratio are calculated below.
The random index for the Factor matrix is 0.9 because the alternatives (Factors) matrix is 4 × 4.
The three essential targets (T1, T2, and T2) were subjected to pairwise comparison. The SOAR factors calculated, with respect to each essential target. The matrix below shows the weight of each factor, with respect to T1.
The W values show the weight of each factor, with respect to T2.
The above W values show the weight of each factor, with respect to T3.
Likewise, Table 4 shows the calculated local weights of the elements of each factor in the third level (Strength, Opportunities, Aspirations, and Results). The table below shows them along with their consistency ratios.
Table 4.
Local Weight of the SOAR Group Factors.
4. Discussion
To assess the stage model for e-government in this paper, a commonly used important tool called the SOAR analysis approach was used. It is commonly used as a technique for planning. It can be integrated with the tools that have roles in decision making. Therefore, in this study, the SOAR was integrated with the AHP technique. The outcome of the integration generated the qualitative values for the SOAR variables. For decision support, the AHP technique offered qualitative priorities. By combining SOAR and AHP, the factors considered in SOAR analysis were given analytically established priorities and were put on equal terms. By putting this integration into practice, we improved the quantitative data foundation for the evaluation of the e-government stage model.
When creating or selecting a model, numerical findings, as well as the importance or weight of a SOAR criterion, are useful. Since all components on the numerical scale are equal, it is crucial to analyze the supply and demand sides and any potential relationships between them.
Figure 8 is a pie chart that illustrates the scaling of essential targets of the second level of the AHP structure. The first target, which is about securing personal information, has a high degree (2.660) compared to the other targets. This component supports the core objective of the proposed model, which is to protect personal data in e-government.
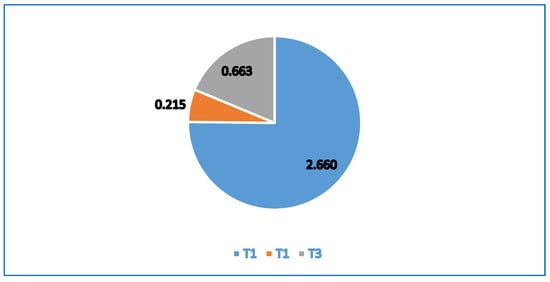
Figure 8.
Scales of Second Level (Targets).
Figure 9 illustrates that aspirations and results have lower values than strength and opportunity factors. As it is obvious, all strength elements have varying degrees of relation to securing personal information. Additionally, the stage model gives the government more chances to take steps in the direction of building a secure infrastructure for its e-services while respecting essential targets.
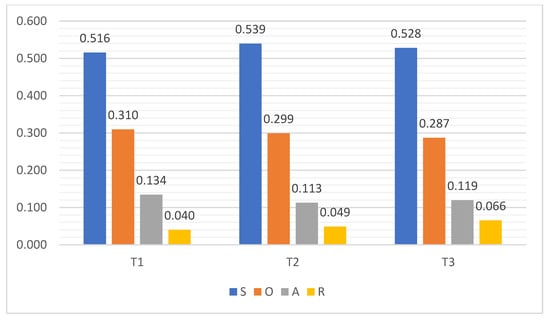
Figure 9.
The Weight of SOAR Factors, with Respect to the Three Targets.
It can also be seen that the results of the third target are higher compared to the other two targets, which means that the model will provide reliable communication between the government and its stakeholders. It can also be seen that aspiration factors that will be able to be used are important in the proposed e-government stage model, with respect to the entire targets. On the other hand, the aspiration factors have a steady value in all targets of the proposed model, which leads to more transparency and citizen-centric vision in the e-government. As a result, the total outcome in this figure demonstrates the viability of implementing the suggested stage model.
In Figure 10, the priority of factors within the SOAR groups can be seen. Each group has four factors. The figure shows that the first factor of strength, which is related to protecting personal information in one-way communication, will have a high priority in the strength factors. Logically, this is important because it is the first way that personal information is transferred to the government storages. The proposed stage model will have a high priority to the second factor of the Opportunity group that is about developing a secure information infrastructure. On the other hand, it is clear that a secured information infrastructure with secured communication leads to a successful e-government obtaining its goals. Transparency is one of the main achievements in an e-government. Hence, the proposed model will have a high priority to transparency in its aspirations. The third factor value of the result group is (0.204), which is the highest value among the result factors. This states that the implementation of the model will achieve trust in e-government services by its stakeholders.
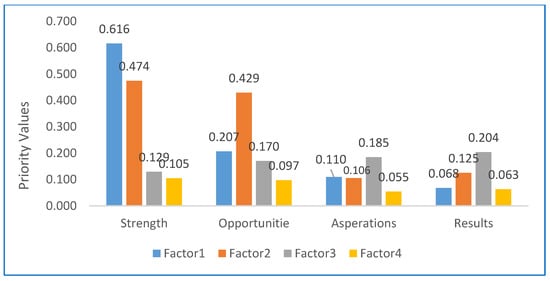
Figure 10.
Priority of Factors within the SOAR Groups.
In AHP, the technique consistency ratio must be less than (10%). Figure 11 shows the Consistency Ratio of the SOAR groups. The CR of the SOAR factors have the lowest values, which means, that the proposed model has a great chance for implementing successfully in the developing countries.
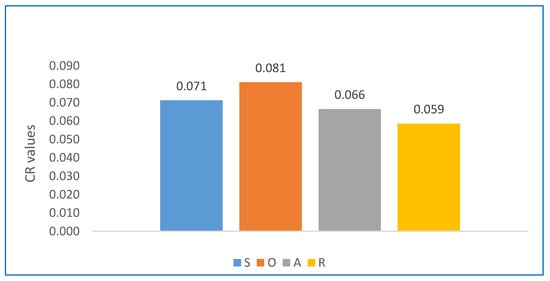
Figure 11.
Consistency Ratio of SOAR Groups.
In the end, this study found that the outcomes of combining SOAR and AHP decision support were acceptable for adoption. Making pairwise comparisons gives the decision-maker the ability to consider the relative importance of the criteria or elements and analyze the situation more precisely and intensely.
5. Conclusions
In order for governments to provide their stakeholders with improved services, electronic government is becoming a must rather than an option. In order for an e-government to succeed, along with the government’s goals, citizens must be at the center of the system. Therefore, it is important to protect their personal information. To determine the priority variables and to focus on the most crucial aspects of e-government, this paper used the SOAR analysis method. The SOAR group took into account a variety of elements, some of which are concrete and others not. Thus, it would be quite challenging to assess people’s satisfaction levels. In order to give a quantitative assessment of the impact of each aspect of decision making, the AHP approach has been applied. The assessment showed that the proposed model contains good qualities and important components that could help with model implementation. Based on the conditions in developing countries, the evaluation technique used three essential target criteria, including improving the security of personal information, achieving trust in e-government services, and providing a reliable communication between the government and its stakeholders. Based on the main goal of the study, which is about assessing the proposed model and considering these targets, SOAR group factors were created and investigated.
Author Contributions
Validation, M.H. and H.M.; Formal analysis, H.M. and H.M; Methodology, M.H. and H.M; writing—original draft, M.H. and H.M.; Writing—review & editing, M.H. and H.M. All authors have read and agreed to the published version of the manuscript.
Funding
The work was not created with the support of the project.
Institutional Review Board Statement
No humans or animals samples were involved in the processing of this article.
Informed Consent Statement
Not applicable.
Data Availability Statement
Not applicable.
Conflicts of Interest
The authors declare no conflict of interest.
References
- Choi, J.P.; Jeon, D.-S.; Kim, B.-C. Privacy and Personal Data Collection with Information Externalities. J. Public Econ. 2019, 173, 113–124. [Google Scholar] [CrossRef]
- Hiller, J.S.; Bélanger, F. Privacy Strategies for Electronic Government. E-Gov. 2001, 200, 162–198. [Google Scholar]
- Wescott, C.G. E-Government in the Asia-Pacific Region: Progress and Challenges. Syst. Cybern. Inform. 2004, 3, 37–42. [Google Scholar]
- Hernández-Moreno, S.; de Hoyos-Martínez, J. Indicators of Urban Sustainability in Mexico. Theor. Empir. Res. Urban Manag. 2010, 5, 46–60. [Google Scholar]
- Kumar, P.; Kumar, R.; Kumar, A.; Franklin, A.; Jolfaei, A. Blockchain and Deep Learning Empowered Secure Data Sharing Framework for Softwarized UAVs. In Proceedings of the 2022 IEEE International Conference on Communications Workshops (ICC Workshops), Seoul, Republic of Korea, 16–20 May 2022; pp. 770–775. [Google Scholar]
- Cole, M.L.; Cox, J.D.; Stavros, J.M. Building Collaboration in Teams through Emotional Intelligence: Mediation by SOAR (strengths, Opportunities, Aspirations, and Results). J. Manag. Organ. 2019, 25, 263–283. [Google Scholar] [CrossRef]
- Shareef, S.M. Electronic Government Adoption Based on Citizen-Centric Approach in Regional Government in Developing Countries: The Case of Kurdistan Region of Iraq (KRI). Ph.D. Thesis, University of East London, London, UK, 2012. [Google Scholar]
- Muhammad, H.; Hromada, M. Proposing an E-Government Stage Model in Terms of Personal Information Security in Developing Countries. In Proceedings of the 2022 IEEE International Carnahan Conference on Security Technology (ICCST), Valeču Hrotovic, Czech Republic, 7–9 September 2022; pp. 1–5. [Google Scholar]
- Al-Dabbagh, M. Electronic Government in Iraq: Challenges of Development and Implementation; Swedish Business School at Örebro University: Örebro, Sweden, 2011. [Google Scholar]
- Wu, Y. Protecting Personal Data in E-Government: A Cross-Country Study. Gov. Inf. Q. 2014, 31, 150–159. [Google Scholar] [CrossRef]
- Houben, G.; Lenie, K.; Vanhoof, K. A Knowledge-Based SWOT-Analysis System as an Instrument for Strategic Planning in Small and Medium Sized Enterprises. Decis. Support Syst. 1999, 26, 125–135. [Google Scholar] [CrossRef]
- Dewa, M.; Zlotnikova, I. Citizens’ Readiness for E-Government Services in Tanzania. Adv. Comput. Sci. Int. J. 2014, 3, 37–45. [Google Scholar]
- Sutherland, J.; Stavros, J. The Heart of Appreciative Strategy. AI Pract. 2003, 5, 5–9. [Google Scholar]
- Stavros, J. The Generative Nature of SOAR: Applications, Results, and the New SOAR Profile. AI Pract. Int. J. Appreciative Inq. 2013, 15, 6–26. [Google Scholar] [CrossRef]
- Stavros, J.; Cooperrider, D.; Kelley, D.L. Strategic Inquiry Appreciative Intent: Inspiration to SOAR, a New Framework for Strategic Planning. AI Pract. 2003, 11, 1–21. [Google Scholar]
- Saaty, R.W. The Analytic Hierarchy Process—What It Is and How It Is Used. Math. Model. 1987, 9, 161–176. [Google Scholar] [CrossRef]
- Pickton, D.W.; Wright, S. What’s Swot in Strategic Analysis? Strateg. Chang. 1998, 7, 101–109. [Google Scholar] [CrossRef]
- Stavros, J.M.; Cole, M.L. SOARing towards Positive Transformation and Change. Abac Odi J. Vis. Action Outcome 2013, 1, 10–34. [Google Scholar]
- Karimi, A.; Mehrdadi, N.; Hashemian, S.; Bidhendi, G.; Moghaddam, R.T. Selection of Wastewater Treatment Process Based on the Analytical Hierarchy Process and Fuzzy Analytical Hierarchy Process Methods. Int. J. Environ. Sci. Technol. 2011, 8, 267–280. [Google Scholar] [CrossRef]
- Mu, E.; Pereyra-Rojas, M. Practical Decision Making: An Introduction to the Analytic Hierarchy Process (AHP) Using Super Decisions V2; Springer: Berlin/Heidelberg, Germany, 2016. [Google Scholar]
- Brunelli, M. Introduction to the Analytic Hierarchy Process; Springer: Berlin/Heidelberg, Germany, 2014. [Google Scholar]


Disclaimer/Publisher’s Note: The statements, opinions and data contained in all publications are solely those of the individual author(s) and contributor(s) and not of MDPI and/or the editor(s). MDPI and/or the editor(s) disclaim responsibility for any injury to people or property resulting from any ideas, methods, instructions or products referred to in the content. |
© 2023 by the authors. Licensee MDPI, Basel, Switzerland. This article is an open access article distributed under the terms and conditions of the Creative Commons Attribution (CC BY) license (https://creativecommons.org/licenses/by/4.0/).