Abstract
The semantic segmentation of point clouds has significant applications in fields such as autonomous driving, robot vision, and smart cities. As LiDAR technology continues to develop, point clouds have gradually become the main type of 3D data. However, due to the disordered and scattered nature of point cloud data, it is challenging to effectively segment them semantically. A three-dimensional (3D) shape provides an important means of studying the spatial relationships between different objects and their structures in point clouds. Thus, this paper proposes a semi-supervised semantic segmentation network for point clouds based on 3D shape, which we call SBSNet. This network groups and encodes the geometric information of 3D objects to form shape features. It utilizes an attention mechanism and local information fusion to capture shape context information and calculate the data features. The experimental results showed that the proposed method achieved an overall intersection ratio of 85.3% in the ShapeNet dataset and 90.6% accuracy in the ModelNet40 dataset. Empirically, it showed strong performance on par or even better than state-of-the-art models.
1. Introduction
The 21st century is witnessing rapid development in the field of data science, with artificial intelligence playing a major role in driving innovation across various industries. One of the areas in which AI has made significant advancements is computer vision, which has been widely used in smart driving, smart cities, remote sensing, and robotics. In recent years, with the development of LiDAR technology, research has shifted from two-dimensional (2D) to three-dimensional (3D) vision, which has important applications in areas such as autonomous driving, industrial control, remote sensing, and mapping.
The main forms of 3D data representation include point clouds, voxels, multi-views, and meshes. Among them [1], 3D point clouds, which reflect the surface and structural information of 3D objects better than voxels, multi-views, and meshes, are becoming increasingly popular in the industry. However, the irregular and disorderly nature of point cloud data presents challenges to the application of deep learning methods, which are commonly used for 2D images.
The representation of 3D shape in point cloud data is described by point position, color, normal vector, and other information. By analyzing the 3D shape in the point cloud data, we can understand the geometric shape, surface texture, and surface shape of the object. At the same time, geometric shapes, which reflect the intrinsic connections between local structures in point clouds, play a crucial role in intelligent reasoning and provide important information about the object’s local structures and semantics. Therefore, extracting robust shape features from point clouds is a crucial step in the analysis of point cloud data. Despite the advances made in this field, this challenge has yet to be addressed.
To address the challenges of processing 3D point cloud data, Qi et al. [2] proposed the PointNet network, which directly processed a point cloud using deep learning and achieved good results. However, this network considered only the global features of the point cloud, ignoring local features. Subsequently, Qi et al. [3] developed PointNet++, which added local information but still ignored local shape information between points. Huang et al. [4] attempted to solve this issue using convolutional neural networks (CNN) to learn 3D shapes and generate local descriptors. However, the results were not sufficiently comprehensive because they relied on projections to obtain local surface information.
To overcome these limitations, we propose a semi-supervised semantic segmentation network for point clouds based on 3D shape, which we call SBSNet. The network encodes the shape of the extracted point cloud from multiple pieces of geometric information and constructs the shape context information through an attention mechanism to improve the 3D point cloud data feature calculation, capture the significant features of the data, and enhance the feature difference degree of the boundary points. The key contributions of our work are as follows:
(1) The proposed network extracts multiple pieces of geometric information from point cloud data, such as density, normal vectors, and other geometric features that can reflect point cloud texture information, uses unsupervised methods to zone the point cloud’s geometric shape information, and finally encodes the shape information using neural networks.
(2) We introduce an improved furthest point sampling algorithm based on geometric curvature combined with spherical queries to create multiple subsets of local point cloud data, partition the data into regions, and build a high-dimensional feature extractor for the local data subsets.
(3) The attention mechanism is designed to capture the contextual information of the point cloud shape features, amplify the significance of the extracted local features, and finally improve the accuracy of point cloud segmentation.
(4) SBSNet was experimentally compared with several networks, such as PointNet, PointNet++, and 3P-RNN. The average mean intersection over union (MIoU) of the SBSNet network was 85.3% in the ShapeNet dataset and 90.6% in the ModelNet40 dataset, surpassing that of existing mainstream point cloud semantic segmentation networks.
2. Related Work
As 3D data acquisition technology continues to advance and becomes more affordable, 3D computer vision shows considerable potential. Specifically, 3D point cloud semantic segmentation has found several important applications in areas such as automatic driving, industrial control, and remote sensing mapping. The increasing popularity of deep learning has led to a surge in point cloud semantic segmentation methods, which can be classified as voxelization-based, projection-based, and point representation–based.
2.1. Semantic Segmentation Methods Based on Voxelization
Due to the irregularity of point cloud data, early point cloud processing methods typically relied on voxelization techniques. For example, Huang et al. [5] employed a 3D CNN to perform the semantic segmentation of voxelated point cloud data. To enhance segmentation accuracy, Meng et al. [6] used a radial basis function (RBF)-based variational autoencoder (VAE) network to encode local geometric structures within each voxel. The Voxel R-CNN [7] method applies a voxel aggregation module to directly extract 3D features from voxel features. However, voxelization can reduce data accuracy, thus affecting the segmentation results. Moreover, the low-resolution nature of voxel structures and data loss incurred by voxelization hinder the attainment of high semantic segmentation accuracy, thereby rendering it unsuitable for fine-grained semantic segmentation networks.
2.2. Multi-View-Based Semantic Segmentation Approaches
Lawin et al. [8] employed a multi-view projection approach to perform semantic segmentation by inputting multi-view projections into an FCN to compute semantic labels through synthesized evaluation scores. Tatarchenko et al. [9] established a tangent plane for local point cloud regions and performed tangent plane projection to achieve semantic segmentation by convolving data from multiple projection surfaces. Wu et al. [10] proposed a segmentation method based on spherical projection. SalsaNext [11] improved SalsaNet [12] by introducing various enhanced modules, such as hole convolution and pixel-shuffle layers [13], as well as a point-by-point uncertainty-aware mechanism. However, projection-based methods rely heavily on the selected projection surface and are less effective at capturing inter-component data feature variations for fine-grained semantic segmentation.
2.3. Point Representation-Based Methods
Qi et al. [2] proposed PointNet, the first model that could directly process unorganized point cloud data, generating global feature descriptors through a multilayer perceptron (MLP) to achieve semantic segmentation. Subsequently, they proposed PointNet++ [3], which improved the local feature representation of data and greatly enhanced the semantic segmentation effect. Jiang et al. [14] developed the EdgeConv operation to capture local geometric information while ensuring displacement invariance, thus improving the correlation features between points by introducing edge data. PointCNN [15] aggregates spatial structure and local feature information on points using X-Conv but does not achieve point cloud replacement invariance. Thomas et al. [16] used a series of local 3D convolutional kernels to construct kernel points that learned local geometric features by weighting the features based on the Euclidean distance from points to kernel points.
Moreover, multiscale and shape features of point cloud data have been introduced into semantic segmentation networks to improve their spatial information representation capabilities. For example, Ye et al. [4] used point-by-point pyramidal pooling to capture local multiscale context information on point clouds in order to improve the semantic segmentation effect. Keisuke et al. [17] proposed a semantic segmentation network that captures fine-grained information on multiscale point cloud contexts using an attention mechanism. Liu et al. [18] used point cloud shape context information to construct an end-to-end point cloud model in order to capture aggregated point cloud features and achieve semantic segmentation. ShellNet [19] uses spherical convolution for feature extraction and filtering, which can effectively retain local structural information and geometric features of point cloud data and has high feature representation accuracy.
In this paper, we propose the SBSNet network for semantic segmentation based on point representation. Our approach extracts various pieces of geometric information from a point cloud, such as curvature and density, to encode shape features. We use an attention mechanism to fuse these features with point cloud features, enabling the network to learn and capture point cloud shape contextual information. By highlighting salient local features of point cloud data, our method improves object boundary recognition and produces promising semantic segmentation results.
3. Method
Point cloud data collected by LiDAR typically contain spatial coordinates, color, and reflection intensity. Although the properties may vary slightly between acquisition devices, the spatial coordinate property is always complete and essential for segmentation. The point cloud data to be segmented can be represented as P = {pi|pi = {x, y, z}}, where pi represents a point in 3D space with x, y, and z coordinates. Based on the inherent characteristics of the point cloud data, we can extract their shape feature set . An unsupervised machine learning method and a neural network with shared parameters can encode the inputted point cloud data to generate the point cloud feature set F1. By grouping the original point cloud P and performing PointNet feature learning, we can obtain the feature set F2. Finally, by applying an attention mechanism to F1 and F2 for feature learning, we can produce the set C = {Ci|Ci = {x, y, z, c}}, which contains the category information. Figure 1 illustrates the overall network.
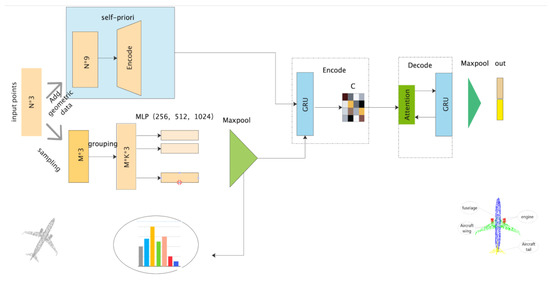
Figure 1.
Overall network diagram.
3.1. Self-Priori Feature Map
A 3D shape refers to the shape and texture information of a 3D object, which is a crucial feature of a point cloud since it describes the object’s shape and geometric relationships in 3D space. It reflects the object’s shape, size, position, and relationship with surrounding objects. To better describe 3D objects, the proposed network constructs the shape information geometry S. For the inputted point cloud P, the density of each point is represented by calculating the distance to the nearest neighboring points as:
The normal vector of the point cloud is estimated using principal component analysis (PCA). A plane is estimated in the neighborhood of each point and fitted using least squares, and the normal vector of the point cloud is calculated within n. The curvature of the point cloud k is then determined using the normal vector, and the set is finally formed.
3.1.1. Grouping Using Shape Information
Based on the point cloud’s rich shape information and the fact that different objects have different shape information that plays different roles in describing their features, constructing the object’s shape information and accurately learning its features are particularly challenging. To address this challenge, the proposed network employs a self-supervised method for point cloud grouping using shape information. This method involves randomly sampling the shape feature set S and selecting k points as centroids to form the centroid set M = {m1, m2, …, mk}. The distance between each point Si in the point cloud data S and each centroid mk is then calculated as:
The point cloud data are then assigned to the nearest centroid mi, and the position of each regional center is updated based on the mean value of the point cloud data assigned to each centroid as:
This process is repeated until the regional centers no longer move and the final point cloud grouping G is formed.
3.1.2. Encoder
In CNN, weight updates do not achieve parameter sharing while gradient updates in backpropagation can only be performed on isolated points, resulting in a loss of feature connection between points. To address this, we employed an MLP operation with parameter sharing for each point in gi ∈ G, preventing weight updates from relying on individual points and allowing them instead to learn the relationship of the surrounding points to better capture the point cloud data for grouping. This is calculated as:
where f denotes a neural network with shared parameters and Max denotes the maximum pooling.
3.2. Feature Fusion
To better learn the local features of the inputted point cloud, SBSNet is designed with geometric curvature to improve the furthest point sampling. The original furthest point sampling, though uniform, does not effectively capture the geometric relationships between points. While sampling the furthest points, the curvature of neighboring points is calculated by normal vectors to construct a normal curvature distribution. From the normal distribution, it is known that (μ − 2σ, μ + 2σ) contains points with very similar curvatures. To ensure different grouping results and comprehensive grouping, the points with curvature distribution in the interval (−∞, μ − 2σ) ∪ (μ + 2σ, +∞) are selected to add geometric information and finally form a set H = H1 ∩ H2.
Formula (1) is used to sample the farthest point of the input point cloud, where max represents the maximum Euclidean distance between two points. Formula (2) calculates the curvature k of the input point cloud, where n represents the normal vector of the point cloud. Formula (3) is used to establish a normal distribution of the curvature of the point cloud, where μ represents the mean value of the curvature and σ represents the standard deviation of the curvature. Formula (4) is used to select the curvature at (−∞, μ − 2σ) ∪ (μ + 2σ, +∞), the point of this interval.
The point cloud data of the 3D object are region-segmented using a ball query to obtain m regions, forming a set Ai, which extracts the point cloud features of each region using a parameter-sharing MLP to capture the local structure of the point cloud data, and generating a feature set F2 as:
where f denotes the neural network with shared parameters and Max denotes the maximum pooling.
Attention mechanisms are widely used in deep learning and are highly effective in improving the performance of various tasks. By assigning a weight to each inputted feature, attention mechanisms help the model focus on the most relevant information while ignoring irrelevant information. The weighted features are then combined to produce a more informative representation.
The proposed network uses an attention mechanism to merge the features of F1 and F2. F1 is used as the query key Q and F2 is used as the key value K to calculate the weight coefficients of the value V as:
where F is the dot product operation.
The softmax function is used to transform the attention scores into a probability distribution in which the sum of all weight coefficients is 1. This normalization allows each weight to represent the importance of its corresponding element in the inputted feature set. Additionally, the properties of the softmax function can be used to emphasize the importance of highly weighted elements while downplaying the importance of elements with low weights. This is calculated as:
The results of multiplying the values and the corresponding weights are then summed to produce the attention value as:
4. Results
4.1. Experimental Data and Parameter Settings
In this work, the ModelNet40 dataset was used for classification and the ShapeNet dataset was used for part segmentation. ModelNet40 consists of 40 categories with a total of 12,311 models, 9843 of which were used for training and 2468 were used for testing. ShapeNet contains 16,881 3D point cloud models in 16 categories, with each model containing two to five components. The hardware used in this experimental work was Intel E5-2683v3 (28 cores, 2.0 GHz), 128 GB of DDR4 ECC, and NVIDIA GeForce RTX 3090. The software environment consisted of Python 3.7 and PyTorch 1.0 or higher. The Adam optimizer was used with an initial learning rate of 0.001.
4.2. Experimental Results and Analysis
4.2.1. Classification Experiment
To verify the effectiveness of the proposed classification model, the same evaluation criteria and metrics as those for other algorithms were adopted, including mean class accuracy (MAcc) and overall accuracy (OA). MAcc is useful for evaluating classification models, especially when the dataset is imbalanced and the classes have different sizes. It provides a more comprehensive evaluation of a model’s performance by taking into account the accuracy of each class rather than only the overall accuracy. It is calculated using Equations (13) and (14). OA evaluates the performance of a classification model by calculating the percentage of correctly classified instances over the total number of instances in the dataset. It is calculated using Equation (15).
In Equations (13) and (14), represents the number of correctly classified samples in the ith category, represents the number of samples in the ith category, represents the quasi-curvature of the ith category, and represents the number of classified categories.
In Equation (15), TP denotes the number of true positive predictions, TN denotes the number of true negative predictions, FP denotes the number of false positive predictions, and FN denotes the number of false negative predictions.
The proposed model was compared with several recent deep learning-based point cloud classification methods, including PointNet, PointNet++, 3D-GCN, DGCNN, PointCNN, MANet, GCN3D, and DTNet. The comparison results are presented in Table 1.

Table 1.
Classification accuracy of different methods using the ModelNet40 dataset.
As shown in Table 1, the proposed method achieved 90.6% MAcc and 93.1% OA in the ModelNet40 dataset. Its OA was higher than that of several deep learning-based methods, including 3D-GCN (by 1%), MANet (by 0.6%), GCN3D (by 0.1%), and DTNet (by 0.2%). It was also significantly higher than that of the classical PointNet (by 3.9%) and PointNet++ algorithms (by 2.4%).
This paper also compared the time needed to train an epoch with various methods on the ModelNet40 dataset. In order to ensure the fairness of the experiment, the methods involved in the comparison adopted the same settings—the training period was 300, the batch size was 10, the initial learning rate was 0.1, the momentum coefficient was 0.9, and the interval used to adjust the learning rate had a step size of 50 and the gamma was set to 0.3, as shown in Table 2. Our method consumed more time, but it was not much different from other mainstream methods. Although it took longer, our method had higher accuracy.
Table 2.
Performance comparison of different network models on ModelNet40 dataset.
4.2.2. Part Segmentation Experiment
In this work, we adopted the same judging rules as those for other algorithms to calculate the MIoU and the intersection over union (IoU) for each object class. The IoU is a commonly used evaluation metric in computer vision, particularly in object detection and image segmentation tasks. It is the ratio of the intersection of the true label and the predicted value of the class, which is calculated using Equation (16). The MIoU is the average intersection-to-combination ratio of each class, which is calculated using Equation (17).
In Equations (16) and (17), represents the number of categories.
The proposed method was compared with recent deep learning-based point cloud classification methods, including PointNet, PointNet++, DGCNN, SK-Net, SRINet, and Pointseq2seq. Table 3 shows the performance of each method in each category and the MIoU of the tested shapes. Table 4 shows some examples of the SBSNet prediction results, marking the segmentation effect at some boundaries to indicate the correctness of those parts of the segmentation results.
Table 3.
Component segmentation mean intersection over union of different methods using the ShapeNet dataset.( Bold font represents the highest MIoU in this category).
Table 4.
SBSNet segmentation visualization results.
As shown in Table 3, SBSNet had the highest MIoU for the teacup, car, chair, motorcycle, guitar, keyboard, and table categories, with values of 88.5%, 78.9%, 91.9%, 92.6%, 73.5%, 95.5%, 76.9%, and 83.2%, respectively. It can be seen that by introducing shape information coding, our method was more sensitive to shape information and could recognize objects with more complex shapes. In addition, the average MIoU of SBSNet was the highest (85.3%). As shown in Table 4, the results of SBSNet were highly consistent with the basic facts.
4.3. Robustness Experiment
The proposed model’s robustness to different inputted point cloud resolutions and numbers was tested by sampling 512, 1024, 2048, and 2860 points. The results shown in Table 5 indicate that segmentation performance was best with 2048 input points. Segmentation accuracy was slightly decreased when the number of inputted points increased or decreased compared to the optimal number. Table 6 shows the results of chair segmentation with different inputted points, indicating that even a minimum of 256 points could be used to segment parts. The network model effectively extracted point cloud feature information and was robust to point cloud resolution.
Table 5.
SBSNet resolution robustness results.
Table 6.
SBSNet resolution robustness results.
5. Conclusions
In this paper, we present SBSNet, a network model designed for 3D point cloud classification and semantic segmentation tasks. SBSNet uses multiple point cloud geometric features grouped based on shape information and encoded by neural networks. The shape information is fused using an attention mechanism to capture salient local features that form feature descriptors to achieve semantic segmentation and classification.
To validate the proposed model, we compared it with classical and recent deep learning-based methods using the classification dataset ModelNet40 and the segmentation dataset ShapeNet. In the ModelNet40 dataset, SBSNet had 90.6% MAcc, which was higher by 4.4%, 2.5%, 0.3%, and 0.2% than that of PointNet, PointCNN, GCN3D, and MANet, respectively. Moreover, SBSNet achieved 93.1% OA, which was 2.4%, 0.2%, and 0.2% higher than that of PointNet++, DGCNN, and DTNet, respectively. Furthermore, its overall MIoU in the ShapeNet dataset was higher by 1.6%, 0.2%, 11.8% and 0.1% than that of PointNet, PointNet++, SRINet, and Pointseq2seq, respectively. At the same time, in many categories, SBSNet achieved the highest MIoU. Our experimental results also confirmed the effectiveness of the proposed model, which achieved point cloud data segmentation and classification at a level comparable to that of many state-of-the-art models.
Although SBSNet can effectively capture the relationship between geometric features and significant local features of point cloud data, its training time was slightly longer than other networks according to the training time experiment. However, our method was superior to other networks in both classification and individual experiments. In the future, we will explore better and smaller networks to ensure accuracy and reduce the training time.
Author Contributions
Conceptualization, L.Z.; methodology, L.Z. and K.Z.; software, L.Z.; validation, L.Z. and K.Z.; formal analysis, L.Z.; investigation, L.Z.; resources, K.Z.; data curation, L.Z.; writing—original draft preparation, L.Z.; writing—review and editing, L.Z.; visualization, L.Z.; supervision, K.Z.; project administration, K.Z.; funding acquisition, K.Z. All authors have read and agreed to the published version of the manuscript.
Funding
This research received no external funding.
Institutional Review Board Statement
Not applicable.
Informed Consent Statement
Not applicable.
Data Availability Statement
The ShapeNet Dataset and ModelNet40 Dataset used for this study can be accessed at https://shapenet.org and https://modelnet.cs.princeton.edu.
Conflicts of Interest
The authors declare no conflict of interest.
References
- Zhang, Z. Research on 3D Point Cloud Recognition and Detection Based on Deep Learning; Taiyuan University of Science and Technology: Taiyuan, China, 2020. [Google Scholar]
- Qi, C.R.; Su, H.; Mo, K.; Guibas, L.J. PointNet: Deep Learning on Point Sets for 3D Classification and Segmentation. In Proceedings of the 2017 IEEE Conference on Computer Vision and Pattern Recognition (CVPR), Honolulu, HI, USA, 21–26 July 2017. [Google Scholar]
- Qi, C.R.; Yi, L.; Su, H.; Guibas, L.J. PointNet++: Deep Hierarchical Feature Learning on Point Sets in a Metric Space. In Proceedings of the 31st Annual Conference on Neural Information Processing Systems (NIPS), Long Beach, CA, USA, 4–9 December 2017. [Google Scholar]
- Ye, X.; Li, J.; Huang, H.; Du, L.; Zhang, X. 3D Recurrent Neural Networks with Context Fusion for Point Cloud Semantic Segmentation. In Proceedings of the 15th European Conference, Munich, Germany, 8–14 September 2018. [Google Scholar]
- Jing, H.; You, S. Point Cloud Labeling Using 3D Convolutional Neural Network. In Proceedings of the 23rd International Conference on Pattern Recognition, Cancun, Mexico, 4–8 December 2017. [Google Scholar]
- Meng, H.Y.; Gao, L.; Lai, Y.K.; Manocha, D. VV-net: Voxel VAE Net with Group Convolutions for Point Cloud Segmentation. In Proceedings of the 2019 IEEE/CVF International Conference on Computer Vision (ICCV), Seoul, Republic of Korea, 27 October–2 November 2019. [Google Scholar]
- Deng, J.; Shi, S.; Li, P.; Zhou, W.; Zhang, Y.; Li, H. Voxel R-CNN: Towards High Performance Voxel-based 3D Object Detection. In Proceedings of the AAAI Conference on Artificial Intelligence, Virtual, 2–9 February 2021. [Google Scholar]
- Lawin, F.J.; Danelljan, M.; Tosteberg, P.; Bhat, G.; Khan, F.S.; Felsberg, M. Deep Projective 3D Semantic Segmentation. In Proceedings of the 17th International Conference, CAIP 2017, Ystad, Sweden, 22–24 August 2017. [Google Scholar]
- Tatarchenko, M.; Park, J.; Koltun, V.; Zhou, Q.Y. Tangent Convolutions for Dense Prediction in 3D. In Proceedings of the 2018 IEEE/CVF Conference on Computer Vision and Pattern Recognition (CVPR), Salt Lake City, UT, USA, 18–23 June 2018. [Google Scholar]
- Wu, B.; Zhou, X.; Zhao, S.; Yue, X.; Keutzer, K. SqueezeSegV2: Improved Model Structure and Unsupervised Domain Adaptation for Road-Object Segmentation from a LiDAR Point Cloud. In Proceedings of the IEEE 2019 International Conference on Robotics and Automation (ICRA), Montreal, QC, Canada, 20–24 May 2019. [Google Scholar]
- Cortinhal, T.; Tzelepis, G.; Erdal Aksoy, E. SalsaNext: Fast, Uncertainty-Aware Semantic Segmentation of LiDAR Point Cloud for Autonomous Driving. In Proceedings of the 15th International Symposium, ISVC 2020, San Diego, CA, USA, 5–7 October 2020. [Google Scholar]
- Aksoy, E.E.; Baci, S.; Cavdar, S. SalsaNet: Fast Road and Vehicle Segmentation in LiDAR Point Clouds for Autonomous Driving. In Proceedings of the 2020 IEEE Intelligent Vehicles Symposium (IV), Las Vegas, NV, USA, 19 October–13 November 2020. [Google Scholar]
- Shi, W.; Caballero, J.; Huszar, F.; Totz, J.; Aitken, A.P.; Bishop, R.; Rueckert, D.; Wang, Z. Real-Time Single Image and Video Super-Resolution Using an Efficient Sub-Pixel Convolutional Neural Network. In Proceedings of the the IEEE Conference on Computer Vision and Pattern Recognition (CVPR), Las Vegas, NV, USA, 27–30 June 2016. [Google Scholar]
- Jiang, X.; Ma, X. Dynamic Graph CNN with Attention Module for 3D Hand Pose Estimation. In Advances in Neural Networks–ISNN 2019, Proceedings of the 16th International Symposium on Neural Networks, ISNN 2019, Moscow, Russia, 10–12 July 2019; Springer International Publishing: Cham, Switzerland, 2019. [Google Scholar]
- Li, Y.; Bu, R.; Sun, M.; Wu, W.; Di, X.; Chen, B. PointCNN: Convolution on X-transformed Points. In Proceedings of the 32nd Annual Conference on Neural Information Processing Systems, Montreal, QC, Canada, 3–8 December 2018. [Google Scholar]
- Thomas, H.; Qi, C.R.; Deschaud, J.-E.; Marcotegui, B.; Goulette, F.; Guibas, L.J. KPConv: Flexible and Deformable Convolution for Point Clouds. arXiv 2019, arXiv:1904.08889. [Google Scholar]
- Kawano, K.; Koide, S.; Imamura, C. Seq2seq Fingerprint with Byte-Pair Encoding for Predicting Changes in Protein Stability upon Single Point Mutation. IEEE/ACM Trans. Comput. Biol. Bioinform. 2019, 17, 1762–1772. [Google Scholar] [CrossRef] [PubMed]
- Xie, S.; Liu, S.; Chen, Z.; Tu, Z. Attentional ShapeContextNet for Point Cloud Recognition. In Proceedings of the 2018 IEEE/CVF Conference on Computer Vision and Pattern Recognition, Salt Lake City, UT, USA, 18–23 June 2018. [Google Scholar]
- Hua, B.S.; Yeung, S.K.; Zhang, Z. ShellNet: Efficient Point Cloud Convolutional Neural Networks using Concentric Shells Statistics. In Proceedings of the 2019 IEEE/CVF International Conference on Computer Vision, Seoul, Republic of Korea, 27 October–2 November 2019. [Google Scholar]
- Lin, Z.H.; Huang, S.Y.; Wang, Y.C.F. Convolution in the Cloud: Learning Deformable Kernels in 3d Graph Convolution Networks for Point Cloud Analysis. In Proceedings of the 2020 IEEE/CVF Conference on Computer Vision and Pattern Recognition, Seattle, WA, USA, 13–19 June 2020. [Google Scholar]
- Wu, B.; Liu, Y.; Lang, B.; Huang, L. DGCNN: Disordered graph convolutional neural network based on the Gaussian mixture model. Neurocomputing 2018, 321, 346–356. [Google Scholar] [CrossRef]
- Lan, H.; Chen, H.; Zhang, P. A point cloud classification and segmentation model based on set graph convolution and three-dimensional direction convolution. Point cloud classification and segmentation model based on graph convolution and 3D direction convolution. Comput. Eng. Appl. 2022, 1–27. [Google Scholar]
- Han, X.-F.; Jin, Y.-F.; Cheng, H.-X.; Xiao, G.-Q. Dual Transformer for Point Cloud Analysis. IEEE Trans. Multimedia 2021, 4–27. [Google Scholar] [CrossRef]
- Wang, B.; Huo, Z. Research on 3D Point Cloud Feature Extraction Method Based on MANet. Comput. Eng. Appl. 2022, 1–10. Available online: http://cea.ceaj.org/CN/10.3778/j.issn.1002-8331.2103-0037 (accessed on 1 October 2022).
- Wu, W.; Zhang, Y.; Wang, D.; Lei, Y. SK-Net: Deep Learning on Point Cloud via End-to-End Discovery of Spatial Keypoints. In Proceedings of the 34th AAAI Conference on Artificial Intelligence (AAAI-20), New York, NY, USA, 7–12 February 2020. [Google Scholar]
- Sun, X.; Lian, Z.; Xiao, J. SRINet: Learning Strictly Rotation-Invariant Representations for Point Cloud Classification and Segmentation. In Proceedings of the 27th ACM International Conference on Multimedia, Nice, France, 21–25 October 2019. [Google Scholar]
- Liu, X.; Han, Z.; Liu, Y.-S.; Zwicker, M. Point2sequence: Learning the shape representation of 3d point clouds with an attention-based sequence to sequence network. In Proceedings of the AAAI Conference on Artificial Intelligence, Honolulu, HI, USA, 27 January–1 February 2019; Volume 33, pp. 8778–8785. [Google Scholar] [CrossRef]


Disclaimer/Publisher’s Note: The statements, opinions and data contained in all publications are solely those of the individual author(s) and contributor(s) and not of MDPI and/or the editor(s). MDPI and/or the editor(s) disclaim responsibility for any injury to people or property resulting from any ideas, methods, instructions or products referred to in the content. |
© 2023 by the authors. Licensee MDPI, Basel, Switzerland. This article is an open access article distributed under the terms and conditions of the Creative Commons Attribution (CC BY) license (https://creativecommons.org/licenses/by/4.0/).