Abstract
This study presents a computational ghost imaging (GI) scheme that utilizes sequenced random speckle pattern illumination. The primary objective is to develop a speckle pattern/sequence that improves computational time without compromising image quality. To achieve this, we modulate the sequence of speckle sizes and design experiments based on three sequence rules for ordering the random speckle patterns. Through theoretical analysis and experimental validation, we demonstrate that our proposed scheme achieves a significantly better contrast-to-noise rate (CNR) compared to traditional GI at a similar resolution. Notably, the sequential GI method outperforms conventional approaches by providing over 10 times faster computational speed in certain speckle composition groups. Furthermore, we identify the corresponding speckle sizes that yield superior image quality, which are found to be geometrically proportional to the reference object area. This innovative approach utilizing sequenced random speckle patterns demonstrates potential suitability for imaging objects with complex or unknown shapes. The findings of this study hold great promise for advancing the field of computational GI and pseudo-thermal GI, addressing the need for improved computational efficiency while maintaining high-quality imaging.
1. Introduction
Ghost imaging (GI) is a nonlocal technique that retrieves object information by correlating two beams. One beam interacts with the object and is detected by a single-pixel detector, while the other beam, which never interacts with the object, is recorded by a spatially-resolved array detector, such as a CCD camera. The pioneering GI experiments utilized quantum-entangled photons generated through spontaneous parametric down-conversion and reconstructed object images through spatial quantum correlations after point-by-point scanning [1]. Subsequently, GI has been demonstrated with thermal [2,3,4,5] and pseudo-thermal light based on random patterns [6,7], allowing for the exploration of GI in the classical domain with intensity correlations. While quantum GI generally exhibits superior image quality, its application is limited by the available wavelength range [8,9,10]. In contrast, GI based on fluctuating intensity speckle patterns offers greater flexibility in terms of wavelength, even extending to the X-ray regime [11,12,13], making it a widely studied and globally recognized method.
Speckle patterns typically refer to the intensity distribution resulting from the mutual interference of a set of beams with random wavefronts. Pseudo-thermal GI (PGI) employs scattering of a coherent laser beam by a rotating ground glass diffuser to generate the speckle patterns [14]. On the other hand, computational GI (CGI) replaces the pseudo-thermal source with a deterministic illuminator. The illuminating light beam is modified using a computer-controlled spatial light modulator (SLM) or digital micromirror device (DMD) [15] before interacting with the object. By predefining speckle patterns with the modulator, GI can be simplified using only a single beam and a single-pixel detector. Recently, speckle fields have been extensively utilized in the study and application of GI, employing both PGI and CGI approaches [16,17,18,19]. Numerous advanced GI schemes with well-designed patterns have been proposed, including phase-shifting sinusoidal patterns [20], Walsh–Hadamard patterns [21], and Gram–Schmidt-processed orthonormal patterns [22]. To further enhance image quality, optimization techniques such as “Russian Dolls ordering” [23], “Zigzag scanning ordering” [24], “Cake-cutting strategy” [25], “Origami Pattern” [26], and “Total variation ascending order” [27] have been developed to optimize speckle pattern selection and sequence, particularly for Hadamard transform patterns. These strategies offer advantages such as reduced ghost image reconstruction time and improved image quality with less iteration.
While it has been demonstrated that well-designed speckle patterns in DMD or SLM-based CGI can enhance image quality and reduce reconstruction time, this approach relies heavily on expensive electronics and beam-shaping devices. Moreover, the limitations of the SLM or DMD, such as the working wavelength and damage threshold, pose constraints on extending the wavelength range or long-distance sensing in PGI. Additionally, commonly used digital devices introduce quantization errors that result in unnecessary noise. Therefore, classical random speckle patterns generated using a rotating ground glass plate hold great potential for practical applications. Investigating the effect of these classical random speckle patterns on ghost image quality is crucial. Several properties of this scheme have been studied in theory and experimentally, including speckle size modulation [14,16,17,18], Schmidt GI [22], GI via sparsity constraint [28], pseudo-inverse GI [29], Bayesian denoising methods [30], and pink noise speckle patterns [31]. These methods have been shown to significantly improve reconstruction efficiency and image quality; however, they often involve complex and time-consuming manipulations of Hadamard matrices compared to random speckles and are limited to CGI.
In this work, we propose a method to modulate speckle size and step sequences to enhance image quality. We experimentally investigate the influence of different rules for sequenced speckle pattern projection on the contrast-to-noise rate (CNR) of the retrieved ghost images in a DMD-based computational sequenced GI (SGI) system. Furthermore, we perform simulations under ideal conditions to verify the feasibility of this sequenced method. Our results demonstrate that SGI effectively improves image quality and reduces sampling requirements compared to traditional GI (TGI). The SGI approach holds great promise for achieving high-quality GI with flexible wavelength capabilities. Moreover, it can be readily applied to PGI and DMD or SLM-based CGI, providing a versatile solution for various imaging scenarios.
2. Experiment Setup and Measurement Principle
2.1. Experiment Setup
The experiments were conducted using a DMD-based computational ghost imaging (CGI) setup, specifically the Vialux™ DLP V- module V4100 board. The setup consisted of a 0.7-inch diagonal array comprising 1024 × 768 micromirror elements with a pitch of 13.6 μm, as illustrated in Figure 1. The diameter of a He–Ne laser beam was expanded using a beam expander and directed onto the DMD surface. The sequenced speckle patterns were then projected onto the object using the DMD, which had a refresh rate of 40 Hz. The programmed series of sequenced speckle patterns on the DMD approximated the light field’s intensity distribution on the object plane. Each random speckle pattern provided a unique configuration of image intensities. In the experiment, a set of 1024 × 768 digitally microscanned patterns was sequentially displayed on the DMD. These sequenced random speckle patterns passed through the object being imaged, which was positioned at a distance of 0.5 m from the DMD. The transmitted intensity signals were detected using a photodiode acting as a bucket detector (Thorlabs, PDA36A-EC). The system could be easily controlled and triggered using a data acquisition card. A computer was employed to generate the sequenced speckle patterns, control their exhibition, record the light intensity data from the data acquisition card, and reconstruct the image. The retrieved ghost image was reconstructed by correlating the intensity signals with the sequenced random speckle patterns. To underscore the feasibility and performance of sequential ghost imaging (SGI), we fabricated a laser-cut window-shaped transmitting object. Importantly, the window structure employed in our experimental setup simultaneously captured different target sizes. The depicted cross in the figure symbolizes detailed target information, while the four rectangles exemplify the imaging quality for relatively larger targets. This selection of targets serves to highlight the robustness of our sequential speckle method. The actual object profile is presented in Figure 1.
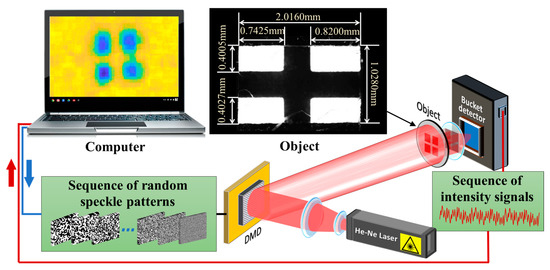
Figure 1.
Conceptual diagram of the computational SGI system. A He–Ne laser illuminates a high-speed DMD, on which rapidly-changing sequenced random speckle patterns are displayed. A bucket detector synchronized with the DMD acquires and transfers the measured data to a computer for image reconstruction.
2.2. Measurement Principle
In SGI, a DMD is used to sequentially project N different illuminations of random speckle patterns, S1(x,y), S2(x,y), …, Sn(x,y), onto the object O(x,y). The corresponding sequence of intensity signals, I1(p), I2(p), …, In(p), is recorded by the bucket detector. The intensity signal IN for the nth speckle pattern can be calculated as follows:
The object image can be reconstructed using common correlation reconstruction algorithms [1,2,3,32,33].
Here, the ghost image G(x,y) depends on the designed intensity distribution Sn(x,y) of sequenced random speckle patterns and the intensity signals IN. In each experiment and simulation, we used a total of 9000 patterns.
To quantitatively evaluate the retrieved ghost image quality, we employ the contrast-to-noise ratio (CNR) and resolution. The CNR is commonly calculated by comparing the object signal strength to the background signal strength and normalizing it to the image noise [18,19]. This measure helps distinguish object signals from background noise.
Since there is a trade-off between CNR and resolution, we estimate the resolution of the retrieved ghost image using a method originally proposed by P. Sandra et al. [34]. The principle of resolution estimation is depicted in Figure 2. An area of the retrieved ghost image is selected such that it is equally covered by the signal and background. By fitting the measured line-out in Figure 2 with a Gaussian curve and determining the fitting parameters ω1, ω2, and Δt, the resolution R can be calculated using Equation (3).
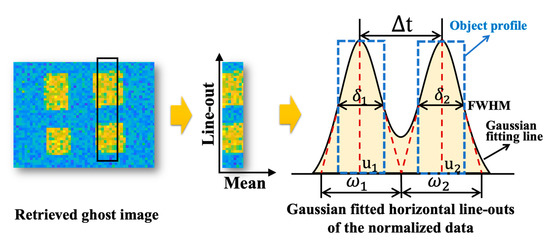
Figure 2.
Resolution measurement of an image. Gaussian fitting is performed on all line-outs due to the presence of noise. The resolution of two peaks is defined as the separation of their average peak width at the base. Δt represents the distance between two peaks, and ω1 and ω2 denote the widths of the peaks, respectively. The full width at half maximum (FWHM) of the double Gaussian curve is calculated using 𝛿1 and 𝛿2. The center point position of the Gaussian curve is determined by Δt.
Based on the findings from previous pseudo-thermal ghost imaging experiments [19], we have confirmed a significant degradation in the quality of ghost images as the speckle size increases. However, it is observed that with larger speckle sizes, the speed of image appearance during reconstruction also increases. Considering this trade-off scenario, we introduce a novel approach called sequential ghost imaging (SGI) as a solution.
To investigate the relationship and patterns of sequenced random speckle patterns in SGI, we divided them into three distinct groups based on different ordering methods. These groups were created by arranging speckles of varying sizes to form multiple sequence combinations, as illustrated in Figure 3 and Figure 4. The three ordering rules were named Different Step (DS), Different Directions (DD), and Different Group (DG) for easy understanding and differentiation. In DS, speckle sequences were designed with increasing sizes, incrementing in different steps. Specifically, DS-1 to DS-5 featured speckles ranging from 27 µm to 540 µm with average step sizes of 26.68 µm, 54.39 µm, 108 µm, 256 µm, and 513 µm, respectively. The average step sizes were calculated to account for practical limitations while maintaining the increment of speckle size. In DD, we examined two sets of speckle sequences: one with increasing speckle sizes (DD-1) and another with decreasing speckle sizes (DD-2). These sequences were compared to DS-3 and DS-4, respectively, which followed a stepwise decrease in speckle sizes within the same range as DS-1 and DS-2. For DG, we explored different speckle composition groups, as shown in Figure 4. Eight groups were devised with varying speckle patterns for ghost imaging. DG-1 to DG-4 comprised four speckle patterns each, while DG-5 and DG-6 contained six speckle patterns per group. The final two groups, DG-7 and DG-8, expanded to eight speckle patterns. Notably, considering the speckle size steps, we compared the mean speckle size steps of the speckle composition groups: 13.24 µm for DG-1, DG-5, and DG-7, and 25.40 µm for DG-2, DG-6, and DG-8.
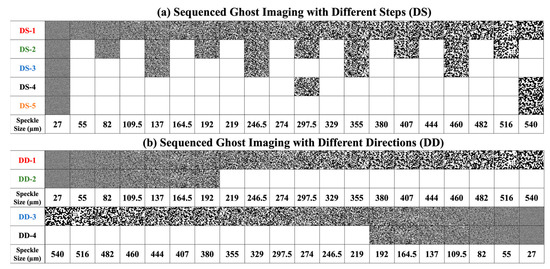
Figure 3.
Ordering principle of sequenced random speckle patterns with different speckle size steps and directions. (a) Ordering with different speckle size steps (first rule, DS: Different Step. DS represents speckle sequences with different increases in speckle size). (b) Comparison of different speckle sorting directions with fixed speckle size steps (second rule, DD: Different Directions. DD represents two sets of speckle sequences in which speckle size increases and decreases, respectively).
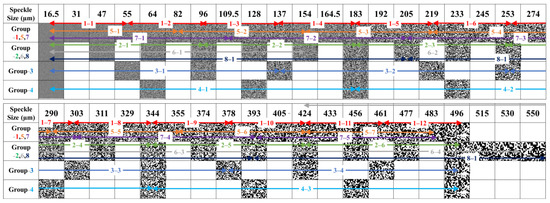
Figure 4.
Ordering principle of sequenced random speckle patterns with different speckle composition groups (rule three). Each group is denoted by DG followed by the group number and the pattern indices within the group. For example, DG-1-1 to −12 represents Group 1 with patterns 1 to 12. DG-2-1 to −6 represents Group 2 with patterns 1 to 6, and so on. DG represents a combination of speckle sequences with multiple speckle sizes.
Across all groups, the speckle size range for DG-1, DG-3, DG-4, DG-5, and DG-7 was 16.5 µm to 496 µm. In contrast, DG-2, DG-6, and DG-8 encompassed a speckle size range of 16.5 µm to 550 µm. It is important to note that the first and last speckles in each group overlapped with the previous and subsequent groups, respectively. In the upcoming experiments, we will assess the CNR and resolution of these sequence rules, aiming to evaluate their performance.
3. Experiments and Simulation Results
In order to assess the effectiveness of speckle fields in three groups (DS, DD, DG) for image reconstruction, we conducted experiments and simulations using a window-shaped object. We evaluated the image quality based on the contrast-to-noise ratio (CNR) and resolution, which are significant measures for assessing image reconstruction. Initially, we compared our novel approach to the traditional TGI method, which relied on fixed speckle sizes ranging from 27 µm to 516 µm. Our results confirmed that increasing the speckle size up to the maximum value resulted in an increase in CNR, with a maximum CNR of 1.8634 obtained at a speckle size of 164.5 µm in Figure 5. However, we observed a drop in visibility in the retrieved ghost images when the speckle size exceeded 297.5 µm, even though the CNR remained constant. This phenomenon was evident from the blurred object boundaries in the retrieved ghost images, which was attributed to higher noise levels between intensity peaks compared to the background noise. To assess imaging quality in such cases, we employed resolution as a tool, and the best resolution of 1.16 was obtained with the smallest speckle size of 27 µm in Figure 5. While the TGI demonstrated good CNR, the corresponding resolution was lower (R = 1.10). Overall, our experimental results were consistent with existing theories [18,19], enabling subsequent comparisons with the SGI method.
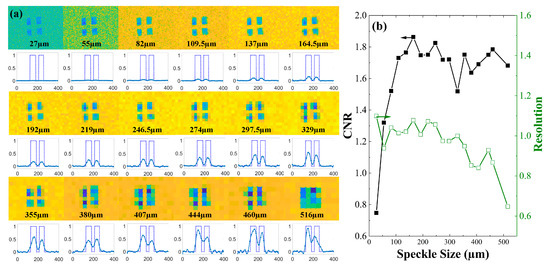
Figure 5.
Retrieved CNR and resolution vs. speckle patterns obtained for TGI experiments. (a) Shows the retrieved ghost images and corresponding resolution. (b) Shows the retrieved CNR of the window-shaped object increased with higher speckle size, and the resolution was worse with higher speckle size.
According to the first rule of the SGI with different steps, we present the results for the five DS groups (DS-1 to DS-5) in the experiments shown in Figure 6. As the mean step size for speckles increased from 26.68 µm to 513 µm from DS-1 to DS-5, respectively, the imaging quality significantly decreased. The resolution of the retrieved ghost image for DS-1 and DS-2 was higher compared to the other groups. The imaging performance of the SGI in groups DS-1 to DS-3 also surpassed the best CNR obtained in the TGI. This indicates the superiority of SGI in reconstructing objects of unknown sizes. Notably, the SGI for DS-1 with a mean speckle size step of 26.68 µm could reconstruct the object with a higher CNR than the TGI, while maintaining a similar resolution. To validate our findings, we simulated the observed behavior of the SGI using the same model employed for TGI, as shown in Figure 6. The simulation results closely matched the experimental results, demonstrating that the SGI with different steps yields better images with a reduced number of iterations.
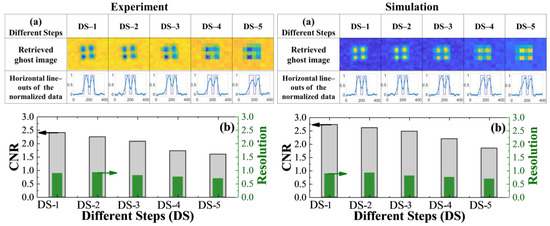
Figure 6.
Retrieved CNR and resolution of the SGI with different steps (DS) in both experiments and simulations. (a) illustrates the retrieved image and resolution of the window-shaped object for the experiment and simulation, respectively. (b) displays the retrieved CNR and resolution of the window-shaped object with different steps in both the experiment and simulation, respectively. The blue dashed lines represent the horizontal line-outs of the normalized data of the retrieved ghost images, while the solid blue curves represent the object.
We apply the second rule of SGI, which involves speckle sorting directions, to select two speckle size ranges with a mean speckle step size of 26.68 µm. This allows us to compare the SGI in opposite sequence directions. The group comprising DD-1 and DD-3 falls within the speckle size range of 27 µm to 540 µm, while the group comprising DD-2 and DD-4 falls within the speckle size range of 27 µm to 192 µm. As shown in Figure 7b, the experimental results indicate that the CNR and resolution for the DD-1 and DD-3 groups are comparable to those of the DD-2 and DD-4 groups. The visibility of the retrieved ghost images and the horizontal line-outs of the normalized data also exhibit similar characteristics when visually inspected in Figure 7a. The numerical results related to the experiment and simulation data are presented in Figure 7b, along with the corresponding retrieved ghost images.
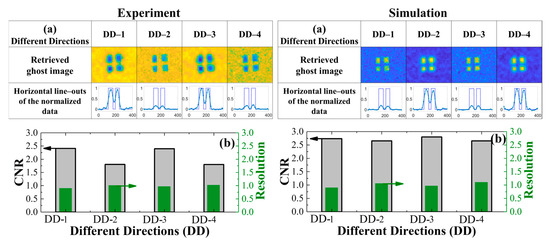
Figure 7.
Retrieved CNR and resolution of the SGI with different speckle sorting directions (DD) in both experiment and simulation. (a) presents the retrieved image and resolution of the window-shaped object for the experiment and simulation, respectively. (b) demonstrates the retrieved CNR and resolution of the window-shaped object with different speckle sorting directions in both experiment and simulation, respectively.. The blue dashed lines depict the horizontal line-outs of the normalized data from the retrieved ghost images, while the solid blue curves represent the object.
To verify the universality of the proposed method, we also compare the CNR and resolution of the SGI with different speckle composition groups, as per the third rule. The third rule of the SGI consists of eight groups, and we conducted experiments and simulations to compare the CNR and resolution with the TGI, as shown in Figure 8. To ensure a fair comparison of the ghost image quality between the SGI and TGI under the same conditions, we evaluated the CNR of the retrieved ghost images, aiming for a resolution close to that of the TGI for the best CNR. The TGI achieved a highest CNR of 1.8873 with a speckle size of 164.5 µm, corresponding to a resolution of approximately 1.10. Therefore, we mainly present the data with a resolution above 1.0 and their corresponding CNR in Figure 8.
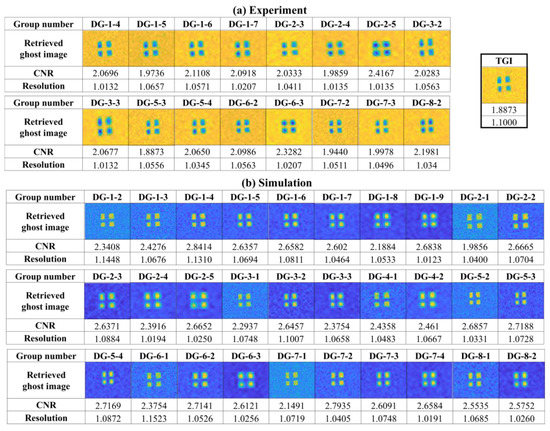
Figure 8.
Evolution of the retrieved CNR and resolution of the SGI with different speckle composition groups (DG). (a) Experimental Results: the figure shows the evolution of the retrieved CNR and resolution for the SGI using different speckle composition groups (DG). For DG-1 and DG-2 groups, the best CNR values close to the TGI resolution are observed in DG-1-4, -5, -6, -7 and DG-2-3, -4, -5. In DG-3 and DG-4 groups, the group DG-3-2, -3 exhibits high-quality retrieved images. Similarly, for DG-5 and DG-6 groups, DG-5-3, -4 and DG-6-2, -3 demonstrate higher CNR values and improved resolution. In DG-7 and DG-8 groups, the high-quality reconstructed images can be found in DG-7-2, -3 and DG-8-2. (b) Simulation Results: the simulation results show a similar trend in the correlation between image quality and speckle size as observed in the experimental results.
Figure 8 showcases the experiments and simulations conducted for the DG-1 to DG-8 groups, respectively. For the DG-1, DG-5, and DG-7 groups, the mean speckle size step is 13.24 µm within the speckle size range from 16.5 µm to 496 µm. Each small group in DG-1, DG-5, and DG-7 consists of 4, 6, and 8 speckle patterns, respectively. In Figure 8, the group DG-1-5 exhibits the best CNR and a resolution close to that of the TGI within the DG-1 group. Similarly, for the DG-5 and DG-7 groups, the best CNR close to the TGI resolution can be found in the groups DG-5-3, -4 and DG-7-2, -3, respectively. Regarding the DG-2, DG-6, and DG-8 groups, the mean speckle size step is 25.40 µm within the speckle size range from 16.5 µm to 550 µm. We only consider resolutions higher than 1.0 in this case. The group DG-2-5 shows the best CNR but with a lower resolution. Generally, the group DG-6-2 exhibits higher CNR and better resolution, followed by the group DG-2-2, -3, and DG-8-1, -2. Lastly, for groups 1 to 4, with the same speckle size steps of 13.24 µm within the speckle size range from 16.5 µm to 496 µm, the best CNR close to the TGI resolution can be found only in the group DG-1-5, -6 and DG-2-2, -3 for the DG-1 and DG-2 groups, respectively. For the DG-3 and DG-4 groups, the best CNR close to the TGI resolution can be found only in the group DG-3-2. Although these groups have similar resolutions, DG-1-6 and DG-2-2 demonstrate better performance in terms of ghost image quality. Moreover, when arranging the results by multiplying the values of CNR and resolution in ascending order, DG-2-5 exhibits the highest value of 2.45. Our numerical simulations also indicate that these sequenced speckle pattern groups yield a better CNR with competitive resolution compared to the TGI.
In summary, we observe that better image quality can be achieved using the speckle patterns from the groups DG-1-6, DG-2-3, DG-2-5, DG-3-2, DG-6-2, and DG-6-3 in the SGI. Additionally, when arranging the results by multiplying the values of CNR and resolution in ascending order, DG-2-5 exhibits the highest value of 2.45. This can be calculated using CNR and resolution and verified visually. The best-performing groups can be easily identified from the summary provided in Figure 9. By carefully selecting the speckle sequence, significantly improved imaging quality compared to the TGI can be achieved.
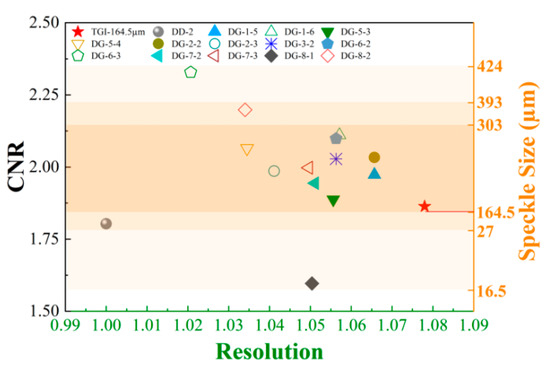
Figure 9.
Speckle size range of SGI groups with higher CNR values and resolutions exceeding 1.0. The range includes the speckle size of the high-quality image in the TGI, which is 164.5 µm.
To further analyze the SGI groups, we summarize the speckle distribution of the typical groups with resolutions close to the TGI, considering a speckle size of 164.5 µm. Since the four small windows of the window-shaped object can be treated as independent small objects, we use the smallest window as a reference. Given the uniform distribution of speckle patterns that can completely cover the object in the experiment, the imaging quality of each small window is very similar. Hence, we consider the smallest window as the reference object. By considering CNR and resolution comprehensively, we find that the speckle distribution of the majority of groups is within the range of 164.5 µm to 303 µm (Figure 10). It appears that the best image quality in the SGI is achieved when the speckle area covers approximately 0.3 to 1 times the reference object area. This provides a reference for further optimizing the imaging quality of the SGI.
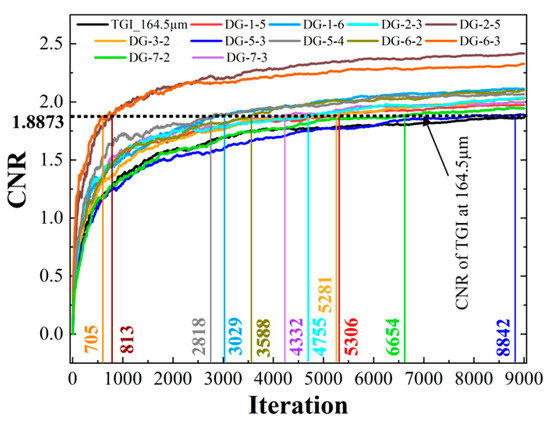
Figure 10.
Evolution of the retrieved CNR with iteration for the SGI and TGI with similar resolutions in the experiment. The dotted line represents the CNR of 1.8873 for the TGI after 9000 iterations, while DG-6-3 and DG-2-5 achieve comparable CNR values with only 705 and 813 iterations, respectively. The required number of iterations is reduced significantly. To provide a clearer representation of the CNRs for different groups, the data between 1.50 and 2.50 are shown.
To verify the advantages of the SGI in reducing the number of necessary iterations, we plot the CNR curves for different iterations for the best groups in the SGI. Typically, a better image quality can be obtained from the object with more iterations, but at the expense of longer imaging time. In order to compare the CNR of the retrieved ghost images more intuitively, we select 11 groups from the SGI with better CNR and resolutions between 1.0 and 1.1. As shown in Figure 10, the CNR significantly improves as the number of iterations increases. For the TGI, after 9000 iterations, the CNR at the speckle size of 164.5 µm is considered as the standard with a value of 1.8873. We analyze the number of iterations required for different SGI groups and indicate the iterations required for the different groups using a dotted line representing the iterations with a CNR of 1.8873. DG-6-3 and DG-2-5 require only 705 and 813 iterations, respectively, with reconstruction times of 22.48 and 25.16 s. These iterations are reduced by more than 90% compared to the TGI. In the case of DG-2-5, the speckle size consists of 4 speckle patterns spaced at approximately 30µm intervals, ranging from 344 µm to 424 µm. Notably, the average size of these 4 speckle patterns corresponds to the smallest width of the object (window). This implies that when the pattern size closely matches the object size, the image quality and reconstruction speed reach their optimal levels. Even for most groups with slightly higher resolutions, as shown in Figure 10, less than half of the iterations are required.
4. Conclusions
In this study, we demonstrated the advantages of using sequenced random speckle patterns with varying speckle sizes in DMD-based CGI. By employing suitable sequenced speckle patterns, we can achieve higher CNR and resolution while reducing computational resources compared to traditional random speckle patterns. The simulation results validated the experimental findings regarding CNR and resolution improvements. The DMD device proves to be highly effective in projecting sequenced random speckle patterns, allowing easy control over the speckle size for speckle projection. This feature makes it well-suited to investigating the influence of sequenced random speckle patterns on GI quality. Moreover, the sequenced random speckle pattern exhibits potential in imaging objects with unknown or complex shapes, enabling effective characterization of image contours. It is important to note, however, that while the sequential speckle method may not provide a comprehensive solution for achieving high-quality imaging of arbitrary targets, it demonstrated enhanced robustness across a wide range of cases. Furthermore, this approach can be easily extended to PGI using a rotating ground glass.
We anticipate that these improvements will prove valuable in practical applications of both CGI and PGI, offering enhanced imaging capabilities and broadening the scope of potential applications.
Author Contributions
S.O. conducted the experiments and performed the simulations. Z.S. conceived the idea, analyzed the results, and wrote the manuscript. T.T. participated in discussion and provided theoretical validation. C.S. reviewed the manuscript and supervised the project. S.O. and Z.S. have contributed equally. All authors have read and agreed to the published version of the manuscript.
Funding
Deutsche Forschungsgemeinschaft (DFG, German Research Foundation) under Germany’s Excellence Strategy—EXC 2051 (Project-ID 390713860), “Balance of the Microverse”; The Free State of Thuringia within the project “Quantum Hub Thüringen” (Funding ID 2021 FGI 0044); DAAD (Deutscher Akademischer Austauschdienst) German Academic Exchange Service, Funding programme/-ID: (57552340) Research Grants—Doctoral Programmes in Germany, 2021/22; The Fundamental Research Funds for the Central Universities (D5000220481).
Institutional Review Board Statement
Not applicable.
Informed Consent Statement
Not applicable.
Data Availability Statement
Data available on request due to restriction of privacy. The data presented in this study are available on request from the corresponding author. The data are not publicly available due to related experiments are still in progress and involve unpublished papers.
Acknowledgments
The author would like to thank Rudrakant Sollapur for English checking.
Conflicts of Interest
The authors declare no conflict of interest.
References
- Pittman, T.B.; Shih, Y.H.; Strekalov, D.V.; Sergienko, A.V. Optical Imaging by Means of Two-Photon Quantum Entanglement. Phys. Rev. A 1995, 52, R3429–R3432. [Google Scholar] [CrossRef] [PubMed]
- Bennink, R.S.; Bentley, S.J.; Boyd, R.W. “Two-Photon” Coincidence Imaging with a Classical Source. Phys. Rev. Lett. 2002, 89, 113601. [Google Scholar] [CrossRef] [PubMed]
- Gatti, A.; Brambilla, E.; Bache, M.; Lugiato, L.A. Ghost Imaging with Thermal Light: Comparing Entanglement and ClassicalCorrelation. Phys. Rev. Lett. 2004, 93, 093602. [Google Scholar] [CrossRef] [PubMed]
- Zhang, D.; Chen, X.-H.; Zhai, Y.-H.; Wu, L.-A. Correlated Two-Photon Imaging with True Thermal Light. Opt. Lett. 2005, 30, 2354. [Google Scholar] [CrossRef]
- Ferri, F.; Magatti, D.; Gatti, A.; Bache, M.; Brambilla, E.; Lugiato, L.A. High-Resolution Ghost Image and Ghost Diffraction Experiments with Thermal Light. Phys. Rev. Lett. 2005, 94, 183602. [Google Scholar] [CrossRef]
- Xiong, J.; Cao, D.-Z.; Huang, F.; Li, H.-G.; Sun, X.-J.; Wang, K. Experimental Observation of Classical Subwavelength Interference with a Pseudothermal Light Source. Phys. Rev. Lett. 2005, 94, 173601. [Google Scholar] [CrossRef]
- Sun, Z.; Tuitje, F.; Spielmann, C. A Review of High-Resolution Microscopic Ghost Imaging with a Low-Dose Pseudothermal Light. J. Microsc. 2021, 284, 3–11. [Google Scholar] [CrossRef]
- Gatti, A.; Brambilla, E.; Bache, M.; Lugiato, L.A. Correlated Imaging, Quantum and Classical. Phys. Rev. A 2004, 70, 013802. [Google Scholar] [CrossRef]
- D’Angelo, M.; Valencia, A.; Rubin, M.H.; Shih, Y. Resolution of Quantum and Classical Ghost Imaging. Phys. Rev. A 2005, 72, 013810. [Google Scholar] [CrossRef]
- Moreau, P.-A.; Toninelli, E.; Morris, P.A.; Aspden, R.S.; Gregory, T.; Spalding, G.; Boyd, R.W.; Padgett, M.J. Resolution Limits of Quantum Ghost Imaging. Opt. Express 2018, 26, 7528. [Google Scholar] [CrossRef]
- Pelliccia, D.; Rack, A.; Scheel, M.; Cantelli, V.; Paganin, D.M. Experimental X-Ray Ghost Imaging. Phys. Rev. Lett. 2016, 117, 113902. [Google Scholar] [CrossRef]
- Yu, H.; Lu, R.; Han, S.; Xie, H.; Du, G.; Xiao, T.; Zhu, D. Fourier-Transform Ghost Imaging with Hard X Rays. Phys. Rev. Lett. 2016, 117, 113901. [Google Scholar] [CrossRef]
- Zhang, A.-X.; He, Y.-H.; Wu, L.-A.; Chen, L.-M.; Wang, B.-B. Tabletop X-Ray Ghost Imaging with Ultra-Low Radiation. Optica 2018, 5, 374. [Google Scholar] [CrossRef]
- Zerom, P.; Shi, Z.; O’Sullivan, M.N.; Chan, K.W.C.; Krogstad, M.; Shapiro, J.H.; Boyd, R.W. Thermal Ghost Imaging with Averaged Speckle Patterns. Phys. Rev. A 2012, 86, 063817. [Google Scholar] [CrossRef]
- Yu, W.-K.; Liu, X.-F.; Yao, X.-R.; Wang, C.; Zhai, Y.; Zhai, G.-J. Complementary Compressive Imaging for the Telescopic System. Sci. Rep. 2014, 4, 5834. [Google Scholar] [CrossRef]
- Gatti, A.; Magatti, D.; Ferri, F. Three-Dimensional Coherence of Light Speckles: Theory. Phys. Rev. A 2008, 78, 063806. [Google Scholar] [CrossRef]
- Magatti, D.; Gatti, A.; Ferri, F. Three-Dimensional Coherence of Light Speckles: Experiment. Phys. Rev. A 2009, 79, 053831. [Google Scholar] [CrossRef]
- Sun, Z.; Tuitje, F.; Spielmann, C. Toward High Contrast and High-Resolution Microscopic Ghost Imaging. Opt. Express 2019, 27, 33652. [Google Scholar] [CrossRef]
- Sun, Z.; Tuitje, F.; Spielmann, C. Improving the Contrast of Pseudothermal Ghost Images Based on the Measured Signal Distribution of Speckle Fields. Appl. Sci. 2021, 11, 2621. [Google Scholar] [CrossRef]
- Zhang, Z.; Ma, X.; Zhong, J. Single-Pixel Imaging by Means of Fourier Spectrum Acquisition. Nat. Commun. 2015, 6, 6225. [Google Scholar] [CrossRef]
- Wang, L.; Zhao, S. Fast Reconstructed and High-Quality Ghost Imaging with Fast Walsh–Hadamard Transform. Photon. Res. 2016, 4, 240. [Google Scholar] [CrossRef]
- Luo, B.; Yin, P.; Yin, L.; Wu, G.; Guo, H. Orthonormalization Method in Ghost Imaging. Opt. Express 2018, 26, 23093. [Google Scholar] [CrossRef] [PubMed]
- Sun, M.-J.; Meng, L.-T.; Edgar, M.P.; Padgett, M.J.; Radwell, N. A Russian Dolls Ordering of the Hadamard Basis for Compressive Single-Pixel Imaging. Sci. Rep. 2017, 7, 3464. [Google Scholar] [CrossRef] [PubMed]
- Ma, H.; Sang, A.; Zhou, C.; An, X.; Song, L. A Zigzag Scanning Ordering of Four-Dimensional Walsh Basis for Single-Pixel Imaging. Opt. Commun. 2019, 443, 69–75. [Google Scholar] [CrossRef]
- Yu, W.-K. Super Sub-Nyquist Single-Pixel Imaging by Means of Cake-Cutting Hadamard Basis Sort. Sensors 2019, 19, 4122. [Google Scholar] [CrossRef]
- Yu, W.-K.; Liu, Y.-M. Single-Pixel Imaging with Origami Pattern Construction. Sensors 2019, 19, 5135. [Google Scholar] [CrossRef]
- Yu, X.; Stantchev, R.I.; Yang, F.; Pick well-MacPherson, E. Super Sub-Nyquist Single-Pixel Imaging by Total Variation Ascending Ordering of the Hadamard Basis. Sci. Rep. 2020, 10, 9338. [Google Scholar] [CrossRef]
- Gong, W.; Han, S. High-Resolution Far-Field Ghost Imaging via Sparsity Constraint. Sci. Rep. 2015, 5, 9280. [Google Scholar] [CrossRef]
- Gong, W. High-Resolution Pseudo-Inverse Ghost Imaging. Photon. Res. 2015, 3, 234. [Google Scholar] [CrossRef]
- Kim, J.; Hwang, J.; Kim, J.; Ko, K.; Ko, E.; Cho, G. Ghost Imaging with Bayesian Denoising Method. Opt. Express 2021, 29, 39323. [Google Scholar] [CrossRef]
- Nie, X.; Yang, F.; Liu, X.; Zhao, X.; Nessler, R.; Peng, T.; Zubairy, M.S.; Scully, M.O. Noise-Robust Computational Ghost Imaging with Pink Noise Speckle Patterns. Phys. Rev. A 2021, 104, 013513. [Google Scholar] [CrossRef]
- Shapiro, J.H. Computational Ghost Imaging. Phys. Rev. A 2008, 78, 061802. [Google Scholar] [CrossRef]
- Li, H.; Shi, J.; Zeng, G. Ghost Imaging with Nonuniform Thermal Light Fields. J. Opt. Soc. Am. A 2013, 30, 1854. [Google Scholar] [CrossRef]
- Sandra, P. Resolution-Definition and Nomenclature. J. High Resol. Chromatogr. 1989, 12, 82–86. [Google Scholar] [CrossRef]
Disclaimer/Publisher’s Note: The statements, opinions and data contained in all publications are solely those of the individual author(s) and contributor(s) and not of MDPI and/or the editor(s). MDPI and/or the editor(s) disclaim responsibility for any injury to people or property resulting from any ideas, methods, instructions or products referred to in the content. |
© 2023 by the authors. Licensee MDPI, Basel, Switzerland. This article is an open access article distributed under the terms and conditions of the Creative Commons Attribution (CC BY) license (https://creativecommons.org/licenses/by/4.0/).