Abstract
The presence of DC grids in distribution networks is being increased nowadays and is expected to be quite relevant in a near future, due to several advantages compared to traditional AC systems. Regardless of this, Power Quality in DC grids (DC PQ) (voltage variations, transients, spectral components, etc.) still remains not properly considered and there is a lack of reference normative documents such as standards, application guides or technical reports for their application. In this context, it is necessary to obtain more experience on real measurements, in order to define appropriate DC PQ parameters and limits that assess a reliable operation of the whole power network and eventually lead to establishing a reference frame acceptable for both generation sources and final users. In this work, a novel high frequency (up to 4 MS/s) digitiser system is presented for the study of DC PQ events. The system is designed to acquire waveforms with triggers fired by events in both DC and AC signals. The captured signals are pre-processed in real-time to be able to recover pre-trigger information stored in memory. The system was installed in a real DC micro-grid and configured to take data in an unattended way. Additionally, the results of the first months of data acquisition are presented.
1. Introduction
The growing of distributed energy sources in the power system and the development of power electronics devices have converted DC grids and DC distribution in a competitive alternative to classical AC power systems. DC grids are being developed at different voltage ranges depending on their application. Efficient energy transport over long distances is performed at high voltage DC (HVDC), modern decentralised renewable generation plants can integrate into the electricity grid at DC medium voltage, and low voltage micro-grids allow a more efficient use of appliances and end-user equipment, which typically operates directly in DC [1]. The use of DC grids presents some advantages over traditional AC grids. Among them, the non-existence of reactive power (and the need to control it), the lack of synchronisation needs between connected systems and the absence of skin effect, which translates into fewer losses, etc., can be enumerated. However, some practical obstacles still need attention from the research community, as power quality (PQ) phenomena [2].
Considering low voltage systems and micro-grids, hybrid AC/DC systems combine advantages of both worlds, facilitating the integration of DC technologies in existing AC systems [3]. Nevertheless, they can also share the problems, mainly related with power quality and those produced by the converters. PQ indices are well documented in international standards and scientific literature for AC grids. However, this is different for DC grids, where only a short collection of papers can be found in the scientific literature.
The first papers referring to PQ in DC systems were related to harmonic distortion and ripple evaluation [4,5]. Another early attempt to characterise the PQ phenomena in a DC grid was made by defining several statistic indicators calculated from waveforms measured in a small DC grid [6]. Other works studied the phenomena found in specific applications such as railway traction [7,8] and small DC micro-grids [9,10]. The lack of knowledge in DC PQ guided researchers to follow the steps given by the experience in conventional AC grids. Then, attempts to translate AC PQ indices to DC have been carried out, including voltage fluctuations, voltage dips and interruptions, rapid voltage changes and ripple [11,12].
The parameters were developed theoretically and their performance was evaluated in a limited laboratory experimental setup. Following the same focus, a review of the applicability of AC PQ standards to DC phenomena was published [13], concluding that most of the existing definitions of AC PQ parameters are sufficiently general to be applied to DC micro-grids. Nevertheless, some parameters in the definitions, thresholds, time windows and limits still need to be clarified. A recent review focused on the problem of defining useful PQ metrics for DC grids [14]. The study covered specific applications such as electric transports (including ships, aircrafts and terrestrial vehicles), distributed generation and micro-grids, modern data centers, etc., discussing the PQ indices from the point of view of their first principles origin and also from existing standards.
As a conclusion from the previous revision of the state of the art, it is clear that the definition of PQ indices in DC grids requires real-life data which will allow for determining reference levels, thresholds, sampling rates, integration (time) windows, etc. [14]. These data consist of waveforms obtained in measurement campaigns which should be performed in real working micro-grids. Moreover, the effect of AC PQ on the DC side of the microgrids must also be taken into account [2]. In this paper, we present a system which will be used in a measurement campaign performed in a real hybrid DC/AC grid [15]. This is part of the European metrology project “20NRM03 DC grids” which will contribute to the development of new or improved standards regarding definitions, measurement methods, and compatibility levels of PQ in DC grids.
The capture of the waveforms requires the development of appropriate triggers in order to record only data including interesting phenomena. To this end, specific DC triggers have been developed and, as the main novelty, AC triggers based on the PQ indices of the AC side of the grid are also integrated in the recording system. Then, the influence of the AC grid on the DC side will also be captured allowing for characterising the conversion system and its influence on the grid, as suggested in some of the previously cited papers [2].
The aim of this paper is to contribute to the development of PQ indices in DC grids including the measurement and triggering specifications. The main contributions consist of preparing a metrological-grade measurement system, including specific triggers prepared to capture the PQ phenomena present in DC grids. A novel trigger based on AC PQ parameters will allow for capturing data on both sides of the micro-grid, DC and AC. Real-live data are captured in the form of waveforms using the specific developed triggers.
The paper is organised as follows: Section 2 describes the micro-grid and the measurement system. Section 3 presents the software triggering strategies used for waveform capture, Section 4 shows the on-site micro-grid measurements, and, finally, Section 5 gives a summary of the contributions and conclusions.
2. Micro-Grid Description and Experimental Setup
The micro-grid considered in this work is part of the Málaga Smart City and is located in the south of Spain. It consists of 1 small wind turbine (600 W), 9 micro-wind turbines powering street lamps (300 W), 10 street lamps with PV panels (950 Wp in total), 1 PV power plant (9 kWp), 1 Vehicle to grid charger (10 kW) and some storage systems combining batteries and supercapacitors (50 kW) [15]. A simplified schematic diagram of this micro-grid can be seen in Figure 1.
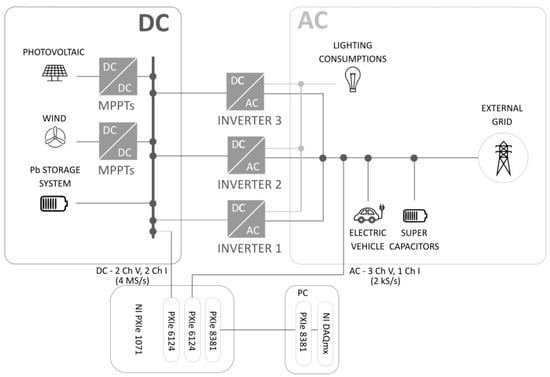
Figure 1.
Micro-grid outline and digitization setup.
A flexible digitiser system has been designed to process AC and DC waveforms. The result of the processing is a set of trigger signals which allow for storing selected digitised data for further analysis. The following subsections provide an overview of the digitiser configuration, software design and triggering strategies.
2.1. Digitiser Setup and Configuration
A NI PXIe 1071 chassis with three PXI boards inside is used for the digitiser: two data acquisition boards PXIe-6124, each one with four simultaneous sampling analogue channels (16 Bits, 4 MS/s), and one PCIe-8381 for the PXI/PCI connection.
The signals to be measured are fed to the digitiser using appropriate transducers to adjust their values to the input range of the digitiser. Hioki P9000 voltage probes and Signaltec CT200 AC/DC current transducers combined with MCTS II plug-on burden resistors are chosen, providing high accuracy, broad bandwidth and good temperature stability. The inputs of the digitiser have been assigned as follows:
- Three voltages and one current from the three inverters, three-phases AC grid side;
- DC bus common voltage (measured in two channels with DC and AC coupling);
- DC current in one of the inverters (measured in two channels with DC and AC coupling).
Part of the measurement system can be seen in Figure 2: NI PXIe 1071 chassis and Signaltec MCTS II plug-on burden resistors.
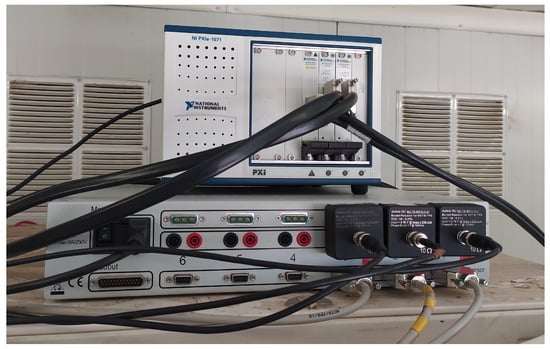
Figure 2.
Part of the measurement system: NI Chassis and MCTS II.
Using two channels with different coupling for the DC signals allows for obtaining the entire signal (with all frequency variations) in one of them (DC coupled) and the AC component with a much higher resolution in the other channel (AC coupled). This signal distribution allows for obtaining waveforms from the AC and DC sides with a flexible trigger system capable of correlating events on both sides.
The digitiser is configured to use distinct sampling frequencies due to the different measurement requirements for the AC and DC signals. The study of the DC signals is the final objective of the measurement campaign. Then, DC signals are captured at the acquisition board’s maximum sampling rate (4 MS/s). AC signals are mainly used for triggering and evaluating PQ parameters. Then, a sampling frequency of 20 kS/s is enough for that purpose. This configuration is suitable for a synchronised acquisition because the high sampling rate is an integer multiple of the low sampling rate allowing for sharing the digitisation clock (PXI_Clk10 PXI clock), which links both triggers using integer dividers.
The acquisition system is completed with a computer with one NI-PCIe8381 acting as a PXI-PCIe bridge. The system is based on an Intel i5-11400 processor with six cores (12 threads) and 128 Gb RAM memory running Ubuntu 20.04.4 LT as an operating system.
2.2. Software Design
The acquisition software and the triggering processes have been designed to facilitate the recording of interesting waveforms without running out of disk space. The system uses a circular buffer to store the temporarily sampled values in memory. Triggers, running in real time, provide the appropriate signals to store data permanently before overwriting the buffered samples. Therefore, the performance of these triggers must be tuned, as they have to run at the same speed as the acquisition threads. In addition, the software design allows for running in unattended mode, recording the triggered waveforms for later offline analysis. It is worth noting that the signals are stored without filtering or processing for their offline analysis without losing any information.
The program has been written in Python using the API available in the nidaqmx package. A block diagram can be seen in Figure 3 showing the aforementioned circular buffers, the internal (DC) trigger, the external (AC) trigger and the storage manager.
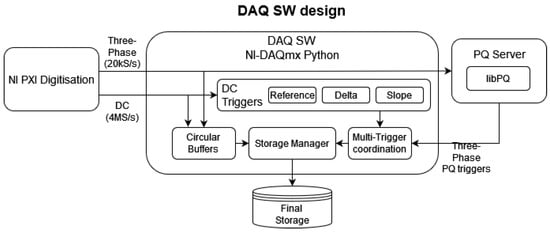
Figure 3.
Data acquisition software design.
The data acquisition is performed by registering an event every N samples (50,000) for each board. Data are read in one callback for board. These two callbacks use multichannel readers to avoid data losses when hardware acquisition runs at high speed, as is the case. Once the data have been read, they are sent via Python Queues. A worker thread reads this (thread-safe) queue and stores the samples in two lists acting as circular buffers.
The same information is sent to the software trigger modules and a positive response fires the recovery and writing of all pre-trigger information. The trigger signals coming from the different triggering modules are processed and combined in the Multi-Trigger coordination module to avoid possible overlaps. Finally, once the software trigger has been fired, the subsequent data are written to a disk.
Triggering mechanisms are modular and can be implemented within the main program, using the Python programming language, or externally using any other language. Thus, the DC signals’ triggers have been implemented in Python, Section 3.1. In contrast, those using the AC signals are obtained from a library external to the main program (Section 3.2).
Triggering using the AC signals is based on the PQ analysis of the three-phase waveforms and is performed by sending the acquired samples to a PQ server that uses CIRCE’s libPQ library [16]. This library implements online Power Quality analysis following the stringent class-A requirements of the IEC 61000-4-30 [17] standard. Using these PQ parameters, the server can trigger the acquisition by means of a TCP ad-hoc designed protocol. The PQ server is configured to evaluate the relevant PQ parameters (see Section 3.2). When some of these PQ parameters fall outside the allowed ranges, the PQ server sends back a signal to the DAQ program and stores the parameters causing that signal in a PostgreSQL database to trace the cause of the trigger and all the subsequent calculated PQ parameters.
The system has enough RAM to handle several seconds in the circular buffers. The configuration of the buffers’ size is adjusted to capture enough event information before the trigger without compromising the storage capacity. This parameter was chosen as one second based on several laboratory tests and can be tuned once the measurement system is on-site. Considering that the disk capacity is the main limitation, the system was configured for a maximum time of three seconds of continuous data recording in the triggering mode. Moreover, there is also the possibility of continuously writing data to test and debug all the analysis and trigger procedures.
3. Software Triggering Strategies
Two software triggering strategies have been implemented to cover the analysis of the PQ in the DC bus, as mentioned above. They are DC signal based phenomena and three-phase AC PQ events. In the following subsections, the details of both strategies together with their verification are explained.
3.1. DC Signal-Based Triggers
Three different algorithms based on DC signals have been implemented. They use thresholds based on a predefined reference value of the signal (DC Reference trigger), the difference of mean values (DC Delta trigger), and the derivative (DC Slope trigger). These triggers should be sufficient to detect most of the expected power quality events in DC networks [18]. As this section describes the implemented algorithms, a summary of the parameters and variables used in those algorithms is given in Table 1.

Table 1.
Algorithm variables and parameters.
The DC Reference trigger uses the subsampled (200 kS/s from 4 MS/s) DC signal to compute the average of the data in a configured time window. The subsampling has been implemented for a lighter and more agile performance. Once the average is obtained, the threshold value is easy to choose, considering the nominal value of the DC bus for the voltage channel and the maximum expected current for the current channel. An adjustable tolerance is added to both thresholds to allow certain signal variations. The pseudo-code for this trigger can be seen in Algorithm 1.
| Algorithm 1 DC Reference trigger |
|
The DC Delta trigger calculates the mean values for two consecutive equal-length time windows of samples using the same subsampling as the DC Reference trigger trigger. Then, it compares the difference between both average values, firing the trigger when this difference is bigger than a configurable threshold value. The pseudo-code in Algorithm 2 describes this trigger.
Finally, the DC Slope trigger has been implemented modularly with a call to a generic derivative function which uses as parameters the waveform data and the time value when computing the derivative. This modularity allows different approaches to calculate the derivative of noisy signals. The Optimised Sampling Frequency (OSF) approach [19] has been used in this work. The pseudo-code of Algorithm 3 shows how this trigger was implemented.
| Algorithm 2 DC Delta trigger |
|
| Algorithm 3 DC Slope trigger |
|
This method calculates the signal derivative using values in a time window defined as a multiple of the sampling period providing a lightweight derivative computation robust against noise. The width of the time window is selected, considering the noise present in the actual signals. A wider window will give a better noise rejection at the expense of a delay in the triggering. It is worth noting that, given the amount of memory in the PC, the circular buffer can be of the order of the seconds, and a delay of microseconds is negligible in this context.
The three threshold levels and the length of the time windows used for these triggers are selected once tested in the real micro-grid with actual data as explained in Section 4.
Performance Evaluation of DC Triggers
The performance of the DC signal-based triggers was evaluated using synthetic signals. A stationary DC signal with constant voltage and over-imposed Gaussian noise was used as a base-case. Those signals were generated in Python using numpy library for the Gaussian random number generator. They were used with the trigger functions of the data acquisition program as unit tests to check its good behaviour during the development. Zero mean and several standard deviation values allowed for generating the Gaussian noise simulating different noise levels. DC Reference trigger and DC Delta trigger were tested with signals obtained by combining the base-case with slight and step voltage variations, respectively. The tests were performed using the different noise levels and selecting appropriate thresholds, which allowed for verifying the correct operation of both triggers.
Several signals including transients were prepared to test the DC Slope trigger. The characterisation values in the IEEE 1159 standard [20] helped to generate the transient content added to the base-case signals. A correct adjustment of the derivative threshold value allowed for capturing the transient phenomena. Figure 4 shows the capture of an impulsive transient with 1 s rise-time and 250 s duration, fired by the DC Slope trigger. Low and medium frequency oscillatory transients were generated to evaluate the trigger capabilities.
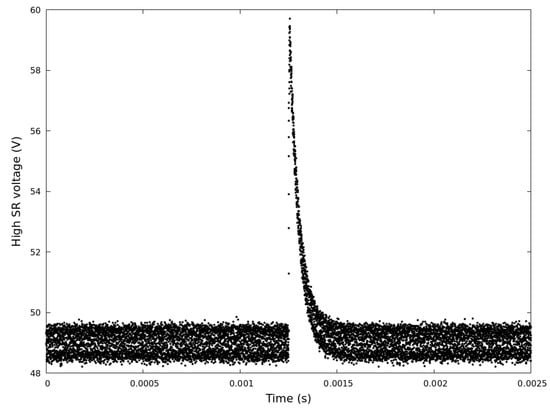
Figure 4.
Capture of a synthetic impulsive transient.
Figure 5 shows the captures obtained for oscillatory transient signals. Figure 5a shows a 10 kHz sinusoidal transient with duration of 10 s, while Figure 5b shows a slower 1 kHz sinusoidal transient with 5 ms duration.
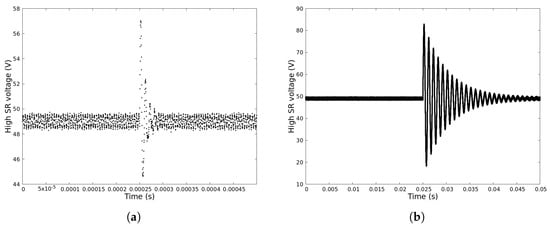
Figure 5.
Capture of synthetic oscillatory transients: quick (a) and slow oscillations (b).
The performance tests were repeated using different noise levels in the synthetic waveforms, showing satisfactory results for the three DC signal-based triggers. These performance tests also helped to obtain approximate values of the time windows and trigger thresholds.
3.2. AC PQ Based Triggers
The three-phase AC PQ triggers are based on the analysis of PQ indices computed according to IEC 61000-4-30 [17]. The CIRCE’s libPQ library [16] has been used, as it is capable of providing the following: power frequency, supply voltage magnitude, flicker, voltage harmonics, dips, swells and interruptions.
Among them, the most useful for being used as software triggers are those parameters calculated every ten cycles (power frequency, supply voltage magnitude, voltage harmonics, and total harmonic distortion).
The ability to detect PQ events, such as voltage dips, swells and interruptions, can also be exploited as a trigger source.
Expected values and trigger intervals have been defined for each parameter based on the limits and ranges provided by the EN 50160 standard [21]. Then, only phenomena not complying with the requirements established in that standard will fire a capture.
Suppose that some of the surveyed parameters falls outside the allowed range, a software trigger is fired, starting the waveform recording at both sides of the inverters and also storing the PQ parameters obtained simultaneously. The chosen reference values and intervals for this trigger are shown in Table 2.
Table 2.
PQ parameter reference values and intervals.
Performance Evaluation, Synchronisation and Stability of AC PQ Based Triggers
AC PQ-based triggers operate using the PQ parameters computed from waveforms measured at a lower sampling rate than the DC-measured waveforms, as mentioned in Section 2.1. Then, the evaluation of the AC PQ-based trigger mechanisms shall not include only the performance but also the signal synchronisation and the long-term stability.
A laboratory setup has been prepared to test trigger conditions and signal timing. A Fluke 6100A was used as the PQ reference and configured to cyclically generate an AC waveform containing the sequence of PQ perturbations described in Table 3. The generator’s output was attenuated using a 1 probe to match the dynamic range of the PXIe-6124. The attenuated signal was then split and routed to both acquisition boards. This configuration allowed for checking the synchronisation of the digitised values from the two boards using different sampling rates.
Table 3.
Sequence of conditions used to test the AC PQ-based triggers.
The synchronisation of both data acquisition boards was checked by comparing waveforms measured at high and low sampling rates. Data acquired at high frequency were subsampled and compared to those measured at low acquisition frequency. The differences of 120,000 samples were classified in bins of 0.01 V and plotted in a histogram, shown in Figure 6. The distribution shown in the figure shows that 99% of the difference values are lower than 0.18 V. This result is compatible with the absolute accuracy of the two boards [22] combined with the voltage probe (calibrated in our laboratory).
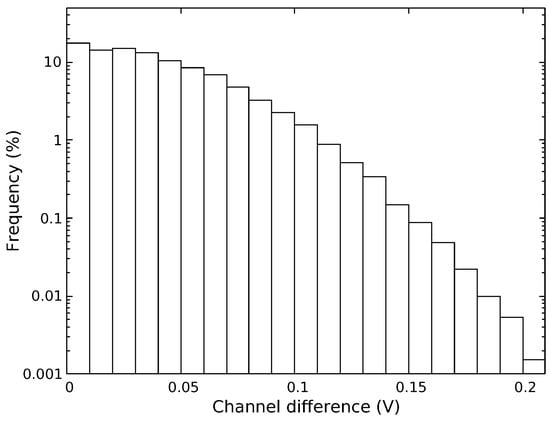
Figure 6.
Voltage difference (absolute value) between high and low sampling frequency channels.
Once the synchronisation between both acquisition boards was verified, the next test consisted of verifying the trigger capabilities of the system. The sequence of PQ perturbations given in Table 3 was used again, and the thresholds of the AC PQ triggers were fixed according the values provided in Table 2. These signals were generated with the Fluke 6100A via GPIB interface with the PQ parameters inside and outside the trigger values considered in Table 2.
This test covered all triggering conditions to verify triggering, waveform storage and PQ parameter extraction. The acquisition system triggered and recorded the waveform files only in the expected conditions as seen in the third column of Table 3. As an example, an event marked as an interruption can be seen in Figure 7. The signal acquired at 20 kS/s is shown in the top panel, whereas the 4 MS/s signal is in the bottom panel.
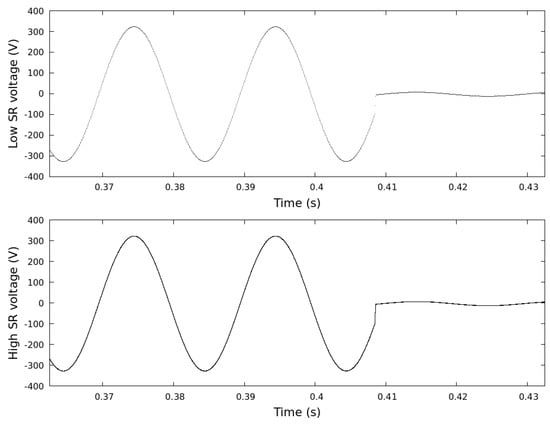
Figure 7.
Triggered event for voltage interruption (low and high sampling rate signals).
A final verification was accomplished to evaluate the performance of the digitiser. The system shall keep up the acquisition rate in a long-term acquisition running in unattended mode. The performance was evaluated by measuring the timestamp distance from the data recorded to the system time. This timestamp distance, if growing, is an indicator of a possible bottleneck in the acquisition stage. This must be checked each time a new trigger is added to the processing scheme.
The timestamp distance was monitored while the software ran unattended in long-term acquisition mode (for seven consecutive days), fed with the PQ perturbations given in Table 3. Tens of them were generated daily to check its impact in the distance, but no increase was detected. Additionally, the stability of the unattended software was tested simultaneously, showing that the system continued working properly as expected.
4. On-Site Micro-Grid Measurements and Trigger Parameter Selection
The High Frequency digitiser system was installed in Málaga in October 2022. As indicated above, the system’s objective is to acquire signals with a high sampling frequency in an unattended manner to cover a wide variety of PQ events. For this reason, the configurable time window width of the triggers based on DC signals was chosen on significantly different time bases, as described in Table 4. The window width for the Reference DC trigger was chosen to match the half cycle of the 50 Hz grid voltage. In the case of the DC Delta trigger, the width of the time window was selected considering the ten/twelve cycle aggregation stated in the IEC 61000-4-30 standard [17]. Finally, the window width for the DC Slope trigger was adjusted to be able to capture fast signals such as transients and spikes. Table 4 also shows the chosen thresholds for unattended operation of the system. The DC Reference trigger thresholds were adjusted to be of the nominal bus voltage (48 V). The other two thresholds were empirically adjusted using manually captured data to avoid triggering with the baseline noise.
Table 4.
Time windows width and thresholds for different DC triggers.
Since the acquisition system began unattended operation, a collection of waveforms showing different phenomenology has been acquired. These waveforms are being analysed offline to identify features and refine the trigger mechanisms. Figure 8 shows one event triggered by voltage DC Reference trigger, featuring all the stored signals: DC (Figure 8a) and AC (Figure 8b) voltage and current.
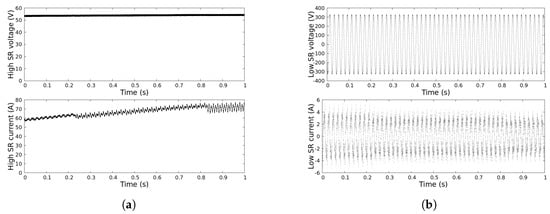
Figure 8.
Triggered events in the real micro-grid: DC (a) and AC (b) signals.
The three DC signal-based triggers have been working properly, allowing the capture of waveforms with different phenomenology. Figure 9a shows an event that surpassed the top threshold (54 V) of the DC Reference trigger, while Figure 9b displays the same event zoomed to the width of the relevant time window (10 ms). An event captured with the DC Delta trigger is shown in Figure 9c and zoomed in on in Figure 9d (200 ms time window). These events are usually associated with the end of the charge of the batteries and the beginning of energy exporting, producing an overshoot in the DC bus voltage. This effect is also seen in the data collected by the SCADA system of the micro-grid, shown in Figure 9e.
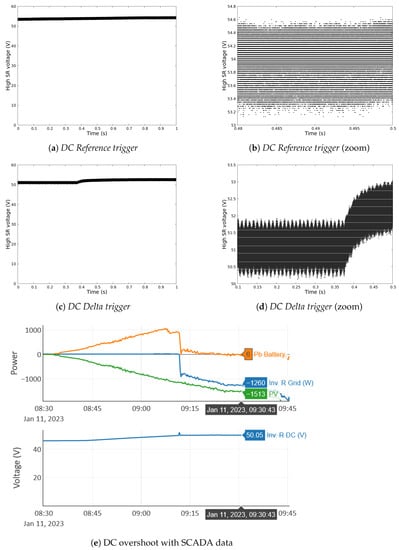
Figure 9.
Triggered events in the real micro-grid (a,c) associated with DC bus voltage overshoot (e).
Concerning the DC Slope trigger, it allowed for capturing another kind of event showing up in the micro-grid as seen in Figure 10a (zoomed in on in Figure 10b, 125 s time window) displaying an isolated disturbance in the DC level. These events are much faster and can be triggered due to the shorter time window width of this trigger.
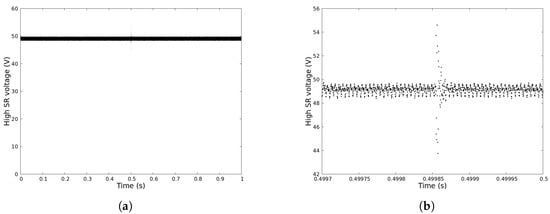
Figure 10.
Triggered slope event in the real micro-grid: complete waveform (a) and zoomed (b).
Finally, it is worth noting that any AC event has triggered the AC PQ-based trigger in the whole measurement campaign. This is a signal of the good operating conditions of the AC grid at the point of coupling, as those triggers use the thresholds and limits stated in the EN 50160 standard [21].
5. Conclusions
DC power quality phenomena are becoming more critical due to the higher presence of DC grids in distribution networks. Nevertheless, detailed knowledge of these DCPQ phenomena is still in its infancy. Actual waveform data measured at operating DC grids are needed to define the PQ phenomena and develop appropriate assessment methods.
This paper presents a flexible digitiser system with specific trigger mechanisms based on the DC signals and the AC PQ parameters of the AC network to which the studied DC grid is connected. The digitiser is built with a commercial National Instruments chassis with two high-performance NI PXI 6124 data acquisition boards (16 Bits, 4 MS/s) controlled by a computer with an Intel i5-11400 with six cores and 128 Gb RAM. The measurement software was developed in Python and ran in a Linux distribution (Ubuntu 20.04.4 LTS) as the operating system.
Three DC signal-based triggers have been developed and tested with synthetical waveforms, namely DC Reference trigger, DC Delta trigger and DC Slope trigger. The first two are appropriate to capture slow voltage and current variations with different shapes, while the last one has demonstrated excellent capabilities for capturing transients.
The developed system can also use triggers based on the AC PQ parameters of the network to which the DC grid is connected. These triggers are fired when the AC PQ parameters fall outside the ranges provided in EN 50160 [21] for PQ in distribution grids.
The digitiser has been extensively tested in the laboratory to guarantee synchronisation between the two acquisition boards, accuracy, performance of the triggers and long-term stability. These tests allow it to run for long periods in unattended mode. Finally, the equipment has been installed in a real operating DC grid, and the first waveform captures using the developed triggers were shown. Some of these captures could be traced to the root cause using the data coming from the SCADA of the grid.
In any case, the implemented system presents some limitations that are important to take into account when configuring the sampling frequency, measurement windows or number of analysed data, since an extremely demanding performance might lead into an abnormal operation and deficient storage of all detected PQ phenomena. In addition, the selection of very restrictive values when setting the thresholds of different available triggers may cause an indiscriminate capture of ordinary events, which is far from the purpose of this system, focused on gathering valuable information regarding relevant PQ distortion in the monitored grid.
For future developments, a significant database of PQ events is required and expected to be obtained at this end of this project. Once a sufficient number of phenomena are collected, a detailed analysis of them will be possible to be carried out. Then, considering the results of this analysis, an eventual proper definition of parameters, and also corresponding limits, might be achieved as a final outcome.
Finally, the selection of these parameters and limits are expected to contribute to covering the current lack of reference normative documents in this matter.
Author Contributions
Conceptualization, M.A.O. and J.J.P.-A.; methodology, M.A.O., J.J.P.-A. and J.J.M.; software, M.A.O., validation, J.J.P.-A.; writing—original draft preparation, M.A.O. and J.J.P.-A.; writing—review and editing, J.J.M.; supervision, J.J.M. All authors have read and agreed to the published version of the manuscript.
Funding
This work has received funding from the project 20NRM03 DC grids (Standardisation of measurements for DC electricity grids) of the EMPIR programme co-financed by the Participating States and from the European Union’s Horizon 2020 research and innovation programme.
Institutional Review Board Statement
Not applicable.
Informed Consent Statement
Not applicable.
Data Availability Statement
Restrictions apply to the availability of these data. Data was obtained from the Málaga SmartCity network and are available from the authors with the permission of Enel-ENDESA.
Acknowledgments
The authors of this work would like to thank ENEL-Endesa for their collaboration in this project by facilitating the carrying out of measurements in the Málaga SmartCity network.
Conflicts of Interest
The authors declare no conflict of interest.
Nomenclature
| PQ | Power Quality |
| DC | Direct Current |
| AC | Alternating Current |
| HV | High Voltage |
| PV | Photo-Voltaic |
| DAQ | Data Acquisition |
| API | Application Programming Interface |
| TCP | Transmission Control Protocol |
| GPIB | General Purpose Interface Bus |
| SW | Software |
| SCADA | Supervisory Control and Data Acquisition |
References
- Ertugrul, N.; Abbott, D. DC is the Future [Point of View]. Proc. IEEE 2020, 108, 615–624. [Google Scholar] [CrossRef]
- Kumar, D.; Zare, F.; Ghosh, A. DC Microgrid Technology: System Architectures, AC Grid Interfaces, Grounding Schemes, Power Quality, Communication Networks, Applications, and Standardizations Aspects. IEEE Access 2017, 5, 12230–12256. [Google Scholar] [CrossRef]
- Hofer, J.; Svetozarevic, B.; Schlueter, A. Hybrid AC/DC building microgrid for solar PV and battery storage integration. In Proceedings of the 2017 IEEE 2nd International Conference on Direct Current Microgrids, ICDCM 2017, Nuremburg, Germany, 27–29 June 2017; pp. 188–191. [Google Scholar] [CrossRef]
- Magro, M.C.; Mariscotti, A.; Pinceti, P. Definition of Power Quality Indices for DC Low Voltage Distribution Networks. In Proceedings of the 2006 IEEE Instrumentation and Measurement Technology Conference, Sorrento, Italy, 24–27 April 2006; pp. 1885–1888. [Google Scholar] [CrossRef]
- Mariscotti, A. Methods for ripple index evaluation in DC low voltage distribution networks. Conference Record—IEEE Instrumentation and Measurement Technology Conference; IEEE: Piscataway, NJ, USA, 2007; pp. 3–6. [Google Scholar] [CrossRef]
- Albu, M.; Kyriakides, E.; Chicco, G.; Popa, M.; Nechifor, A. Online monitoring of the power transfer in a DC test grid. IEEE Trans. Instrum. Meas. 2010, 59, 1104–1118. [Google Scholar] [CrossRef]
- Mariscotti, A. Discussion of Power Quality Metrics suitable for DC Power Distribution and Smart Grids. In Proceedings of the 23rd Imeko TC4 International Symposium, Xi’an, China, 14–15 September 2017; pp. 150–154. [Google Scholar]
- Crotti, G.; Femine, A.D.; Gallo, D.; Giordano, D.; Landi, C.; Luiso, M.; Mariscotti, A.; Roccato, P.E. Pantograph-To-OHL Arc: Conducted Effects in DC Railway Supply System. IEEE Trans. Instrum. Meas. 2019, 68, 3861–3870. [Google Scholar] [CrossRef]
- Whaite, S.; Grainger, B.; Kwasinski, A. Power quality in DC power distribution systems and microgrids. Energies 2015, 8, 4378–4399. [Google Scholar] [CrossRef]
- Ciornei, I.; Albu, M.; Sanduleac, M.; Hadjidemetriou, L.; Kyriakides, E. Analytical derivation of PQ indicators compatible with control strategies for DC microgrids. In 2017 IEEE Manchester PowerTech, Powertech 2017; IEEE: Piscataway, NJ, USA, 2017. [Google Scholar] [CrossRef]
- Barros, J.; De Apraiz, M.; Diego, R.I. Definition and Measurement of Power Quality Indices in Low Voltage DC Networks. In Proceedings of the 9th IEEE International Workshop on Applied Measurements for Power Systems, AMPS 2018, Bologna, Italy, 26–28 September 2018. [Google Scholar] [CrossRef]
- Barros, J.; de Apráiz, M.; Diego, R.I. Power quality in DC distribution networks. Energies 2019, 12, 848. [Google Scholar] [CrossRef]
- Van den Broeck, G.; Stuyts, J.; Driesen, J. A critical review of power quality standards and definitions applied to DC microgrids. Appl. Energy 2018, 229, 281–288. [Google Scholar] [CrossRef]
- Mariscotti, A. Power Quality Phenomena, Standards, and Proposed Metrics for DC Grids. Energies 2021, 14, 6453. [Google Scholar] [CrossRef]
- Melero, J.J.; Bruna, J.; Leiva, J. On-site PQ Measurements in a Real DC Micro-grid. In Proceedings of the 2022 20th International Conference on Harmonics & Quality of Power (ICHQP), Naples, Italy, 29 May–1 June 2022; pp. 1–5. [Google Scholar] [CrossRef]
- Oliván, M.A.; Bruna, J.; Matute, R.; Mareca, A.; Cervero, D. A Computer-Based IEC 61850 Sampled Values Analyzer for Parallel Power Quality Analysis. IEEE Trans. Instrum. Meas. 2022, 71, 1–8. [Google Scholar] [CrossRef]
- IEC 61000-4-30:2015; Electromagnetic Compatibility (EMC)—Part 4-30: Testing and Measurement Techniques—Power Quality Measurement Methods. International Electrotechnical Commission: Geneva, Switzerland, 2015.
- Petropoulos, D.; Mackay, L.; Ramirez-Elizondo, L.; Popov, M.; Bauer, P. Transient analysis of DC distribution grids. In Proceedings of the 2017 IEEE Second International Conference on DC Microgrids (ICDCM), Nuremburg, Germany, 27–29 June 2017; pp. 316–321. [Google Scholar] [CrossRef]
- Li, C.; Rakhra, P.; Norman, P.; Niewczas, P.; Burt, G.; Clarkson, P. Practical computation of di/dt for high-speed protection of DC microgrids. In Proceedings of the 2017 IEEE Second International Conference on DC Microgrids (ICDCM), Nuremburg, Germany, 27–29 June 2017; pp. 153–159. [Google Scholar] [CrossRef]
- IEEE Std 1159-2019 (Revision of IEEE Std 1159-2009); IEEE Recommended Practice for Monitoring Electric Power Quality. IEEE: Piscataway, NJ, USA, 2019; pp. 1–98. [CrossRef]
- EN50160:2010; Voltage Characteristics of Electricity Supplied by Public Distribution Networks. Slovenski Inštitut za Standardizacijo: Ljubljana, Slovenia, 2010.
- NI 6124 Specifications. 2008. Available online: https://download.ni.com/support/manuals/372526b.pdf (accessed on 1 March 2023).
Disclaimer/Publisher’s Note: The statements, opinions and data contained in all publications are solely those of the individual author(s) and contributor(s) and not of MDPI and/or the editor(s). MDPI and/or the editor(s) disclaim responsibility for any injury to people or property resulting from any ideas, methods, instructions or products referred to in the content. |
© 2023 by the authors. Licensee MDPI, Basel, Switzerland. This article is an open access article distributed under the terms and conditions of the Creative Commons Attribution (CC BY) license (https://creativecommons.org/licenses/by/4.0/).