Abstract
When the planing hull is sailing at high speed, the proportion of air resistance to the total resistance increases significantly. Therefore, by studying the aerodynamic characteristics of the planing hull shape, we can analyze the influence of the hull shape on the aerodynamic performance of the planing hull, and find a method to reduce the proportion of air resistance. The research took the planing trimaran as the research object, completed the wind tunnel test, and established the numerical simulation method by solving the RANS equation and combining the k-ε turbulence model. Combined with the wind tunnel test data, the calculation accuracy of the computational fluid dynamics (CFD) method was judged. Then, four superstructure shapes and two tail shapes were simulated by the CFD method, and the characteristics of the air resistance and airflow field of several drag reduction schemes with a volume Froude number between 7.00–17.51 were analyzed. The research focuses on the aerodynamic force of the planing hull. The results show that the circular arc stern has a more obvious drag reduction effect than the square stern, and the streamlined mid-arched superstructure has certain advantages in the drag reduction effect.
1. Introduction
The planing craft is a kind of high-performance ship with outstanding rapidity and maneuverability. It is also one of the few water surface equipment which can reach high speed. Generally, the speed of the planing craft can reach 40–50 kn. In recent decades, the research on the rapidity of the planing craft is gradually enriched, and the performance of the main engine is also improving, which results in the speed of the planing craft also increasing. The planing craft used in competition can even reach 120 kn.
Traditionally, in the aspect of the resistance of planing crafts, researchers generally focus on the hydrodynamic performance and overall resistance performance of the submerged part. At present, people have carried out more sufficient hydrodynamic research on the structure of the planing craft, such as the step and multi-body planing craft channel, including those in still water and in waves. De Marco et al. [1] carried out the towing test and numerical simulation analysis of a stepped planing craft in still water, and studied the complex fluid movement at the water–air mixing place behind the step. Lotfi et al. [2] carried out a numerical simulation on the resistance, heave, and trim angle of the single-hull single-step planing craft, and compared the simulation results with the existing empirical formulae, which proved the reliability of the CFD calculation results. Veysi et al. [3] carried out the numerical simulation test of the stepped and non-stepped planing craft, and proved the resistance reduction effect of the step. Ghadimi P. [4] made a comparative study on the double-stepped planing craft and the non-stepped planing craft with the same main dimension, and determined the advantages of the double-stepped design in the aspects of the hull resistance and bottom pressure at high speed. Lu et al. [5] studied the stern flap on the basis of the single-hull double-stepped planing craft, and determined that installing a stern flap at the stern of the planing craft can effectively reduce the position of the center of gravity of the hull and reduce the trim angle, which is conducive to the maintenance of the motion attitude of the planing craft at high speed. For the planing catamaran or planing trimaran, the channel structure has also become an important object of hydrodynamic research. Yousefi R. [6] simulated the friction resistance and pressure resistance of the monohull planing craft and the trimaran planing craft with the same ratio of 1:10. Through the comparison, it was found that the resistance of the improved trimaran planing craft was larger at low speed, but the resistance of the trimaran planing craft decreased significantly when the hull began to slide at high speed. The numerical simulation results are compared with Savitsky’s semi-empirical formula, and the results are in good agreement. Ghassabzadeh M. and Ghassemi H. [7] used their developed THFG equation to generate a channel planing craft. This channel planing craft is a multi-body hull with four channels. The hydrodynamic parameters such as the height of gravity center, trim angle, resistance, effective power, static pressure, and total pressure are obtained. In Jiang Y. [8]’s study, combined with the towing test and simulation, the hydrodynamic and aerodynamic characteristics of the trimaran channel planing craft at several high speed points were studied. The results show that increasing the straight section of the channel can reduce the average resistance and increase the lift of the channel, but it has adverse effects on the motion stability. In addition, Jiang Y. [9] also studied the influence of the channel size, such as the channel width and height, on the hydrodynamic and aerodynamic characteristics of the channel. The complex movement of the water–air mixture in the channel is also analyzed. Du L. and Sun H.B. [10] studied the air intake of the trimaran channel planing craft, and proved that the existence of the air intake can produce a more obvious drag reduction effect compared with the planing craft without air intake at high speed. Panahi et al. [11] studied the slamming and slapping of the high-speed planing craft in motion, and the high reliability of the simulation was proven by comparing the simulation results with the test results. Judge C. et al. [12] studied the motion characteristics of a high-speed deep-V planing craft in waves by combining the model test and CFD method. Karimi M.H. [13] studied the influence of automatic control of the stern interceptors on the vertical motion attitude of the high-speed planing craft. Ma W.J. [14] summarized the relationship between the encounter frequency and the speed of the planing craft through the towing test of the planing trimaran model in waves. Rosén A. et al. [15] carried out the stress analysis on the hull structure of the monohull planing craft sailing in waves. Su Y.M. et al. [16] conducted a numerical simulation and simulation tests on the trimaran channel planing craft, and studied the influence of the gravity center position of the planing trimaran on the resistance, trim angle, heave, and other relevant parameters of the hull attitude. Moghadam H.K. [17] took the channel size of the planing trimaran as a variable to study the effect of overall channel size on drag reduction. Yousefi R. [18] has sorted out the research methods and technical means for the hydrodynamic analysis of high-speed planing crafts at this stage.
In the existing studies, there are few research results on the air resistance of the planing craft alone. Park et al. [19] studied the air resistance of the deck house shape of the high-speed planing craft, simulated four kinds of deck house shape models, analyzed their flow field characteristics, and gave the shape design with the best air drag reduction effect. Kim and Hwang [20,21] carried out a CFD numerical calculation and wind tunnel test on a planing craft model, and obtained the conclusion that the air resistance of the planing craft model can account for 30% of the whole hull resistance at a speed of 30 knots. When the speed of the full-scale planing craft is low, the proportion of the air resistance to total resistance is small. Therefore, a large change in the shape of the planing craft has little effect on the rapidity of the planing craft. However, when the speed increases, more parts of the planing craft are lifted out of the water due to the support of the fluid, so the volume of the planing craft in the air is larger. In addition, the air resistance of the ship hull increases rapidly with the increase of velocity. This causes the proportion of the air resistance of the planing craft to also be increased when it is sailing at high speed. In the future, the design speed of the planing craft will continue to increase, which will become the development trend. Therefore, it is more valuable to study the air resistance of the planing craft.
The research object of this paper is the hull above the water surface of the planing trimaran. Several optimization schemes are made for the planing craft, and the effects of the air drag reduction brought by different optimization schemes are studied, and these schemes are compared based on the calculation results. In this paper, Star CCM+ is used as the solver, and the Reynolds-averaged N–S equation and k–ε turbulence model are selected as the numerical solution models. After a comparison and correction with wind tunnel test data, the air flow field of the high-speed planing craft is simulated and analyzed.
2. Materials and Methods
2.1. Hull Models
2.1.1. Wind Tunnel Test Model
The high-speed planing craft model used in wind tunnel test is solid. Its surface has been polished and painted. Since the research object is only the part above the water surface of the planing craft, the hydrodynamic force is not studied, so the part below the water surface is sheared. The main parameters of the wind tunnel test model are given in Table 1. Figure 1 shows the picture of the wind tunnel test model.

Table 1.
Main dimensions.
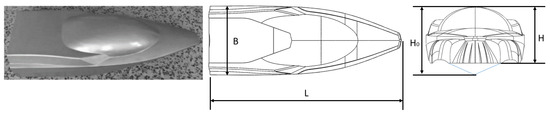
Figure 1.
Wind tunnel test model.
2.1.2. CFD Simulation Test Model
When preparing the simulation model, the same test model as the wind tunnel test is established to test and correct the accuracy of CFD simulation. The model is named Model 0. The main dimensions and mass settings of Model 0 are exactly the same as those of wind tunnel test model. The three views of Model 0 are shown in Figure 2.
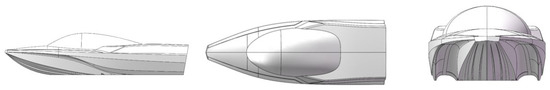
Figure 2.
Three views of Model 0.
According to the shape of superstructure, the models used for simulation research can be divided into four categories (Model A, Model B, Model C and Model D). Each type of model can be divided into two types according to the shape of the stern: arc stern (No. 01) or square stern (No. 02), with a total of 8 research models. The three views of the eight models are shown in Figure 3.
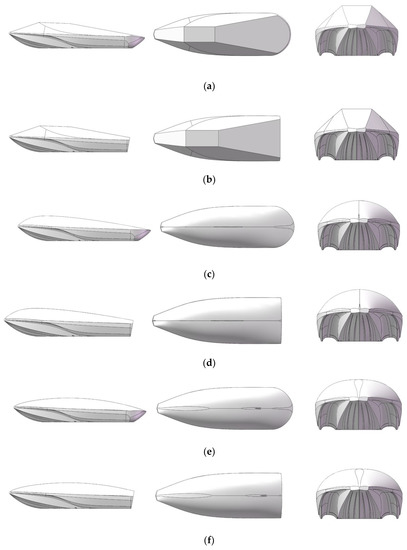
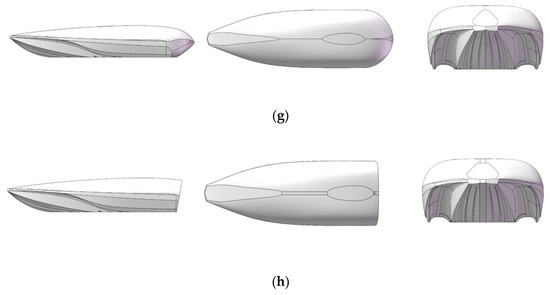
Figure 3.
Three views of 8 models: (a) Model A01; (b) Model A02; (c) Model B01; (d) Model B02; (e) Model C01; (f) Model C02; (g) Model D01; and (h) Model D02.
In the design of the model, a totally enclosed superstructure is adopted, and no corridor is reserved on both sides of the hull, which makes the superstructure and the hull integrated. The superstructure of Model A is mostly composed of plane, with the cab in front. The superstructure of B, C, and D models are all designed with integrated streamline curved surface, and the main difference lies in the different position of cab design. From the appearance, the longitudinal position of the highest point of the surface is different. In order to describe the specific differences of superstructure, the lowest point of stern plate is taken as the origin, L is the length of the hull, and L1 is the longitudinal distance from the highest point of superstructure to the origin, as shown in Table 2 and Figure 4. In Table 2, the square stern model is selected to express the differences among the three types of models: B, C, and D.
Table 2.
Longitudinal position of the highest point of the model.
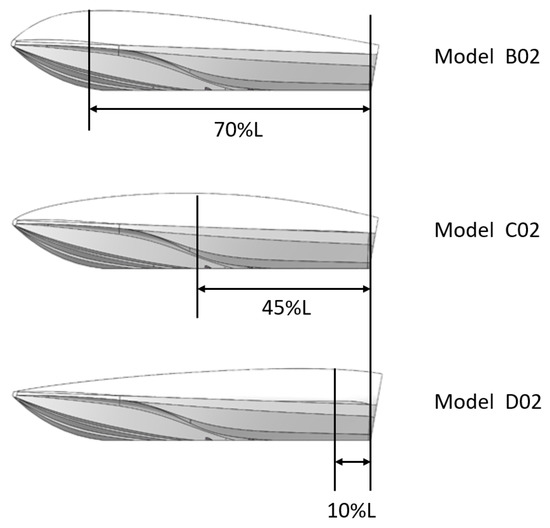
Figure 4.
Longitudinal position.
The air resistance formula is:
where is the air resistance coefficient, is the air density, V is the moving speed, and S is the windward area. According to the formula, the test model should ensure the same windward area as far as possible. In this study, the forward windward area of the four models is the same as that of the prototype hull, which is 403 cm2.
2.2. CFD Condition Setting and Accuracy Verification
2.2.1. Governing Equations and Turbulence Models
The maximum speed in the study is 25 m/s. Although the speed is very high for the planing craft, it is still far lower than the acoustic velocity. It belongs to low speed flow, and the change of air density can be ignored. Therefore, the incompressible air flow is selected in the study.
The simulation of the flow field is essentially to solve the N–S equation. The equation is as following:
During simulation, the governing equation of incompressible viscous flow is described by the Reynold-averaged Navier–Stokes equations (RANSE), which are the most widely used method in engineering. The equation is described as follows:
where , denote the time-averaged velocity components;, are the fluctuations of the velocity components; is the time-averaged pressure; is dynamic viscosity coefficient; t is time; and , are unit vectors in directions of i and j. The Reynolds number in the study is very high, reaching the order of 106, far exceeding the minimum standard of turbulence, so the turbulence model is selected in the study. The standard k-ε turbulence model is selected in the study, which has a wide range of application and reasonable calculation accuracy in the flow field calculation, and has been widely used in the calculation of engineering flow field. The equation is described as follows:
The transported variable of turbulent kinetic energy, k, is defined as follows:
The second transported variable ε is defined as follows:
where is the laminar eddy viscosity coefficient, and , , , are empirical constants.
2.2.2. Domain Setting
As this is the same as the previous research on the hydrodynamic force of planing craft, because the left and right sides of the hull are symmetrical, we only calculate half of the hull with the longitudinal section of the planing craft as the symmetry plane, so as to improve the calculation efficiency. In order to better meet the model test conditions, the model is set to be fixed on the ground, which is the same as the wind tunnel test. The front of the domain is the velocity inlet, the incoming flow velocity setting is the same as the wind tunnel test, and the rear of the domain is the pressure outlet. The settings for the domain are shown in Figure 5.
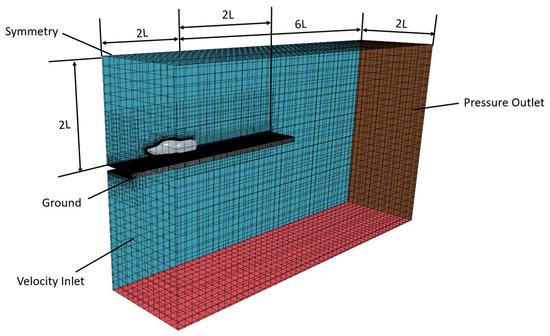
Figure 5.
Calculation domain.
2.2.3. Verification of CFD Calculation Accuracy
In order to improve the calculation accuracy, the hull grid is refined. Meanwhile, to make the simulation environment as similar as possible to the test environment, the simulated ground plane is set at the bottom of the hull model, and the mesh size is similar to the hull surface. The grid generation around the hull is shown in Figure 6.
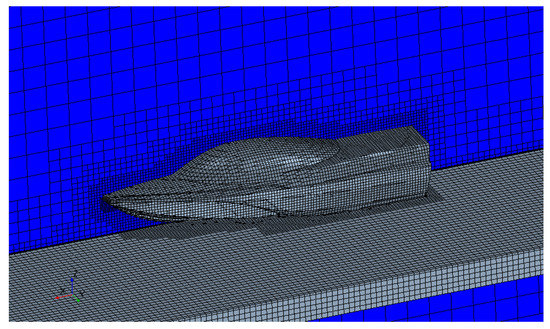
Figure 6.
Grid around hull.
The mesh size is very important in numerical calculation. A fine mesh can save time and improve calculation efficiency while bringing more accurate calculation results. Therefore, before starting the numerical study, it is necessary to determine the mesh size through numerical verification. The speed of 19 m/s is selected here. The size of the surface mesh is 0.005LOA, 0.009LOA, and 0.011LOA. The non-dimensional height y+ range of the first layer of prism layer is 0.12–2.02. The calculated results are shown in Figure 7. The test value is also shown in the figure. According to the results, it can be found that the smaller surface mesh size results will be closer to the test value. The thinner prism layer will also bring the calculated results closer to the test value. The calculation result of y+ = 0.12 has better accuracy, and the difference between 0.005LOA and 0.009LOA is not significant. In order to improve the calculation efficiency, 0.009LOA and y+ = 0.12 were selected for calculation in the subsequent study.
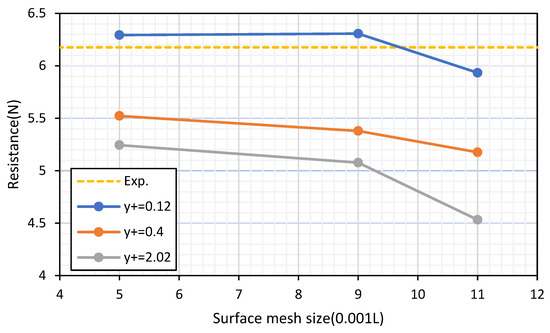
Figure 7.
Calculated resistance in mesh independence analysis.
The wind tunnel test of the model was carried out in Wind Tunnel and Water Flume, Harbin Institute of Technology. The laboratory is a closed circumfluence rectangular cross-section wind tunnel. The test wind speed range is 3–25 m/s, and the flow field performance is good. The velocity nonuniformity of the flow field in the test area is less than 1%. In the model test, the selection range of wind speed is 10–25 m/s; a total of 10, 13, 16, 19, 22, and 25 working conditions are selected. The duration of each working condition is 30 s, and 1000 data are recorded per second. The average value of all data of each working condition is taken as the resistance of the working condition.
In the study, the model with the same size as the wind tunnel test model is used for simulation, and then the results are compared with those of the wind tunnel test, and then adjusted. The comparison and error of the obtained data are shown in Table 3 and Figure 8.
Table 3.
Comparison of experimental data and simulation data.
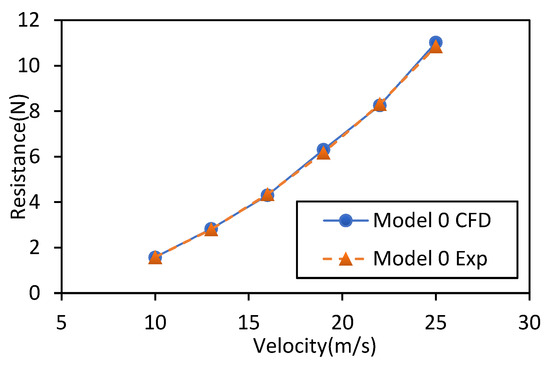
Figure 8.
Comparison of experimental data and simulation data.
From the data obtained, the CFD simulation test data are very close to the wind tunnel test results; the maximum error is only 2.12%, which is very consistent with the engineering accuracy requirements, and can be used for the following optimization simulation calculation of planing craft shape.
3. Results and Discussion
The test conditions include six speed points of eight models and 48 working conditions in total. The maximum speed in the design condition is 25 m/s. According to the model design, the displacement 9 kg, and the volume Froude number formula which is shown as follows,
where V is the model velocity, g is the acceleration of gravity, and ∇ is the volumetric displacement of the hull, its volume Froude number has reached 17.51. The volume Froude numbers corresponding to each velocity point are given in Table 4. In addition to the applied racing craft, this has far exceeded the level that the existing planing crafts can reach. However, in the future, the development of practical planing craft capable of high speeds will become a new trend and development direction. Therefore, it is of research significance to improve the speed in the design condition to such a high speed. In the study, we can compare the velocity of the flow field around the ship, the pressure field around the hull, and the resistance, and draw a reasonable conclusion.
Table 4.
Comparison of experimental data and simulation data.
3.1. The Distribution of Pressure Field around the Hull
From the results, the pressure distribution of the same model at six velocity points is almost the same. Therefore, the analysis of the pressure distribution selects the highest speed condition of each model, which is more representative. Figure 9 shows the pressure distribution in the middle longitudinal profile of each model at the highest speed. It can be seen from the pressure distribution around the hull that the model with the same stern shape has an obvious difference according to the change of superstructure. The superstructure of Model A is mainly composed of the plane, and two low-pressure areas are generated at the two corner polygonal lines where the cab is located. On the other hand, Models B, C and D with a streamline shape also have formed a low-pressure area in the arched part of the superstructure, but the low-pressure area is relatively smooth, and the location moves with the change of the shape of the superstructure.
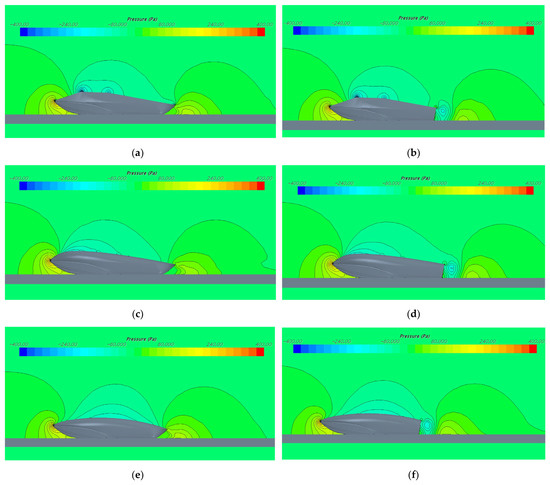
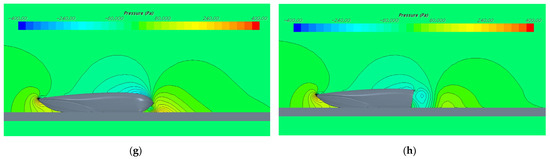
Figure 9.
Pressure distribution in middle longitudinal profile of each model at 25 m/s: (a) Model A01; (b) Model A02; (c) Model B01; (d) Model B02; (e) Model C01; (f) Model C02; (g) Model D01; and (h) Model D02.
Then, taking the stern shape as the variation, we can find that the four series of models have something in common. Compared with the arc-shaped stern, the gas flow in the stern of the square stern is more complex, resulting in a very obvious low-pressure region. From the point of view of the pressure difference, it is clear that the square stern produces greater resistance. According to the pressure distribution of Model D02, the low-pressure area of the superstructure is even about to connect with the low-pressure area at the stern to form a larger low-pressure area, which will not produce a good drag reduction effect. Obviously, the combination of the rear cab and square stern is not a good design.
On the whole, the pressure distribution of the above optimization schemes is quite different from that of the prototype hull. The pressure distribution in the middle longitudinal profile of the prototype hull is shown in Figure 10.
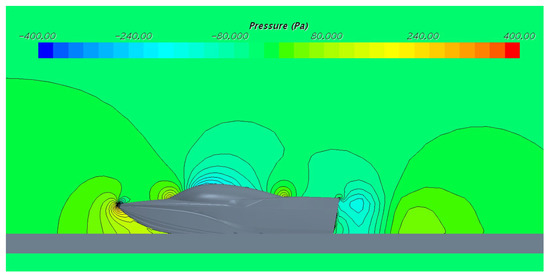
Figure 10.
Pressure distribution in middle longitudinal profile of prototype hull at 25 m/s.
The front cabin and aft engine room of the superstructure of the prototype hull are designed in the plane, and the middle cab adopts a bubble drag reduction shape. It can be seen from the figure that a part of the low-pressure area is formed in the upper part of the cab, and a small high-pressure area is formed at the inflection point between the cab and the front and rear cabins. Finally, a large area of low pressure was formed at the stern. In the optimization scheme, the superstructure is almost in the low-pressure area, and the pressure distribution is more uniform.
3.2. Description of Streamline Distribution on Hull Surface
In the study, the flow lines on the hull surface were monitored. Streamline can directly express the fluid flow around the hull, which is convenient for analyzing the characteristics of fluid motion and comparing the influence of the hull shape on fluid motion. Figure 11 shows the streamline of each model at the highest speed.
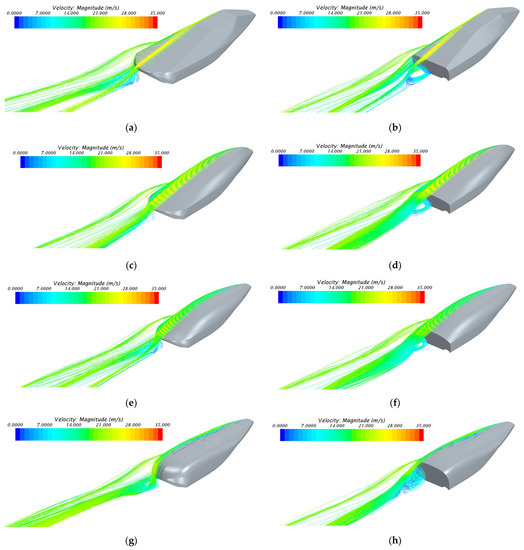
Figure 11.
Streamline diagram of each model surface at 25 m/s: (a) Model A01; (b) Model A02; (c) Model B01; (d) Model B02; (e) Model C01; (f) Model C02; (g) Model D01; and (h) Model D02.
From the streamline diagram of each model, it can be seen that there are large vortices in the tail of the square stern model, and even the relative velocity between the fluid and the hull in some vortices drops to close to 0. The eddy current generated by the tail of Model D02 is the most obvious and complex. In contrast, the vortices in the wake of he A-type arc stern model are smaller, and the phenomenon of fluid deceleration is also improved. From the point of view of energy, a larger eddy current will consume more energy; from the perspective of pressure, a larger eddy current will increase the pressure difference between the front and rear of the hull, which is not conducive to the drag reduction of the air part of the hull.
Figure 12, taking model C as an example, shows the streamline details of the stern view. The composition of vortices generated by different stern shapes can be analyzed from Figure 12. For the arc stern Model C01, the incoming flow of the wake vortex consists of two parts: one part is the gas from the tunnel of the planing trimaran; the other part is the gas flowing from the hull side along the stern shape to the vortex. After passing through the vortex area, these two parts of fluid converge with the fluid passing through the top of the superstructure and the other part flowing through the side of the hull. However, for a square stern hull such as Model C02, the vortices flow only from the tunnel. The fluid flowing through the side and top of the hull does not participate in the formation of the vortex. The fluid coming out of the vortex zone converges with the fluid flowing through the side of the hull. From the physical point of view, a part of the vortex generated at the tail can even produce a reverse velocity, which is similar to Cravero C. [22] and Shi L.’s [23] research on the flow around a cylinder in the turbulence model.
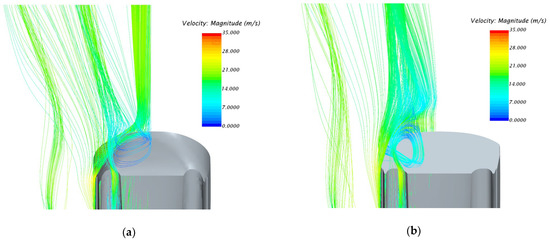
Figure 12.
Streamline details of Model C01 and Model C02: (a) Model C01; and (b) Model C02.
3.3. Comparison and Analysis of Resistance
Table 5 and Table 6 show the resistance of each model at each speed point after CFD simulation, and the drag reduction effect compared with the prototype hull. Among them, Table 5 shows the relevant data of the arc stern and Table 6 shows the relevant data of the square stern. Figure 13 shows the line charts of each model under each speed condition. Some valuable conclusions can be drawn by comparing the data within the table and between the tables.
Table 5.
Resistance and drag reduction effect of arc stern model.
Table 6.
Resistance and drag reduction effect of square stern model.
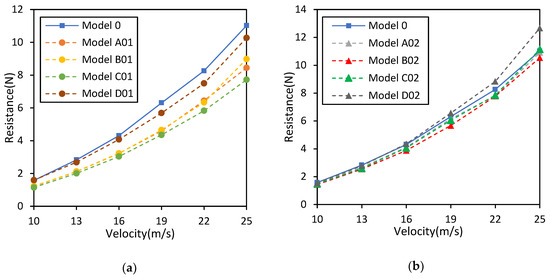
Figure 13.
The resistance line charts of each model: (a) Resistance line chart of arc stern model under various speed conditions; (b) Resistance line chart of square stern model under various speed conditions.
From the data in Table 5 and Table 6, the drag reduction effect of each model can be seen intuitively. From the data, most models of the square stern can reduce the drag to a certain extent, but the effect is not obvious enough. Even the design of Model D produces more resistance than the prototype hull. For the model with same superstructure, it is obvious that the arc stern model has an obvious drag reduction effect. It can be considered that the arc stern can bring about an additional 20% drag reduction effect. If the shape of the arc stern is further studied, it may even produce more of a drag reduction effect.
On the other hand, the conclusion of the comparison between the same stern models varies with the shape of the superstructure. For the square stern, the best drag reduction effect is Model B02, which can achieve about a 10% drag reduction effect in the working conditions of 10–19 m/s. With the increase of velocity, the drag reduction effect of the square stern model generally decreases. It can be considered that such a stern design is not suitable for ultra-high-speed planing crafts. Model C01 has the best drag reduction effect for the arc stern model, and the drag reduction effect is the highest at all speed points. The drag reduction effect reaches 30% under the working condition of 19 m/s. Model D01 even changes the negative growth of the drag reduction effect of Model D02 into a positive growth by means of the arc stern.
Figure 14 shows the histogram of the drag reduction effect of each model at six speed points. It can be seen from the figure that the combined design of the arc stern and streamlined superstructure cab has obvious advantages in the air drag reduction of the high-speed planing craft. It can also be seen from the line chart in Figure 13 that the resistance of the arc stern model is generally low. When both Model A and Model B adopt the arc stern, the drag reduction effect is similar. Only when the speed is higher, 25 m/s, is the difference shown. When the square stern is used, the streamline Model B has a better drag reduction effect. Considering the internal cabin design of the planing craft, if the layout conditions permit, the high-speed planing craft should adopt the integrated design as far as possible, and the cab should be centered as far as possible, at least avoiding the rear cab or rear cabin arching. For the selection of the stern shape, the arc stern should be adopted in the design of the high-speed planing craft without affecting the installation and operation of the propeller and shaft.
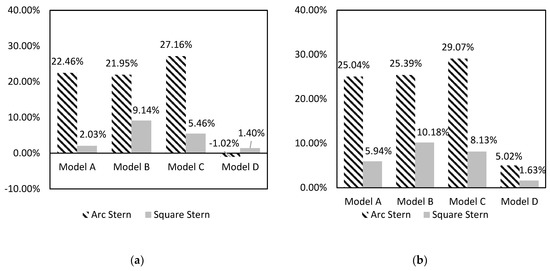
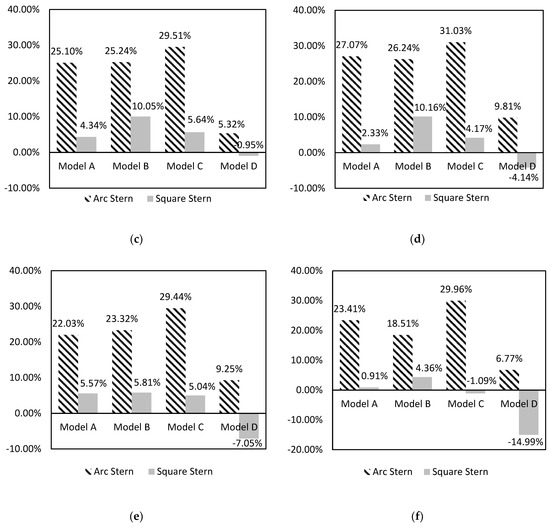
Figure 14.
Histogram of drag reduction effect of each model at 6 speed points: (a) v = 10 m/s; (b) v = 13 m/s; (c) v = 16 m/s; (d) v = 19 m/s; (e) v = 22 m/s; and (f) v = 25 m/s.
4. Conclusions
In this paper, the air part of the planing trimaran is taken as the research object, and the drag reduction effect of several design schemes combining the superstructure and stern shape is studied. Through the experiment, simulation, and analysis, the following conclusions are obtained:
- The CFD simulation software solver, Reynolds-averaged N–S equation, and k–ε turbulence model are used to simulate the air flow field of the high-speed planing craft. By comparing the experimental data with the test data under the same conditions and adjusting the parameters reasonably, the calculation error can be reduced to less than 3%, which can meet the requirements of engineering application for calculation accuracy;
- In the resistance component of the planing trimaran, the proportion of air resistance cannot be ignored. From the calculation results, the drag reduction effect can be obtained by a reasonable optimization design of the superstructure. Therefore, it is necessary to optimize the superstructure design of the high-speed planing trimaran. The research results of this paper can be used as the basis for the appearance design of future super-high-speed planing craft;
- Based on the research data of this paper, it can be concluded that the arc stern design can effectively improve the wake flow field and reduce the air resistance for the planing trimaran. If the arc stern design is adopted, the streamline design and cab center scheme are the best for the superstructure, and the high-speed drag reduction effect can reach nearly 30%. If it is necessary to adopt the square tail design due to design limitations, it is more suitable to adopt the streamline design and center cab.
Author Contributions
Conceptualization, J.Z., L.W. and J.C.; methodology, H.S., J.Z. and J.C.; software, J.C. and L.Z.; validation, J.C. and L.Z.; formal analysis, J.C.; model test, H.S.; resources, J.Z. and L.W.; data curation, J.C.; writing—original draft preparation, J.C.; writing—review and editing, J.C. and J.Z.; visualization, L.Z.; supervision, J.Z. and L.W.; project administration, J.Z. and J.C. All authors have read and agreed to the published version of the manuscript.
Funding
This research received no external funding.
Institutional Review Board Statement
Not applicable.
Informed Consent Statement
Not applicable.
Data Availability Statement
The data of this research are available from the corresponding author upon request.
Acknowledgments
This research did not receive any specific grant from funding agencies in the public, commercial, or not-for-profit sectors. However, we would like to express our sincere thanks to the staff who participated in the experiment.
Conflicts of Interest
The authors declare no conflict of interest.
Nomenclature
| CFD | Computational fluid dynamics |
| kn | Knot |
| Fr▽ | Volume Froude number |
| L | Length (m) |
| B | Breadth (m) |
| H | Test model height (m) |
| H0 | Initial model height (m) |
| T | Draft (m) |
| △ | Displacement (kg) |
| LCG | Longitudinal center of gravity (m) |
| R | Resistance |
| Ca | Air resistance coefficient |
| ρ | Air density |
| V | Moving speed |
| S | Windward area |
| RANSE | Reynolds-averaged Navier–Stokes equations |
| p | Pressure |
| ∇ | Volume of displacement |
| g | Acceleration of gravity |
References
- De Marco, A.; Mancini, S.; Miranda, S.; Scognamiglio, R.; Vitiello, L. Experimental and numerical hydrodynamic analysis of a stepped planing hull. Appl. Ocean Res. 2017, 64, 135–154. [Google Scholar] [CrossRef]
- Lotfi, P.; Ashrafizaadeh, M.; Esfahan, R.K. Numerical investigation of a stepped planing hull in calm water. Ocean Eng. 2015, 94, 103–110. [Google Scholar] [CrossRef]
- Veysi, S.T.G.; Bakhtiari, M.; Ghassemi, H. Toward numerical modeling of the stepped and non-stepped planing hull. J. Braz. Soc. Mech. Sci. 2015, 37, 1635–1645. [Google Scholar] [CrossRef]
- Ghadimi, P.; Panahi, S.; Tavakoli, S. Hydrodynamic study of a double-stepped planing craft through numerical simulations. J. Braz. Soc. Mech. Sci. Eng. 2019, 41, 2. [Google Scholar] [CrossRef]
- Zou, J.; Lu, S.J.; Jiang, Y.; Sun, H.B.; Li, Z.Z. Experimental and Numerical Research on the Influence of Stern Flap Mounting Angle on Double-Stepped Planing Hull Hydrodynamic Performance. J. Mar. Sci. Eng. 2019, 7, 346. [Google Scholar] [CrossRef]
- Yousefi, R.; Shfaghat, R.; Shakeri, M. High-speed hull drag reduction using tunnel. Ocean Eng. 2014, 84, 54–60. [Google Scholar] [CrossRef]
- Ghassabzadeh, M.; Ghassemi, H. Determining of the hydrodynamic forces on the multi-hull tunnel vessel in steady motion. J. Braz. Soc. Mech. Sci. Eng. 2014, 36, 697–708. [Google Scholar] [CrossRef]
- Jiang, Y.; Sun, H.B.; Zou, J.; Hu, A.K.; Yang, J.L. Experimental and numerical investigations on hydrodynamic and aerodynamic characteristics of the tunnel of planing trimaran. Appl. Ocean Res. 2017, 63, 1–10. [Google Scholar] [CrossRef]
- Jiang, Y.; Sun, H.B.; Zou, J.; Hu, A.K.; Yang, J.L. Analysis of tunnel hydrodynamic characteristics for planing trimaran by model tests and numerical simulations. Ocean Eng. 2016, 113, 101–110. [Google Scholar] [CrossRef]
- Du, L.; Sun, H.B.; Jiang, Y.; Li, P. Numerical Research on the Resistance Reduction of Air Intake. Water 2019, 11, 280. [Google Scholar] [CrossRef]
- Panahi, R.; Jahanbakhsh, E.; Seif, M.S. Towards simulation of 3D nonlinear high-speed vessels motion. Ocean Eng. 2009, 36, 256–265. [Google Scholar] [CrossRef]
- Judge, C.; Mousaviraad, M.; Stern, F.; Lee, E.; Fullerton, A.; Geiser, J.; Schleicher, C.; Merrill, C.; Weil, C.; Morin, J.; et al. Experiments and CFD of a high-speed deep-V planing hull—Part II: Slamming in waves. Appl. Ocean Res. 2020, 97, 102059. [Google Scholar] [CrossRef]
- Karimi, M.H.; Mohammad, S.S.; Majid, A. A study on vertical motions of high-speed planing boats with automatically controlled stern interceptors in calm water and head waves. Sh. Offshore Struct. 2015, 10, 335–348. [Google Scholar] [CrossRef]
- Ma, W.J.; Sun, H.B.; Sun, H.W.; Zou, J.; Zhuang, J.Y. Test studies of the resistance and seakeeping performance of a trimaran planing hull. Pol. Marit. Res. 2015, 22, 22–27. [Google Scholar] [CrossRef]
- Rosén, A.; Garme, K.; Razola, M.; Begovic, E. Numerical modelling of structure responses for high-speed planing craft in waves. Ocean Eng. 2020, 217, 107897. [Google Scholar] [CrossRef]
- Su, Y.M.; Wang, S.; Shen, H.L.; Du, X. Numerical and experimental analyses of hydrodynamic performance of a channel type planing trimaran. J. Hydrodyn. 2014, 26, 549–557. [Google Scholar] [CrossRef]
- Moghadam, H.K.; Shafaghat, R.; Yousefi, R. Numerical investigation of the tunnel aperture on drag reduction in a high-speed tunneled planing hull. J. Braz. Soc. Mech. Sci. Eng. 2015, 37, 1719–1731. [Google Scholar] [CrossRef]
- Yousefi, R.; Shifaghat, R.; Shakeri, M. Hydrodynamic analysis techniques for high-speed planing hulls. Appl. Ocean Res. 2013, 42, 105–113. [Google Scholar] [CrossRef]
- Park, C.H.; Park, H.S.; Jang, H.Y.; Im, N. A comparison study on the deck house shape of high speed planing crafts for air resistance reduction. Int. J. Nav. Archit. Ocean Eng. 2014, 6, 867–875. [Google Scholar] [CrossRef]
- Kim, Y.S.; Hwang, S.K. An experimental study on air resistance of the planing boat. In Proceedings of the Annual Spring Meeting SNAK, Je-ju, Republic of Korea, 3–5 June 2012; pp. 1238–1245. [Google Scholar]
- Kim, Y.S.; Hwang, S.K. A study on air resistance and greenhouse gas emissions of an ocean leisure planing boat. J. Korean Soc. Mar. Environ. Energy 2013, 16, 202–210. [Google Scholar] [CrossRef]
- Cravero, C.; Marogna, M.; Marsano, D. A Numerical Study of Correlation between Recirculation Length and Shedding Frequency in Vortex Shedding Phenomena. WSEAS Trans. Fluid Mech. 2021, 16, 48–62. [Google Scholar] [CrossRef]
- Shi, L.L.; Yang, G.; Yao, S. Large eddy simulation of flow past a square cylinder with rounded leading corners: A comparison of 2D and 3D approaches. J. Mech. Sci. Technol. 2018, 32, 2671–2680. [Google Scholar] [CrossRef]


Disclaimer/Publisher’s Note: The statements, opinions and data contained in all publications are solely those of the individual author(s) and contributor(s) and not of MDPI and/or the editor(s). MDPI and/or the editor(s) disclaim responsibility for any injury to people or property resulting from any ideas, methods, instructions or products referred to in the content. |
© 2023 by the authors. Licensee MDPI, Basel, Switzerland. This article is an open access article distributed under the terms and conditions of the Creative Commons Attribution (CC BY) license (https://creativecommons.org/licenses/by/4.0/).