Abstract
Advances in the knowledge of renal cell carcinoma (RCC)’s oncogenesis have led to the development of new therapeutic approaches, such as immune checkpoint inhibitors (ICIs), which have improved the clinical outcomes of metastatic RCC (mRCC) patients. Our literature search led to a series of studies that were divided into four subcategories: RECIST criteria, radiomics and artificial intelligence, atypical response patterns, and body composition. These studies provide novel and promising data aimed at improving patient management and clinical outcomes, further strengthening the concept of precision medicine. Radiomics and artificial intelligence allow us to obtain—in a non-invasive fashion—a multitude of data that cannot be detected with the naked eye, offering potential advantages that might help to predict the response to treatments and possibly improve patients’ outcomes through a personalized therapeutic approach. The purpose of this literature review is to describe the available evidence on the role of computed tomography (CT) in evaluating and predicting ICIs’ effects on mRCC patients by applying radiomics and artificial intelligence.
1. Introduction
Statistics from the American Cancer Society have shown that kidney and renal pelvis cancers are among the top 10 most frequently diagnosed cancers [1]. Approximately one-third of renal cell carcinoma (RCC) patients have metastases at diagnosis. The most frequent histological type is clear-cell RCC (ccRCC), accounting for about 80% of all renal tumors, with poor prognosis in the metastatic stage [2]. Over the past two decades there have been remarkable advances in the understanding of RCC’s oncogenesis, leading to the emergence of new targeted therapeutic options such as biologic antineoplastic drugs. Consequently, a marked improvement in clinical outcomes has been found with the advent of immune checkpoint inhibitors (ICIs), both in monotherapy and in association with other drugs [3]. The International Metastatic Renal Cell Carcinoma Database Consortium (IMDC) has subclassified RCC into favorable, intermediate, and poor prognosis [4]. First-line treatment with dual immunotherapy (ICI/ICI) is recommended by the guidelines of the European Association of Urology in the IMDC intermediate and poor risk subgroups, while for all IMDC risk groups they recommend first-line treatments with combined ICI/VEGF therapies. However, despite the therapeutic advances in recent years, distant-stage mRCC has only a 13% of 5-year relative survival rate [5].
Numerous tissue-based tumoral biomarkers—including histological features, PD-L1 protein expression, infiltrating T-cell exhaustion markers, somatic mutations, and transcriptomic signatures—have been studied for the evaluation of systemic therapies [6,7,8,9,10]. However, these biomarkers have several limitations due to their low predictive capacity, lack of standardization, invasiveness of the biopsy, or sampling errors related to lesion heterogeneity [11]. Imaging is of fundamental importance for diagnosis, non-invasive qualitative and quantitative analysis of tissues, tumor staging treatment planning, response to therapy, and follow-up [12,13,14]. The most widely used imaging technique in RCC is contrast-enhanced computed tomography (CT) [15]. CT protocols for the detection and staging of RCC involve arterial and nephrographic post-contrast phases, as the histological subtypes of RCC can have variable post-contrastographic appearance [16]. Metastatic lesions generally exhibit contrast enhancement similar to that of the primary lesion [16]. Some metastases, such those from ccRCC, can have arterial contrast enhancement. RCC can metastasize to any organ; the lung is the first organ most affected by RCC metastases, followed by the lymph nodes and bone [17]. The morphology of lymph node metastases is fundamental for diagnosis; in particular, a short axis of the lymph node greater than 10 mm indicates potential disease involvement.
ICIs, unlike other systemic therapies, may exhibit atypical response patterns. A systematic review of 38 studies demonstrated an atypical response rate of 6% [18]. Two atypical patterns of response called pseudoprogression and hyperprogression were reported. Pseudoprogression is a transient increase followed by a decrease in total tumor burden, while a rapid increase of at least twice the expected tumor growth rate defines hyperprogression [19,20].
Furthermore, tumor heterogeneity, through texture analysis, provides information that is not visible with the naked eye, which can be detected through CT approaches, possibly helping to predict tumor behavior and outcomes [21]. By generating quantitative parameters, texture analysis provides important information on the features of the tissue, offering valuable prognostic information.
The present literature review is focused on the role of CT in evaluating ICIs’ effects on mRCC, providing an overview of both the CT manifestation of ICIs and the potential predictive value to estimate tumor response to these therapies.
2. Methods
The literature search was performed in January 2023 using PubMed, taking into account only articles written in English and without limits of timespan. Two reviewers independently performed the search (F.G., 7 years of experience; and C.A.M., 11 years of experience). All peer-reviewed journals were screened, and all relevant studies were explored. Review articles and case reports were excluded. Combinations of keywords for the article search were as follows: “computed tomography renal cell carcinoma immune checkpoint inhibitors”, “imaging renal cell carcinoma immune checkpoint inhibitors”, “computed tomography renal cell carcinoma Nivolumab”, “Nivolumab renal cell carcinoma imaging”, and “Pembrolizumab renal cell carcinoma imaging”. Relevant articles related to the role of CT in the evaluation of ICIs’ effects in mRCC were also retrieved from the reference list of each detected article. The title and abstract of all of the articles of potential interest to our topic were examined, without any specific exclusion criteria. After this screening, we filtered the literature search and identified 11 appropriate original articles for further review. The levels of evidence of the selected articles were defined according to the Scottish Intercollegiate Guidelines Network 2019.
3. Discussion
3.1. RECIST Criteria
Contemporary first-line therapies for mRCC can have different imaging responses (i.e., complete, or partial). Navani et al. [22] questioned whether objective response at imaging is correlated with overall survival. Specifically, in this study they evaluated baseline characteristics, the type of first-line immuno-oncology combination therapy, and the relative objective imaging response in 899 mRCC patients [22].
Evaluation of response to immune checkpoint blockade (ICB) treatment on imaging was performed using the Response Evaluation Criteria in Solid Tumors (RECIST), version 1.1 [23,24,25]. The use of RECIST has been of fundamental importance in the clinical development of therapies with ipilimumab–nivolumab (IOIO) and ICB therapy with VEGF receptor inhibitors (IOVE), and it is still used for the study of new therapeutic approaches for mRCC.
The RECIST 1.1 criteria are based on the identification of the target lesions representative of the disease burden, and on the calculation of the largest diameter of all of the target lesions, taken as a reference through contrast-enhanced CT-based follow-up. Four scenarios can be observed for the assessment of response to therapy:
- -
- Complete response (CR): disappearance of all target lesions together with any pathological lymph nodes (target or non-target) with short axis < 10 mm (Figure 1).
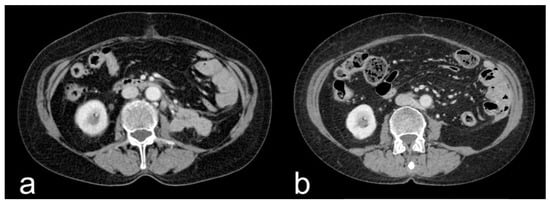 Figure 1. Contrast-enhanced CT axial scan during the venous phase of a nephrectomized 75-year-old female mRCC patient, showing mass-like pathological lymphadenopathies located at the left retroperitoneal space (a) and relative CR after ICI treatment, with complete resolution of the mass (b).
 - -
- Partial response (PR): ≥30% reduction in the sum of the target lesions’ diameters.
- -
- Progressive disease (PD): ≥20% increase in the sum of the target lesions’ diameters, with the lower sum considered as the reference, plus an absolute ≥ 5 mm increment in the sum.
- -
- Stable disease (SD): there is not a sufficient reduction to be defined as a partial response, nor a sufficient increase to be defined as progressive disease, using the smallest sum of the target lesions’ diameter as a reference (Figure 2 and Figure 3) [23].
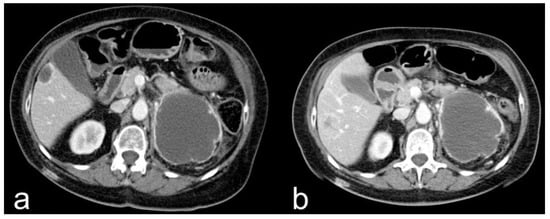 Figure 2. Contrast-enhanced CT axial scan during the venous phase of a 67-year-old female mRCC patient, showing a cystic renal cell carcinoma located at the upper pole of the left kidney (a). SD at follow-up with dimensional stability after ICI treatment (b).
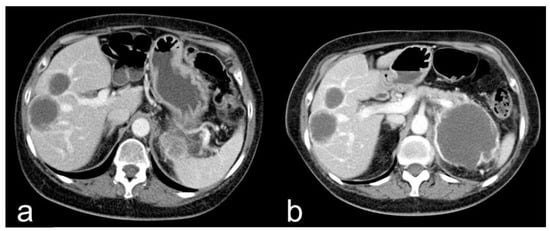 Figure 3. Contrast-enhanced CT axial scan during the venous phase of a 67-year-old female mRCC patient, showing 2 cystic hepatic metastases (a). The lesions showed SD at follow-up with dimensional stability after ICI treatment (b).
Regarding the best overall response of all patients, 4.1% had a CR, 38.3% a PR, 35% experienced SD, and 22.6% had PD; 73.1% of patients were treated with first line IOIO therapy, while the remaining 26.9% were treated with first-line IOVE therapy.
In the adjusted logistic regression analysis, only cytoreductive nephrectomy (odds ratio (OR), 1.59; 95% CI, 1.04–2.43; p = 0.03), deferred nephrectomy—defined as nephrectomy performed after the receipt of systemic therapy (OR, 3.04; 95% CI, 1.03–8.97; p = 0.04), lung metastases (OR, 1.49; 95% CI, 1.01–2.20; p = 0.04), and favorable vs. poor IMDC risk group (OR, 1.93; 95% CI, 1.10–3.39; p = 0.02) were significantly correlated with objective imaging response.
Patients who received IOVE vs. IOIO were more likely to achieve an objective imaging response (OR, 1.89; 95% CI, 1.26–2.81; p = 0.002). Considering intermediate and poor IMDC risk (n = 667), 34.1% of patients treated with IOIO vs. 51.8% treated with IOVE experienced a PR (p < 0.001), while 27.5% of patients treated with IOIO vs. 12.2% treated with IOVE experienced PD (p < 0.001). Patients with CR showed a non-estimable median overall survival (95% CI, 53.3 months to not estimable), patients with PR had a median OS of 55.9 months (95% CI, 44.1 months to not estimable), patients with SD had a median OS of 48.1 months (95% CI, 33.4 months to not estimable), and patients with PD had a median OS of 13.0 months (95% CI, 8.4–18.1 months), with log-rank p < 0.001 [22].
Jajodia et al. [26] evaluated different organ responses to nivolumab in surgically treated mRCC by describing response patterns and discrepancies between the RECIST 1.1 and iRECIST criteria [26].
iRECIST is based on RECIST 1.1, where the prefix “i” stands for “immune”; similarly, the response scenarios also have the “i” prefix—complete response (iCR), partial response (iPR), unconfirmed progressive disease (iUPD), or confirmed progressive disease (iCPD)—to differentiate them from the RECIST 1.1 criteria. The principles used to evaluate objective tumor response are largely unchanged from the RECIST 1.1 criteria; the main difference is the zeroing of the bar if the next assessment with tumor shrinkage follows the RECIST 1.1 progression. iRECIST introduces immune unconfirmed progressive disease (iUPD), which is related to atypical responses such as the delayed ones that occur with pseudoprogression [27].
Data collected at each time point on target and non-target lesion responses, new lesion responses, and overall response were used for the iRECIST criteria. As lymph nodes are classified as organs, the longest diameter was scored as lesions of other organs as defined by the RECIST 1.1 criteria. Of the 21 mRCC patients enrolled in the study, 10 were responders and 11 were non-responders. In accordance with the iRECIST criteria, 10 patients experienced iPD, 3 patients experienced iPR, and 8 patients experienced iSD. During ICI therapy, three patients died (one from a cardiac event and two from immune confirmed progressive illness). Other complications were ICIs pneumonia (n = 1), metastatic inferior vena cava thrombosis (n = 1), duodenal hemorrhage treated with gastroduodenal artery angioembolization (n = 1), and colonic perforation treated with hemicolectomy (n = 1). An organ-specific response of 10% for hepatic metastasis, 19% for lung metastasis, 20% for brain metastasis, 35% for lymph node metastasis, and 25% for both for adrenal and intraperitoneal metastases was detected. Moreover, 13 patients experienced differential responses to ICIs, with 6 patients experiencing differential intra-organ responses. In 21 patients, a variation in tumor burden from −64 to +185% (median: −12%) was found at the time point of best overall response. Discordance of best overall response was found in four patients (14%) who showed iSD according to iRECIST 1.1 and PD according to RECIST 1.1. The remaining three patients had iUPD as defined by iRECIST but were confirmed progress by RECIST 1.1. The development of new lesions was found during therapy in eight patients (38%). Sites of development of target lesions included the liver (n = 3), lymph nodes and brain (n = 2), adrenal gland (n = 1), and lung and peritoneal metastases (n = 1). According to the iRECIST criteria, these patients were classified as iSD (n = 3), iPD (n = 4), and iUPD (n = 1). Nineteen patients (90.4%) showed more than one lesion in the same organ. A different response was found between organ categories (Kruskal–Wallis p = 0.003), with the best shrinkage for the adrenal glands and lymph nodes, followed by the lungs, while liver and miscellaneous lesions had the least shrinkage. The response rates also differed significantly among the lesion groups according to the location (Fisher p = 0.02) [26]. This study provides important data regarding the response to nivolumab related to sites of metastasis and differences in staging between the iRECIST and RECIST1.1 criteria. This knowledge might be helpful in predicting responses to nivolumab treatment in mRCC patients according to the site of metastasis. The iRECIST criteria should be used for the staging of mRCC patients treated with ICIs [26].
Zheng et al. [28] compared the iRECIST and RECIST 1.1 criteria for radiological tumor response in metastatic clear-cell renal cell carcinoma (mccRCC) patients treated with programmed cell death-1 inhibitor therapy [28]. Thirty mccRCC patients were included in the study, 25 of whom were treated with nivolumab and 5 with pembrolizumab. Ninety-three percent of patients underwent prior nephrectomy. Furthermore, 93% of patients underwent 1–2 prior systemic therapies, and 3 patients underwent 3 prior systemic treatments.
The objective response rates during therapy were 30% for RECIST 1.1 (95% confidence interval (CI): 13.6–46.4) and 50% for iRECIST (95% confidence interval (CI): 13.6–46.4). The median time to progression for iRECIST was not reached, whereas for RECIST 1.1 it was 170 days (p = 0.04). Eight patients had discordance across criteria, six of whom showed pseudoprogression, while two were evaluated as iUPD with no subsequent confirmation of iPD. Furthermore, the iRECIST criteria showed five more patients with iPR and one more with iCR. Therefore, significant differences between iRECIST and RECIST 1.1 were shown (p < 0.001) [28].
These studies have demonstrated that treatment with IOVE therapy is correlated with a better objective imaging response compared to IOIO therapy, as well as that the presence of lung metastases, nephrectomy, and favorable IMDC risk are correlated with experiencing an objective imaging response. Furthermore, it has been demonstrated that treatment with ICIs has a different response rate at the level of the soft tissues, and that the iRECIST criteria have a greater ability to evaluate immune-related atypical responses than the RECIST 1.1 criteria. All of these studies had a level of evidence of 2.
Hermansen et al. [29] evaluated overall survival, time to treatment discontinuation, and progression-free survival in a retrospective analysis of mRCC patients treated with tyrosine kinase inhibitors, mTOR inhibitors, or ICIs, divided by age: 159 patients (19%) were aged ≥ 75 years, 324 patients (39%) were aged 65–74 years, and 355 patients (42%) were aged < 65 years. The number of patients treated with tyrosine kinase inhibitors was 729 (87%), while 43 (5%) were treated with mTOR inhibitors and 67 (8%) were treated with ICIs. Multivariate analysis, adjusted for IMDC risk score and histology, showed that age had no impact on overall survival (aHR 1.0; 95% CI 0.99–1.02, p = 0.2), time to treatment discontinuation (aHR 1.0; 95% CI 0.99–1.01, p = 0.4), or progression-free survival (aHR 1.0, 95% CI 0.99–1.01; p = 0.9). This study demonstrated that elderly patients with mRCC were more prone to toxicity, but age did not affect the results [29].
Regardless of the age of the patients, all of these results, taken together, can be helpful in selecting the best treatment option in the management and the CT-based follow-up of mRCC patients. Data and results of clinical studies related to the RECIST criteria are summarized in Table 1.

Table 1.
Summary of CT clinical studies related to the RECIST criteria in mRCC patients treated with ICIs.
3.2. Radiomics and Artificial Intelligence
Radiomics allows the development of predictive signatures in medical imaging [30]. In particular, radiomics can produce quantitative information from radiological images that could predict tumor biology and immune cell infiltrates. Radiomics has several advantages compared to biopsy: it obtains spatial information of the whole tumor and microenvironment, thereby considering intratumor heterogeneity and interactions with the microenvironment; multiple lesions can be evaluated in parallel; lesions can be evaluated longitudinally, allowing the study of their variations over time; and the information is obtained through a non-invasive approach [31]. Artificial intelligence, including machine learning and deep learning, is a new breakthrough technology that has been proposed as a solution to enable automatic, rapid, and precise analysis of tissues [32,33].
Malone et al. [31], using signature texture analysis, predicted tumor response in mRCC patients treated with nivolumab [31]. Twenty-seven patients were included in the study; 89% had received prior nephrectomy and 89% had received prior systemic therapy. Furthermore, 30% of the patients were in the good risk group, 60% in the intermediate risk group, and 10% in the poor risk group, according to the IMDC scoring system. Machine learning was applied with the support-vector machine and radial basis function. To predict the pretreatment approach, a classifier was trained to obtain characteristics of the post-treatment plot to distinguish between responders (CR/PR/durable SD) and non-responders. The analysis was performed by contouring 104 lesions: 62 lymph nodes, 24 lung metastasis, and 18 renal or adrenal metastases. Nineteen patients were responders, and eight patients were non-responders. Lesions contoured for analysis included lymph node metastases (60%), lung metastases (23%), and renal/adrenal metastases (17%). The median progression-free survival and overall survival for responders were 14 months and 28.8 months, respectively, while for non-responders they were 3.7 months and 16.3 months, respectively (median progression-free survival: p < 0.0001; overall survival: p = 0.13).
Texture analysis demonstrated poor ability to predict nivolumab responders from non-responders, with 69% overall accuracy for baseline CT scans (AUC = 0.46, p = 0.30) and with 66% overall accuracy on the first post-treatment CT scans (AUC = 0.51, p = 0.40) [31].
Khene et al. [34], through CT texture analysis, evaluated the prediction of progression-free survival and overall survival in mRCC patients treated with nivolumab [34]. Forty-eight patients were included in the study, 45% of whom were in the intermediate IMDC group. At initial diagnosis, 55% of patients had metastases and 79% of patients had undergone nephrectomy prior to receiving nivolumab treatment. Metastases were predominantly located in the lymph nodes, lungs, bones, liver, and adrenal glands (58%, 42%, 37%, 31%, and 25%, respectively). The progression-free survival was 5.7 months, while overall survival was 13.8 months. Nine patients (18.7%) showed PR, twenty patients (41.7%) showed SD, and nineteen patients (39.6%) showed PD. The Lasso-penalized Cox regression analysis revealed three texture parameters as potential predictors of progression-free survival (skewness, S.2.2. Correlat and vS.1.1. Sum Varnc). Skewness was confirmed as an independent predictor of progression-free survival by multivariate Cox regression analysis (HR (95% CI) 1.49 [1.21–1.85], p < 0.001). The Lasso penalized Cox regression analysis also detected three texture parameters as potential predictors of overall survival (S20SumVarnc, S22Contrast, and S22Entropy). S22Entropy was confirmed as an independent predictor of overall survival by multivariate Cox regression analysis (HR (95% CI) 1.68 (1.31–2.14), p < 0.001). This study showed promising results in predicting oncological outcomes by radiomic analysis in mRCC patients treated with nivolumab [34].
Khene et al. [35] performed a radiomic analysis to predict tumor response in mRCC patients treated with nivolumab [35]. Forty-eight patients—the same group of patients as in the previously described study—were included in the study, 46 (95%) of whom had previously received VEGF inhibitor treatment, and 39 patients (60.4%) were considered responders according to the RECIST 1.1 criteria. The k-nearest neighbor, support-vector machine based on linear kernel, random forest, and logistic regression predictive models were built using four supervised machine learning algorithms. Radiomic analysis demonstrated the accuracy scores of the k-nearest neighbor, random forest, logistic regression, and support-vector machine predictive models to be 0.82, 0.71, 0.91, and 0.81, respectively, with area under the receiver operating characteristic curve scores of 0.79, 0.67, 0.92, and 0.71, respectively. The results of this study were promising for the identification of responders by pretreatment radiomic analysis, demonstrating how the model could predict response to treatment in over 90% of patients [35].
Park et al. [11] conducted a radiomic analysis to predict oncological outcomes in mRCC patients treated with ICIs [11]. Sixty-eight patients were included in this study, most of whom were categorized as being in the intermediate IMDC risk group (n = 39; 57.4%), followed by poor IMDC risk (n = 20; 29.4%) and favorable IMDC risk (n = 9; 13.2%). The median overall survival was 21.5 months (95% CI, 10.5–32.5 months), while the median progression-free survival was 5.2 months (2.0–8.4 months). CT texture analysis was performed on 298 lesions of 68 patients, including lymph node (n = 97; 32.6%), pulmonary (n = 51; 17.1%), hepatic (n = 41; 13.8%), peritoneal (n = 40; 13.4%), adrenal (n = 22; 7.4%), renal (n = 17; 5.7%), pancreatic (n = 11; 3.7%), intramuscular (n = 10; 3.4%), and pleural (n = 9; 3.0%) lesions. From the training datasets, a median threshold survival index was obtained to classify patients as high-risk and low-risk. The baseline texture model showed a median overall survival of 60.1 months in the low-risk group (95% CI, 19.6–not reached) and 17.0 months in the high-risk group (95% CI, 11.9–32.8) (p = 0.048), while the follow-up texture model showed a median overall survival of 40.3 months in the low-risk group (95% CI, 21.7–not reached) and 15.2 months in the high-risk group (95% CI, 11.1–32.3) (p = 0.008). The baseline texture model managed to distinguish shorter from longer progression-free survival patients, while the follow-up texture models failed. The baseline texture model showed a median progression-free survival of 5.2 months in the low-risk group (95% CI, 3.6–23.8) and 2.8 months in the high-risk group (95% CI, 1.7–7.6) (p = 0.003), while the follow-up texture model showed a median progression-free survival of 5.0 months in the low-risk group (95% CI, 3.5–11.9) and 3.6 months in the high-risk group (95% CI, 2.4–7.6) (p = 0.025).
In a subgroup of the 32 patients treated with ICI as a first-line therapy, the baseline texture model for overall survival and progression-free survival distinguished between longer-term survivors and shorter-term survivors (median OS, not reached vs. 16.8 months (95% CI, 2.9–30.7), p = 0.03; median PFS, 11.7 months (95% CI, 4.5–33.6) vs. 3.8 months (95% CI, 1.4–7.8), p = 0.004), while the follow-up texture models for overall survival distinguished between longer-term survivors and shorter-term survivors (median OS, 39.7 months vs. 9.8 months (95% CI, 0.1–19.5), p = 0.002), but not for progression-free survival (p = 0.53). Univariate analysis showed that the baseline and follow-up texture models had significant association with overall survival (HR, 2.05 [95% CI, 1.07–3.94] and 2.65 [95% CI, 1.38–5.11], respectively. Univariate analysis showed that the baseline texture models had significant associations with progression-free survival (HR, 1.84; 95% CI, 1.08–3.12), but not for the follow-up texture analysis (HR, 1.30; 95% CI, 0.77–2.19) [11].
These studies used CT texture analysis to predict tumor response and clinical outcomes, revealing conflicting results in the prediction of tumor response and consistent results regarding the evaluation of clinical outcomes. Further studies will investigate the role of radiomics not only in the prediction of tumor response, but also to estimate the risk of metastasis development or define tumor genomics, so that an enhanced pretreatment analysis can be decisive in choosing the right therapy. All of these studies had a level of evidence of 2. The data and results of clinical studies related to the RECIST criteria are summarized in Table 2.
Table 2.
Summary of CT predictive clinical studies related to radiomics in mRCC patients treated with ICIs.
3.3. Atypical Response Patterns
Wong et al. [36] evaluated CT manifestations of atypical responses in mRCC patients treated with ICIs [36]. Fifteen patients were treated with ipilimumab–nivolumab, while 31 patients received single-agent ICI (nivolumab or pembrolizumab) treatment. Most patients were nephrectomized and had the histological variant ccRCC. Moreover, 56.5% of patients underwent concurrent radiotherapy. Most patients (80.4%) fell into the intermediate and poor IMDC risk groups. Twenty-four patients (52.2%) showed an atypical response pattern, while eighteen patients (39.1%) experienced multiple atypical response patterns. Pseudoprogression was found in 15 patients (32.6%), dissociated responses in 22 patients (47.8%), and abscopal responses in 9 patients (19.6%). Five patients showed a late response (10.9%), and in two patients there was evidence of durable control of disease after cessation of ICI therapy. Serial pseudoprogression was observed in four patients with pseudoprogression (8.7%) and in one patient with symptomatic pseudoprogression (2.2%). Serial pseudoprogression was observed when comparing metastases of different organs, as well as metastases of the same organ. In most of the patients, isolated abscopal responses were found in one or two lesions, while two patients showed more abscopal responses in the lungs and liver. Other interesting immune phenomena observed included immune-related ileitis and pneumonia [36]. It is interesting to note how artificial intelligence can be decisive in the differential diagnosis of ICI-related pneumonia from other etiological agents [37].
This study demonstrated how atypical response patterns have a high incidence in mRCC patients receiving ICIs. Knowledge of the atypical response to ICIs in mRCC patients is of fundamental importance for radiologists, to give a correct interpretation of response to therapy together with prompt recognition of possible side effects. The level of evidence of this study was 2. Knowledge of these patterns is crucial for patient management and for improvement of clinical outcomes.
3.4. Body Composition
Martini et al. [38] investigated the body composition of 79 mRCC patients treated with ICIs for the evaluation of clinical outcomes through retrospective analysis [38]. Skeletal muscle, subcutaneous, intermuscular, and visceral adipose tissue densities were measured and converted to indices by dividing by height (m)2; the total adipose tissue index was obtained from the sum of these indices. Most patients (59.5%) received ICI monotherapy, while the remaining patients were treated with the ICI combination regimen. Furthermore, most of the patients had intermediate (54%) and poor (30%) IMDC risk criteria. Multivariate Cox analysis found that patients with a low total fat index had a significantly lower overall survival (HR: 2.72, CI: 1.43–5.17, p = 0.002), a significantly lower progression-free survival (HR: 1.91, CI: 1.09–3.35, p = 0.025), and a lower chance of clinical benefit (OR: 0.25, CI: 0.09–0.70, p = 0.008). Kaplan–Meier analysis showed that patients with a higher total fat index had significantly higher overall survival and progression-free survival than patients with a low total fat index (44.5 vs. 14.1 months, p = 0.0012 and 8.4 vs. 2.9 months, p = 0.0015, respectively). Furthermore, the total fat index, compared to IMDC and body mass index, presented higher C-statistics for predicting overall survival, progression-free survival, and clinical benefit [38].
Ueki et al. [39] investigated the association between sarcopenia and nivolumab response in 96 mRCC patients [39]. Sarcopenia was assessed by measuring the skeletal muscle index (SMI) and psoas muscle index (cm2/m2) = ([skeletal muscle cross-sectional area at the level of L3]/[height]2). Most patients were treated with TKIs as prior therapy. Furthermore, most patients were categorized according to intermediate and poor IMDC risk criteria (54.2% and 41.7%, respectively). In relation to the skeletal muscle index, 71 patients presented sarcopenia (74%), while 24 patients were not sarcopenic (26%); meanwhile, considering the psoas muscle index, 33 patients presented sarcopenia (34.4%), and 63 patients were not sarcopenic (65.6%). Despite large discrepancies in the assessment of sarcopenia, a correlation was found between the two indices (r = 0.488; 95% confidence interval (CI), 0.319–0.627; p < 0.001). Patients with psoas-muscle-index-based sarcopenia had shorter median overall survival (10.1 months vs. 48.4 months, p < 0.001) and shorter progression-free survival (1.9 months vs. 8.3 months, p < 0.001). In addition, multivariate analysis identified psoas-muscle-index-based sarcopenia as a significant and independent predictor of overall survival (hazard ratio (HR), 3.85; 95% CI, 2.04–7.26; p < 0.001) and poor IMDC risk status (HR, 1.90; 95% CI, 1.03–3.50; p = 0.041). Skeletal-muscle-index-based sarcopenia was not associated with overall survival in this study [39].
Since a high body mass index can lead to better outcomes of ICIs in mccRCC patients, Ged et al. [40] evaluated the body composition in this category of patients [40]. Body mass index and various body composition parameters (i.e., SMI and multiple adiposity indices) acquired from pretreatment CT scans of 205 mccRCC patients were evaluated. Response to therapy was assessed using RECIST v1.1. Whole-transcriptome patterns with body composition patterns were also evaluated on a separate cohort of 62 primary tumor samples. Patients with a high body mass index had higher overall survival than normal-weight patients (unadjusted HR, 0.66; 95% confidence interval (CI), 0.45–0.97; p = 0.035). Of the body composition variables, only SMI was associated with overall survival (unadjusted HR comparing low vs. high SMI, 1.65 (95% CI: 1.13–2.43); p = 0.009); this association, however, became insignificant after adjusting for IMDC score and line of therapy. Increased angiogenic, inflammatory, and myeloid signals were detected in tumors of low-SMI patients [40].
These studies demonstrate that body composition imaging is an important and active field of research with regard to clinical outcomes in mRCC patients treated with ICIs. Indeed, it has been demonstrated that reduced amounts of adipose tissue and muscle mass are associated with worse clinical outcomes. All of these studies had a level of evidence of 2. Future studies, with CT and MRI, will shed light on the complex relationships between body composition, clinical outcome, and genetic profile in mRCC [41,42].
4. Conclusions
The present literature review summarizes the role of CT in the evaluation of ICIs’ effects in mRCC patients. Several CT-imaging-derived data might be helpful to optimize clinical outcomes in mRCC patients, possibly assuming a key role in patient management. The application of the iRECIST 1.1 criteria to CT imaging allows the evaluation of therapeutic approaches, as well as the recognition of atypical response patterns and different responses to ICIs according to the site of metastasis. Artificial intelligence, CT texture analysis, and body composition are advanced imaging post-processing techniques with the potential to impact clinical outcomes. Radiomics associated with artificial intelligence can enable the automatic and fast acquisition of several data, possibly helping in the tailored management of the individual patient. From the point of view of precision medicine, these techniques might represent a step forward towards personalized treatment for each individual mRCC patient.
Author Contributions
Conceptualization, F.G. and C.A.M.; Methodology, F.G. and C.A.M.; Software, F.G. and C.A.M.; Validation, F.G. and C.A.M.; Formal Analysis, F.G., G.D.G. and C.A.M.; Investigation, F.G. and C.A.M.; Resources, F.G. and C.A.M.; Data Curation, F.G. and C.A.M.; Writing—Original Draft Preparation, F.G. and C.A.M.; Writing—Review and Editing, all authors.; Visualization, F.G. and C.A.M.; Supervision, F.G., C.A.M., G.D.G. and B.B.Z.; Project Administration, F.G. and C.A.M. All authors have read and agreed to the published version of the manuscript.
Funding
No funding has been used for the realization of this work.
Institutional Review Board Statement
Not applicable.
Informed Consent Statement
Not applicable.
Data Availability Statement
Not applicable.
Conflicts of Interest
The authors declare no conflict of interest.
References
- Siegel, R.L.; Miller, K.D.; Fuchs, H.E.; Jemal, A. Cancer statistics, 2022. CA Cancer J. Clin. 2022, 72, 7–33. [Google Scholar] [CrossRef] [PubMed]
- Escudier, B.; Porta, C.; Schmidinger, M.; Rioux-Leclercq, N.; Bex, A.; Khoo, V.; Gruenwald, V.; Gillessen, S.; Horwich, A. Renal cell carcinoma: ESMO Clinical Practice Guidelines for diagnosis, treatment and follow-up. Ann. Oncol. 2019, 30, 706–720. [Google Scholar] [CrossRef] [PubMed]
- Zhuang, T.Z.; Case, K.; Olsen, T.A.; Brown, J.T.; Carthon, B.C.; Kucuk, O.; Goldman, J.; Harris, W.; Bilen, M.A.; Nazha, B. Metastatic Clear-Cell Renal Cell Carcinoma in the Era of Immune Checkpoint Inhibitors: Therapies and Ongoing Trials. Cancers 2022, 14, 2867. [Google Scholar] [CrossRef] [PubMed]
- Heng, D.Y.C.; Xie, W.; Regan, M.M.; Warren, M.A.; Golshayan, A.R.; Sahi, C.; Eigl, B.J.; Ruether, J.D.; Cheng, T.; North, S.; et al. Prognostic Factors for Overall Survival in Patients with Metastatic Renal Cell Carcinoma Treated with Vascular Endothelial Growth Factor–Targeted Agents: Results from a Large, Multicenter Study. J. Clin. Oncol. 2009, 27, 5794–5799. [Google Scholar] [CrossRef] [PubMed]
- Surveillance, Epidemology, and End Results Program. Cancer Stat Facts: Kidney and Renal Pelvis Cancer. Available online: https://seer.cancer.gov/statfacts/html/kidrp.html (accessed on 17 October 2021).
- Pignon, J.C.; Jegede, O.; Shukla, S.A.; Braun, D.A.; Horak, C.E.; Wind-Rotolo, M.; Ishii, Y.; Catalano, P.J.; Grosha, J.; Flaifel, A.; et al. irRECIST for the evaluation of candidate biomarkers of response to nivolumab in metastatic clear cell renal cell carcinoma: Analysis of a phase II prospective clinical trial. Clin. Cancer Res. 2019, 25, 2174–2184. [Google Scholar] [CrossRef] [PubMed]
- Flaifel, A.; Xie, W.; Braun, D.A.; Ficial, M.; Bakouny, Z.; Nassar, A.H.; Jennings, R.B.; Escudier, B.; George, D.J.; Motzer, R.J.; et al. PD-L1 expression and clinical outcomes to cabozantinib, everolimus, and sunitinib in patients with metastatic renal cell carcinoma: Analysis of the randomized clinical trials METEOR and CABOSUN. Clin. Cancer Res. 2019, 25, 6080–6088. [Google Scholar] [CrossRef]
- Miao, D.; Margolis, C.A.; Gao, W.; Voss, M.H.; Li, W.; Martini, D.J.; Norton, C.; Bossé, D.; Wankowicz, S.M.; Cullen, D.; et al. Genomic correlates of response to immune checkpoint therapies in clear cell renal cell carcinoma. Science 2018, 359, 801–806. [Google Scholar] [CrossRef]
- Motzer, R.J.; Robbins, P.B.; Powles, T.; Albiges, L.; Haanen, J.B.; Larkin, J.; Mu, X.J.; Ching, K.A.; Uemura, M.; Pal, S.K.; et al. Avelumab plus axitinib versus sunitinib in advanced renal cell carcinoma: Biomarker analysis of the phase 3 JAVELIN Renal 101 trial. Nat. Med. 2020, 26, 1733–1741. [Google Scholar] [CrossRef]
- Tannir, N.M.; Signoretti, S.; Choueiri, T.K.; McDermott, D.F.; Motzer, R.J.; Flaifel, A.; Pignon, J.C.; Ficial, M.; Frontera, O.A.; George, S.; et al. Efficacy and safety of nivolumab plus ipilimumab versus sunitinib in first-line treatment of patients with advanced sarcomatoid renal cell carcinoma. Clin. Cancer Res. 2021, 27, 78–86. [Google Scholar] [CrossRef]
- Park, H.J.; Qin, L.; Bakouny, Z.; Krajewski, K.M.; Van Allen, E.M.; Choueiri, T.K.; Shinagare, A.B. Computed Tomography Texture Analysis for Predicting Clinical Outcomes in Patients with Metastatic Renal Cell Carcinoma Treated With Immune Checkpoint Inhibitors. Oncologist 2022, 27, 389–397. [Google Scholar] [CrossRef]
- Greco, F.; Cirimele, V.; Mallio, C.A.; Beomonte Zobel, B.; Grasso, R.F. Increased visceral adipose tissue in male patients with clear cell renal cell carcinoma. Clin. Cancer Investig. J. 2018, 7, 132–136. [Google Scholar] [CrossRef]
- Greco, F.; Mallio, C.A.; Cirimele, V.; Grasso, R.F.; Beomonte Zobel, B. Subcutaneous adipose tissue as a biomarker of pancreatic cancer: A pilot study in male patients. Clin. Cancer Investig. J. 2019, 8, 114–118. [Google Scholar] [CrossRef]
- Lee, E.K.; Dickstein, R.J.; Kamta, A.M. Imaging of urothelial cancers: What the urologist needs to know. AJR Am. J. Roentgenol. 2011, 196, 1249–1254. [Google Scholar] [CrossRef] [PubMed]
- Bagheri, M.H.; Ahlman, M.A.; Lindenberg, L.; Turkbey, B.; Lin, J.; Cahid Civelek, A.; Malayeri, A.A.; Agarwal, P.K.; Choyke, P.L.; Folio, L.R.; et al. Advances in medical imaging for the diagnosis and management of common genitourinary cancers. Urol. Oncol. 2017, 35, 473–491. [Google Scholar] [CrossRef]
- Brufau, B.P.; Cerqueda, C.S.; Villalba, L.B.; Izquierdo, R.S.; González, B.M.; Molina, C.N. Metastatic renal cell carcinoma: Radiologic findings and assessment of response to targeted antiangiogenic therapy by using multidetector CT. Radiographics 2013, 33, 1691–1716. [Google Scholar] [CrossRef]
- Bianchi, M.; Sun, M.; Jeldres, C.; Trinh, Q.D.; Briganti, A.; Tian, Z.; Schmitges, J.; Graefen, M.; Perrotte, P.; Menon, M. Distribution of metastatic sites in renal cell carcinoma: A population-based analysis. Ann. Oncol. 2012, 23, 973–980. [Google Scholar] [CrossRef]
- Queirolo, P.; Spagnolo, F. Atypical responses in patients with advanced melanoma, lung cancer, renal-cell carcinoma and other solid tumors treated with anti-PD-1 drugs: A systematic review. Cancer Treat. Rev. 2017, 59, 71–78. [Google Scholar] [CrossRef]
- Siefker-Radtke, A.; Curti, B. Immunotherapy in metastatic urothelial carcinoma: Focus on immune checkpoint inhibition. Nat. Rev. Urol. 2018, 15, 112–124. [Google Scholar] [CrossRef]
- Champiat, S.; Dercle, L.; Ammari, S.; Massard, C.; Hollebecque, A.; Postel-Vinay, S.; Chaput, N.; Eggermont, A.; Marabelle, A.; Soria, J.C.; et al. Hyperprogressive Disease Is a New Pattern of Progression in Cancer Patients Treated by Anti-PD-1/PD-L1. Clin. Cancer Res. 2017, 23, 1920–1928. [Google Scholar] [CrossRef]
- Trebeschi, S.; Drago, S.G.; Birkbak, N.J.; Kurilova, I.; Cǎlin, A.M.; Delli Pizzi, A.; Lalezari, F.; Lambregts, D.M.J.; Rohaan, M.W.; Parmar, C.; et al. Predicting response to cancer immunotherapy using noninvasive radiomic biomarkers. Ann. Oncol. 2019, 30, 998–1004. [Google Scholar] [CrossRef]
- Navani, V.; Ernst, M.; Wells, J.C.; Yuasa, T.; Takemura, K.; Donskov, F.; Basappa, N.S.; Schmidt, A.; Pal, S.K.; Meza, L.; et al. Imaging Response to Contemporary Immuno-oncology Combination Therapies in Patients with Metastatic Renal Cell Carcinoma. JAMA Netw. Open 2022, 5, e2216379. [Google Scholar] [CrossRef]
- Eisenhauer, E.A.; Therasse, P.; Bogaerts, J.; Schwartz, L.H.; Sargent, D.; Ford, R.; Dancey, J.; Arbuck, S.; Gwyther, S.; Mooney, M.; et al. New response evaluation criteria in solid tumours: Revised RECIST guideline (version 1.1). Eur. J. Cancer 2009, 45, 228–247. [Google Scholar] [CrossRef] [PubMed]
- Mushti, S.L.; Mulkey, F.; Sridhara, R. Evaluation of overall response rate and progression-free survival as potential surrogate endpoints for overall survival in immunotherapy trials. Clin. Cancer Res. 2018, 24, 2268–2275. [Google Scholar] [CrossRef] [PubMed]
- Navani, V.; Graves, M.C.; Bowden, N.A.; Van Der Westhuizen, A. Immune checkpoint blockade in solid organ tumours: Choice, dose and predictors of response. Br. J. Clin. Pharmacol. 2020, 86, 1736–1752. [Google Scholar] [CrossRef] [PubMed]
- Jajodia, A.; Goel, V.; Patnaik, N.; Pasricha, S.; Gupta, G.; Batra, U.; Talwar, V. Analysis of Spatial Heterogeneity of Responses in Metastatic Sites in Renal Cell Carcinoma Patients Treated with Nivolumab. Tomography 2022, 8, 1363–1373. [Google Scholar] [CrossRef]
- Seymour, L.; Bogaerts, J.; Perrone, A.; Ford, R.; Schwartz, L.H.; Mandrekar, S.; Lin, N.U.; Litière, S.; Dancey, J.; Chen, A.; et al. iRECIST: Guidelines for response criteria for use in trials testing immunotherapeutics. Lancet Oncol. 2017, 18, e143–e152. [Google Scholar] [CrossRef]
- Zheng, B.; Shin, J.H.; Li, H.; Chen, Y.; Guo, Y.; Wang, M. Comparison of Radiological Tumor Response Based on iRECIST and RECIST 1.1 in Metastatic Clear-Cell Renal Cell Carcinoma Patients Treated with Programmed Cell Death-1 Inhibitor Therapy. Korean J. Radiol. 2021, 22, 366–375. [Google Scholar] [CrossRef]
- Hermansen, C.K.; Donskov, F. Outcomes based on age in patients with metastatic renal cell carcinoma treated with first line targeted therapy or checkpoint immunotherapy: Older patients more prone to toxicity. J Geriatr. Oncol. 2021, 12, 827–833. [Google Scholar] [CrossRef]
- Lambin, P.; Rios-Velazquez, E.; Leijenaar, R.; Carvalho, S.; van Stiphout, R.G.; Granton, P.; Zegers, C.M.; Gillies, R.; Boellard, R.; Dekker, A.; et al. Radiomics: Extracting more information from medical images using advanced feature analysis. Eur. J. Cancer 2012, 48, 441–446. [Google Scholar] [CrossRef]
- Malone, E.R.; Sim, H.W.; Stundzia, A.; Pierre, S.; Metser, U.; O’Malley, M.; Sacher, A.G.; Sridhar, S.S.; Hansen, A.R. Predictive radiomics signature for treatment response to nivolumab in patients with advanced renal cell carcinoma. Can. Urol. Assoc. J. 2022, 16, E94–E101. [Google Scholar] [CrossRef]
- Greco, F.; Mallio, C.A. Artificial intelligence and abdominal adipose tissue analysis: A literature review. Quant. Imaging Med. Surg. 2021, 11, 4461–4474. [Google Scholar] [CrossRef] [PubMed]
- Greco, F.; Salgado, R.; Van Hecke, W.; Del Buono, R.; Parizel, P.M.; Mallio, C.A. Epicardial and pericardial fat analysis on CT images and artificial intelligence: A literature review. Quant. Imaging Med. Surg. 2022, 12, 2075–2089. [Google Scholar] [CrossRef]
- Khene, Z.E.; Kokorian, R.; Mathieu, R.; Gasmi, A.; Nathalie, R.L.; Solène-Florence, K.J.; Shariat, S.; de Crevoisier, R.; Laguerre, B.; Bensalah, K. Metastatic clear cell renal cell carcinoma: Computed tomography texture analysis as predictive biomarkers of survival in patients treated with nivolumab. Int. J. Clin. Oncol. 2021, 26, 2087–2093. [Google Scholar] [CrossRef] [PubMed]
- Khene, Z.E.; Mathieu, R.; Peyronnet, B.; Kokorian, R.; Gasmi, A.; Khene, F.; Rioux-Leclercq, N.; Kammerer-Jacquet, S.F.; Shariat, S.; Laguerre, B.; et al. Radiomics can predict tumour response in patients treated with Nivolumab for a metastatic renal cell carcinoma: An artificial intelligence concept. World J. Urol. 2021, 39, 3707–3709. [Google Scholar] [CrossRef]
- Wong, A.; Vellayappan, B.; Cheng, L.; Zhao, J.J.; Muthu, V.; Asokumaran, Y.; Low, J.L.; Lee, M.; Huang, Y.Q.; Kumarakulasinghe, N.B.; et al. Atypical Response Patterns in Renal Cell Carcinoma Treated with Immune Checkpoint Inhibitors-Navigating the Radiologic Potpourri. Cancers 2021, 13, 1689. [Google Scholar] [CrossRef] [PubMed]
- Mallio, C.A.; Napolitano, A.; Castiello, G.; Giordano, F.M.; D’Alessio, P.; Iozzino, M.; Sun, Y.; Angeletti, S.; Russano, M.; Santini, D.; et al. Deep Learning Algorithm Trained with COVID-19 Pneumonia Also Identifies Immune Checkpoint Inhibitor Therapy-Related Pneumonitis. Cancers 2021, 13, 652. [Google Scholar] [CrossRef]
- Martini, D.J.; Olsen, T.A.; Goyal, S.; Liu, Y.; Evans, S.T.; Magod, B.; Brown, J.T.; Yantorni, L.; Russler, G.A.; Caulfield, S.; et al. Body Composition Variables as Radiographic Biomarkers of Clinical Outcomes in Metastatic Renal Cell Carcinoma Patients Receiving Immune Checkpoint Inhibitors. Front. Oncol. 2021, 11, 707050. [Google Scholar] [CrossRef]
- Ueki, H.; Hara, T.; Okamura, Y.; Bando, Y.; Terakawa, T.; Furukawa, J.; Harada, K.; Nakano, Y.; Fujisawa, M. Association between sarcopenia based on psoas muscle index and the response to nivolumab in metastatic renal cell carcinoma: A retrospective study. Investig. Clin. Urol. 2022, 4, 415–424. [Google Scholar] [CrossRef]
- Ged, Y.; Sanchez, A.; Patil, S.; Knezevic, A.; Stein, E.; Petruzella, S.; Weiss, K.; Duzgol, C.; Chaim, J.; Akin, O.; et al. Associations between Pretreatment Body Composition Features and Clinical Outcomes among Patients with Metastatic Clear Cell Renal Cell Carcinoma Treated with Immune Checkpoint Blockade. Clin. Cancer Res. 2022, 28, 5180–5189. [Google Scholar] [CrossRef]
- Quattrocchi, C.C.; Giona, A.; Di Martino, A.; Gaudino, F.; Mallio, C.A.; Errante, Y.; Occhicone, F.; Vitali, M.A.; Beomonte Zobel, B.; Denaro, V. Lumbar subcutaneous edema and degenerative spinal disease in patients with low back pain: A retrospective MRI study. Musculoskelet. Surg. 2015, 99, 159–163. [Google Scholar] [CrossRef]
- Greco, F.; Mallio, C.A. Relationship between visceral adipose tissue and genetic mutations (VHL and KDM5C) in clear cell renal cell carcinoma. Radiol. Med. 2021, 126, 645–651. [Google Scholar] [CrossRef] [PubMed]


Disclaimer/Publisher’s Note: The statements, opinions and data contained in all publications are solely those of the individual author(s) and contributor(s) and not of MDPI and/or the editor(s). MDPI and/or the editor(s) disclaim responsibility for any injury to people or property resulting from any ideas, methods, instructions or products referred to in the content. |
© 2023 by the authors. Licensee MDPI, Basel, Switzerland. This article is an open access article distributed under the terms and conditions of the Creative Commons Attribution (CC BY) license (https://creativecommons.org/licenses/by/4.0/).