Abstract
Small end bearings are a critical component of reciprocating engines, and the performance of their lubrication performance directly affects engines’ reliability and mechanical efficiency. There are many factors that influence their lubrication. A new type of small-end bearing test rig was developed to reveal key influencing factors and their influence on lubrication characteristics, and a multi-body dynamic model coupled with elastohydrodynamic (EHD) characteristics was built. The model was verified through experiments. In accordance with the orthogonal experimental requirements, the impact of various factors on small-end bearing lubrication characteristics was analyzed, and the results showed that: (1) minimal oil film thickness (MOFT), friction power, and maximum oil film pressure (MOFP) are the major evaluation indicators of small-end bearing lubrication, and the most significant influencing factors are the pin bushings’ clearance, engine speed, and bushing surface roughness; (2) increasing the clearance of the pin bushings can increase the hydrodynamic lubrication percentage and the average thickness of the oil film, but it also reduces the local minimum thickness of the oil film; (3) an increase in roughness can improve the MOFT and enhance its carrying capacity, but may also increase friction power; and (4) high speeds can increase the thickness of the oil film between the piston pin and bushing and improve lubrication status, but it also increases friction power on the asperity contact region, reducing mechanical efficiency. The research results can be used for the design of connecting rod small-end bearings to improve their mechanical efficiency and reliability.
1. Introduction
The connecting rod’s small-end bearing is one of the most important frictional joints in reciprocating engines. Part of the bushing is in the boundary lubrication regime, and the working conditions of the small-end bearing in the reciprocating engine are even more severe under extreme conditions, which can cause scuffing in the bushing and oil bore clogging, resulting in fatal accidents [1,2,3].
Because the small-end bearing is exposed to a harsh, high-temperature working environment and limited space in the reciprocating engine, it is difficult to measure and analyze its tribological or kinetic state directly. As a result, friction and wear test rigs have been used to conduct research and verify the friction and wear mechanisms. Therefore, it is of great theoretical significance and practical engineering value to study the lubrication characteristics and simulate the bearing with a friction and wear test rig.
Experimental research is defined as a direct method of analysing a research object, and it also serves as the basis for theoretical analysis. Experimental research is irreplaceable; however, because of the structure of reciprocating engines and their working condition constraints, friction and wear test rigs to simulate small-end bearings have become an alternative in research [4]. Various types of friction and wear test rigs are available for small-end bearings [5,6,7,8,9,10], but their kinematic sub-mechanisms differ from those of small-end bearings, and few studies have been conducted on small-end bearing test rigs. The current connecting rod–small-end bearing test rig mainly simulates the reciprocating motion of the piston in operation through a driven motor, providing a defined reciprocating motion to the tested part, whereas the pumping lubrication effect is simulated by a load applied to the piston pin via a hydraulic system. A swing piston pin and two loadable metal half-rings were designed by Etsion et al. [5] to simulate the oscillation of the piston pin relative to the bushing, and the load was imposed by the bushing. The test rig was used to measure parameters such as the rotation speed, loading pressure, and friction torque during the experiment. Liu et al. [2,6] developed a bushing structure based on this concept and analyzed the effects of various parameters on the increase in friction, temperature, and other characteristics. The motion of the piston pin or bushing in the above test rigs is based on the assumption of an idealized motion while ignoring the fact that in a real engine, the relative motion is determined by uncertain frictional forces, which are determined by the lubrication conditions. Therefore, it is difficult for the current test rigs to accurately reflect the friction state of the piston pin, and these rigs cannot fully reveal the lubrication and kinetic characteristics of the piston pin in real reciprocating engines. The abovementioned studies have not been combined with a multifactor theoretical analysis of EHD lubrication.
As the small-end bearing of the connecting rod falls under the category of journal bearings, the lubrication mechanism of its pair interface follows the hydrodynamic lubrication law. Small-end bearings can withstand a large load impact and large elastic deformation while exhibiting a low linear velocity during operation compared with large-end bearings or main bearings. These characteristics have a significant impact on hydrodynamic lubrication and asperity contact; therefore, they must be considered during the calculation and analysis. After Patir and Cheng applied the mean Reynolds equation to lubrication analysis, a number of theoretical studies considered the microscopic morphology between the two surfaces, the gap and influence of the lubricant [11,12], and the lubricant viscosity–pressure and viscosity–temperature effects [12,13,14], which improved the accuracy of the calculations. Ba [15] conducted an analysis of piston pin multi-body dynamics and examined the effects of different models on the calculations of lubrication characteristics, as well as the effects of piston pin stiffness and pin boss shape on lubrication characteristics. Using a small-end bearing EHD model, Chen et al. [16] compared and analyzed the effect of oil film lubrication on stress distribution to establish the importance of considering oil film lubrication in mechanical analysis. Fang et al. [17] established a multi-body dynamics model coupled with the EHD property of fully floating piston pin bearings to reveal the mechanism of friction reduction and scuffing resistance of these bearings. Furthermore, various studies have been conducted by different researchers regarding the factors affecting lubrication characteristics. Ravn et al. [18] analyzed small-end bearing clearance as a key parameter in multi-body dynamics modeling and lubrication performance analysis. Pioli et al. [19] demonstrated that the clearance between the piston pin and bushing must be considered when analyzing the reliability of connecting rods and generated a normalized parameter that includes the initial clearance and geometry to predict the peak stress within the pin boss. The effect of surface micromorphology on the Stribeck curve was examined by Galda et al. [20] to improve the lubrication and tribological characteristics of the small-end bearing by controlling the surface properties. Zhang et al. [21] developed a multi-body dynamics model of a small-end bearing considering the EHD characteristics and examined the effect of speed variation on the MOFT and friction power. Zhang et al. [22] established an EHD calculation model using the multi-body dynamics calculation method and conducted a multi-parameter sensitivity analysis to determine the main influencing factors of small=end bearings for certain types of engines. Cao et al. [23] conducted a piston pin parameter optimization analysis based on an EHD simulation with MOFT as the evaluation parameter. Bertocchi et al. [24] conducted a small-end bearing lubrication performance analysis of an engine connecting rod, and the results indicated that the small end of the connecting rod was primarily lubricated by the pumping effect of the oil film squeezed by the loaded piston pin. Based on a large number of studies, the clearance, roughness, and speed of the journal bearing are the primary parameters that influence the lubrication performance of the bearing [25,26,27,28,29,30,31,32,33]. Multiple factors must be considered when designing or analyzing. While the above studies provide a detailed analysis of the journal bearing, including the small-end bearing, from a theoretical point of view, direct experimental studies are still needed to verify the accuracy of the calculation models. In addition, a wide variety of factors influence the lubrication characteristics of the piston pins. However, in the aforementioned studies, only a few parameters were examined for journal bearings, and fewer factors were examined for the lubrication performance of small-end bearings. It is important to realize that there are several piston pin lubrication evaluation indices and influencing factors, and if a sensitivity analysis is conducted for a variety of evaluation indices and influencing factors, the number of calculations becomes huge, which consumes a considerable amount of time and resources.
To address the shortcomings of the current test rig, a new type of connecting rod small-end bearing test rig (hereinafter referred to as the test rig) was developed in this study. To simulate the motion of the piston pin in a real engine, the piston was constrained by a guide rail, which eliminated the spatial constraints of the combustion chamber and cylinder liner. The harsh operating conditions created by high-temperature gases can be eliminated using a spring to simulate the force of the cylinder pressure. The test rig eliminates the shortcomings of current rigs, in which the piston pin movement and lubrication conditions are predefined, which is different from a real engine. By adjusting the oil supply condition of the piston pin at the small end of the connecting rod and measuring the orbital path of the piston pin relative to the small-end bushing, an accurate understanding of the tribological and dynamic state parameters of the piston pin is possible.
To address the shortcomings of the simulation analysis, the accuracy of the multi-body dynamic model was verified through experimentation. Using orthogonal experimental requirements, the bearing lubrication and dynamics were evaluated for multiple parameters and influencing factors. To determine the relationship of each factor on different lubrication characteristic indices of small-end bearings, the calculation results of different evaluation indices were subjected to the range analysis method. Furthermore, the main influencing factors were analyzed to obtain the law of influence of the main influencing factors on the lubrication characteristics of small-end bearings.
The rest of this paper is organized as follows: Section 2 introduces two lubrication mechanisms for journal bearings and the computational model for frictional force. Section 3 presents a multi-body system dynamics model based on a test rig. In Section 4, the simulation results of the orthogonal experimental method are presented. Finally, Section 5 summarizes the findings of this study.
2. Basic Theory
2.1. Hydraulic Lubrication Model
The effect of roughness on the Reynolds equation is not negligible for two rough surfaces in the presence of a lubricant when the gap between the interfaces is of the same magnitude as the integrated roughness of the two surfaces. This effect is primarily reflected by the flow factors in the average Reynolds equation, as follows:
where Φx and Φy are the pressure flow factors in x and y directions, respectively; Φs
is the shear flow factor; σ is the integrated roughness between the two
surfaces; is the viscosity of the
lubricant; p is the oil pressure; u is the linear
velocity of the journal with respect to the bushing; is the
average value of the actual oil film thickness; h is the nominal oil
film thickness; and t is the time.
2.2. Asperity Contact Model
The load is shared by the lubricant oil film and asperities. Asperity interactions occur when the actual oil film thickness is sufficiently small. According to the Greenwood–Tripp rough contact theory [34], the asperity contact pressure and actual contact area are given by Equations (2) and (3), respectively:
where is the asperity density, β is the height or radius of asperity, E′ is the integrated Young’s
modulus, A is the nominal contact area, and H is the film
thickness ratio, which is calculated using Equation (6).
2.3. Friction Power
In the mixed-lubrication regime, hydrodynamic
lubrication effects had a significant impact on the friction coefficients. The
total friction coefficient is determined by combining
the body contact friction coefficient with the microscopic EHD
friction coefficient , which is expressed as
follows:
where is
the Coulomb friction coefficient; b and c are empirical values,
taken as 10,000 and 100, respectively; is the Sommerfeld
number; and is the asperity
contact ratio [35].
Because the load is shared by the lubricant and
asperities on the surfaces, friction power is also generated by the
hydrodynamic shear stress amid the fluid and the
contact shear stress from the metal-metal
contact, which is calculated as follows:
The total friction power is generated by the asperity contact shear stress and fluid shear stress in area A of the bearing bushing, as expressed by Equation (10).
3. Establishment of the Test Rig Calculation Model
3.1. Introduction of the Test Rig
The test rig consists of a power drive module, a test module, a loading module, and a lubricant supply system. Its structure is shown in Figure 1. Through the sprocket mechanism, the crankshaft rotates at a constant speed, and the crank linkage mechanism converts the rotation of the crankshaft into the reciprocating motion of the piston. The loading module consists of an adjusting handwheel and several springs. To simulate the actual working conditions of the piston linkage mechanism, the springs were compressed as the piston reciprocated along the guide rail. Under the rated operating conditions, the peak spring load was 80 kN. The test rig was equipped with a lubricant supply system, and the oil supply line to the small-end bushing ensured that the oil supply flow to the small-end bushing was adjustable during the experiment.
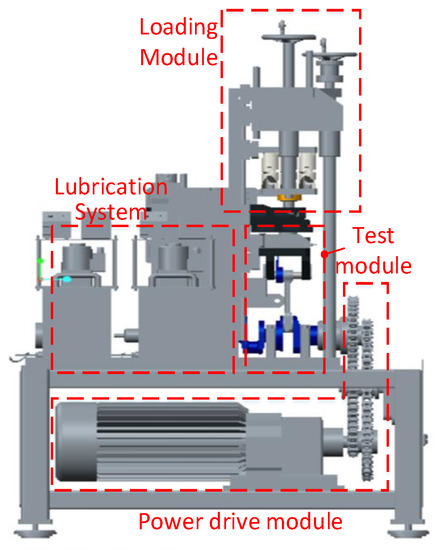
Figure 1.
Structure of the test rig.
The test module contained a piston, a piston pin, a connecting rod, and an orbital path-measuring device. Two eddy current displacement sensor probes were mounted on the same plane of the connecting rod bushing at a 90-degree angle, and the orbital path of the piston pin was measured relative to the connecting rod bushing. Figure 2 illustrates the test module structure, and Table 1 lists the structural parameters of the test rig.
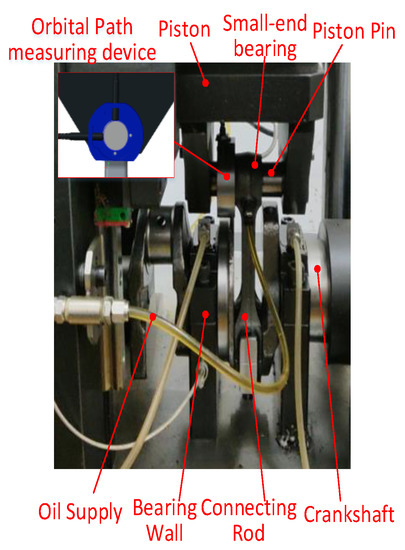
Figure 2.
Structure of the test module.

Table 1.
Structural parameters of the test rig.
3.2. Establishment of the Dynamic Model
3.2.1. Model Condensation
The finite element method (FEM) model of the test rig primarily includes the piston body, the connecting rod (including bushings at both the small and big ends), the crank pin, and the piston pin. Geometric features such as receding grooves, oil supply channels, and bores on journals or bushings, chamfers, and rounded corners on each structure were ignored in the geometric model, which has less influence on the dynamic characteristics, and material properties were assigned to each part after meshing was completed.
To improve the calculation efficiency, the free interface substructure method (Craig–Chang method) was used to determine the lubrication characteristics by solving the mean Reynolds equation. The FEM and condensed model comparisons of the piston, the piston pin, the connecting rod and the crank throw are presented in Table 2. The numbers of elements of the piston, connecting rod and piston pin are 167,734, 79,369, and 736,592, respectively. The retained DOFs of the condensed model are 4023, 2163, and 138, respectively. The damping of the parts was obtained according to the empirical value of the damping ratio in Rayleigh damping.
Table 2.
FEM and condensed models of main components.
3.2.2. Dynamics Model
Figure 3 illustrates the multi-body dynamics model for the test rig built using AVL EXCITE, which primarily comprises a piston, a piston pin, a connecting rod, and a crank throw, with the following main joints: (1) a joint between the piston and the guide rail to prevent the piston from moving laterally, simulating the horizontal constraint of the guide rail; (2) the EHD joints are established between the piston pin’s middle and the connecting rod bushing at the small end of the connecting rod to simulate the effect of the small-end bearing; (3) the two ends of the piston pin and the nodes of the inner surface of the piston pin boss are established separately as the EHD joint to simulate the effect of the piston pin boss; and (4) a nonlinear spring bearing joint is established between the big end of the connecting rod and the crank throw to simulate the constraint of the crank pin on the big end of the connecting rod.
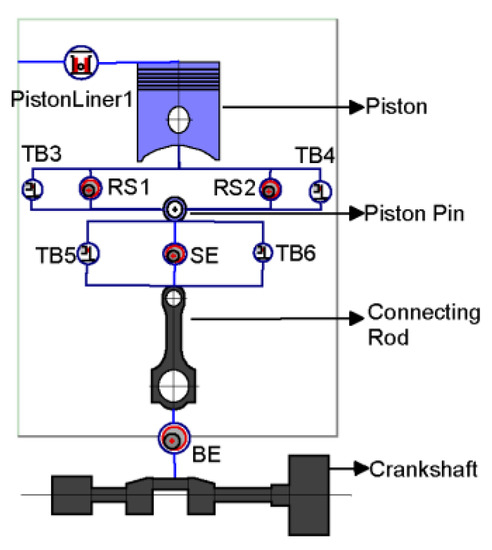
Figure 3.
Dynamic model of the test rig.
Using the aforementioned condensed model, the load shown in Figure 4 is applied to the top of the piston. Because the profiles of the main joint (bushing surface and pin boss on both sides) were deformed to some extent after the running-in process of the test rig, the profiles (piston pin boss and small-end bushing) were used as the profile patch to obtain the complete multi-body dynamics model (Figure 5).
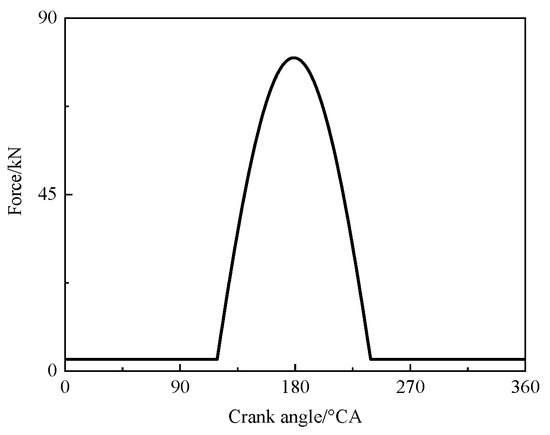
Figure 4.
Full load spring force.
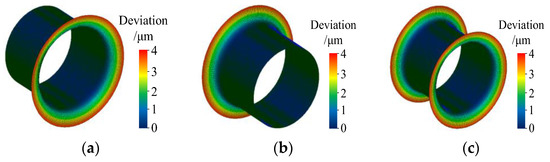
Figure 5.
(a) Profiles in left piston pin boss. (b) Profiles in right piston pin boss. (c) Profiles in small-end bushing.
3.2.3. Analysis Process
The EHD calculation of the piston pin bearing based on the dynamic substructure method requires coupling of the energy, mean Reynolds, elastic displacement, and load balance equations. The energy and elastic displacement equations were solved using the FEM, whereas the mean Reynolds equation was solved using the finite difference method. The difference mesh was determined by the main degree-of-freedom (DOF) node of the condensed model of the inner surface of the bearing bushings. In the calculation process, the oil film pressure (including the contact pressure generated by the asperity contact) was obtained by solving the average Reynolds equation and then substituting it into the elastic displacement equation to obtain the elastic displacement and oil film thickness of each node and iterating until convergence. Using this coupled solution method, the deformation of the journals and bearing bushings was fully considered, and the analysis flow is shown in Figure 6.
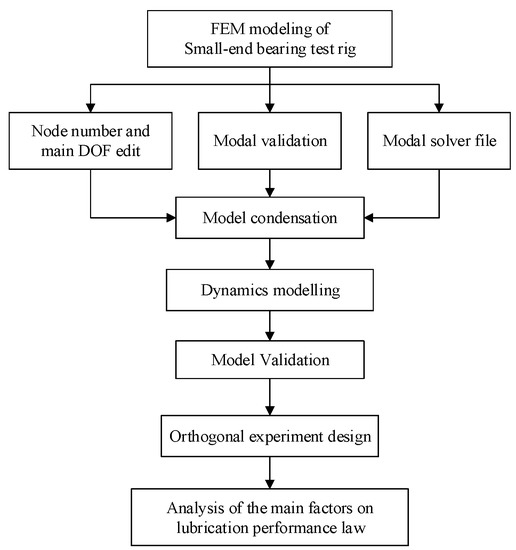
Figure 6.
Piston pin dynamics analysis.
4. Orthogonal Experiment Analysis
4.1. Model Validation and Orthogonal Experiment Analysis
A simulation analysis was carried out on the test rig. Table 3 lists the lubrication parameters of the original machine under the test conditions.
Table 3.
Lubrication parameters of the test rig.
Figure 7 illustrates the orbital paths of the experiment and the dynamics simulation. As shown in the figure, the load on the bushing of the connecting rod’s small end is mainly concentrated in the lower part, and the piston pin orbital path is also located in the lower part.
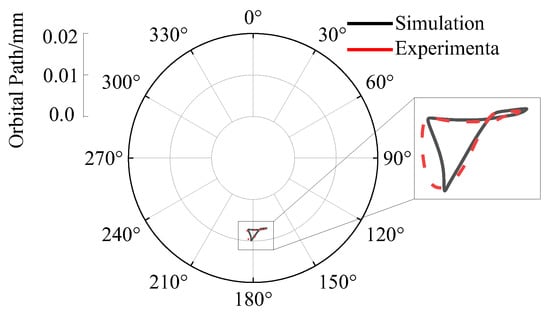
Figure 7.
Comparison of the experimental and calculated orbital paths.
The correlation coefficient is used to evaluate the similarity between the measured and calculated orbital paths and are calculated as follows:
where Cov(Z1, Z2) is the covariance of Z1 and Z2; Var(Z) is the variance of Z; x, y represent the horizontal and vertical coordinates of the two orbital paths, respectively; and the correlation between the measured and calculated orbital paths is 0.81. Because the orbital path mounting base is fixed to the small end of the connecting rod, there are evident macro-movements and impacts of the connecting rod during the operation. The micro-amplitude vibration of the base is inevitable, resulting in an error in the measurement of the orbital path. It should be noted that, in general, the two paths exhibit a strong correlation, which confirms the accuracy of the calculation model.
Figure 8 illustrates the friction power from the small-end bearing and piston pin boss on both sides. As shown in the figure, the friction power generated by the small-end bearing is much greater than that generated by the piston pin boss. Figure 9 illustrates the distribution of the total oil film pressure in the three bearings at maximum pressure, where the oil film pressure from the two pin bosses is on the upper bushing near the small end of the connecting rod, and the oil film pressure of the small-end bushing on both sides is on the lower part of the bushing.
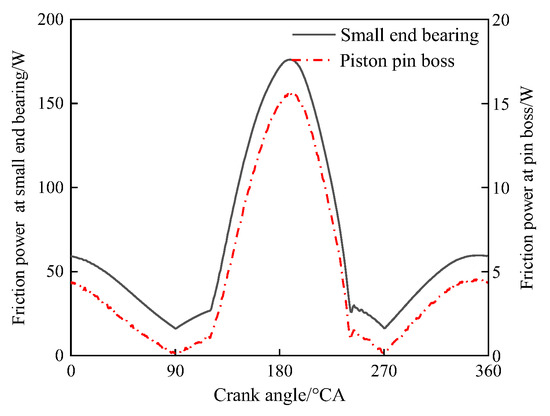
Figure 8.
Friction power of bushing and piston pin boss.
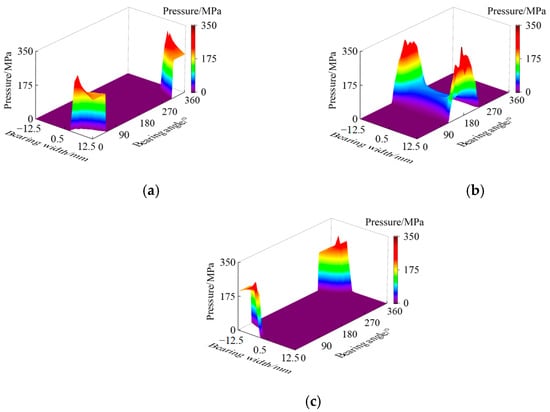
Figure 9.
(a) Oil film pressure distribution in left piston pin boss. (b) Oil film pressure distribution in small-end bushing. (c) Oil film pressure distribution in right piston pin boss.
In accordance with the previous section, the tribological characteristics of the bushing have the greatest impact on the performance of the entire machine, and only the lubrication performance of the bushing is analyzed in later sections. Based on the analysis of the piston pin lubrication characteristics, the final evaluation indexes were MOFT, maximum friction power, and MOFP. Research findings indicate that the influencing factors are A (oil temperature), B (oil supply pressure), C (surface roughness of bushing), D (surface roughness of journal), E (bearing clearance), and F (engine speed). There is a great deal of importance in determining the test level because if the amplitude of the level is too narrow, the results may not represent the expected result, whereas if the amplitude is too wide, the results may not be representative of the criteria. In this study, the level values are selected uniformly within the level range of the internal quantitative factors based on relevant research findings combined with engineering reality.
According to the design requirements of the
orthogonal experiment, , m = 3, k =
6, and N = 3, where L represents the orthogonal table, m indicates
the number of factor levels, k is the experimental influence factor, and
mN indicates the number of times the test is conducted. An
orthogonal experimental design reduces the number of experiments that would
otherwise be conducted from 36 to 27, thereby improving the
efficiency of the study. Table 4 lists
the influencing factors of the orthogonal experiment, and 6 factors with three
levels were considered. Table 5 presents
the simulation results of the orthogonal experiment. Figure 10 illustrates the comparison of the
influence of each factor and its level on the evaluation indices based on the
simulation results of the orthogonal method.
Table 4.
Orthogonal experiment table.
Table 5.
Simulation results based on orthogonal experiment.
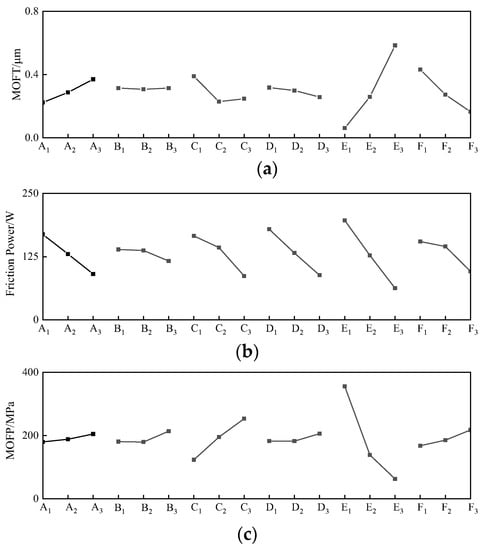
Figure 10.
(a) MOFT at different factors and levels. (b) Friction power at different factors and levels. (c) MOFP at different factors and levels.
A range analysis method was used to assess the size of the effect of each factor on the evaluation indices, and the range was calculated using Equation (14).
where is the maximum value of the
average MOFT, average friction power, and MOFP in the corresponding graph, and is the minimum value of the
average MOFT, average friction power, and MOFP in the corresponding graph. The
larger the range, the greater the influence of the factor on the evaluation
index.
This comparison indicates that the factors that influence MOFT from weak to strong are E (clearance), F (engine speed), C (bushing surface roughness), A (lubricant temperature), D (piston pin surface roughness), and B (oil supply pressure). From weak to strong, friction power is influenced by E (clearance), D (piston pin surface roughness), C (bushing surface roughness), A (lubricant temperature), F (engine speed), and B (oil supply pressure). The factors that influence the MOFP from weak to strong are E (clearance), C (bushing surface roughness), F (engine speed), B (oil supply pressure), A (lubricant temperature), and D (piston-pin surface roughness).
According to the above conclusions, to increase the analysis efficiency, clearance, bushing roughness, and engine speed were chosen as the influencing factors, and a suitable range of variables was chosen based on the engineering reality to further analyze the influence law of the main influencing factors on lubrication performance.
4.2. Influence of Clearance
The clearance is one of the most important factors affecting the bearing lubrication performance. Its empirical value is approximately one-thousandth of the bearing diameter. To consider the influence of different lubrication states as much as possible in the calculation, the bearing clearance was set as 0.02 mm, 0.04 mm, 0.06 mm, 0.08 mm, and 0.1 mm. We then calculated rough contact load ratios, minimum oil film thicknesses, and film thickness ratios under different bearing clearances and the trend of frictional power consumption with increasing clearances.
Figure 11 illustrates the change in asperity contact load percentage over one cycle under different clearance conditions. Considering the orbital path (Figure 7) and the oil film pressure distribution at maximum pressure (Figure 9), it can be seen that the piston pin load on the bushing is primarily concentrated at 180 °CA, corresponding to the orbital path close to the lower part of the bushing. Owing to its elasticity as well as the forces of the bushing and pin boss, the piston pin is bent, which results in asperity contact being primarily concentrated around the two bushing edges. As the clearance increases, the mean and maximum values of the asperity contact ratio decrease. This indicates that increasing the clearance within a certain range increased the overall hydrodynamic lubrication ratio.
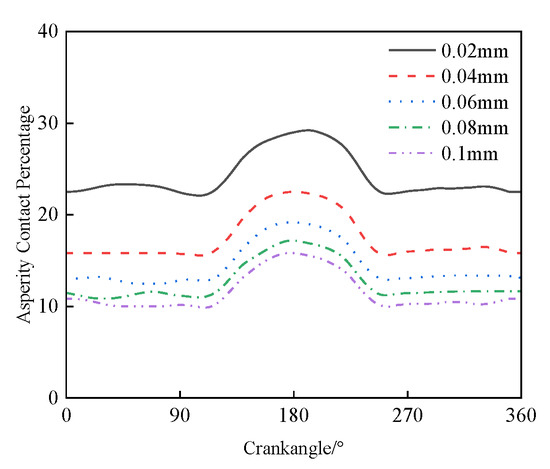
Figure 11.
Asperity contact load ratio at different clearances.
Figure 12 illustrates the MOFT trend during one cycle under different clearance conditions. According to the figure, MOFT decreases as the clearance increases, and the corresponding film thickness ratios are all considerably less than 3. This is because the MOFT is primarily concentrated at the maximum pressure moment and the lower part of the bushing on both sides, and its lubrication state is mainly subject to load and piston pin structure stiffness constraints. In conjunction with an increase in the clearance, the load-bearing capacity of the oil film decreased, thereby lowering the minimum thickness of the oil film at this location.
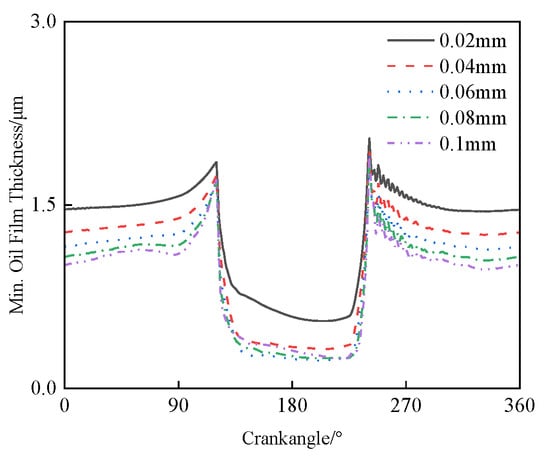
Figure 12.
MOFT at different clearances.
Figure 13 illustrates the trends of the friction power in one cycle under different clearance conditions. The friction power generated by hydrodynamic lubrication increased as the clearance increased, as shown in Figure 13a. This is mainly due to the increase in the hydrodynamic lubrication area with increasing clearance, as well as the increase in oil film thickness, which results in an increase in frictional power resulting from the oil film shear stress. When the spring does not work, the rough contact frictional power consumption decreases as the gap increases; however, at other moments, as the clearance increases, the MOFT decreases and the local friction coefficient increases, whereas the asperity contact area decreases, resulting in the friction power generated by the contact first increasing and then decreasing, as shown in Figure 13b. The main friction power of this model originates from hydrodynamic lubrication, and the increase in clearance corresponds to an increase in hydrodynamic lubrication throughout the cycle, whereas the rough contact frictional power consumption does not change significantly. Therefore, a comprehensive consideration of the MOFT friction power should ensure that the small-end bearing clearance is between 0.02 and 0.04 mm.
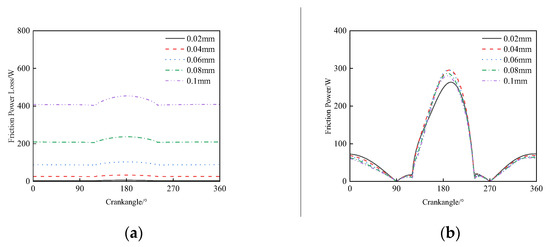
Figure 13.
(a) Hydrodynamics lubrication friction power at different clearances. (b) Asperity contact friction power at different clearances.
4.3. Influence of Roughness
The roughness of the bushing surface had a significant influence on the average Reynolds equation coefficient. It is recommended that the connecting rod bushing surface roughness not exceed 0.63, in accordance with the applicable standards. Meanwhile, to consider the influence of extreme working conditions, the range of bushing surface roughness was set to 0.1~0.9. Different bushing surface roughnesses were evaluated for their influence on asperity contact percentage, MOFT, film thickness ratios, and friction power consumption.
Figure 14 illustrates the trend of asperity contact percentage variation in one cycle under different bushing roughnesses, and Figure 15 shows the trend of the MOFT and film thickness ratio change in one cycle under different roughness conditions. As the roughness increased, the asperity contact ratio and average oil film thickness increased, whereas MOFT did not change significantly. The increase in roughness led to a slight increase in the average film thickness ratio; however, the minimum film thickness ratio showed a decreasing trend. When viewed in conjunction with the minimum oil film thickness ratio analysis, it can be seen that an increase in roughness raises the rough contact area at the maximum pressure crank angle but improves the flow of lubricant at other times. Because of the wedge effect, the average value of MOFT increased, but the increment in the film thickness ratio was slight, and the overall lubrication state changed slightly.
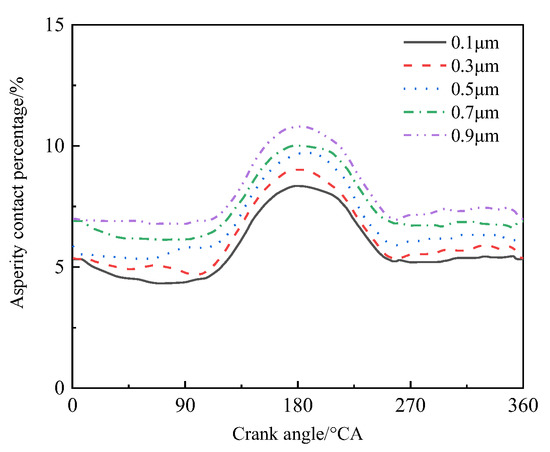
Figure 14.
Asperity contact percentage in different bushing roughnesses.
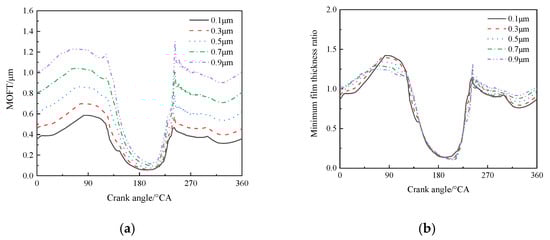
Figure 15.
(a) Bushing roughness influences MOFT. (b) Bushing roughness influences minimum oil film thickness ratio.
Figure 16 shows the variation in the friction power in one cycle under different bushing roughness conditions. Based on the comparison, it can be concluded that as the roughness increases, the MOFT increases, as does its bearing capacity. As the roughness increased, the asperity contact percentage increased, whereas the film thickness ratio remained almost the same, resulting in an increase in the power associated with the asperity friction generated by the piston pin bushing during spring compression.
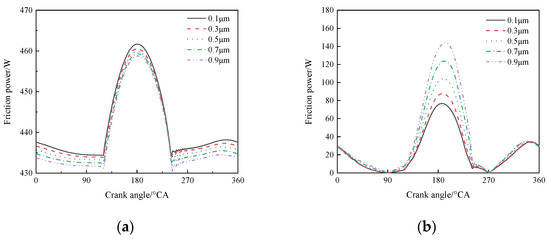
Figure 16.
(a) Hydrodynamic lubrication friction power in different bushing roughnesses. (b) Asperity contact friction power in different bushing roughnesses.
From the above analysis, it is evident that increasing the roughness within a specific range can improve the oil film carrying capacity but will not significantly improve the lubrication condition of the small-end bearing and, at the same time, will increase the friction power generated by the asperity contact. Accordingly, a small-end bushing should be designed with a suitable surface roughness based on the engine load and design requirements.
4.4. Influence of Rotational Speed
The rotational speed has a significant impact on the lubrication performance. Figure 17 shows the rotational speeds of the bushing and piston pin at different crankshaft speeds. As shown in the figure, the piston pin rotational speed increases with an increase in the crankshaft speed. As the piston moved upward, the bushing decelerated forward and reached the maximum speed when the crank pin was turned 90°. The rotation of the piston pin is driven by the bushing, and its speed gradually accelerates from the still state at the bottom dead center (BDC) and reaches the maximum speed near the midpoint of the stroke. It then decelerates and rests at the top dead center (TDC). During the upward motion of the piston, the piston pin was driven by a bushing to reverse its rotation. The piston pin gradually accelerated and reached its maximum near the middle of the stroke, then decelerated and returned to the BDC. Compared with the rotation speed of the bushing, the piston pin rotation speed was much slower, and there was consistent relative sliding between the two movements.
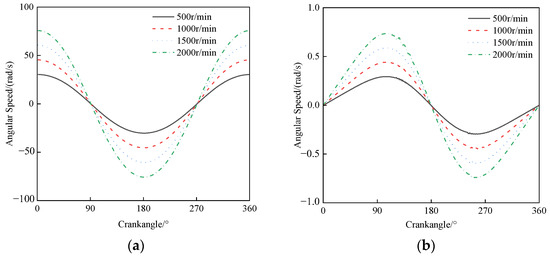
Figure 17.
(a) Engine speed influences bushing rotation speed. (b) Engine speed influences piston pin rotation speed.
Figure 18 and Figure 19 show the MOFT and asperity contact percentage, respectively, at different rotational speeds. When the piston approaches the TDC at each speed, the oil film thickness is the smallest, and the asperity contact percentage is the highest. As the rotational speed increased, the MOFT increased, and the asperity contact percentage decreased. Based on Figure 17, it can be seen that this is mainly due to the increase in rotational speed, which results in a greater difference in rotational speed between the piston pin and bushing, making it more favorable for the oil film to form between the two surfaces, resulting in more hydrodynamic lubrication and a reduced roughness contact rate.
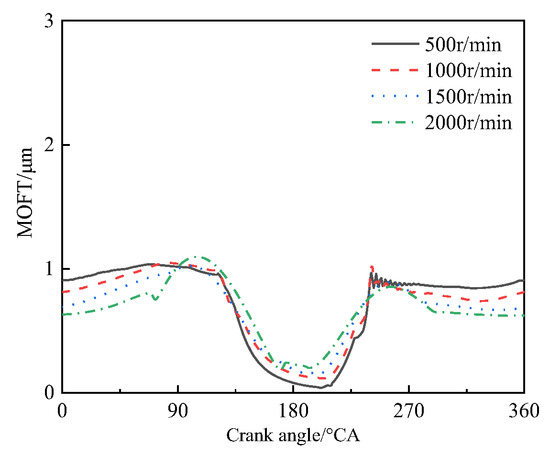
Figure 18.
MOFT in different rotation speed.
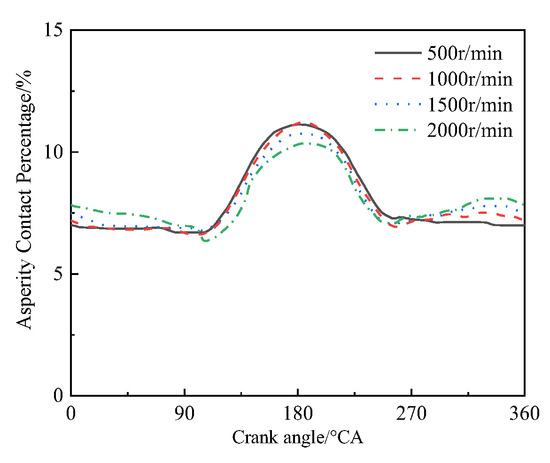
Figure 19.
Asperity contact percentage.
Figure 20 shows the friction power generated in the asperity contact and hydrodynamic lubrication at different speeds. It can be observed from the figure that the friction power generated in the asperity contact and hydrodynamic lubrication increases with increasing speed. Compared with hydrodynamic lubrication, the friction power generated by the asperity surface contact increases significantly with an increase in speed.
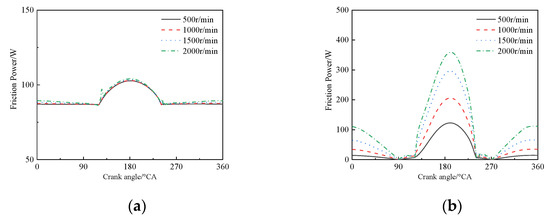
Figure 20.
(a) Hydrodynamic lubrication friction power under different engine speeds. (b) Asperity contact friction power under different engine speeds.
In combination with the MOFT change curve, with an increase in engine rotation speed, the oil film thickness also increases slightly; thus, the hydrodynamic lubrication and asperity contact friction coefficient are relatively unchanged. Because the asperity contact has a higher friction coefficient than hydrodynamic lubrication, the friction power of the asperity contact increases more significantly with increasing rotating speed.
The oil film thickness increased at a higher rotation speed, which enhanced lubrication conditions. Additionally, the relative rotational speed of the piston pin and bushing increased, resulting in a significant increase in friction power. As a result, the piston pin and bushing rotational speeds should be balanced during the design process to maximize lubrication while minimizing friction power.
5. Conclusions
In this paper, a new single-cylinder-based connecting rod small-end friction test rig was proposed, and a coupled tribology multi-body dynamics model of the test rig was established and validated by experimental data. Based on the orthogonal experiment, the main factors affecting the lubrication performance of the connecting rod small-end bearing were obtained, and the structural sensitivity analysis of the main factors was carried out. The analysis found that an increase in the clearance will increase the hydrodynamic lubrication percentage while reducing the local MOFT; an increase in the roughness will increase the rough contact percentage and bearing capacity, but the minimum film thickness ratio will decrease. An increase in the rotation speed will significantly increase the asperity contact friction power, but the lubrication state will be improved at the same time. The research results can be used for the design of connecting rod small-end bearings to improve their mechanical efficiency and reliability. The future development of this study is to increase the measurement parameters of the test rig and the influence of temperature on the profiles of EHD joints and the properties of lubricants.
Author Contributions
Project administration, J.Y.; conceptualization, J.Y., X.Y. and S.S.; methodology, X.Y.; investigation, S.S.; resources, J.Y., J.Z. and Y.C.; writing—original draft preparation, S.S.; writing—review and editing, J.Y. and X.Y.; visualization, S.S., L.X. and J.H. All authors have read and agreed to the published version of the manuscript.
Funding
This research received no external funding.
Institutional Review Board Statement
Not applicable.
Informed Consent Statement
Not applicable.
Data Availability Statement
Not applicable.
Acknowledgments
We are grateful to the reviewers for their review of the paper and to the editors for their advice on the quality of the paper.
Conflicts of Interest
The authors declare no conflict of interest.
References
- Holmberg, K.; Andersson, P.; Erdemir, A. Global energy consumption due to friction in passenger cars. Tribol. Int. 2012, 47, 221–234. [Google Scholar] [CrossRef]
- Liu, J.; Xiang, J.; Qin, W. Effect of temperature increase on the looseness of connecting rod small end bushing. Eng. Fail. Anal. 2022, 138, 106195. [Google Scholar] [CrossRef]
- Zhang, J.; Piao, Z.; Deng, L. Influence of pin assembly on the wear behavior of piston skirt. Eng. Fail. Anal. 2018, 89, 28–36. [Google Scholar] [CrossRef]
- Allmaier, H.; Sander, D.E. Piston-Pin Rotation and Lubrication. Lubricants 2020, 8, 30. [Google Scholar] [CrossRef]
- Etsion, I.; Halperin, G.; Becker, E. The effect of various surface treatments on piston pin scuffing resistance. Wear 2006, 261, 785–791. [Google Scholar] [CrossRef]
- Liu, J.; Zhang, L.; Xiang, J.; Zhao, Z.; Liao, R. Bench simulation test study on typical working conditions of connecting rod small end bearing. Trans. CSICE 2019, 37, 462–470. [Google Scholar]
- Allmaier, H.; Priestner, C.; Six, C. Predicting friction reliably and accurately in journal bearings-A systematic validation of simulation results with experimental measurements. Tribol. Int. 2011, 44, 1151–1160. [Google Scholar] [CrossRef]
- Priestner, C.; Allmaier, H.; Priebsch, H.H. Refined simulation of friction power loss in crank shaft slider bearings considering wear in the mixed lubrication regime. Tribol. Int. 2012, 46, 200–207. [Google Scholar] [CrossRef]
- Iwasaki, H.; Higasa, Y.; Takiguchi, M. Effects of design for piston pin and bearing on state of bearing lubrication. In Proceedings of the Fall Technical Conference of the ASME Internal Combustion Engine Division, Charleston, SC, USA, 14–17 October 2007. [Google Scholar]
- Liu, J.; Liao, R.; Xie, G. Tribological properties of CrN coating deposited on 20CrMo against tin bronze. Sci. China Technol. Sci. 2018, 61, 1713–1722. [Google Scholar] [CrossRef]
- Patir, N.; Cheng, H.S. An average flow model for determining effects of three-dimensional roughness on partial hydrodynamic Lubrication. J. Lubric. Technol. ASME 1978, 100, 12. [Google Scholar] [CrossRef]
- Wang, Q.; Shi, F.; Lee, S.C. A Mixed-lubrication study of journal bearing conformal contacts. J. Tribol. 1996, 119, 456–461. [Google Scholar] [CrossRef]
- Allmaier, H.; Priestner, C. Reich F M Predicting friction reliably and accurately in journal bearings–The importance of extensive oil-models. Tribol. Int. 2012, 48, 93. [Google Scholar] [CrossRef]
- Fatu, A.; Hajjam, M.; Bonneau, D. A new model of thermoelastohydrodynamic lubrication in dynamically loaded journal bearings. J. Tribol ASME 2006, 128, 85–95. [Google Scholar] [CrossRef]
- Ba, L.; He, Z.P.; Liu, Y.H. Analysis of piston-pin lubrication considering the effects of structure deformation and cavitation. J. Zhejiang Univ. Sci. A 2015, 16, 443–463. [Google Scholar] [CrossRef]
- Zhu, J.C.; Zhu, H.H.; Fan, S.D. A study on the influence of oil film lubrication to the strength of engine connecting rod components. Eng. Fail. Anal. 2016, 63, 94–105. [Google Scholar] [CrossRef]
- Fang, C.; Meng, X.; Lu, Z. Modeling a lubricated full-floating pin bearing in planar multibody systems. Tribol. Int. 2019, 131, 222–237. [Google Scholar] [CrossRef]
- Ravn, P.; Shivaswamy, S.; Alshaer, B.J. Joint clearances with lubricated long bearings in multibody mechanical systems. J. Mech. Des. 2000, 122, 484–488. [Google Scholar] [CrossRef]
- Pioli, A.; Strozzi, A.; Baldini, A. Influence of the initial clearance on the peak stress in connecting-rod small ends. Proc. Inst. Mech. Eng. Part D J. Automob. Eng. 2009, 223, 769–782. [Google Scholar] [CrossRef]
- Galda, L.; Pawlus, P.; Sep, J. Dimples shape and distribution effect on characteristics of Stribeck curve. Tribol. Int. 2009, 42, 1505–1512. [Google Scholar] [CrossRef]
- Zhang, J.Y.; Zuo, Z.X.; Wang, X.L.; Dong, H. Analysis of the performance of piston pin bearing in mixed lubrication. Trans. CSICE 2010, 28, 79–84. [Google Scholar]
- Zhang, J.H.; Zhang, G.; He, Z.; Ma, L. Optimization of crankshaft-bearing lubricating characteristics based on orthogonal experiment and neural network. Trans. CSICE 2011, 29, 461–467. [Google Scholar]
- Cao, D.; Doll, G.L.; Asme. Contact mechanics of a high load capacity piston pin. In Proceedings of the ASME 2008 International Joint Tribology Conference, Miami, FL, USA, 20–22 October 2008. [Google Scholar]
- Bertocchi, L.; Giacopini, M.; Dini, D. Analysis of the lubrication regimes at the small end and big end of a connecting rod of a high performance motorbike engine. In Proceedings of the ASME/STLE International Joint Tribology Conference (IJTC 2012), Denver, CO, USA, 7–10 October 2012. [Google Scholar]
- Sun, J.; Li, B.; Zhu, S. Lubrication Performance of Connecting-Rod and Main Bearing in Different Engine Operating Conditions. Chin. J. Mech. Eng. 2019, 32, 23. [Google Scholar] [CrossRef]
- Xue, R.; Cai, Y.; Fang, X. Optimization Study on a Novel High-Speed Oil-Free Centrifugal Water Pump with Hydrodynamic Bearings. Appl. Sci. 2019, 9, 3050. [Google Scholar] [CrossRef]
- Sun, J.; Zhu, X.; Zhang, L. Effect of surface roughness, viscosity-pressure relationship and elastic deformation on lubrication performance of misaligned journal bearings. Ind. Lubr. Tribol. 2014, 66, 337–345. [Google Scholar] [CrossRef]
- Choi, J.; Kim, S.S.; Rhim, S. Numerical model of journal bearing lubrication considering a bending stiffness effect. J. VibroEng. 2012, 14, 1002–1010. [Google Scholar] [CrossRef]
- Sun, J.; Deng, M.; Fu, Y. Thermohydrodynamic lubrication analysis of misaligned plain journal bearing with rough surface. J. Tribol. ASME 2010, 132, 011704. [Google Scholar] [CrossRef]
- Wei, L.D.; Wei, H.J.; Duan, S.L. An EHD-mixed lubrication analysis of main bearings for diesel engine based on coupling between flexible whole engine block and crankshaft. Ind. Lubr Tribol. 2015, 67, 150–158. [Google Scholar] [CrossRef]
- Shao, K.; Liu, C.W.; Bi, F.R. Analysis of hydrodynamic loads on performance characteristics of engine main bearings. Proc. Inst. Mech. Eng. J-J. Eng. 2015, 229, 667–676. [Google Scholar] [CrossRef]
- Zhang, H.; Hua, M.; Dong, G.N. A mixed lubrication model for studying tribological behaviors of surface texturing. Tribol. Int. 2016, 93, 583–592. [Google Scholar] [CrossRef]
- Hu, J.; Yu, Y.; Yang, J. Research on the generalisation method of diesel engine exhaust valve leakage fault diagnosis based on acoustic emission. Measurement 2023, 210, 112560. [Google Scholar] [CrossRef]
- Greenwood, J.A.; Tripp, J.H. The contact of two nominally flat rough surfaces. Proc. Inst. Mech. Eng. 1970, 185, 625–633. [Google Scholar] [CrossRef]
- AVL-List GmbH. AVL-EXCITE Theory; Version 2016; AVL-List GmbH: Graz, Austria, 2016. [Google Scholar]


Disclaimer/Publisher’s Note: The statements, opinions and data contained in all publications are solely those of the individual author(s) and contributor(s) and not of MDPI and/or the editor(s). MDPI and/or the editor(s) disclaim responsibility for any injury to people or property resulting from any ideas, methods, instructions or products referred to in the content. |
© 2023 by the authors. Licensee MDPI, Basel, Switzerland. This article is an open access article distributed under the terms and conditions of the Creative Commons Attribution (CC BY) license (https://creativecommons.org/licenses/by/4.0/).