Abstract
The Urals and Siberian vacuum residues are considered difficult to process in the ebullated bed hydrocracking because of their increased tendency to form sediments. Their achievable conversion rate reported in the literature is 60%. Intercriteria analysis was used to assess data from a commercial vacuum residue hydrocracker during processing blends from three vacuum residues: Urals, Siberian Light, and Basra Heavy. The analysis revealed that the main contributors to conversion enhancement is hydrodemetallization (HDM) and the first reactor ΔT augmentation. The increase of HDM from 40 to 98% and the first reactor ΔT (ΔT(R1)) from 49 to 91 °C were associated with a vacuum residue conversion enhancement of 62.0 to 82.7 wt.%. The developed nonlinear regression prediction of conversion from HDM and ΔT(R1) suggests a bigger influence of ΔT(R1) enhancement on conversion augmentation than the HDM increase. The intercriteria analysis evaluation revealed that the higher first reactor ΔT suppresses the sediment formation rate to a greater extent than the higher HDM. During processing Basrah Heavy vacuum residue, a reduction in hydrodeasphaltization (HDAs) from 73.6 to 55.2% and HDM from 88 to 81% was observed. It was confirmed that HDM and HDAs are interrelated. It was found that the attainment of conversion of 80 wt.% and higher during processing Urals and Siberian Light vacuum residues is possible when the HDM is about 90% and LHSV ≤ 0.19 h−1.
1. Introduction
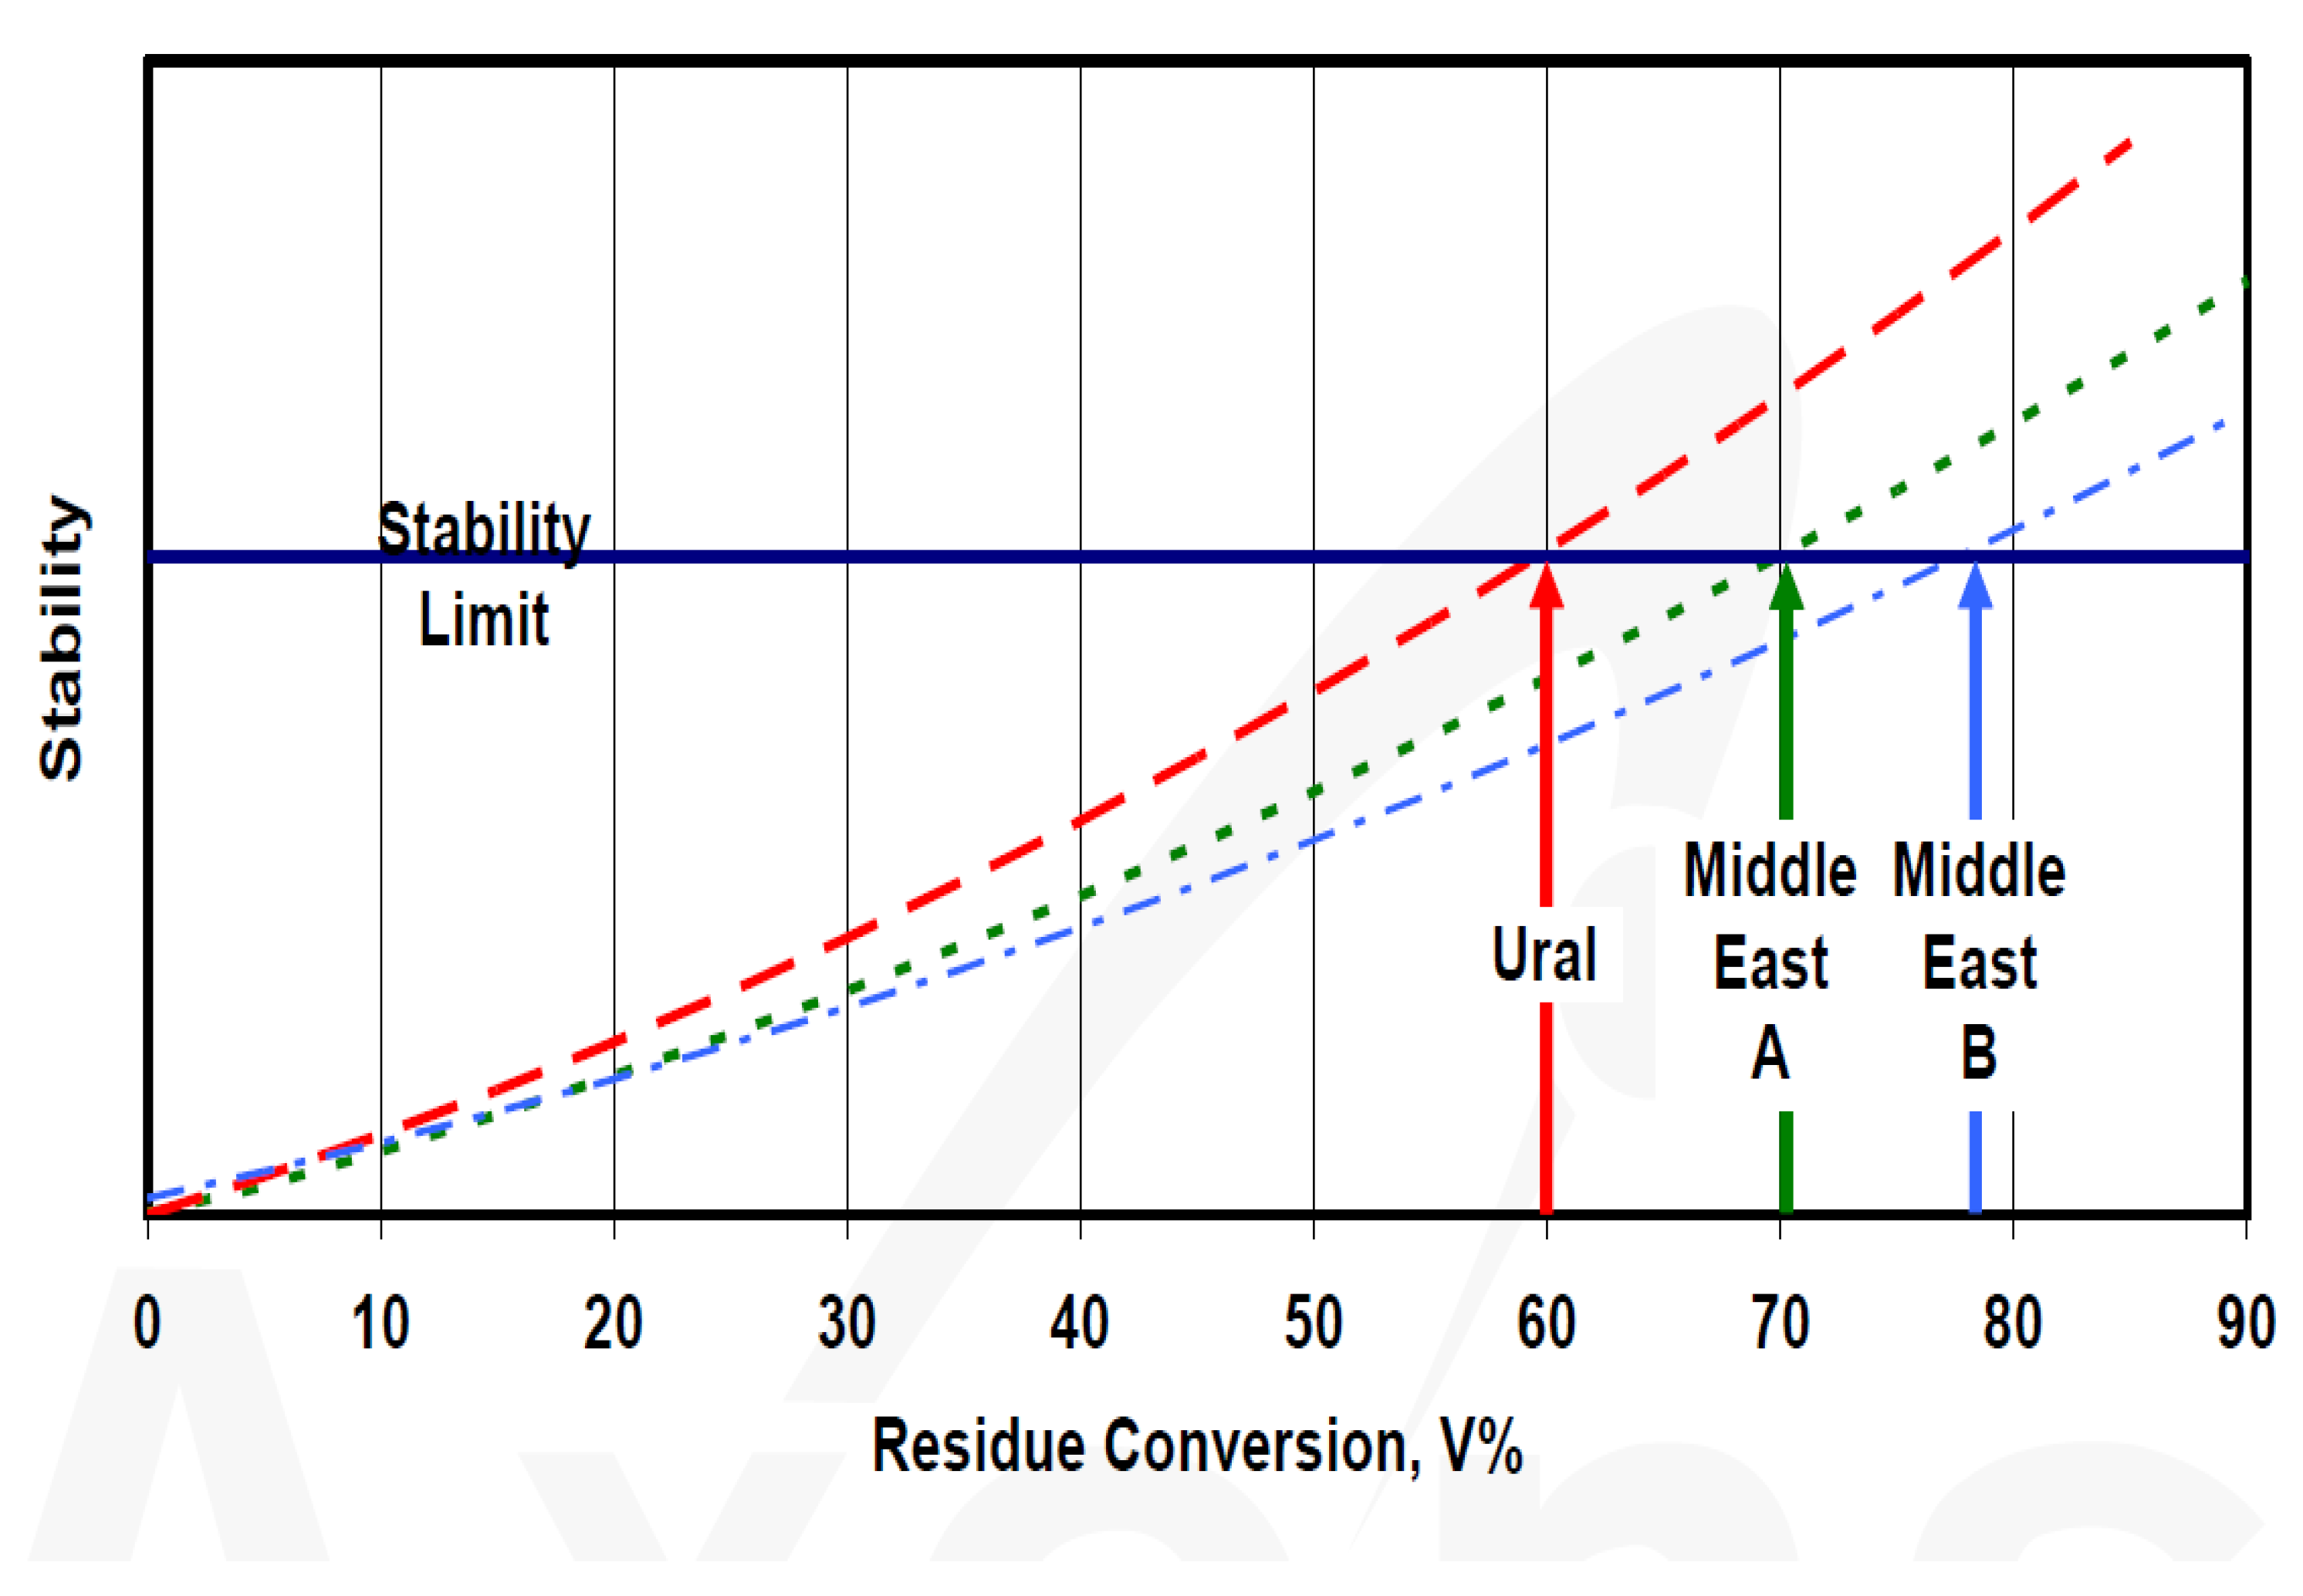
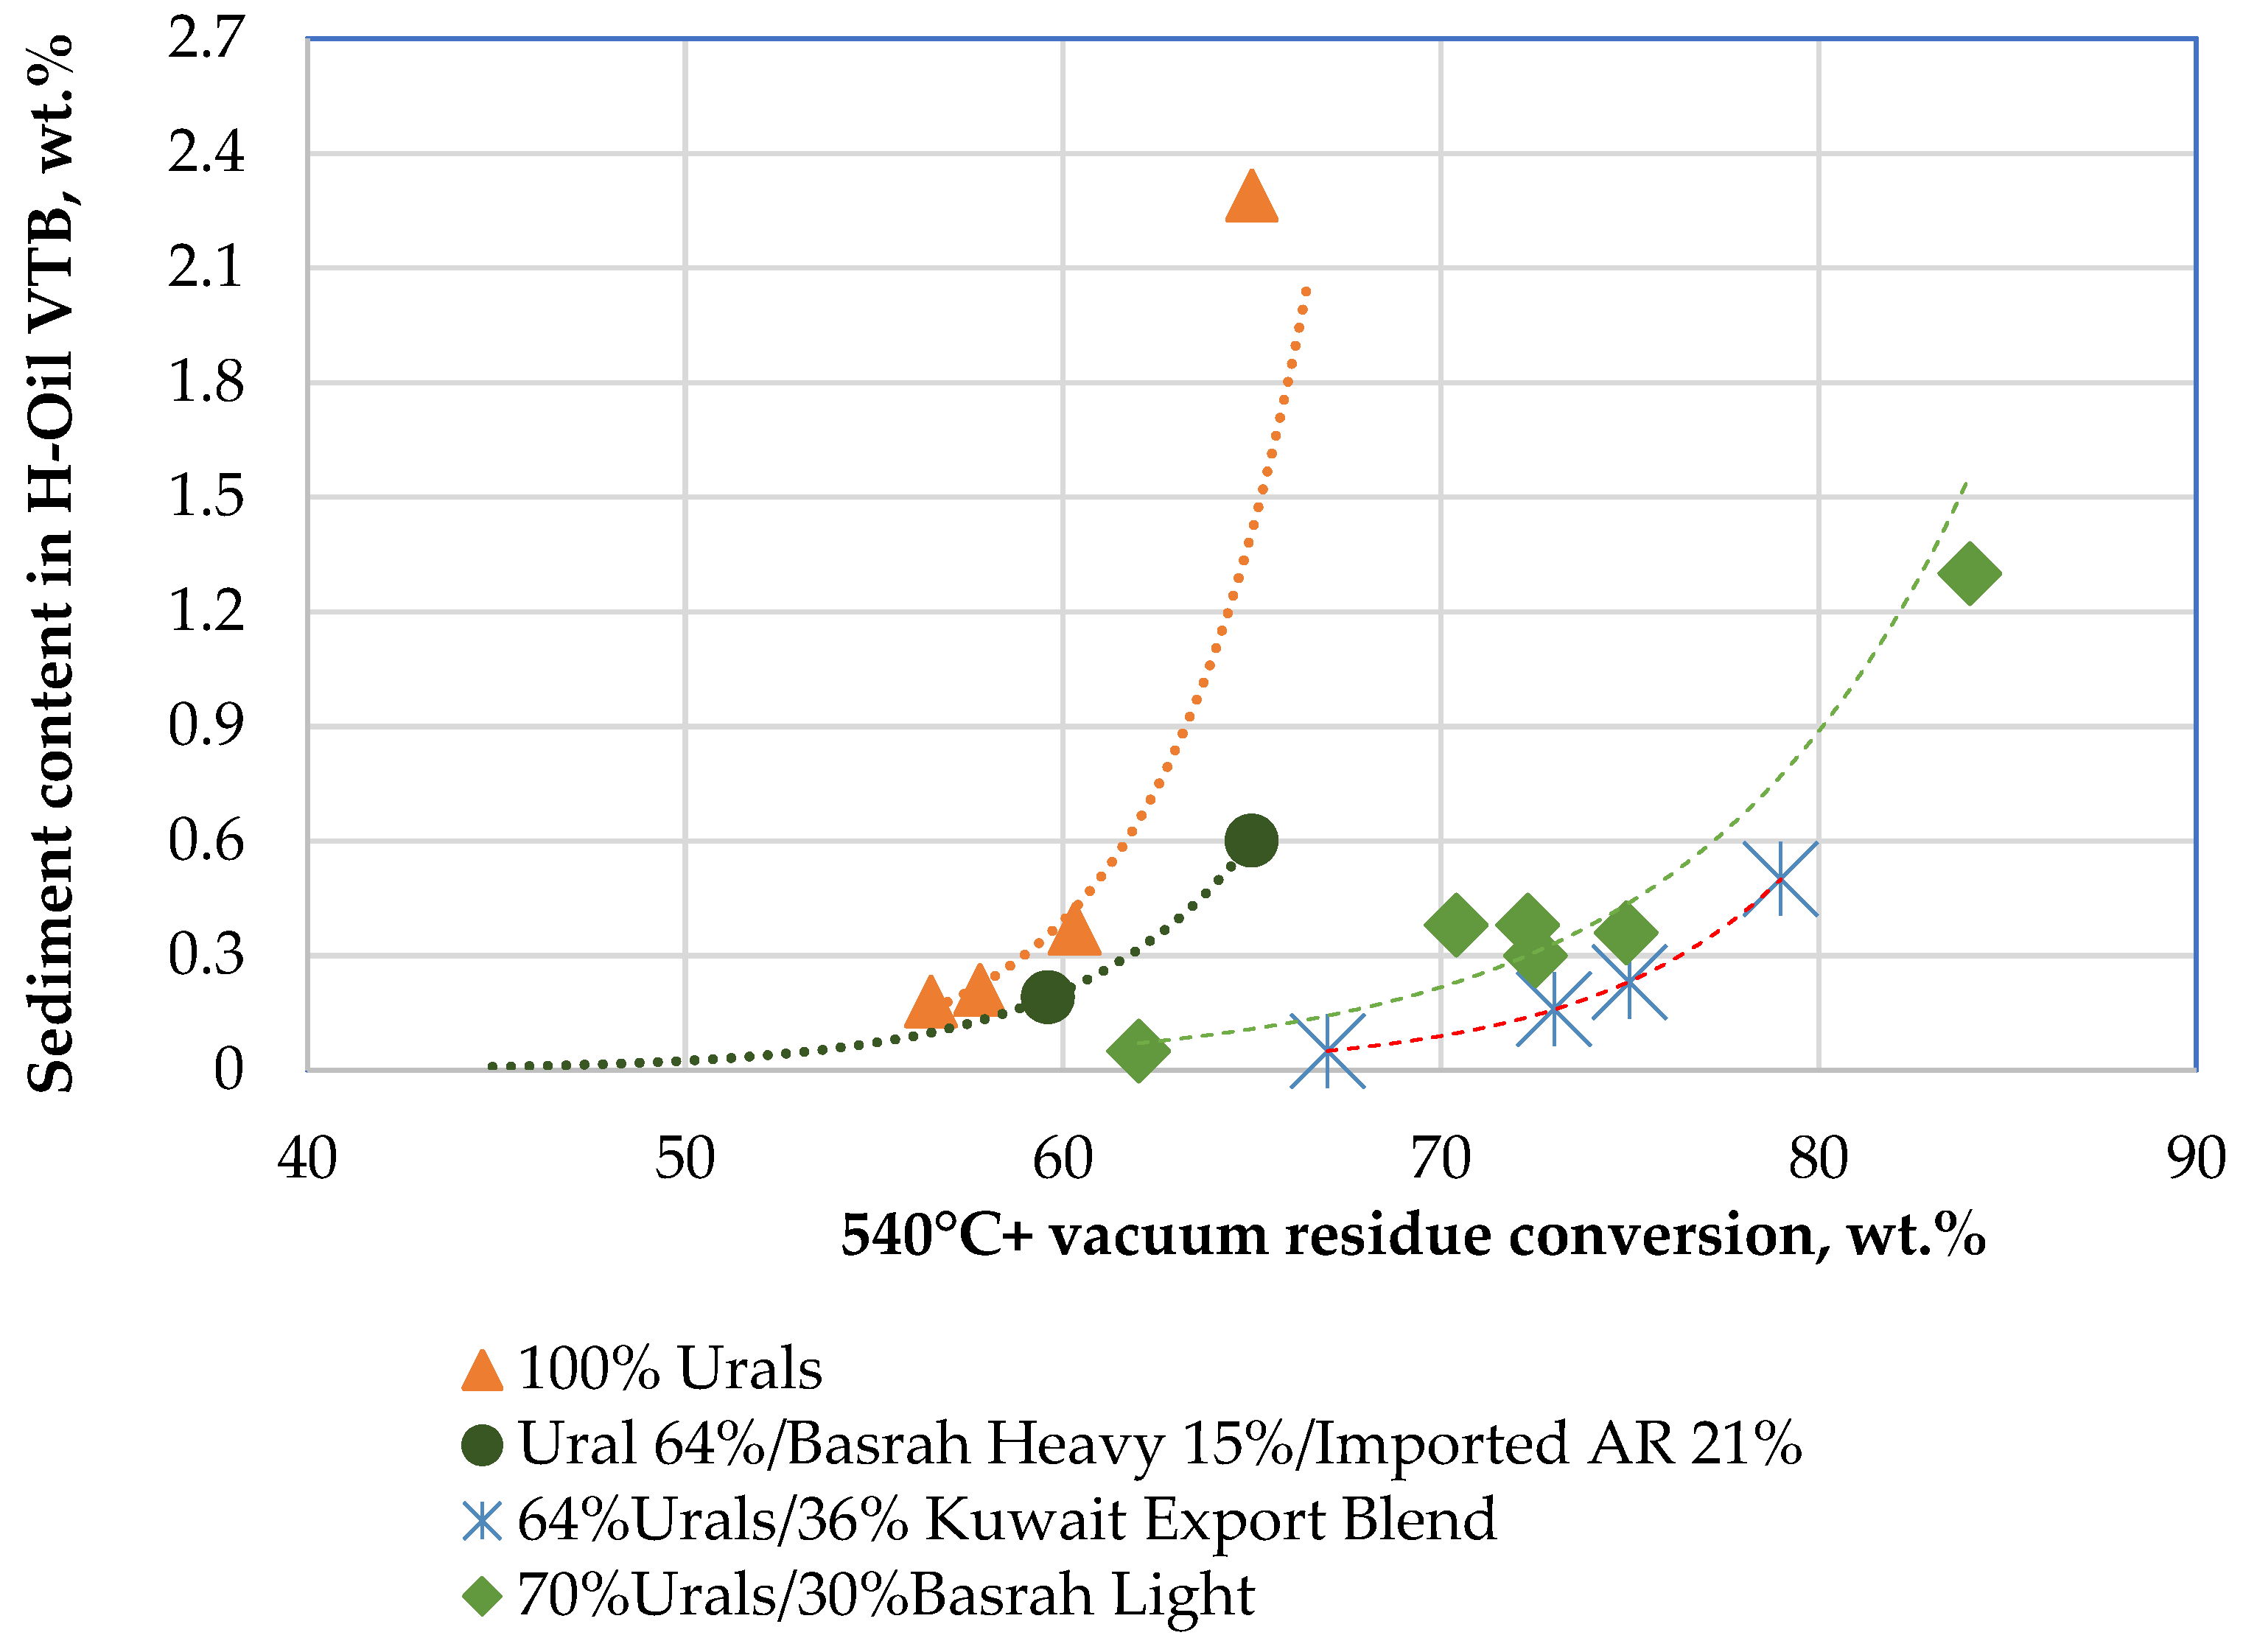
The level of heavy oil conversion is the factor that controls modern refining profitability. The ebullated bed hydrocracking and the slurry hydrocracking are the conversion technologies that can provide the highest conversion level ≥ 90 wt.% among all technologies converting vacuum residue [1,2]. Currently, more than 90% of the world’s vacuum residual oils are hydrocracked using the ebullated bed hydrocracking technology [3]. After slurry hydrocracking, with 95% vacuum residue conversion achieved on a commercial scale [4], ebullated bed vacuum residue hydrocracking (EBVRHC) demonstrated commercially the capability of attaining 93% conversion [2]. The lowest conversion level reported for the EBVRHC is 55% [2,5]. The very large difference of almost 40% can be a result of different feed quality [6], distinct catalyst conditions [7], and various operating conditions [2]. The main constraint to increasing reaction severity and consequently conversion is the sediment formation rate, which increases exponentially with reaction temperature enhancement [8,9,10]. The sediment problem can lower an on-stream factor that has a stronger influence on refining economics than conversion augmentation [7], which makes refiners decrease reaction temperature to curb sediment formation. This in turn, is associated by conversion lowering. Realizing the importance of the optimal performance of the EBVRHC for oil refining and the fact that most of the vacuum residue is hydrocracked there, it is surprising to see how limited is the number of articles dedicated to the commercial research of ebullated bed vacuum residue hydrocracking. Besides the references cited so far [2,3,7,8], there are a few more papers dealing with commercial research at EBVRHC [11,12,13,14,15,16,17,18]. We found only a dozen articles in the open literature to discuss data from the commercial ebullated bed vacuum hydrocrackers. Indeed, the number of reports discussing commercial ebullated bed vacuum hydrocrackers should be bigger, if the conference proceedings are taken into account. However, these proceedings are available to a very limited audience. The figure of a dozen articles is considerably lower than the 5334 papers published on the topic of residue hydrocracking, as extracted from Science Direct [19]. Therefore, there is a gap in the residue hydrocracking research related to its commercial application. Moreover, the companies that provide services for commercial ebullated bed vacuum residue hydrocrackers keep most of their knowledge, experience, and data unpublished, which makes the publication of commercial EBVRHC studies even more valuable. That was one of the reasons for disseminating the knowledge obtained during this research in the form of an article. The current study is a continuation of the research dedicated to the investigation of the causes for increased fouling in an ebullated bed vacuum residue hydrocracker and published recently [16]. In that research, we used intercriteria analysis (ICrA) as a diagnostic instrument to understand the causes for increased fouling in the commercial EBVRHC unit. It was established that when the proportion of the ΔT of the first reactor to the ΔT of the second reactor was lower than 2, an increase of fouling occurred. The fouling was also favored by the processing of vacuum residues with decreased Conradson carbon content, an augmented unit feed rate, and reductions in catalyst dosage. The application of the knowledge gained from that study allowed us to increase vacuum residue conversion from 62 to 70 wt.% during processing vacuum residues derived from Urals and Siberian Light crude oils. We further improved the productivity of the commercial ebullated bed vacuum residue hydrocracker by increasing conversion from 70 up to 82 wt.% while keeping the sediment formation and fouling rates within reasonable limits by replacing the design cascade mode of fresh catalyst addition with a parallel one. In this way, the activity of the catalyst in the first and second reactors was individually controlled by employing distinct catalyst addition rates in both reactors. That was achieved within six months. Moreover, for most of the time, the commercial EBVRHC unit processed difficult-to-treat vacuum residues derived from Urals and Siberian Light crude oil. It is well known that processing of Urals vacuum residue is associated with high sediment formation [11,20], and for that reason the severity of operation in the hydrocracker is relatively low when Urals vacuum residue is processed, which results in a lower conversion [11,20]. Our earlier research [17] has shown that the vacuum residues with a higher saturate content have a higher inclination to form sediment during hydrocracking. For that reason, they are processed at a lower reaction severity and therefore converted to a lesser extent. The Urals and Siberian Light vacuum residues have relatively high saturate content, which makes them difficult to process at a higher severity in the commercial hydrocracker. In contrast, the vacuum residues from Middle Eastern crude oils have a lower saturate content and a lower tendency to sediment formation, which allows operation at a higher reaction severity, leading to a higher conversion. This is well illustrated in Figure 1 and Figure 2.
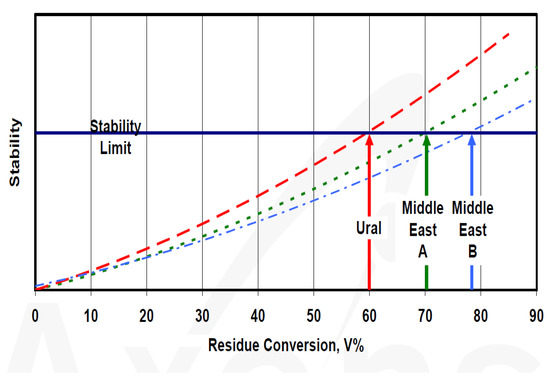
Figure 1.
The effect of crude oil type on the conversion level in ebullated bed vacuum residue hydrocracking at the same product stability (product sediment content). (Adapted with permission from Ref. [21] Copyright 2014, copyright Elsevier) (This data is taken from the licensor of the commercial ebullated bed vacuum residue hydrocracker under study.).

Figure 2.
Dependence of hydrocracked vacuum residue sediment content on the crude oil type processed. (This data is taken from the operation of the commercial ebullated bed vacuum residue hydrocracker under study).
In order to understand what was behind the considerable improvement in commercial EBVRHC unit performance, reaching 82 wt.% conversion during processing difficult feeds such as Urals vacuum residue, an intercriteria analysis evaluation was performed similar to our previous study [16]. The intercriteria analysis (ICrA) was created in the Institute for biophysics and biomedical engineering, Bulgarian academy of sciences (BAS) as a tool to support decision making in multiobject multicriteria problems [22,22,23,24]. It found successful applications in medicine, biology, economics, physics, etc., and it can be considered a component of the artificial intelligence toolkit [25]. It was also successfully applied in several studies in the field of chemistry and technology of petroleum [2,16,26,27,28]. A detailed explanation of the essence of ICrA applied in the field of petroleum processing can be found in our recent research [16]. In this study, ICrA evaluation is applied to the data from the commercial ebullated bed vacuum residue hydrocracker that processes vacuum residues derived from three crude oils: Urals, Siberian Light, and Basrah Heavy.
The aim of this study is to identify the factors contributing to conversion enhancement from 70 to 82 wt.% while maintaining sediment formation and fouling rates within reasonable limits.
2. Materials and Methods
During this study, vacuum residues derived from three crude oils: Urals, Siberian Light, and Basrha heavy with properties summarized in Table 1 were processed in a commercial ebullated bed hydrocracker.

Table 1.
Properties of vacuum residue fractions processed in the hydrocracker during the study.
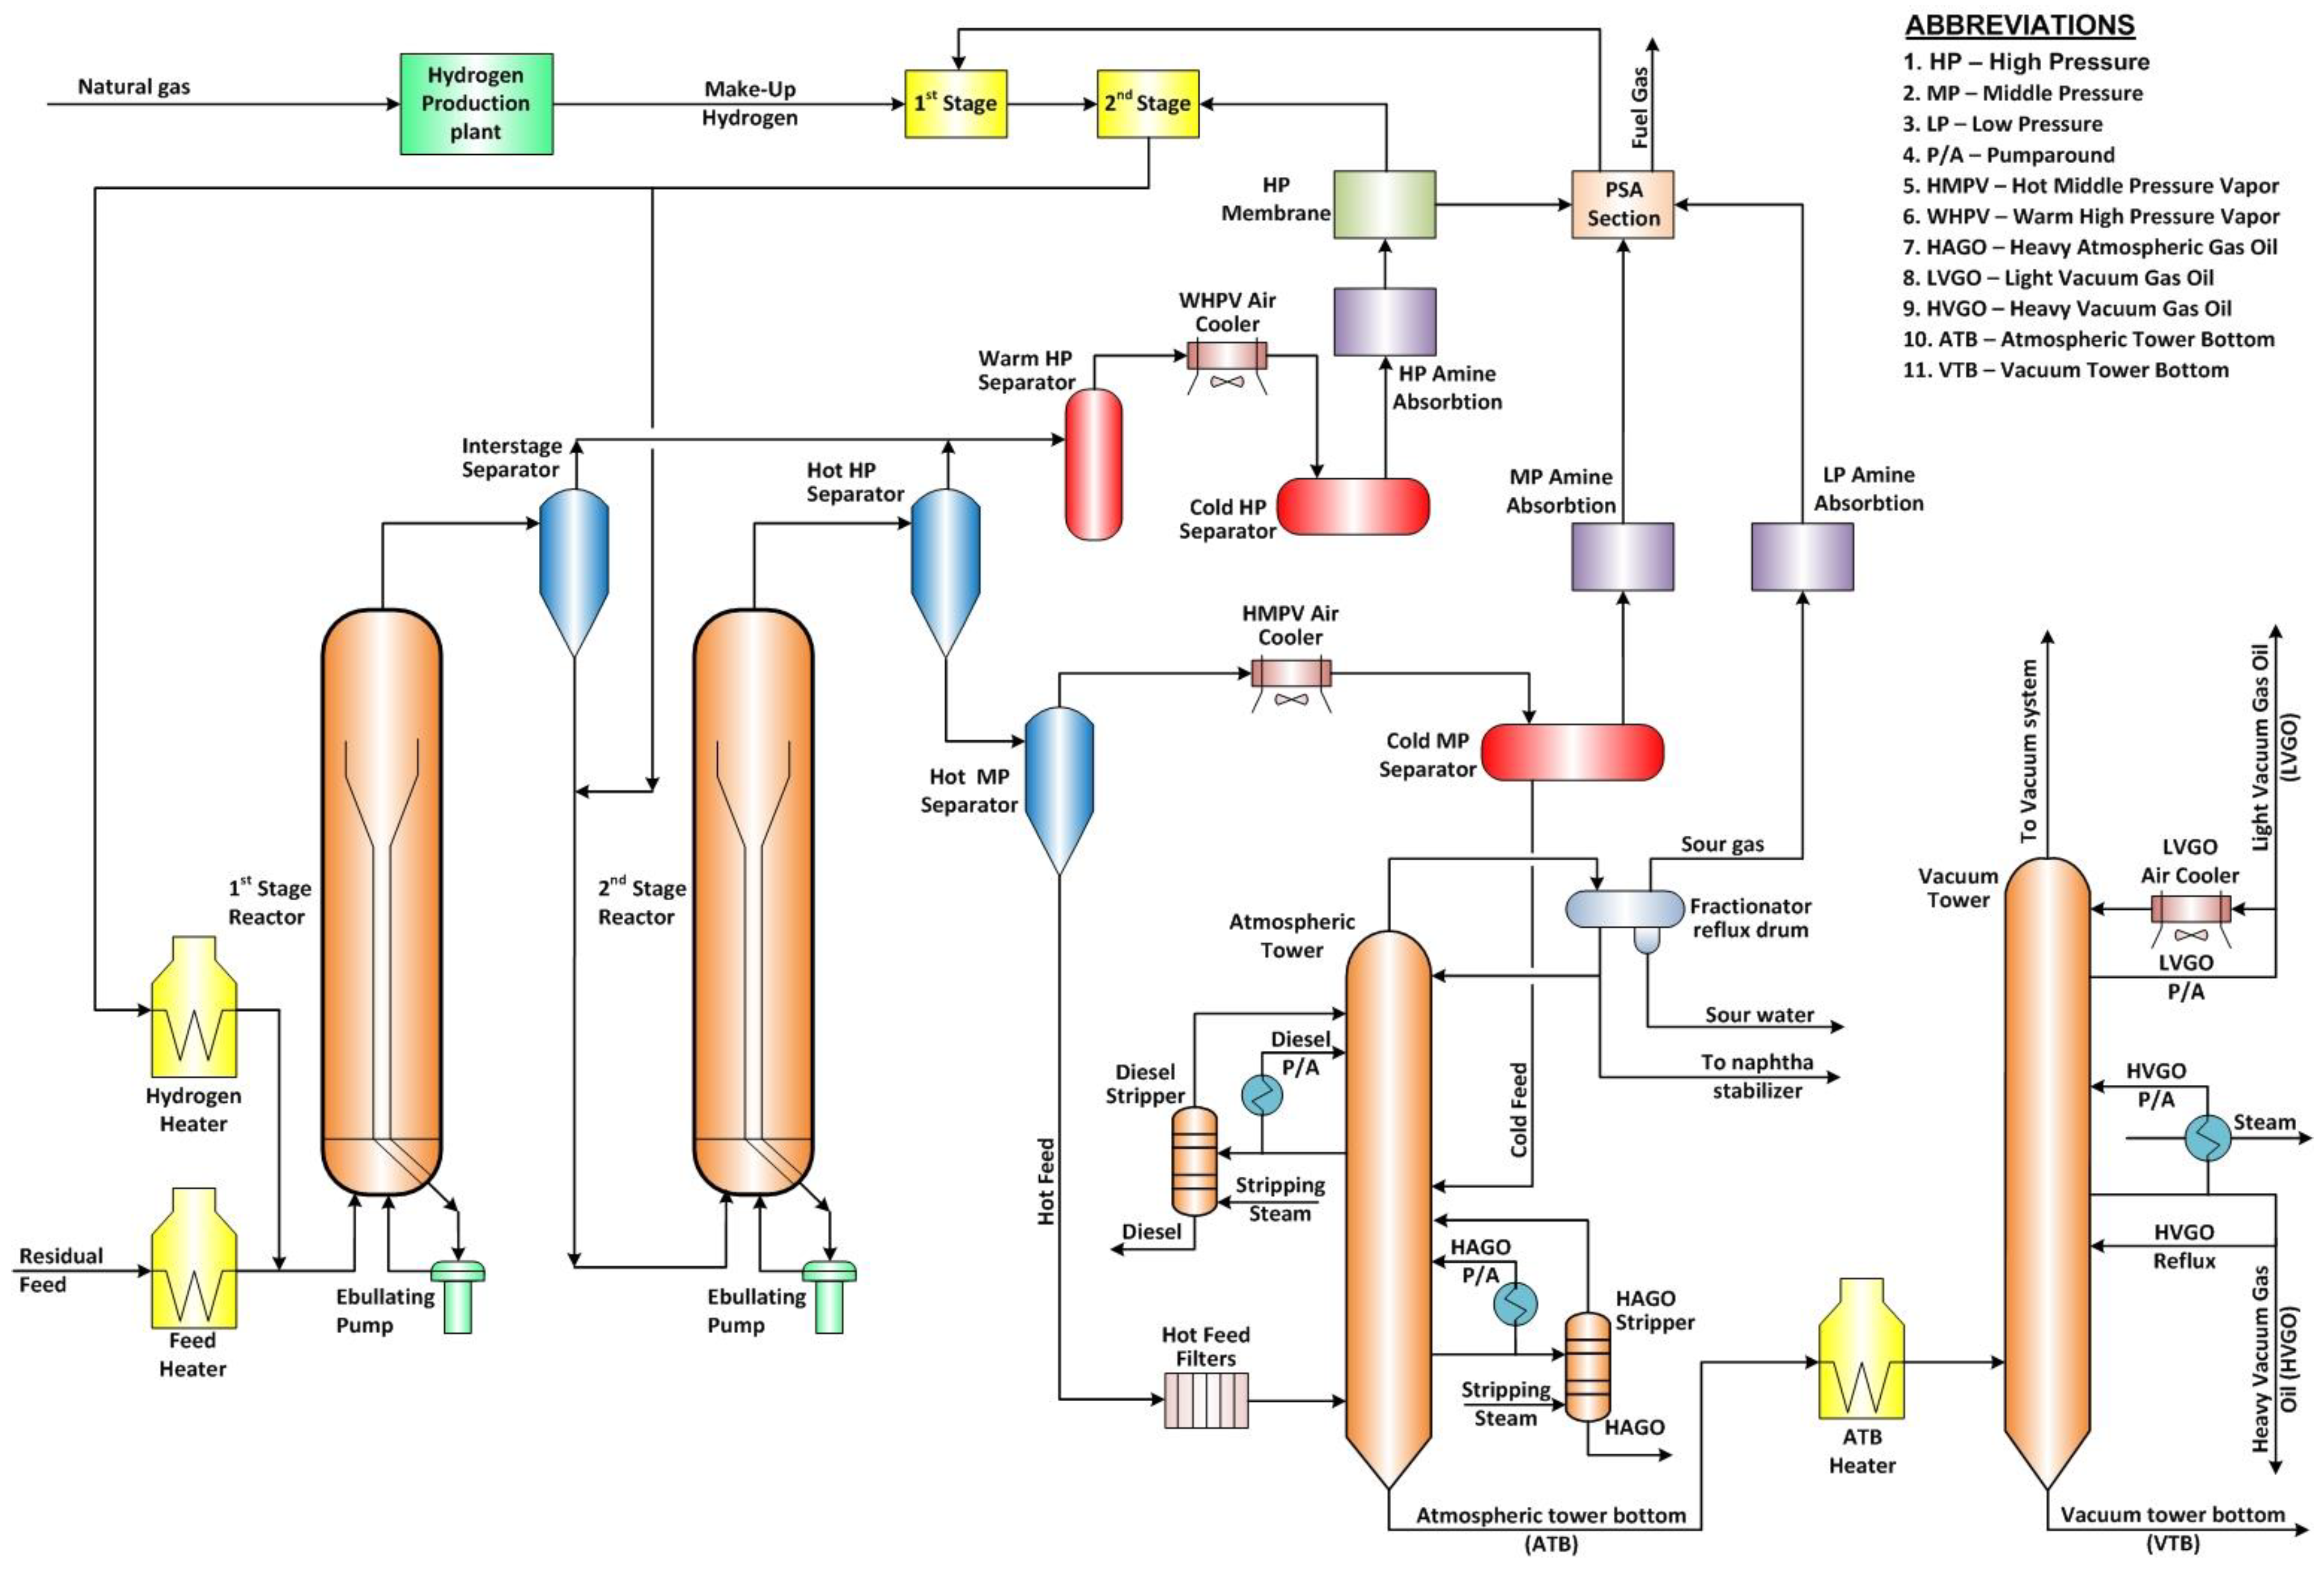
The processing diagram of the commercial ebullated bed vacuum residue hydrocracker is presented in Figure 3. The operating conditions of the studied vacuum residue hydrocracker are detailed in our earlier research [11,12].

Figure 3.
Process flow diagram of the commercial ebullated bed residue hydrocracker under study.
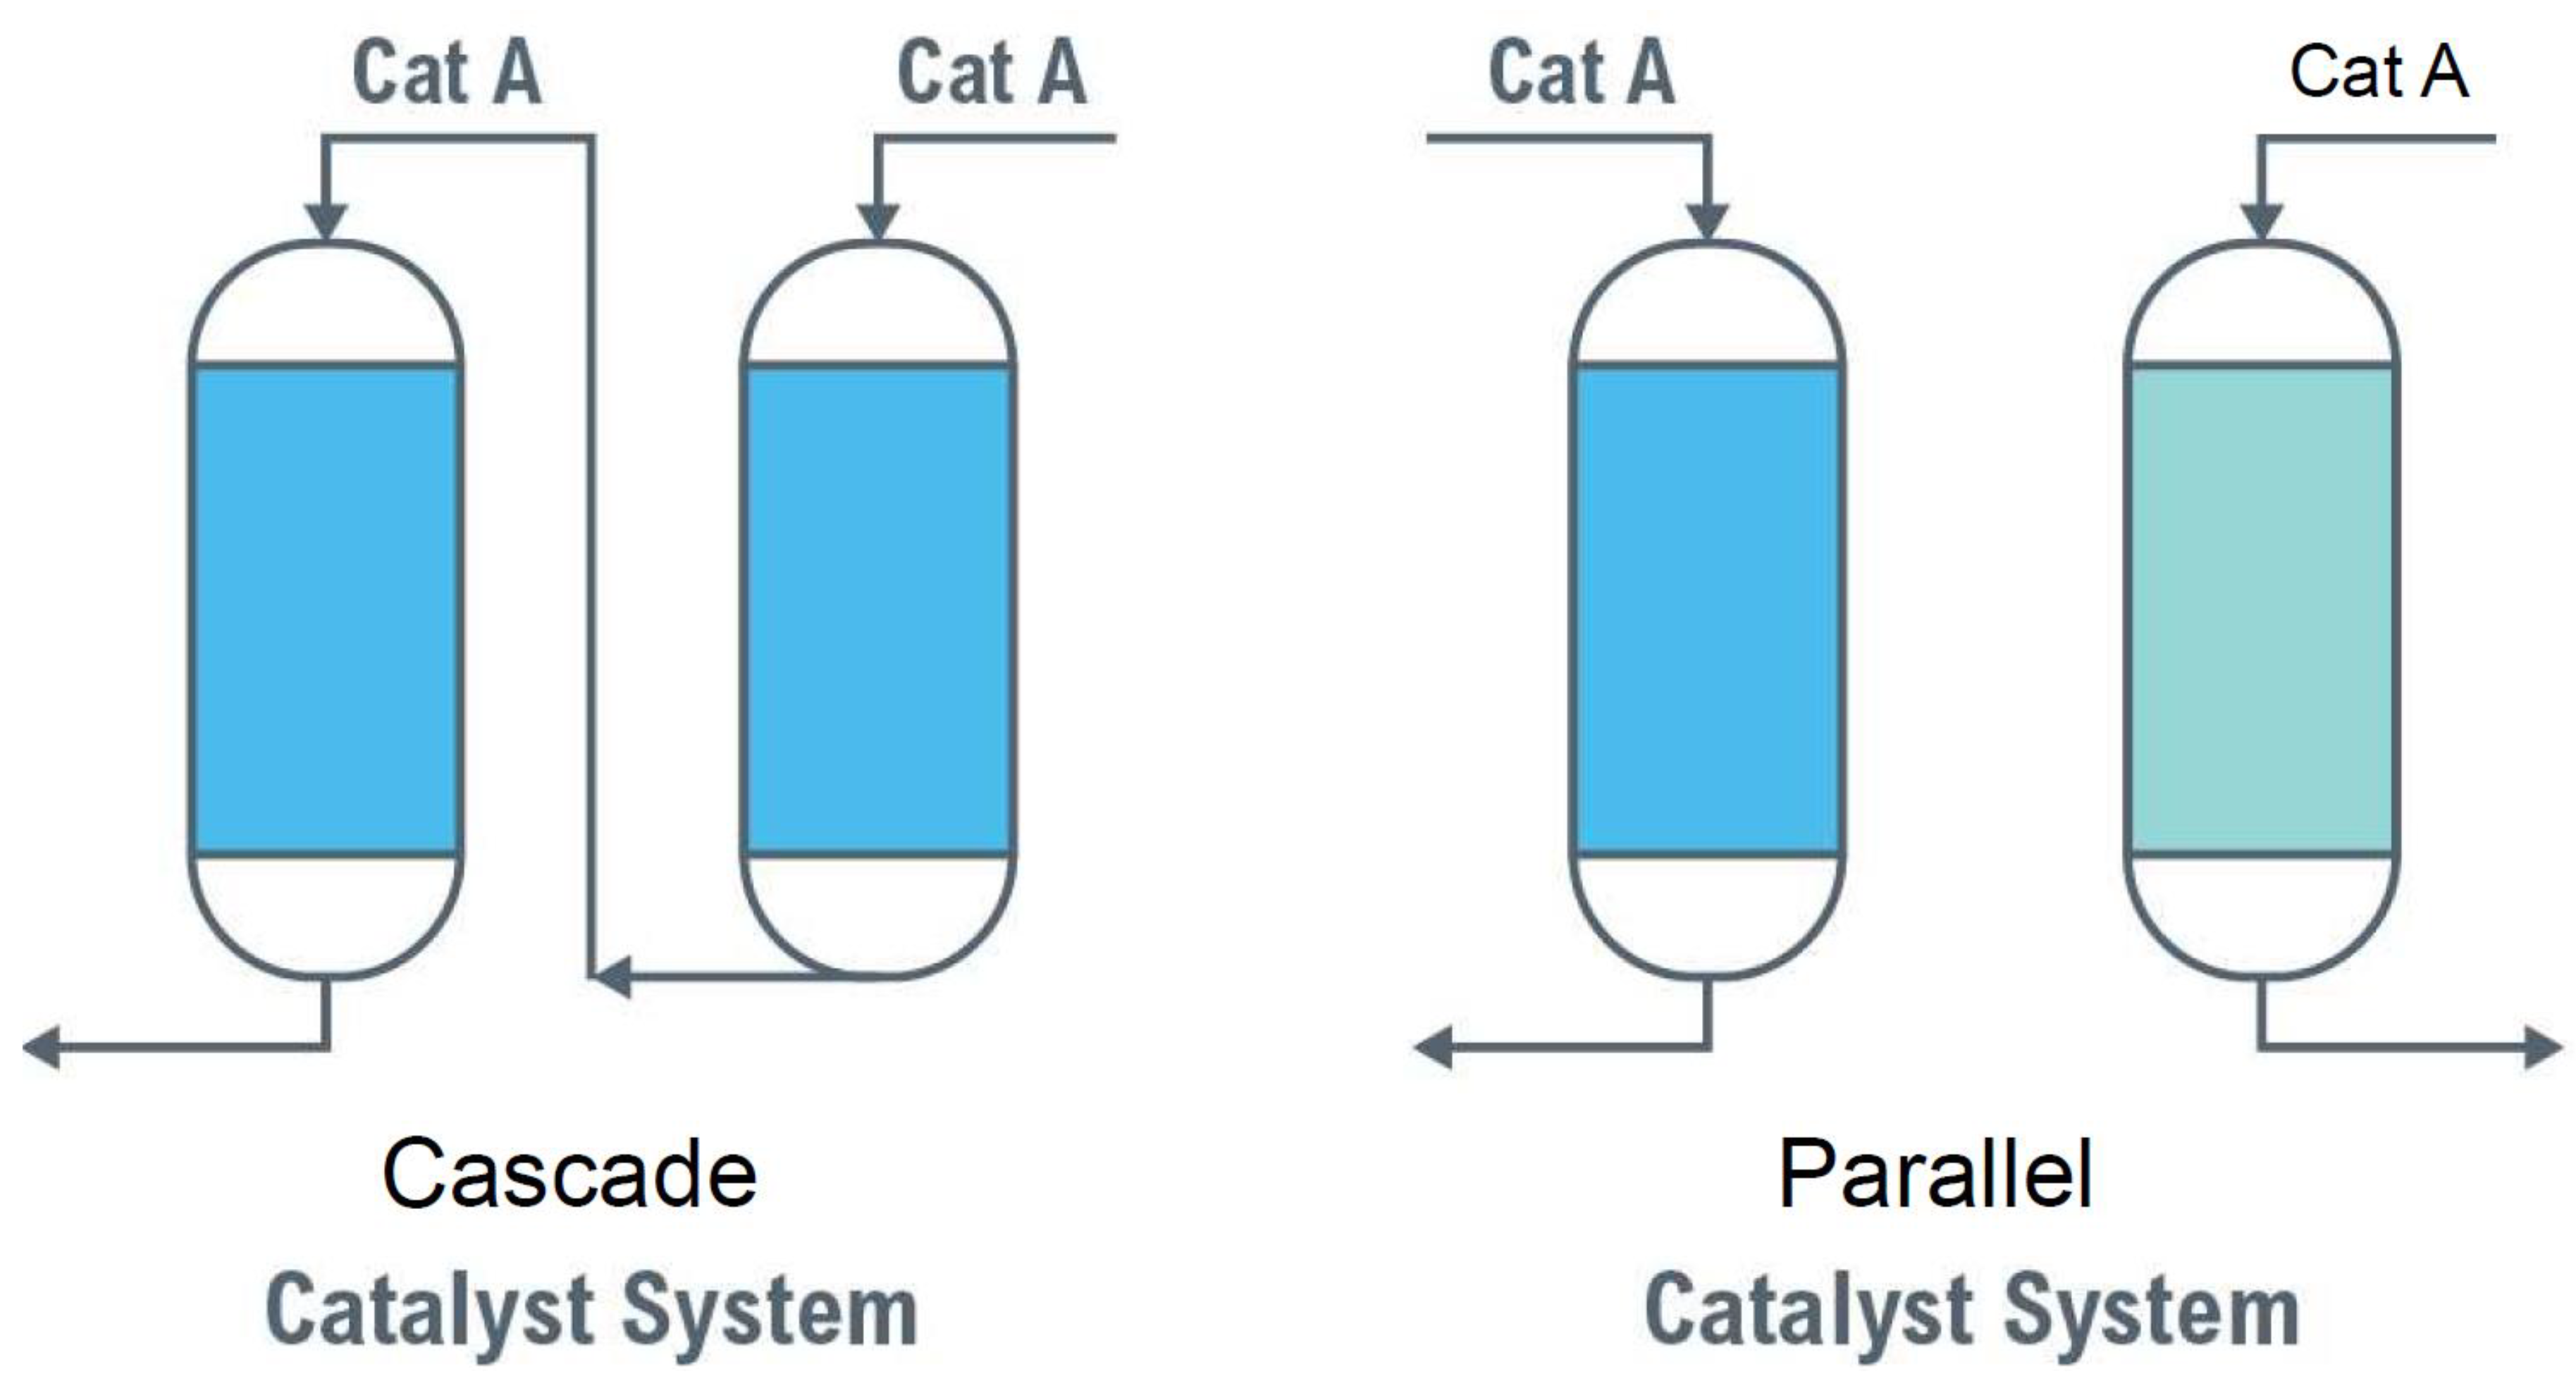
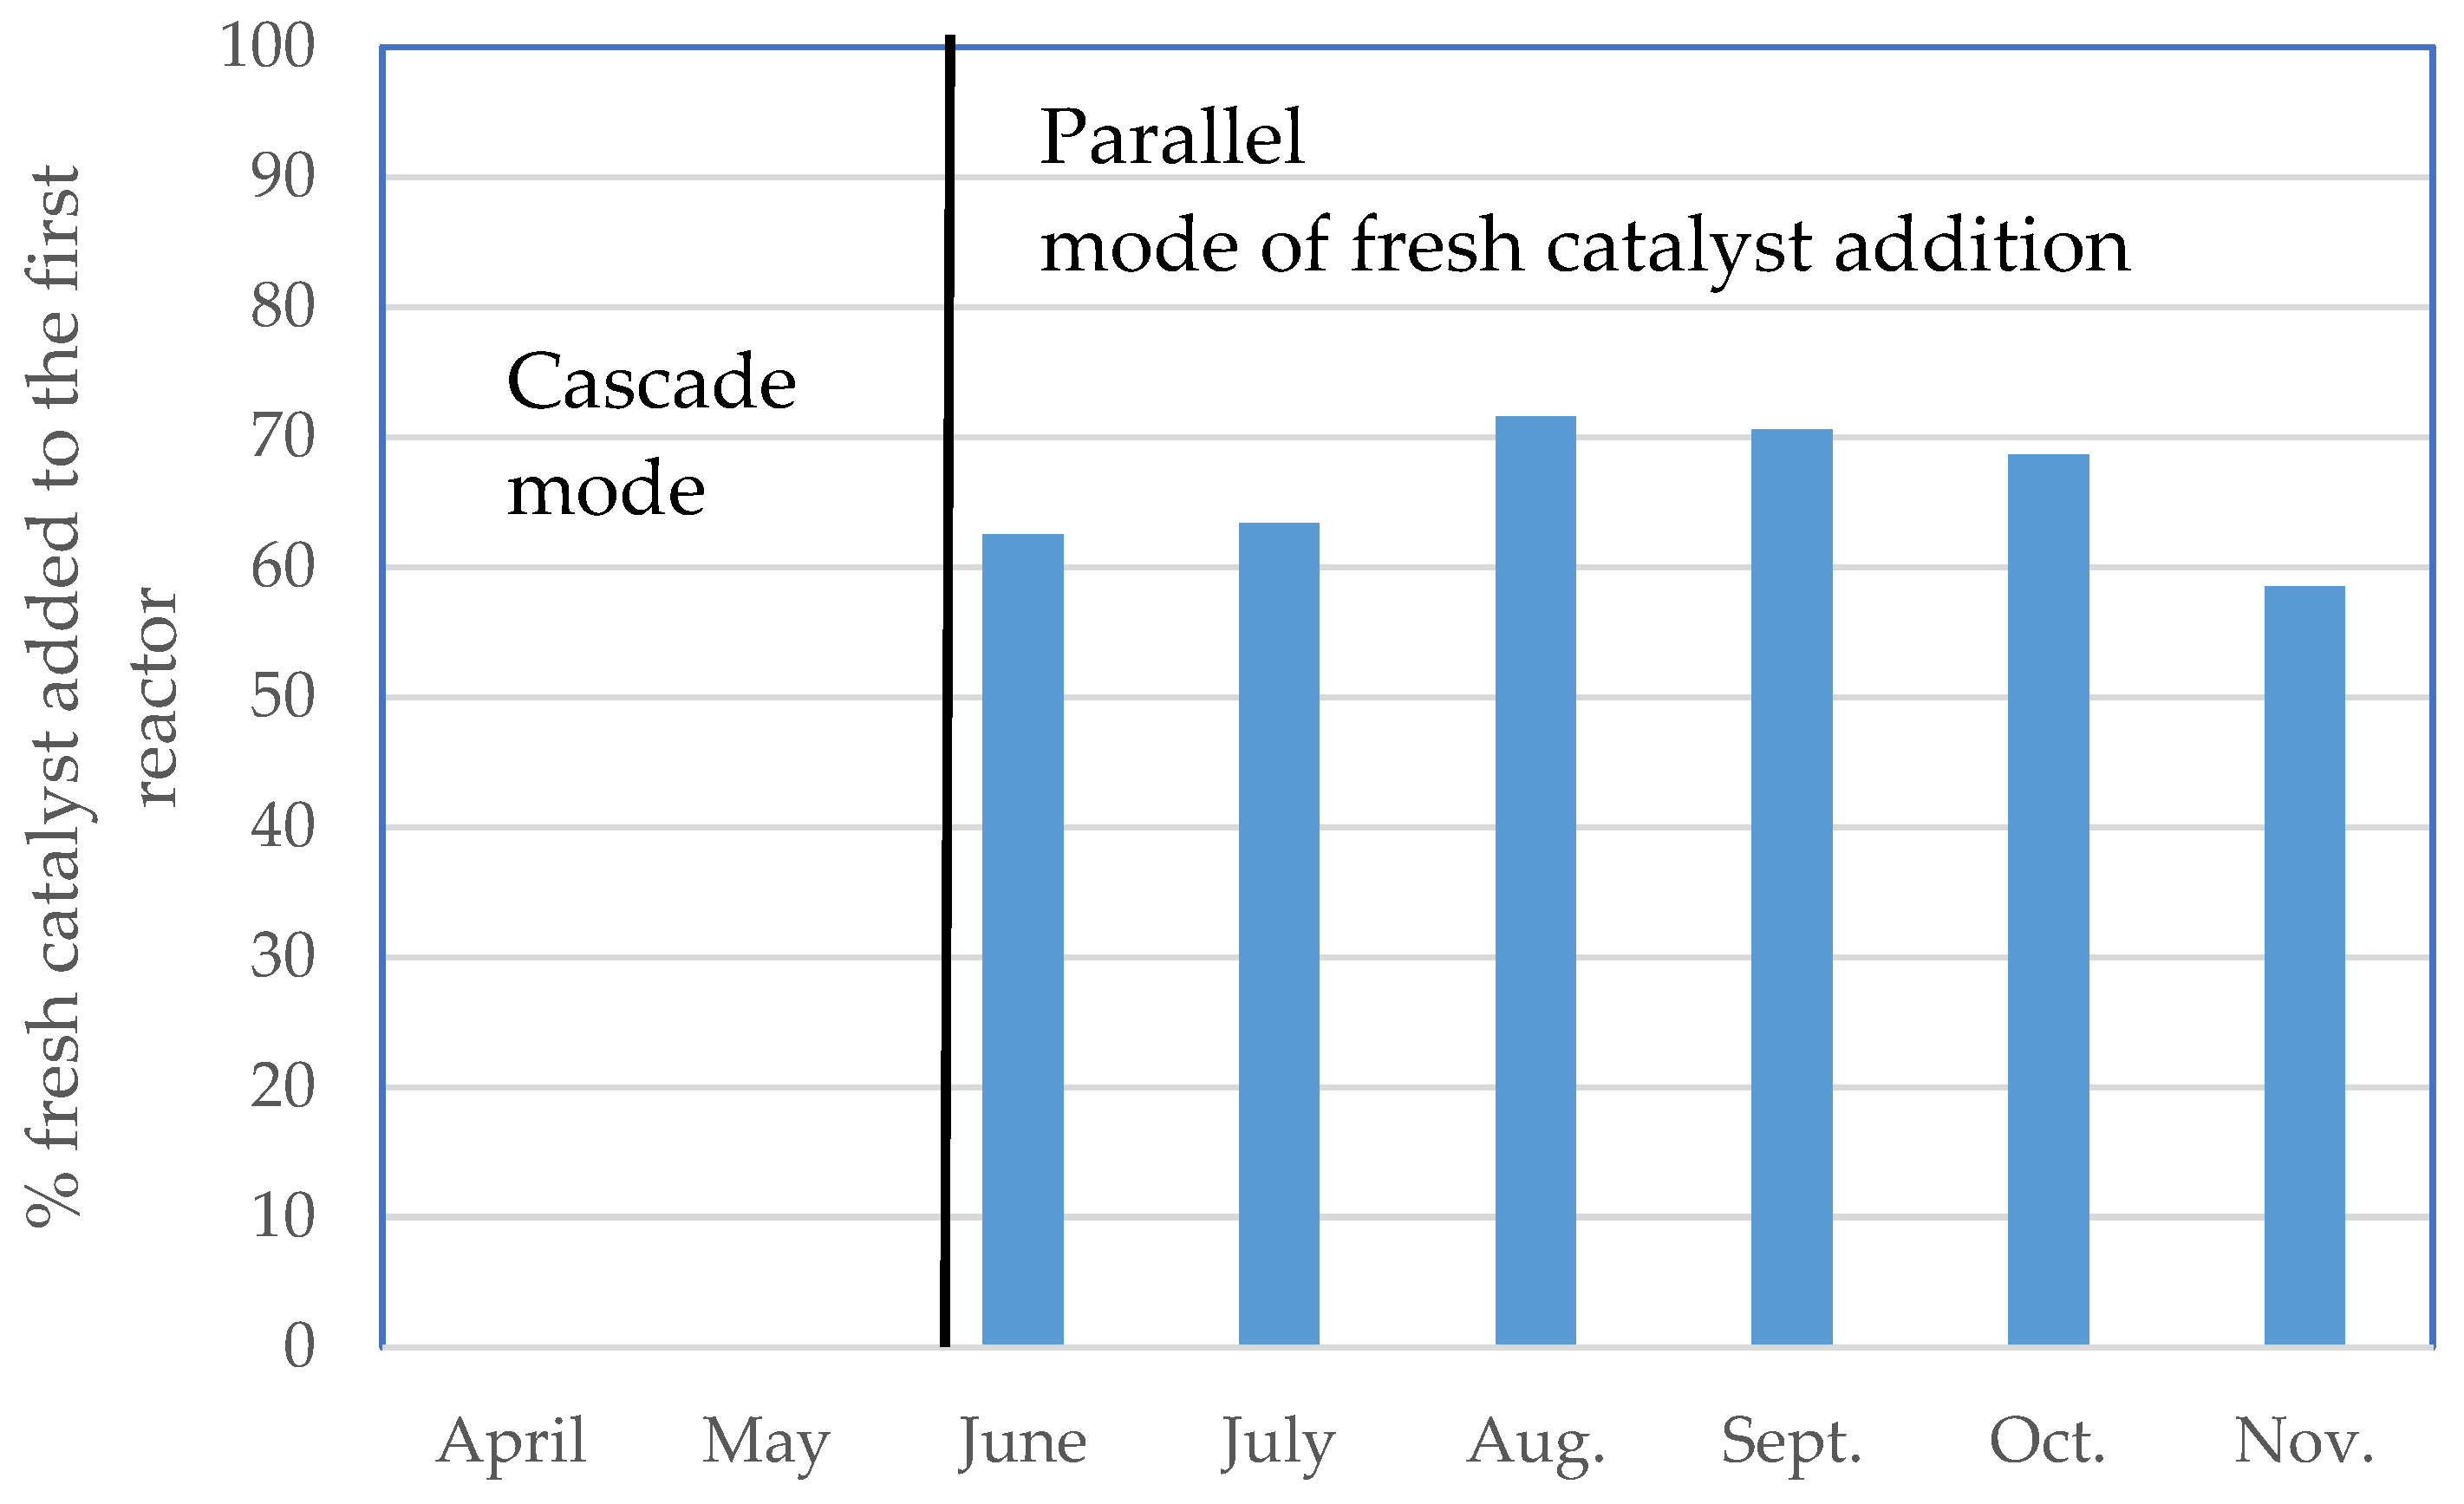
During the study the cascade catalyst system to add fresh catalyst was replaced by a parallel one as shown in Figure 4.
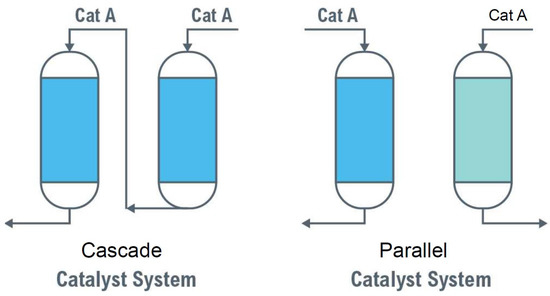
Figure 4.
Cascade and parallel modes of fresh catalyst addition employed in this study.
The properties of crude oils under study are presented in Table S1.
The SARA composition of straight run, and hydrocracked vacuum residues was analyzed by two procedures: that described in [29], and the SAR-ADTM method, described in [30]. The relationships between both methods are described in our recent investigation [16].
The net 540 °C+ vacuum residue conversion was calculated usin Equation (1).
where,
- HOilFeed540°C+ = mass flow rate of the H-Oil feed fraction boiling above 540 °C determined by the high temperature simulated distillation method ASTM D 7169 of the feed and multiplied by the mass flow rate of the feed in t/h;
- HOilProduct540°C+ = mass flow rate of the H-Oil product fraction boiling above 540 °C determined by high temperature simulated distillation. method ASTM D 7169 of the liquid product multiplied by the flow rate of the liquid product in t/h.
The asphaltene conversion was calculated using the following equation:
where,
- HOilFeedasp = asphaltene fraction content in the vacuum residual oil feed % multiplied by the feed rate in t/h;
- HOilProductasp = asphaltene fraction content in the hydrocracked vacuum residual oil (H-Oil VTB) product % multiplied by the H-Oil VTB flow rate in t/h.
The HDM was estimated by the use of Equation (3).
where,
- HDM = hydrodemetallization extent, %;
- HOilFeed(V + Ni) = content of vanadium and nickel in the feed, ppm;
- HOilProduct(V + Ni) = content of vanadium and nickel in the liquid product, ppm.
A colloidal instability index (CII) of the hydrocracked residue was calculated by Equation (4).
Depending on the antisolvent used n-pentane, or n-heptane the CII is designated as
CII (C5asp) and CII (C7asp), respectively.
The content of vanadium and nickel in studied residual oils was measured in accordance with the requirements of ASTM D 5863 standard.
The total existent sediment content (TSE) of the residual oils studied in this work was measured in accordance with the procedure IP 375 (International Petroleum Test Methods, 2011a).
A low sediment solid Ni-Mo catalyst and a nano-dispersed HCAT catalyst were employed during the study.
As input data, the ICrA method requires an m × n table with the measurements or evaluations of m objects against n criteria. As a result, it returns an n × n table with intuitionistic fuzzy pairs, defining the degrees of relation between each pair of criteria hence the name “intercriteria”, and allows making informed decisions that take into account the inherent uncertainty that complex real-life problems exhibit. For the sake of terminological precision, in ICrA, the term “correlation” between the criteria is avoided, but the terms “positive consonance”, “negative consonance” and “dissonance” are being used instead. For industrial objects that are characterized by a relatively strong “noise” caused by different disturbances of the process, the meaning of μ = 0.70 ÷ 1.00; υ = 0 ÷ 0.30 denotes a statistically meaningful significant positive relation, where the strong positive consonance exhibits values of μ = 0.90 ÷ 1.00; υ = 0 ÷ 0.1, and the weak positive consonance exhibits values of μ = 0.70 ÷ 0.80; υ = 0.20 ÷ 0.30. Respectively, the values of negative consonance with μ = 0 ÷ 0.30; υ = 0.70 ÷ 1.00 means a statistically meaningful negative relation, where the strong negative consonance exhibits values of μ = 0 ÷ 0.1; υ = 0.90 ÷ 1.00, and the weak negative consonance exhibits values of μ = 0.20 ÷ 0.30; υ = 0.70 ÷ 0.80. All other cases are considered dissonance. For a more detailed explanation of the essence of ICrA, the reader can refer to our previous study [16].
3. Results
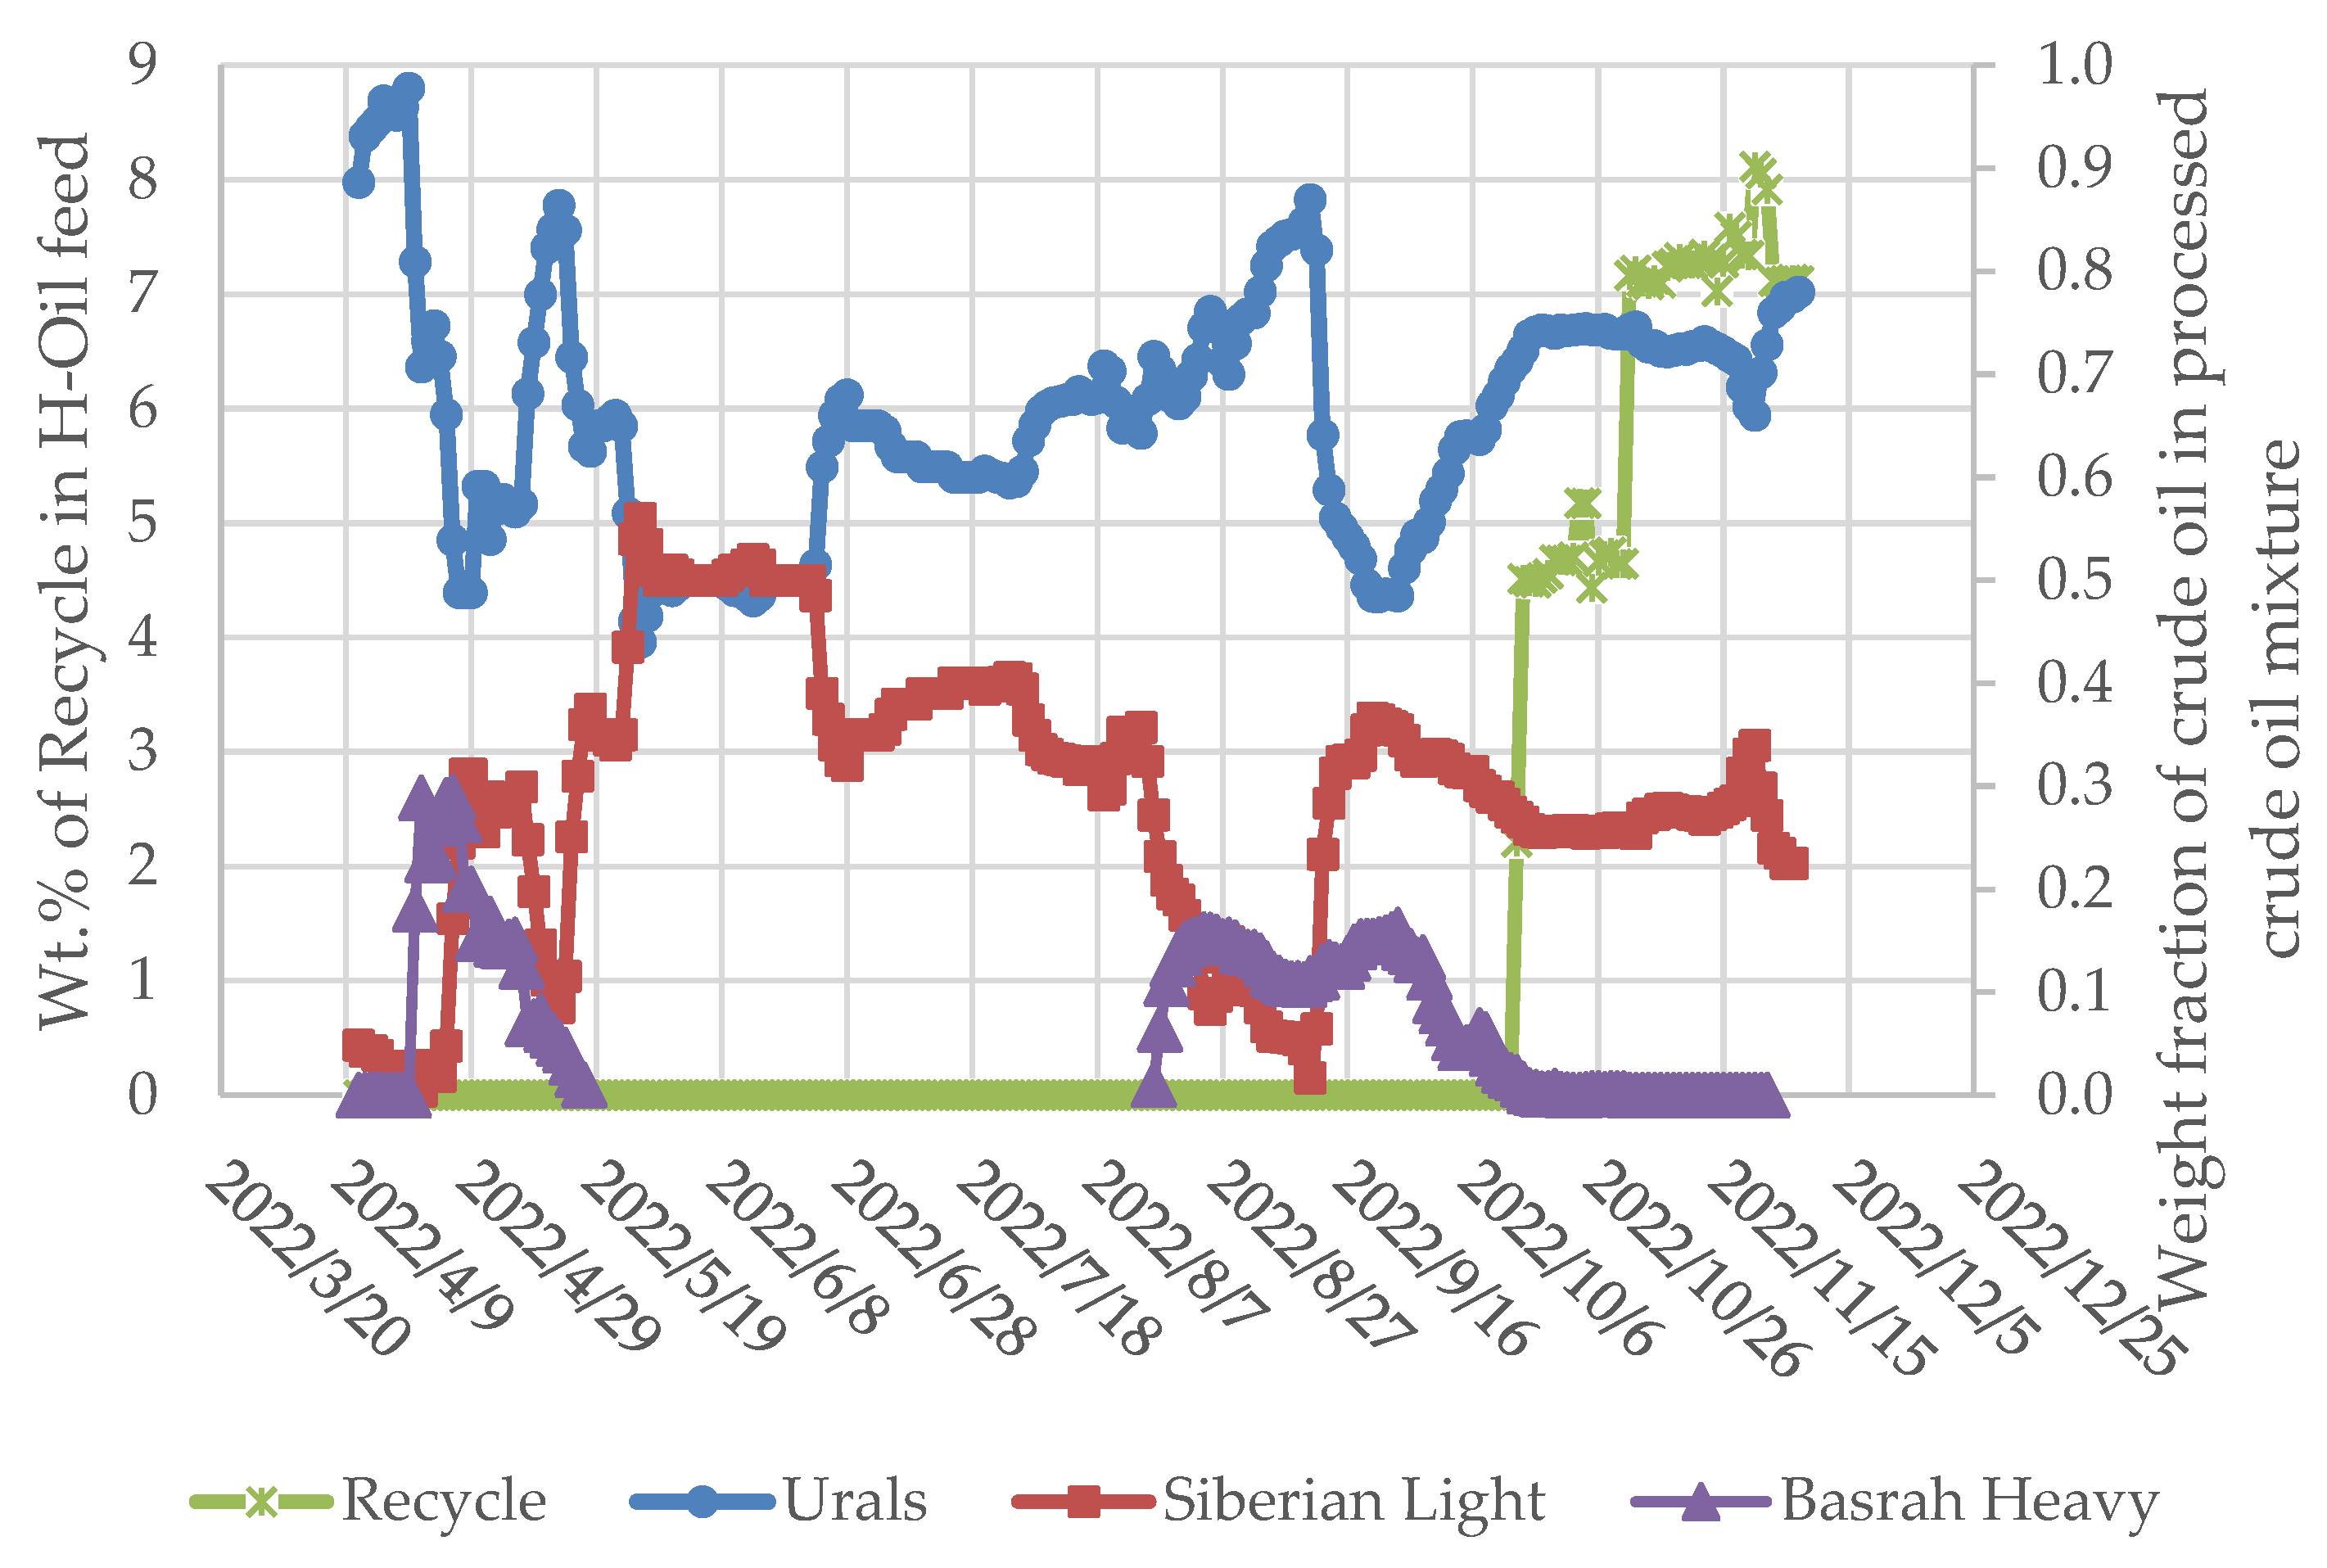
Having in mind that the feedstock is the only variable that mostly influences the ebullated bed vacuum residue hydrocracking, an analysis of crude slate and the percent of recycle processed in the ebullated bed vacuum residue hydrocracker for the studied period 11 April 2022–28 November 2022 was made and presented as Figure 5. This data shows that for the studied period, the Urals crude oil share varied between 40 and 100 wt.%; the Siberian Light crude oil share varied between 0 and 60 wt.%; the Basrah Heavy crude oil varied between 0 and 16 wt.%.
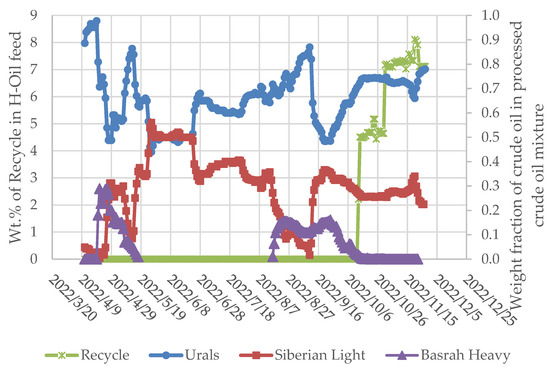
Figure 5.
Variation of the individual crude oil share in the crude oil mixture processed during the studied period, and the recycle share in the hydrocracker feedstock.
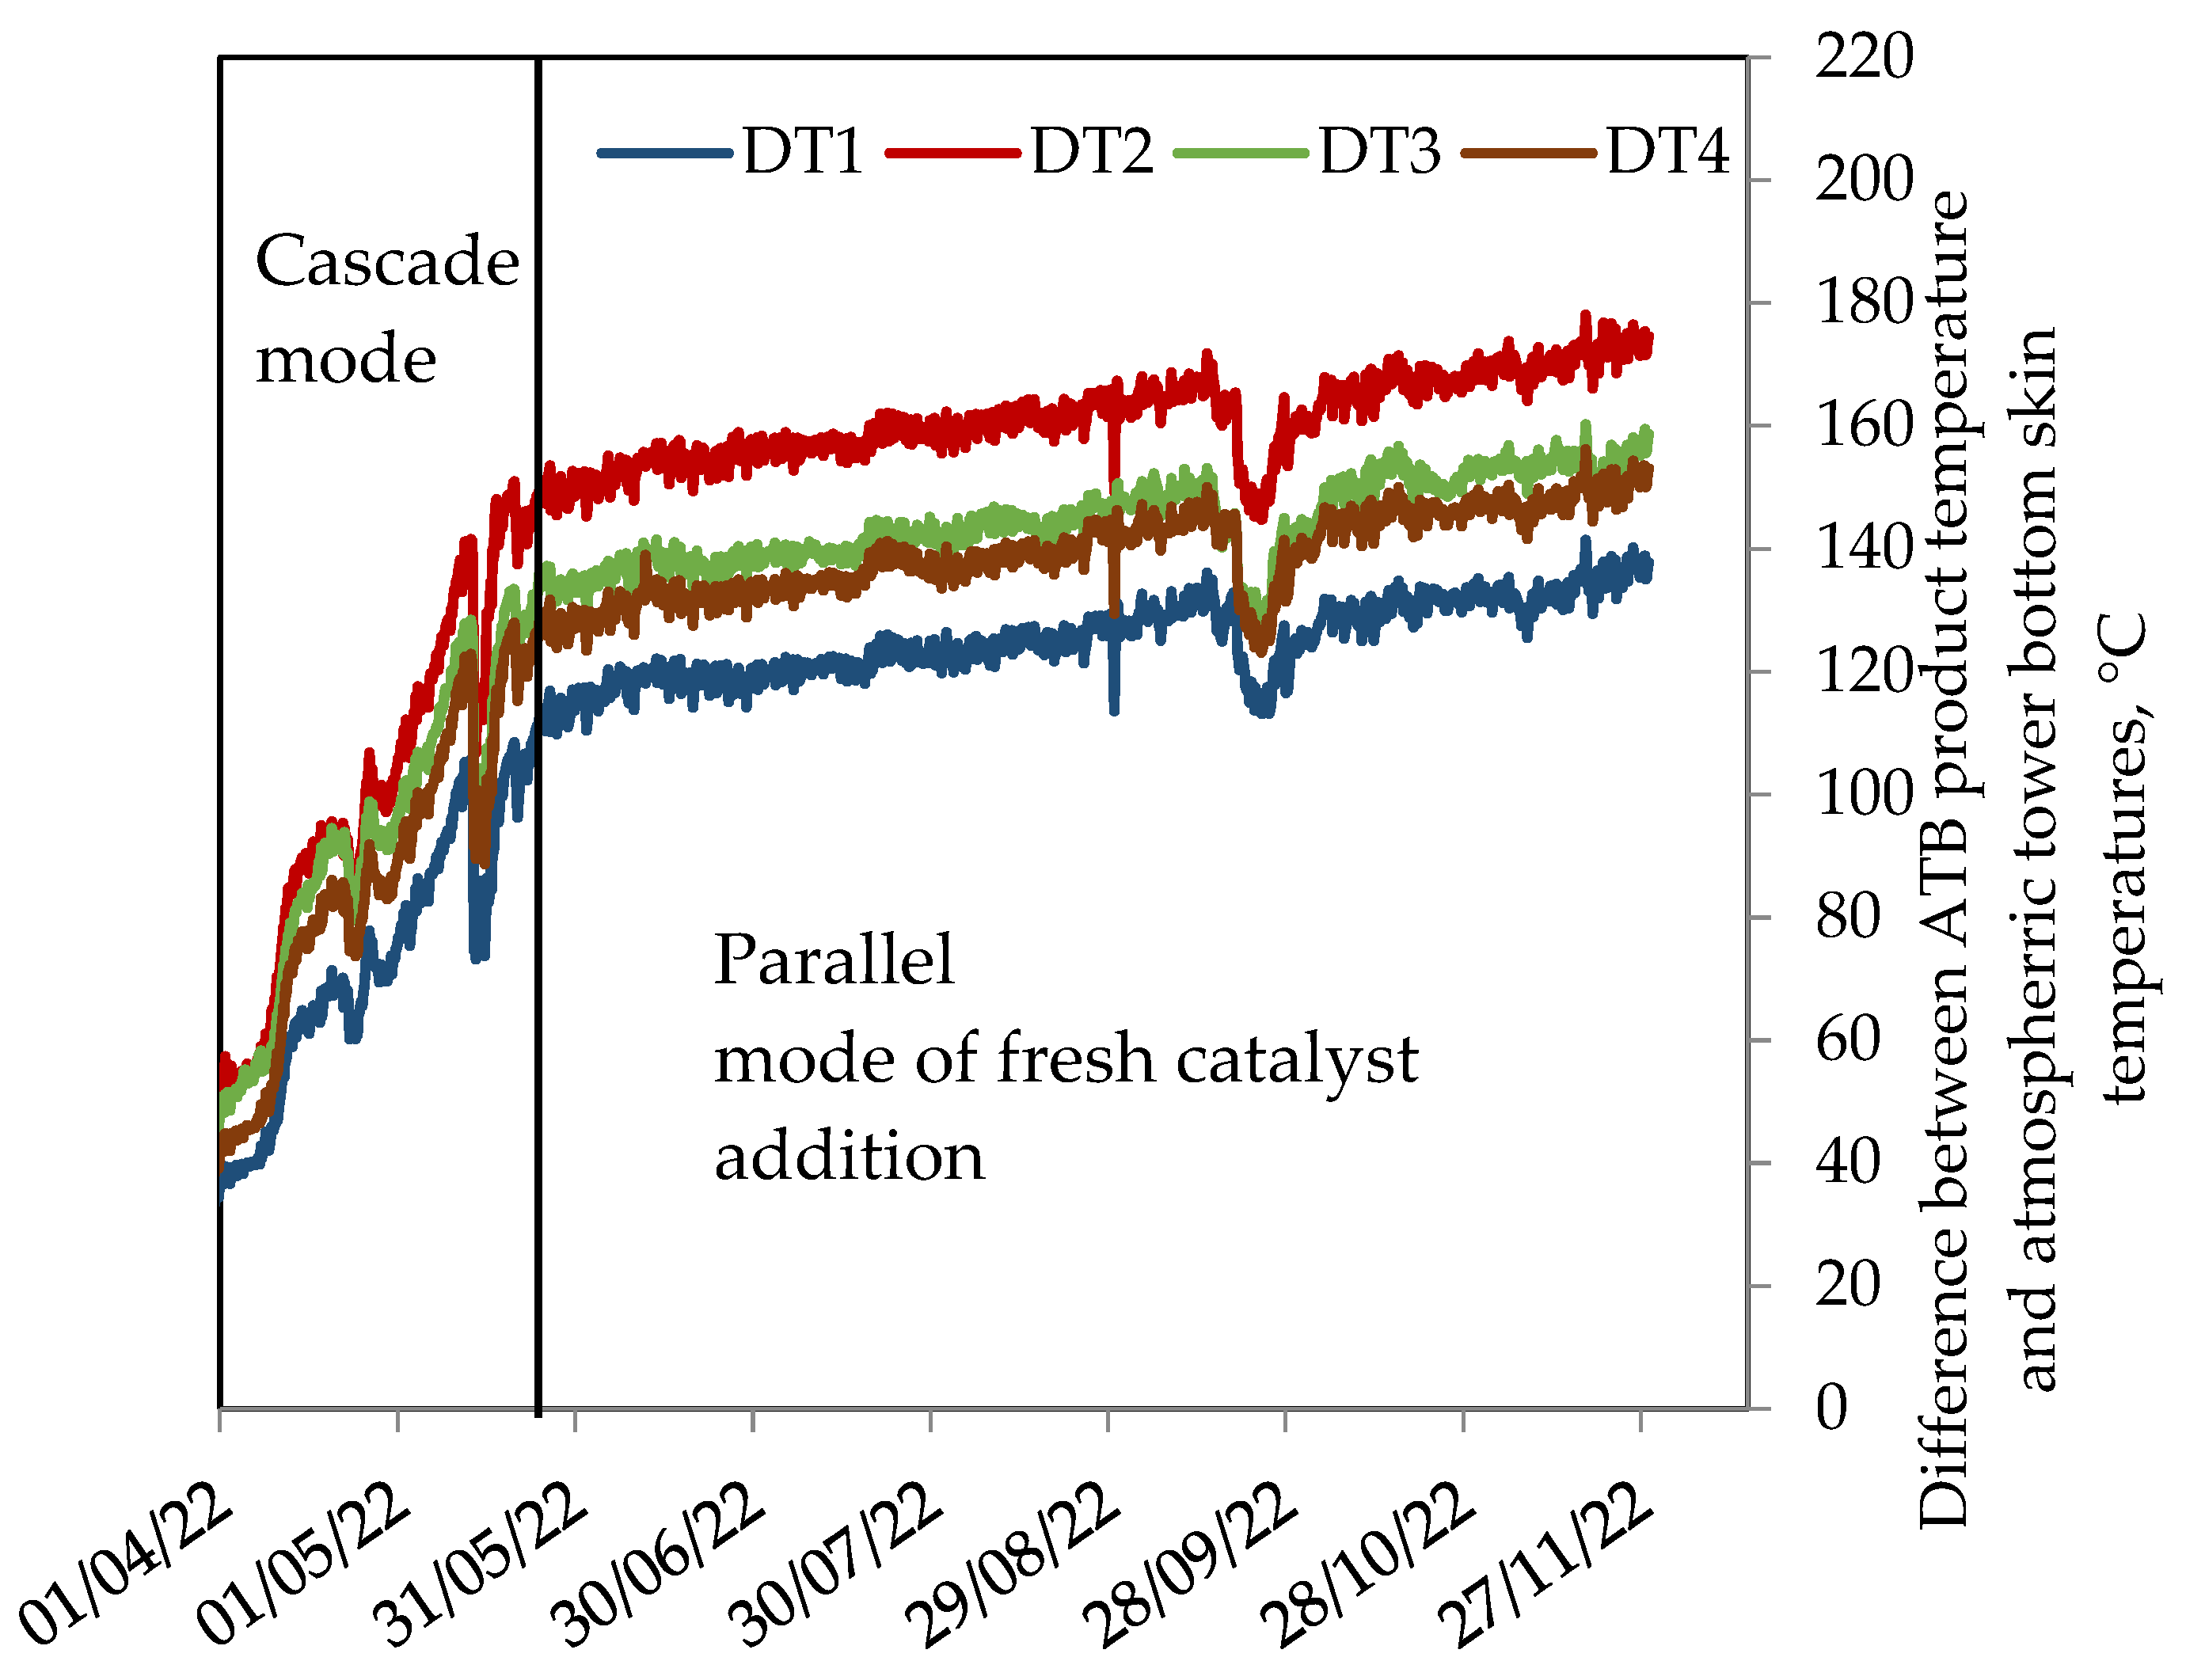
Figure 6 presents a graph of the variation of the difference between readings of the ATB product temperature and the atmospheric tower bottom skin temperatures during the studied period. This data is an indicator for the fouling rate in the ebullated bed vacuum residue hydrocracker. It is evident from this data that after replacement of the cascade mode of fresh catalyst addition to the parallel one, the fouling rate, judged by the slope of the difference between readings for the ATB product temperature and the atmospheric tower bottom skin temperatures, significantly drops.

Figure 6.
Variation of difference between readings between the ATB product temperature and the atmospheric tower bottom skin temperatures during the studied period (DT1; DT2, DT3, DT4 = differences between temperature of ATB product and the different ATB skin thermocouples).
Figure 7 shows the variation of H-Oil ATB sediment content and reaction temperature (WABT) for the studied period of time when both cascade and parallel modes of fresh catalyst addition are employed. This data shows that during the use of the parallel mode of fresh catalyst addition, the ATB sediment content is lower than the maximum allowable limit of 0.4 wt.%. At late September 2022, there are two points going above the maximum allowable limit of 0.4 wt.%. This can be explained by the interruption of fluid catalytic cracking slurry oil (SLO) addition to the H-Oil feed in amount of 8 wt.% due to the shut down of the FCC unit for maintenance.
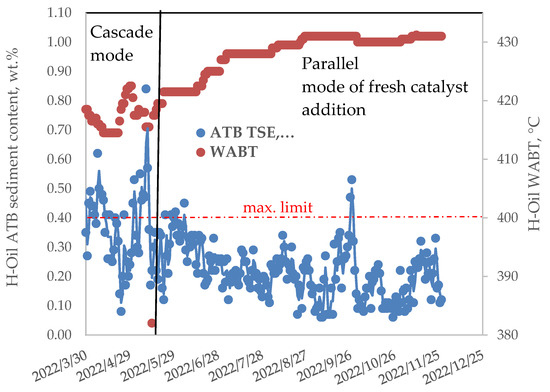
Figure 7.
Variation of ATB sediment content (TSE = total sediment existent), and reaction temperature (WABT) for the studied period of time.
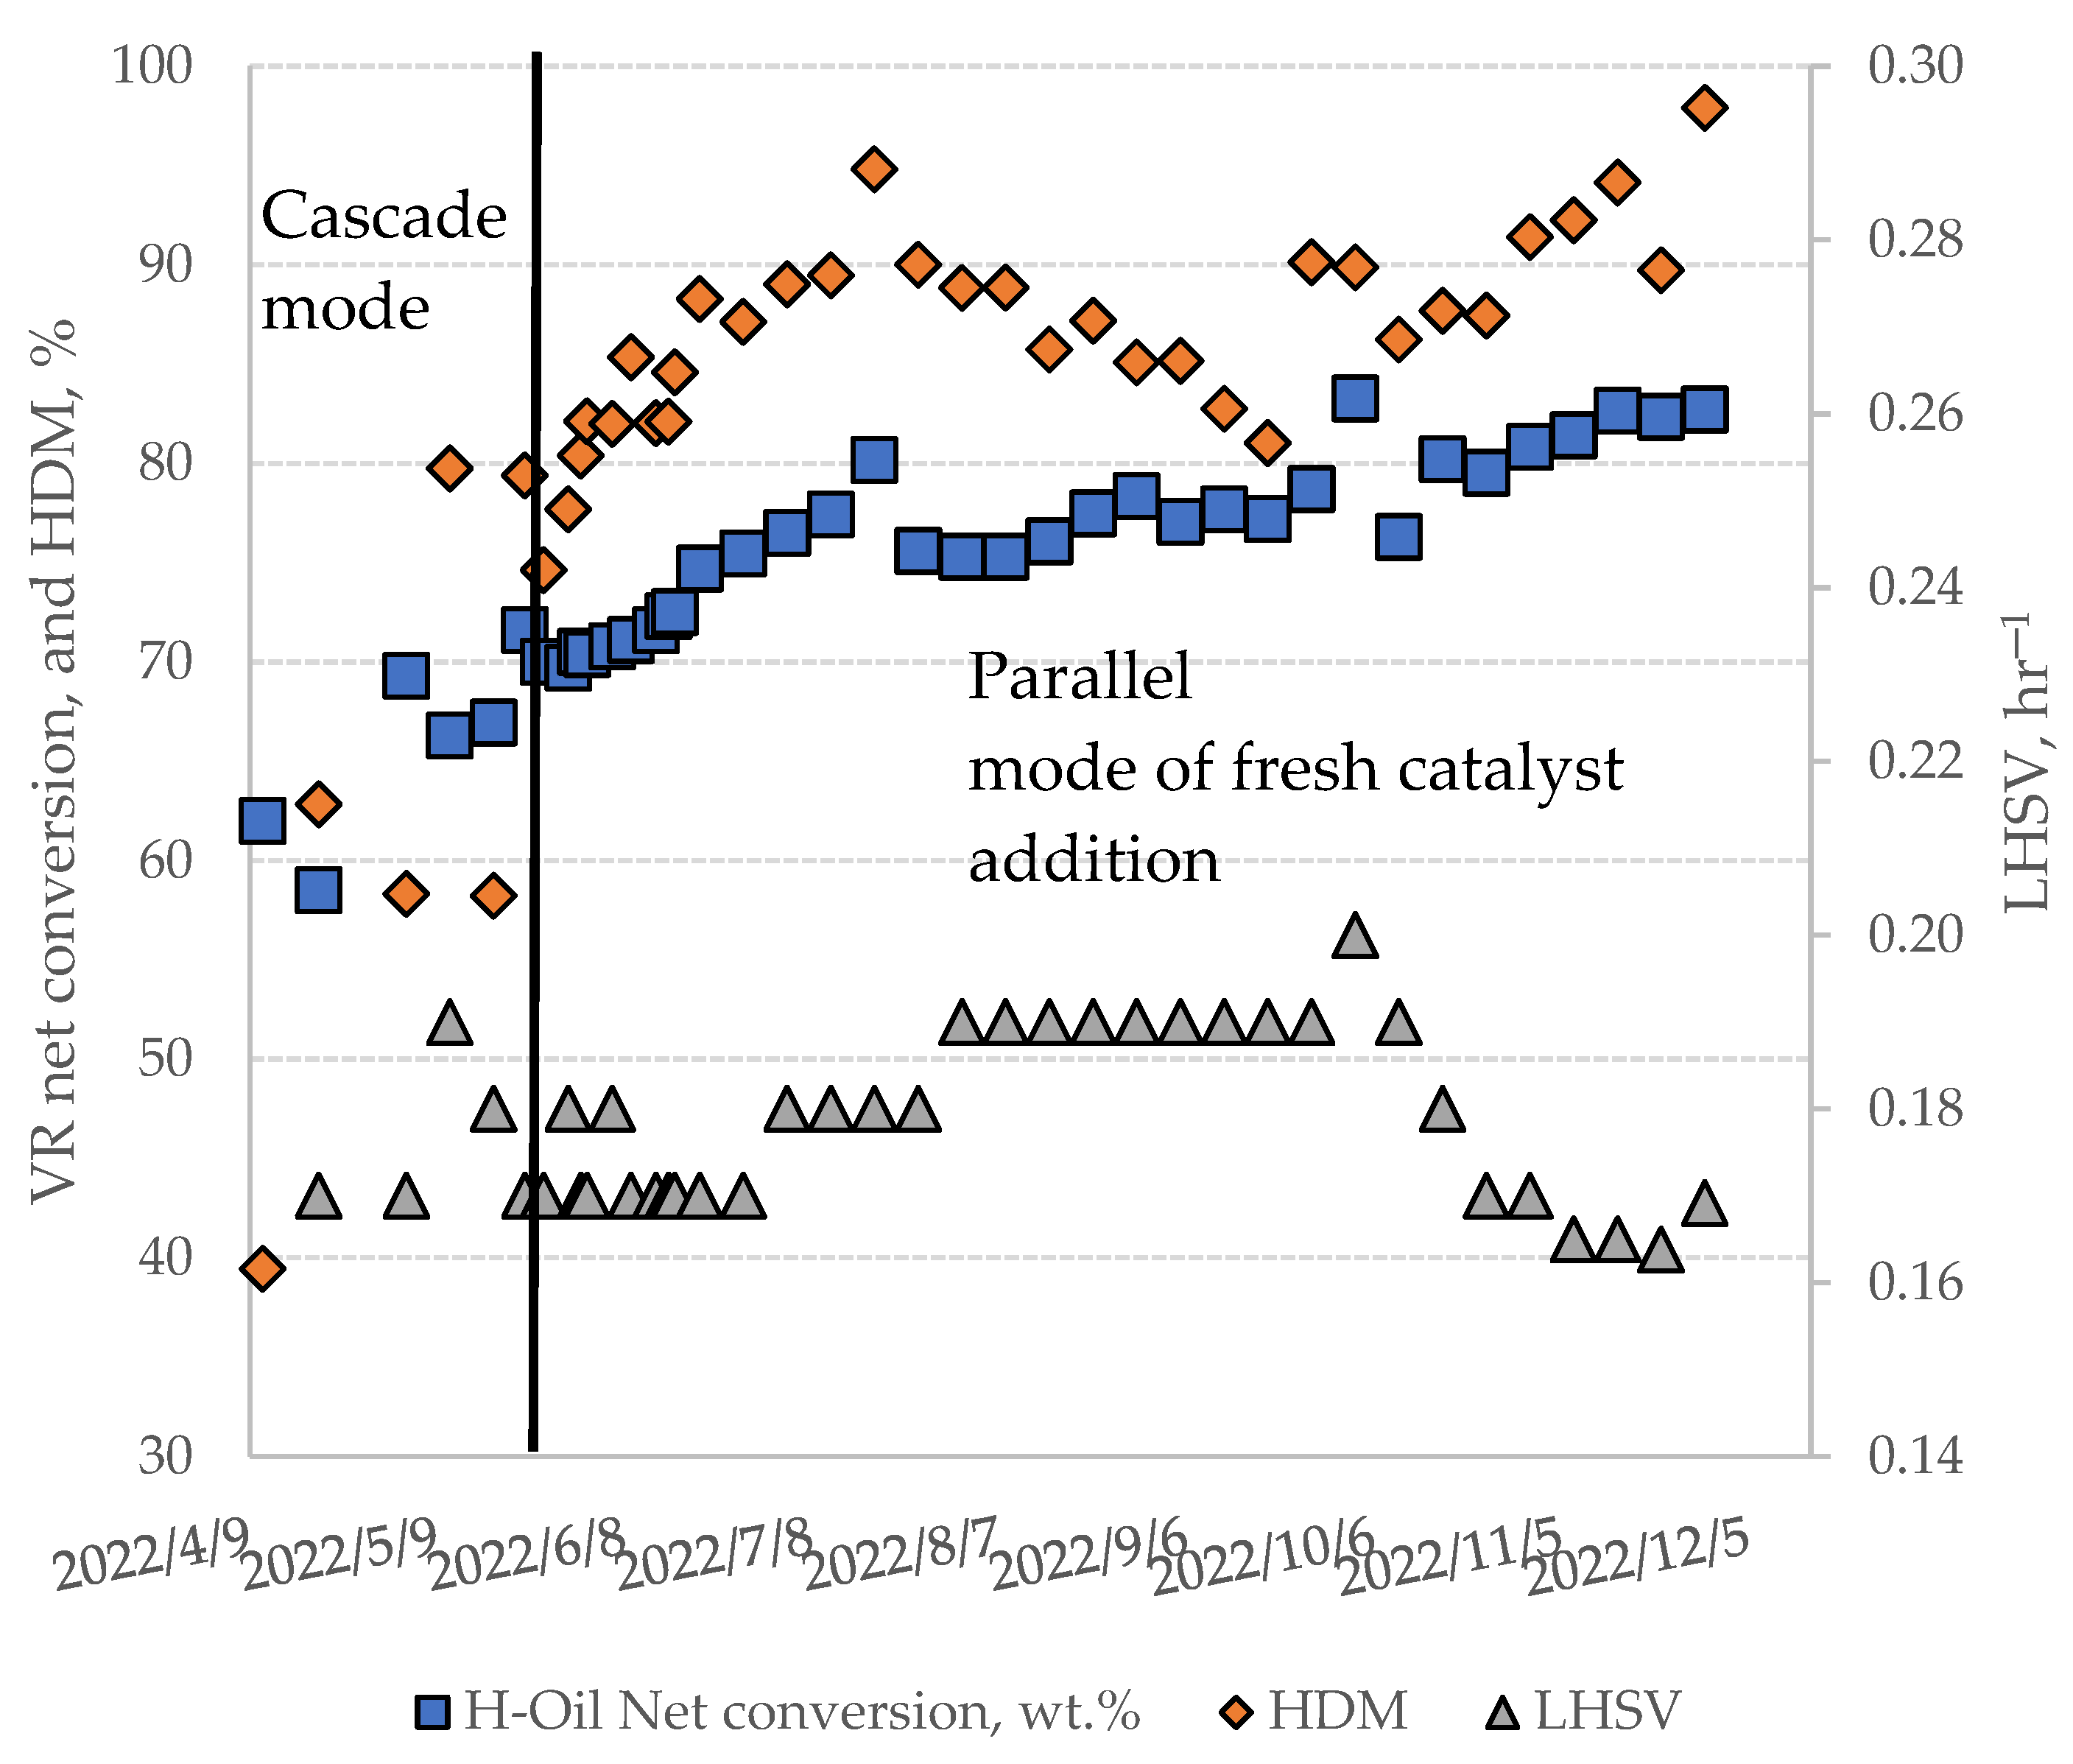
Figure 8 indicates how hydrodemetallization (HDM), net conversion, and liquid hourly space velocity (LHSV) varied during the investigated period when both cascade and parallel modes of fresh catalyst addition were practiced. This data shows that with the replacement of the cascade with the parallel mode of fresh catalyst addition, the net conversion increases from 70 to 82.7 wt.%. The HDM extent in general exhibits an increasing trend (from 40 to 97.9%) with some fluctuations. The LHSV averages at about 0.15 ± 0.2 h−1, which is lower than the design value of 0.25 h−1, which retards the sediment formation rate [16,33].

Figure 8.
Variation of HDM, net conversion, and LHSV during the investigated period.
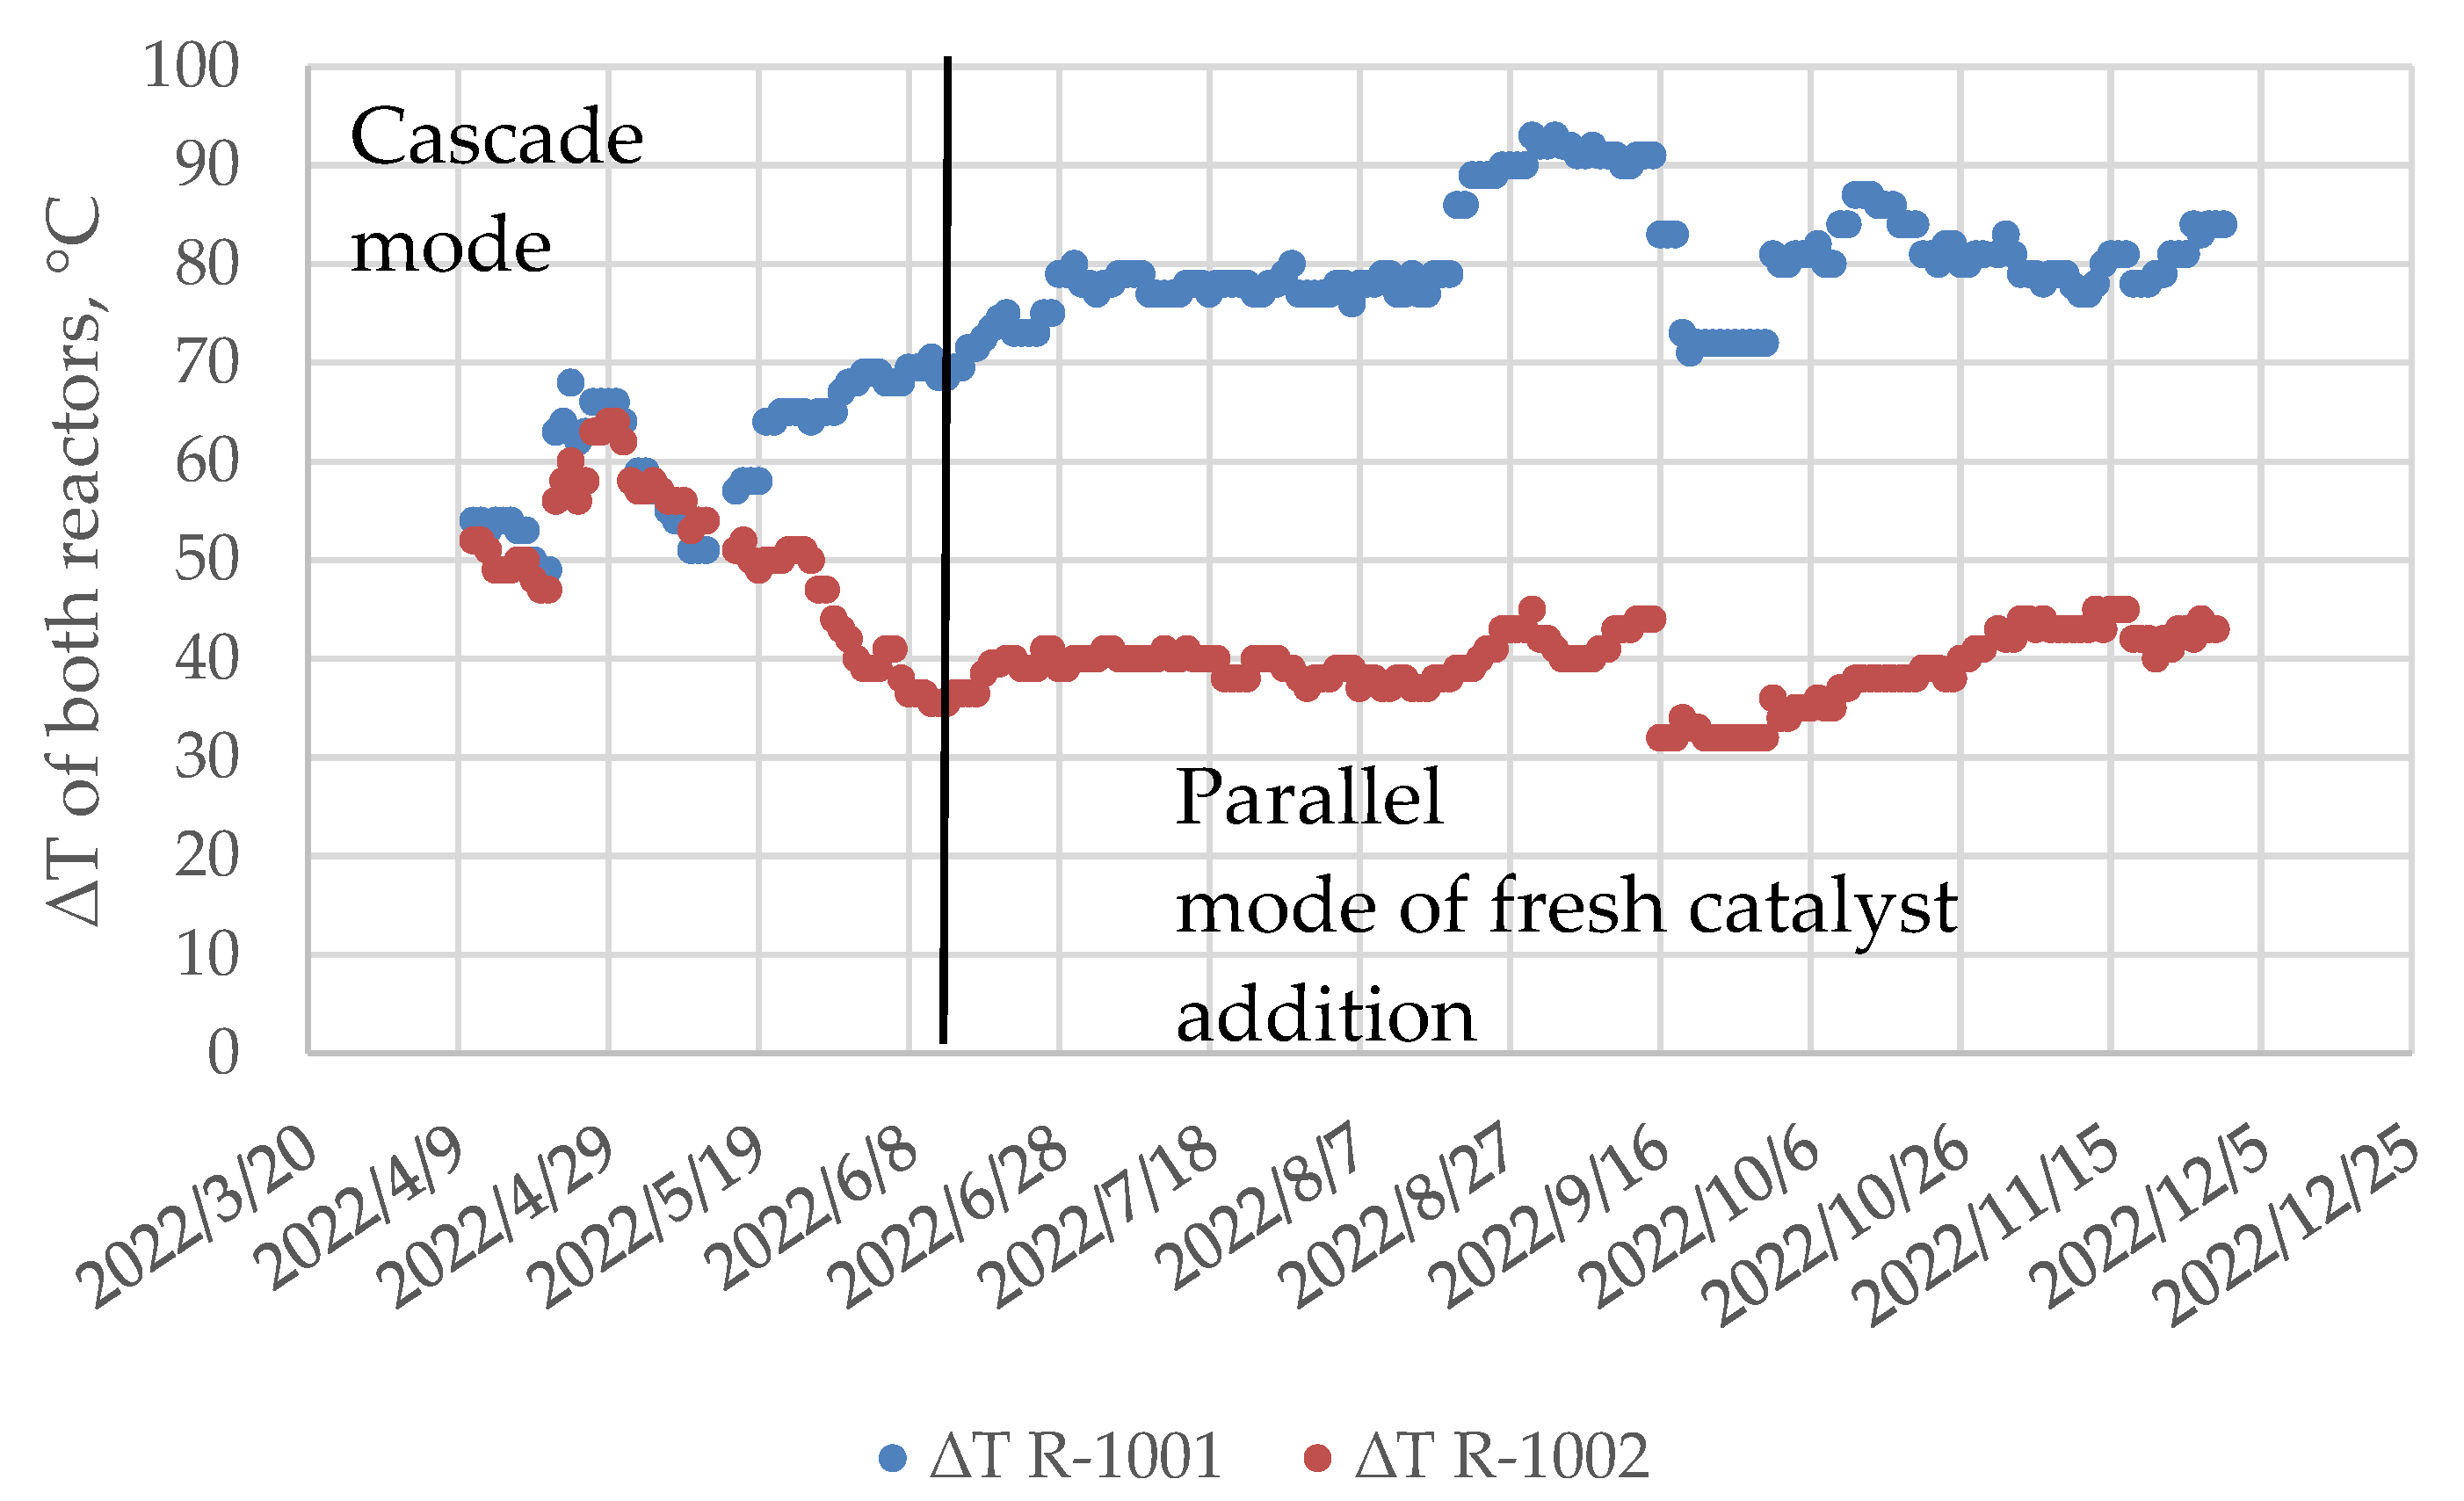
Figure 9 shows the variation of ΔT in both ebullated bed reactors during the study. It is evident from this data that ΔT of the first reactor, after application of the parallel mode of fresh catalyst addition, increases from 65 to 93 °C, while that of the second reactor drops from 50 to 33 °C.
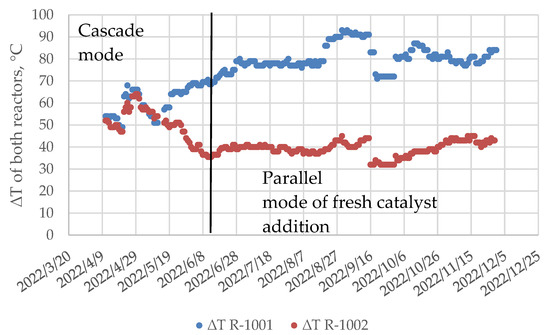
Figure 9.
Variation of ΔT of both ebullated bed reactors during the investigated period.
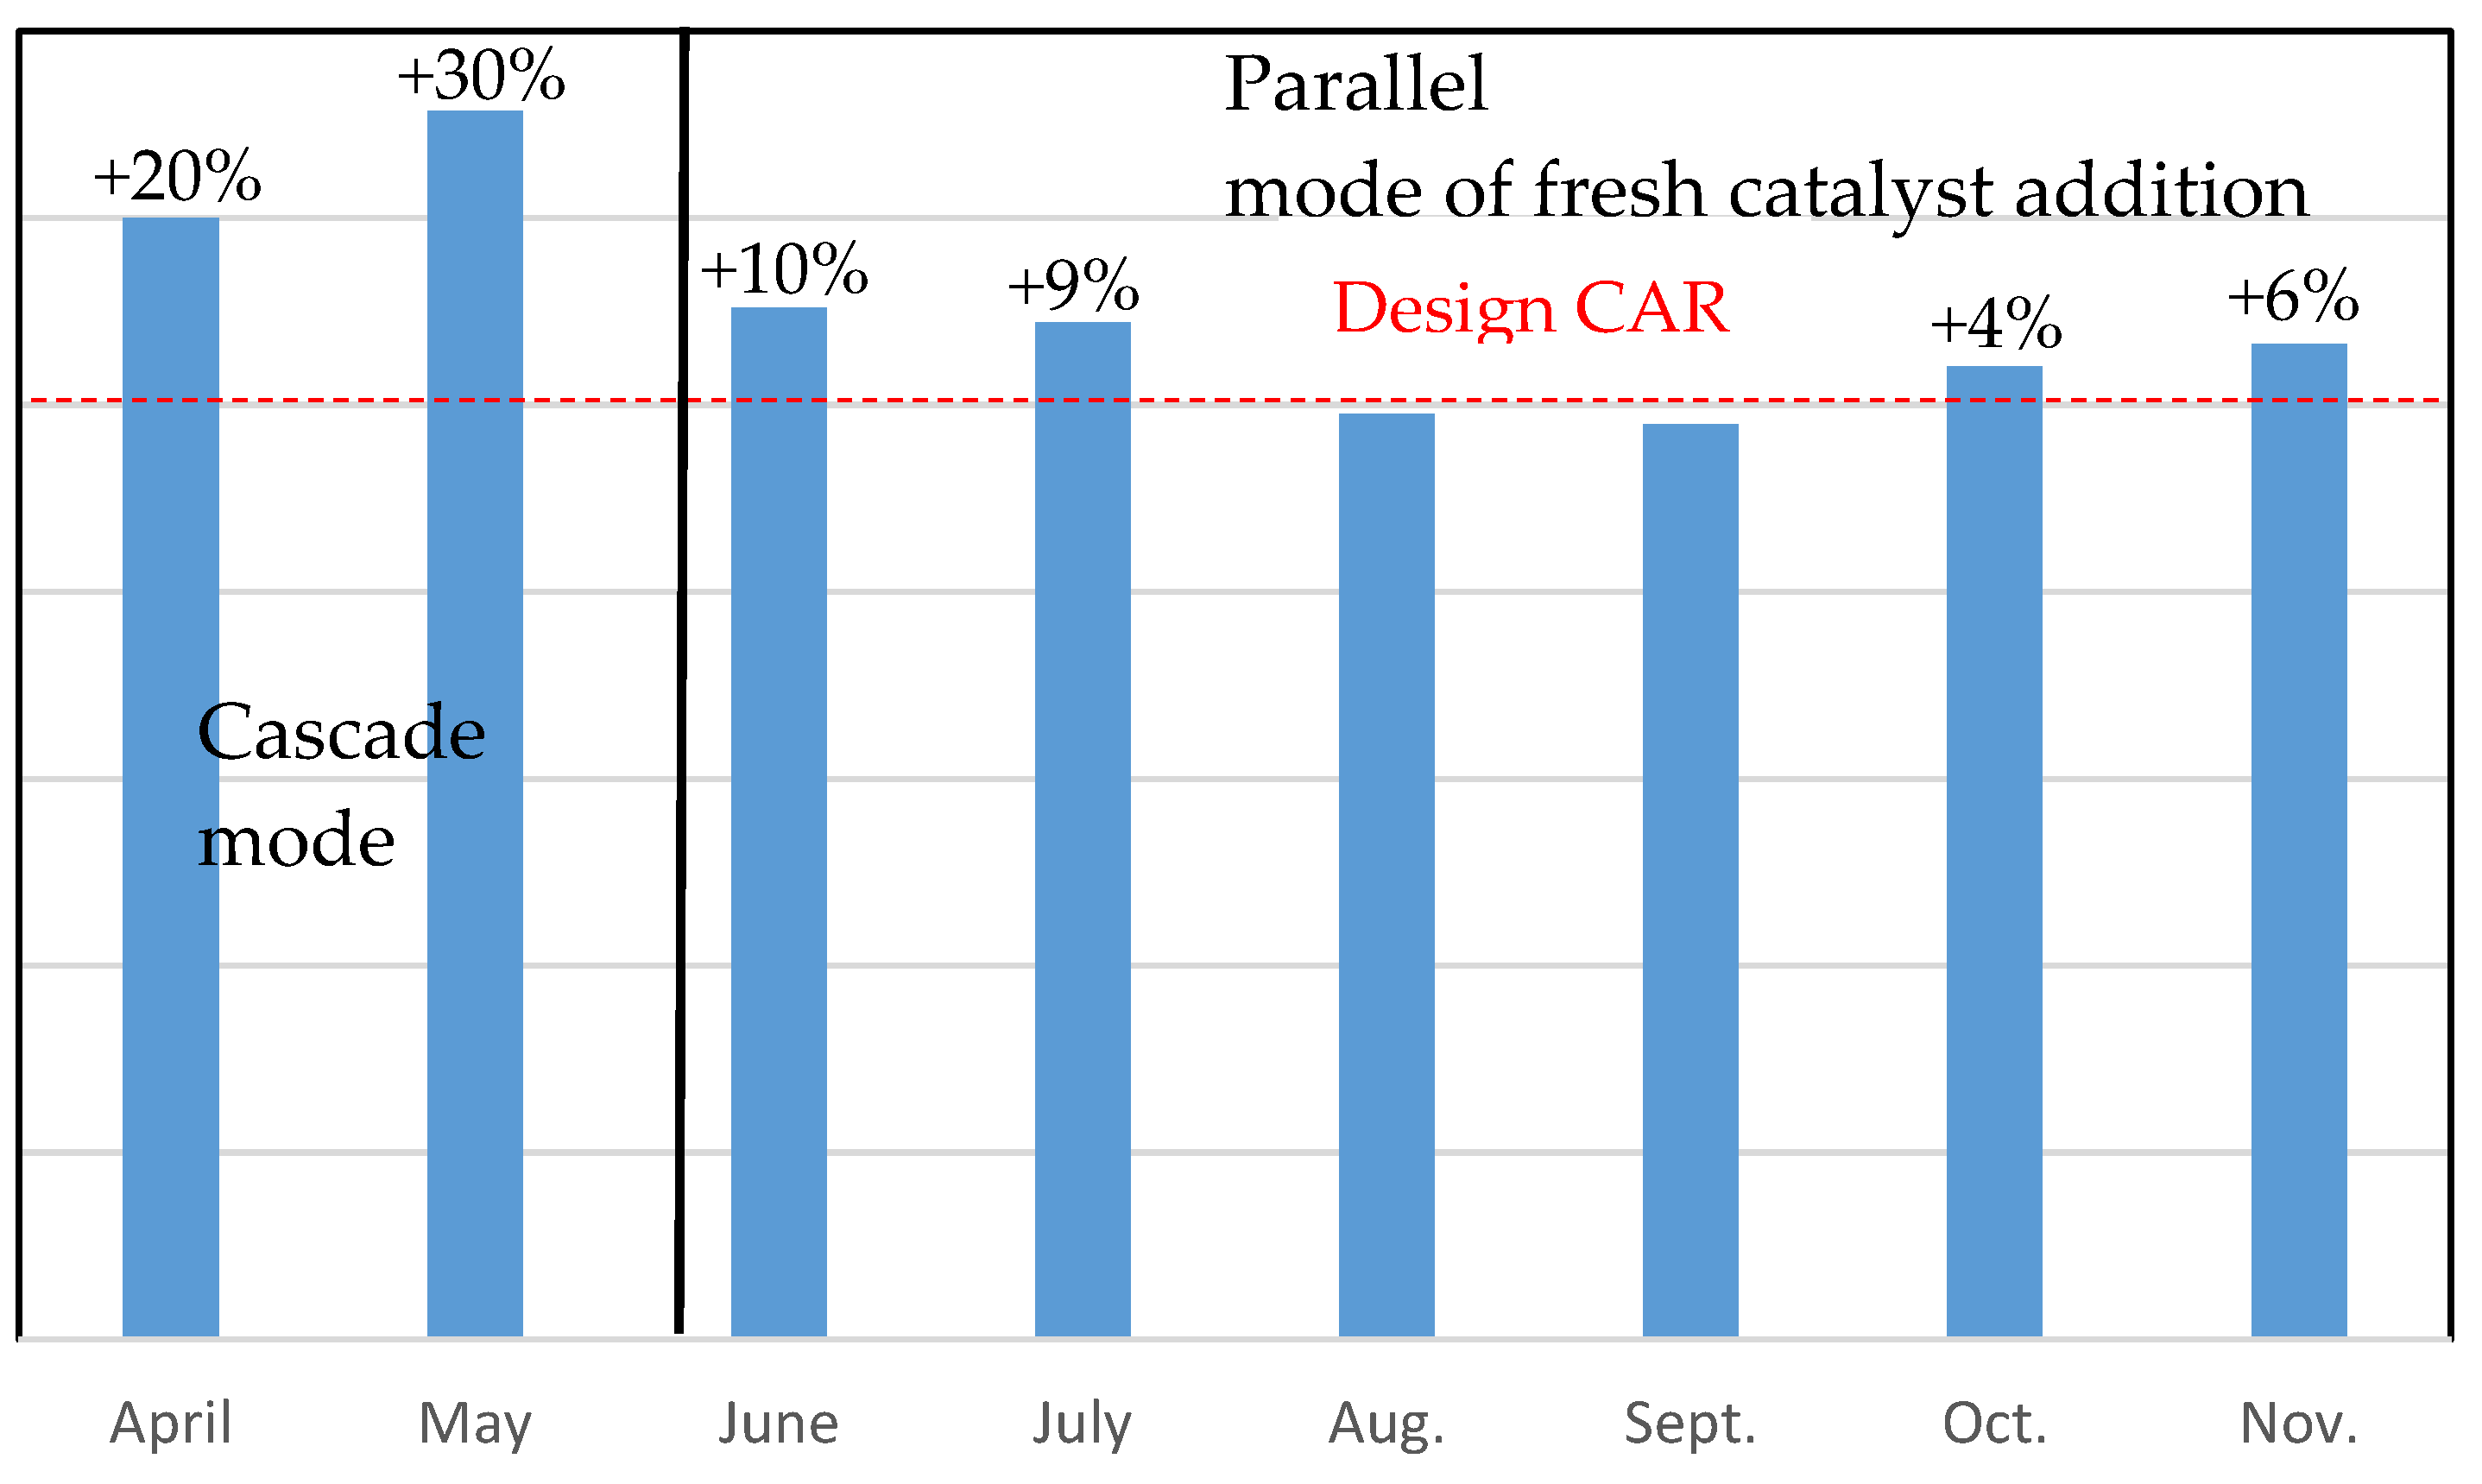
Figure 10 shows the variation in catalyst addition rate (CAR) during the study. Initially, the CAR was increased by 20–30% relative to the design CAR in the cascaded mode. Then it was decreased during the employment of the parallel mode of fresh catalyst addition between −2 and +10% of the design CAR.
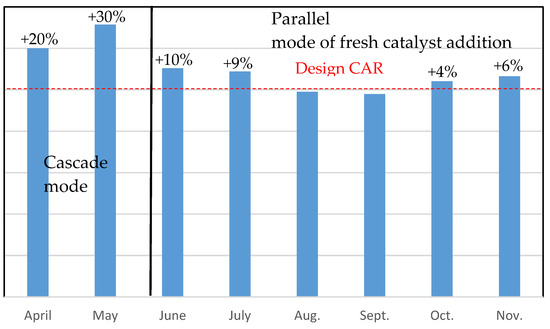
Figure 10.
Variation of catalyst addition rate during cascade and parallel modes of fresh catalyst addition for the investigated period of time.
Figure 11 shows a graph of the share of the fresh catalyst added in the first ebullated bed reactor relative to the total fresh catalyst added in both reactors. This data indicates that in the cascade mode, no fresh catalyst enters the first reactor, while in the parallel mode, the amount of fresh catalyst entering the first reactor varies between 60 and 70%.
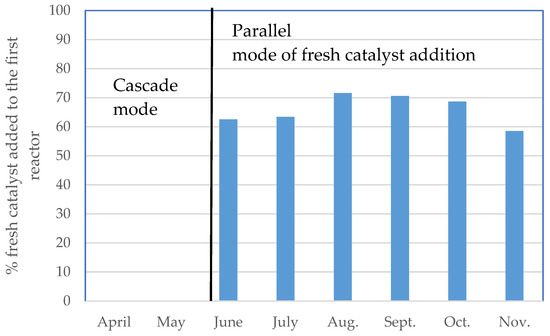
Figure 11.
Per cent of the fresh catalyst added in the first ebullated bed reactor relative to the total fresh catalyst added in both reactors.
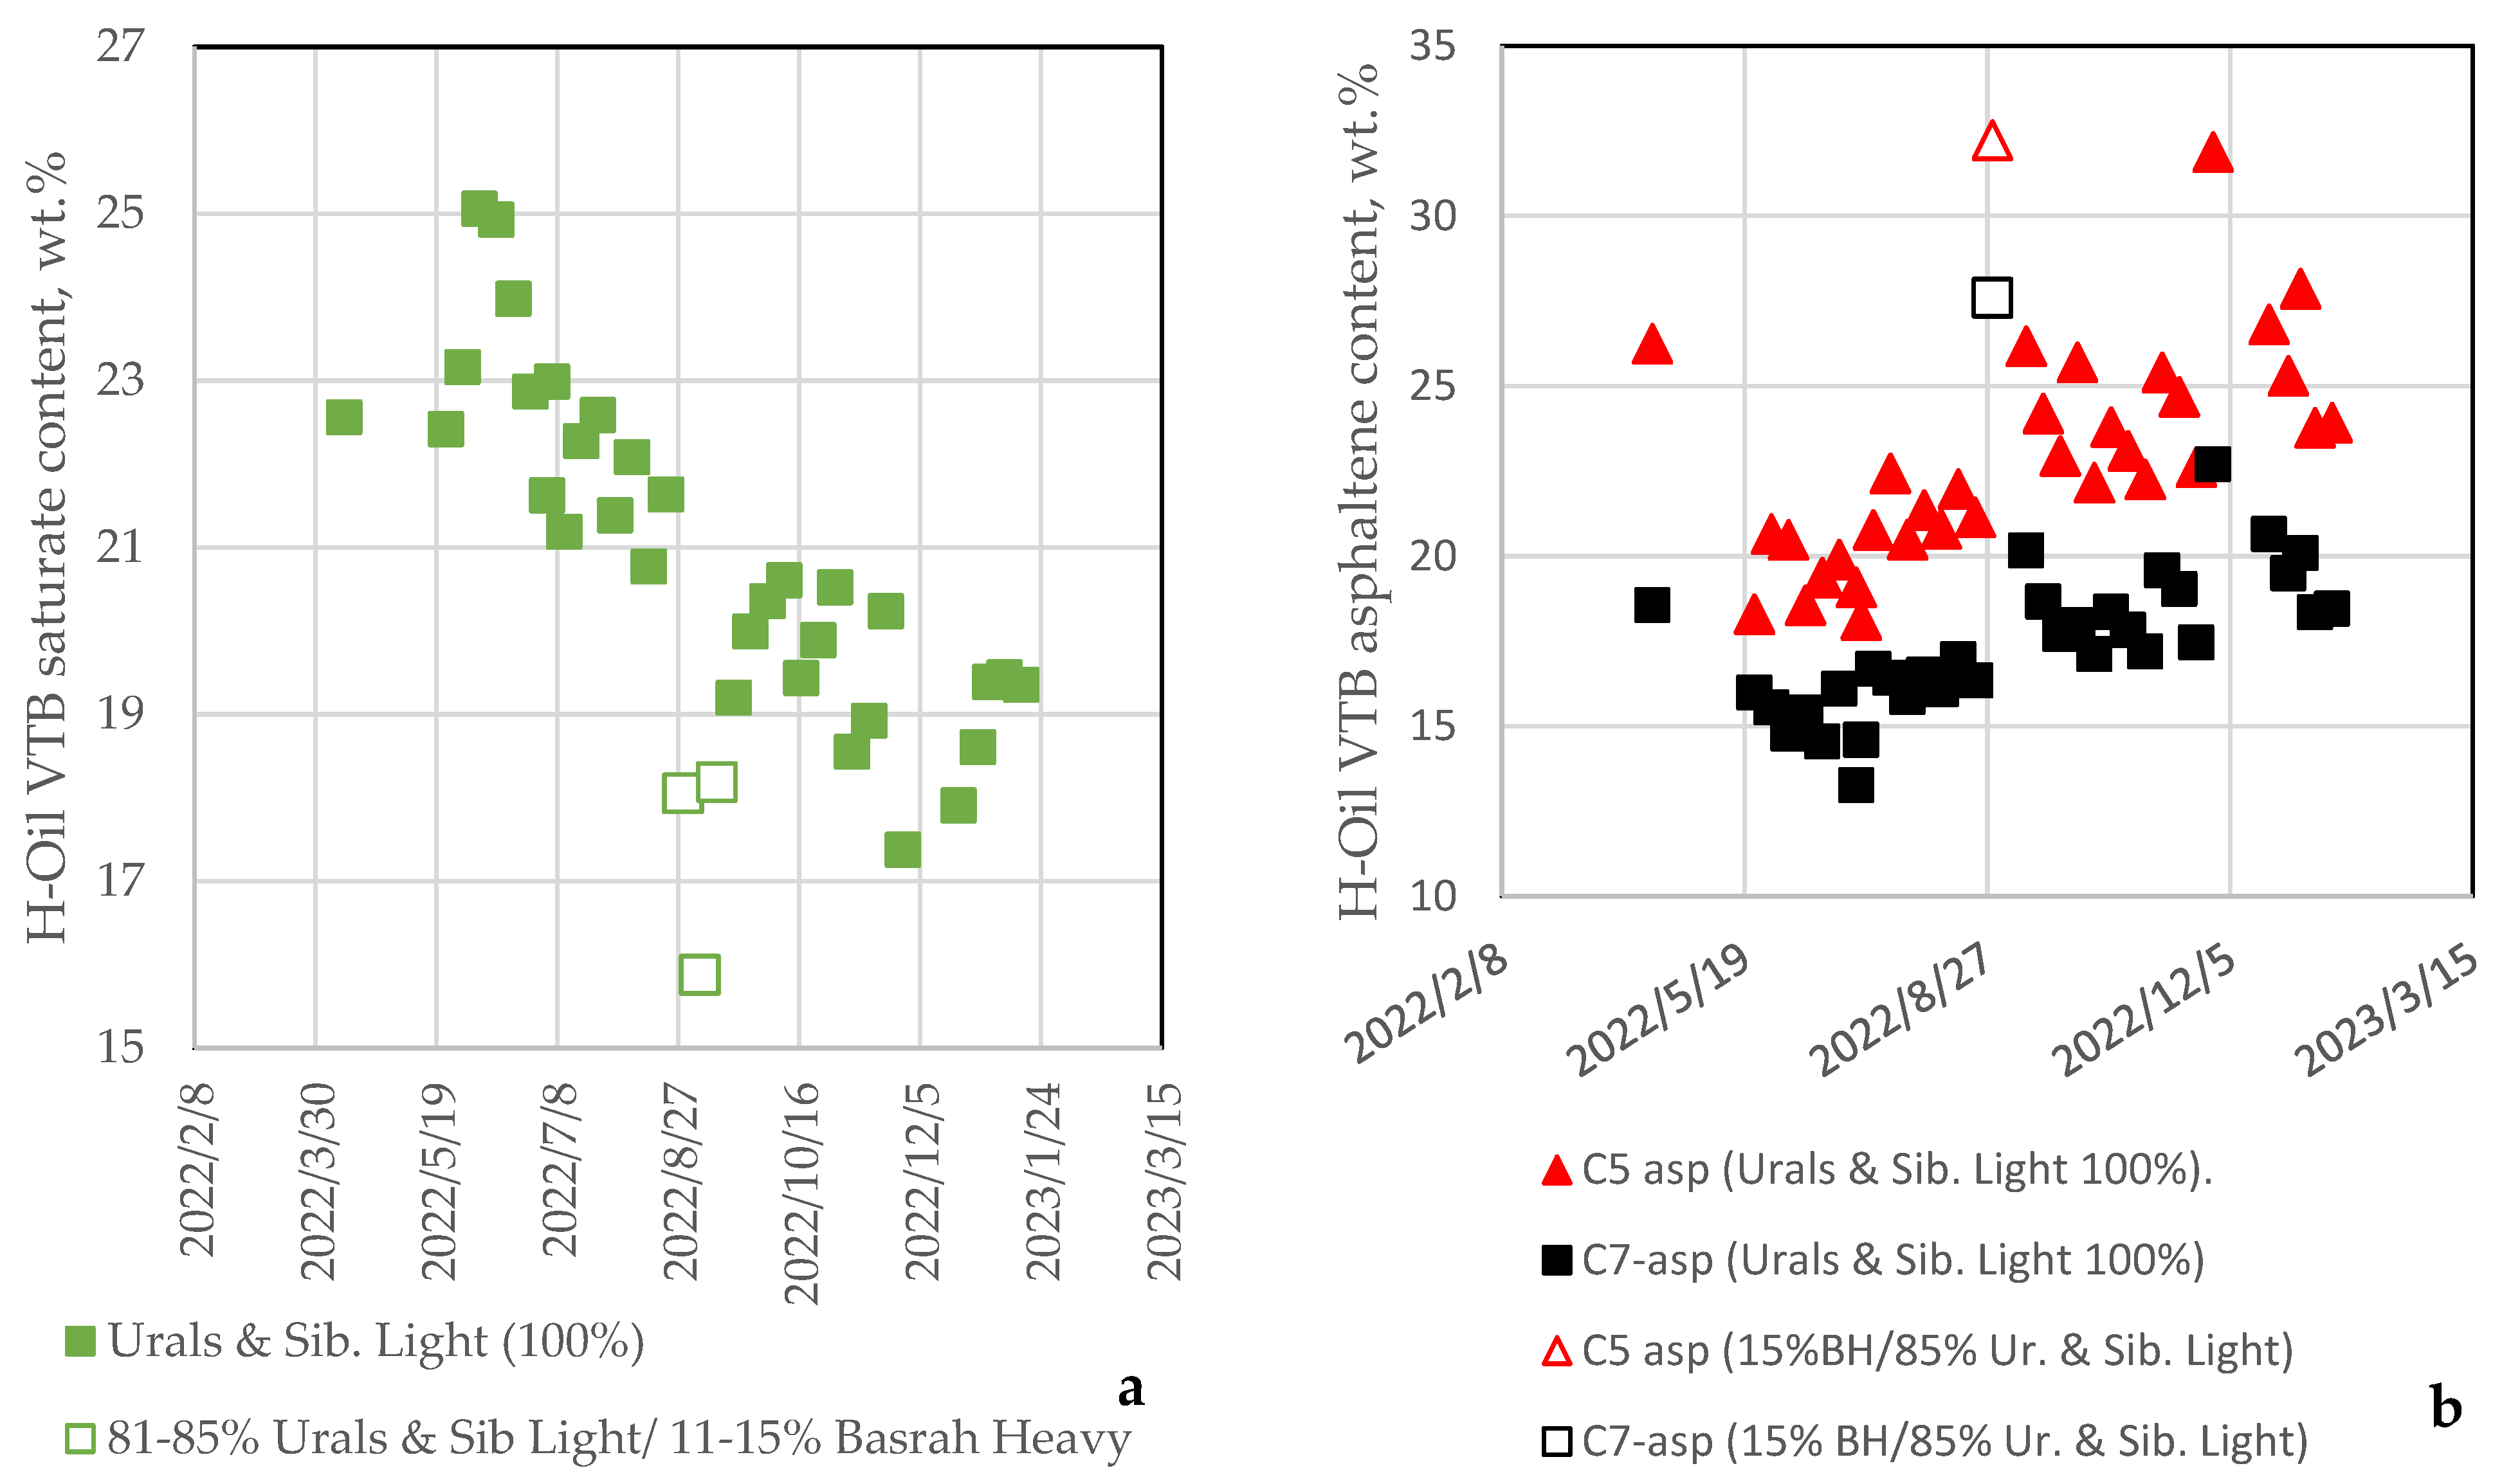
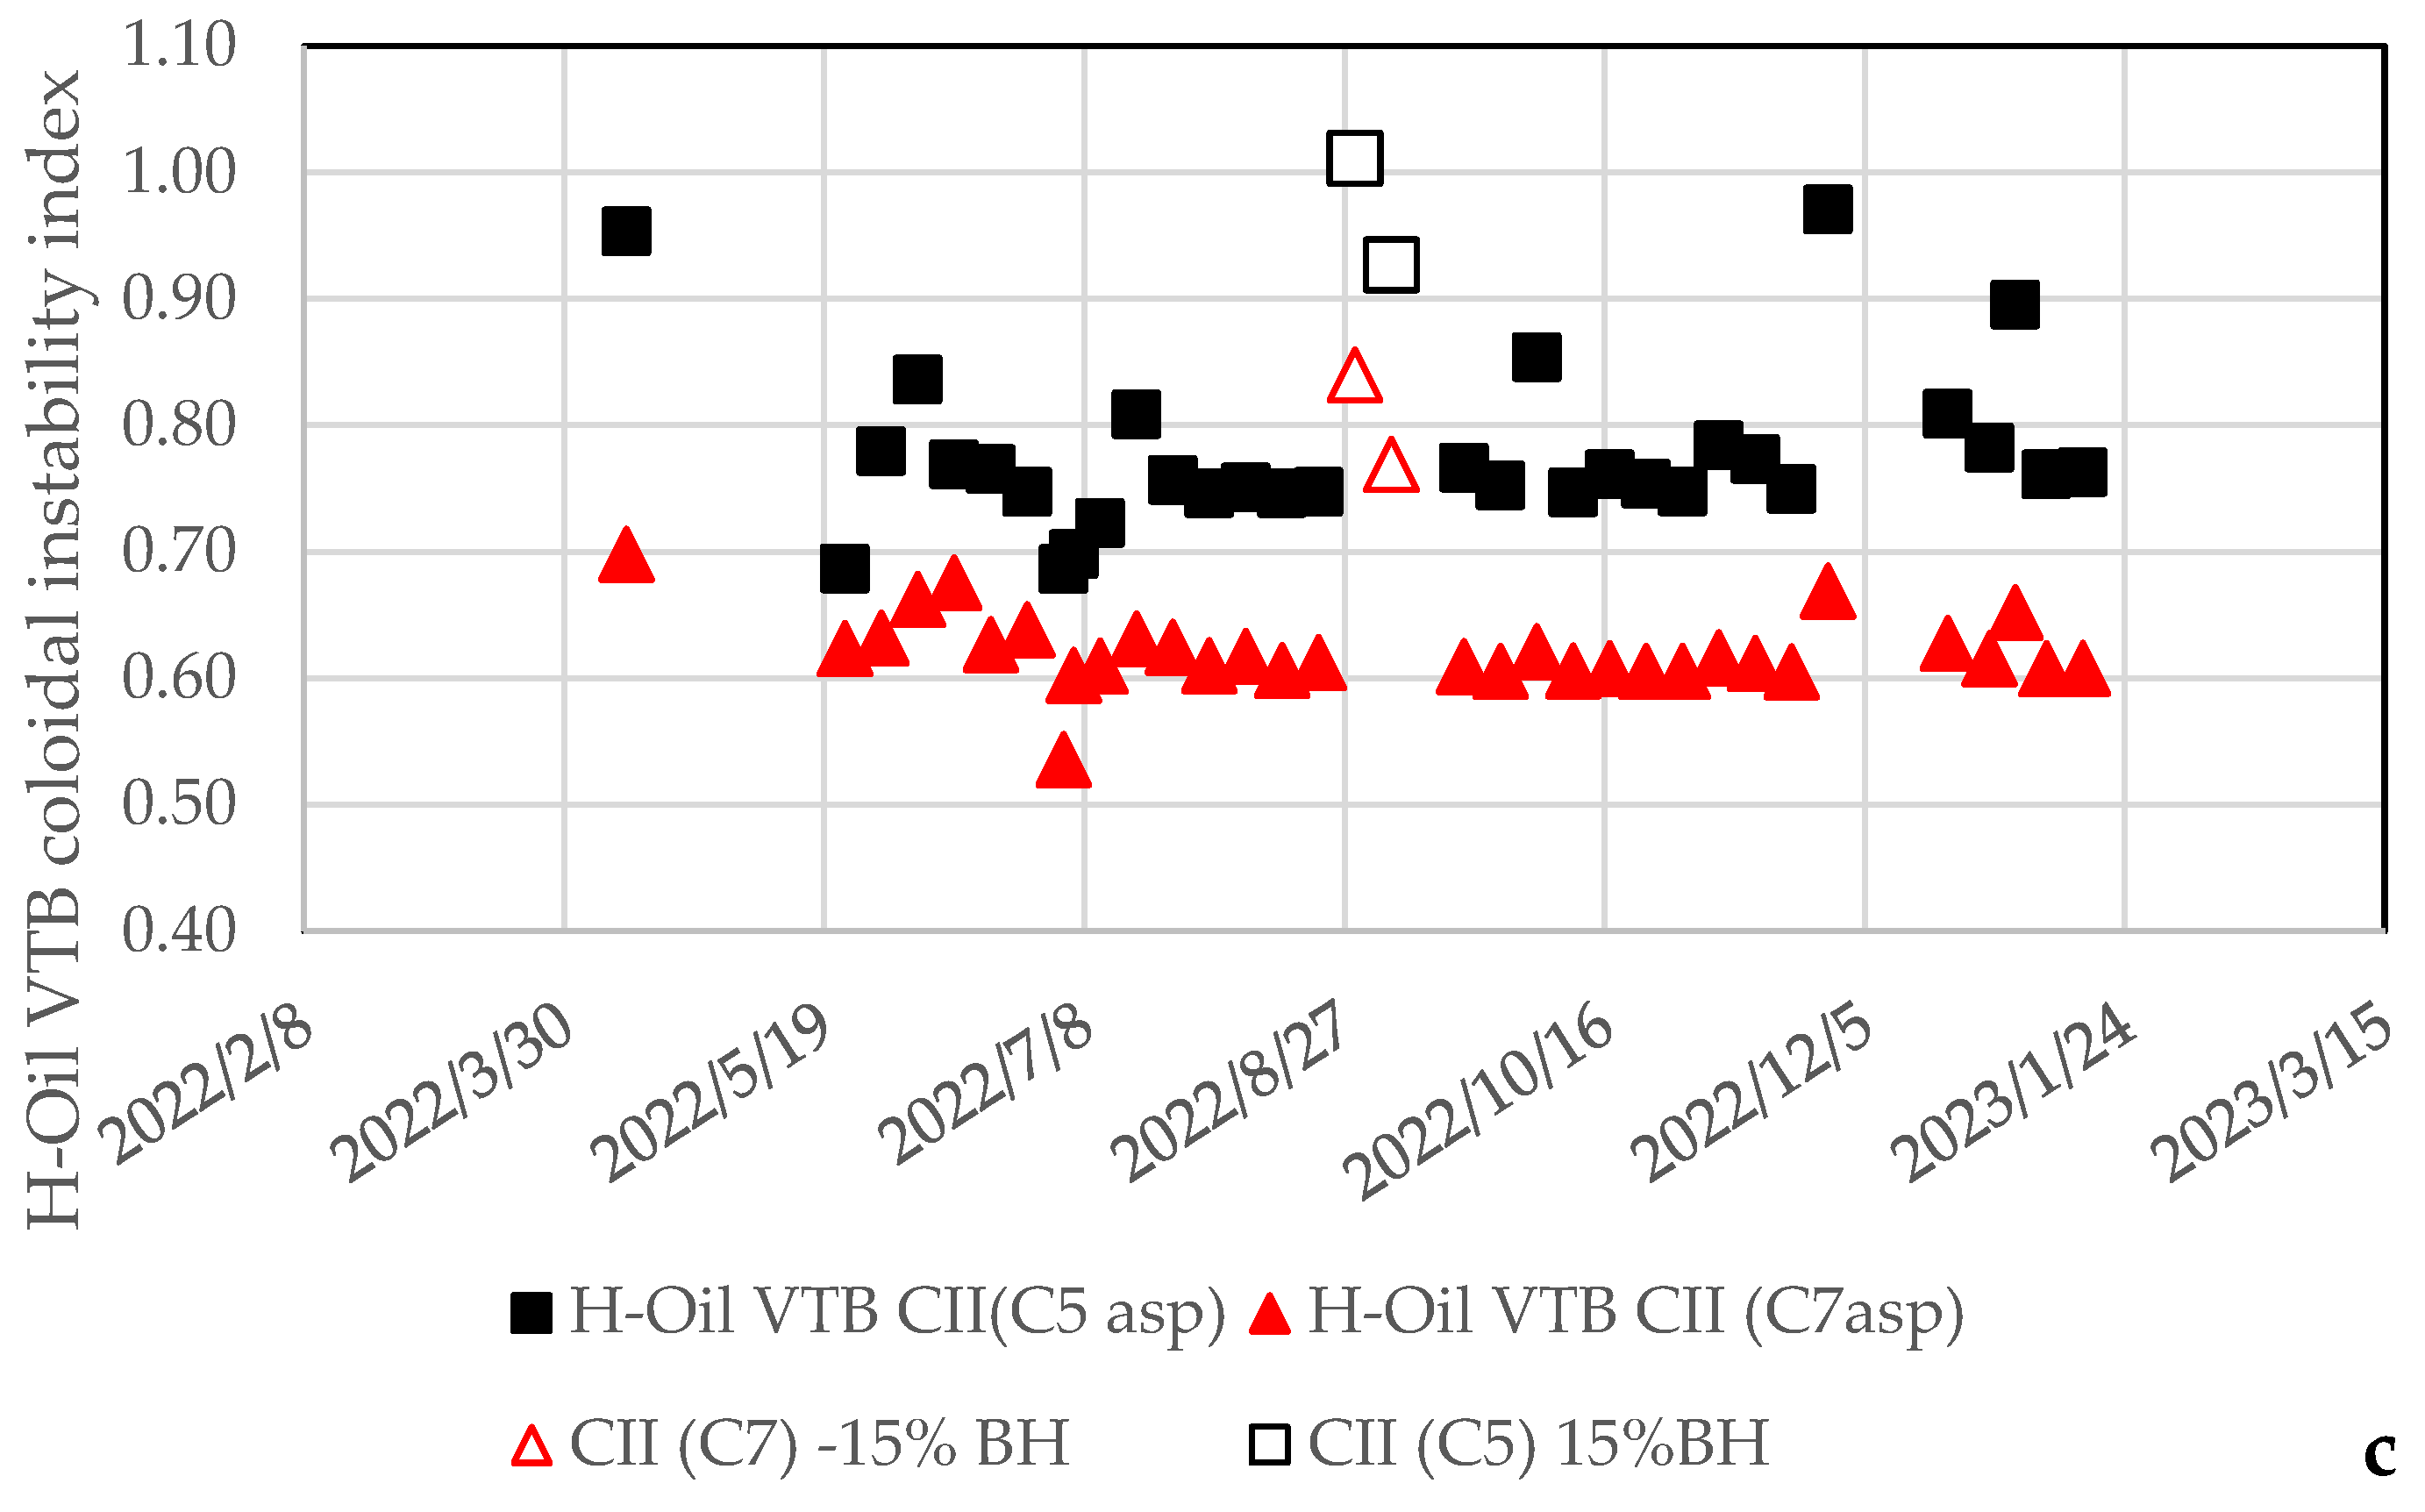
Figure 12 presents data for the variation of saturates and asphaltenes contents and the colloidal instability index of the hydrocracked vacuum residue for the investigated period. Hong and Watkinson established that the colloidal instability index (CII) was a useful empirical variable for relating fouling to precipitation results [34]. Robert et al. reported that the unconverted ebullated bed residue hydrocracking H-Oil product CII correlated with the colloidal stability expressed by the “spot test result” [35]. Watkinson postulated that when CII < 1.0, the amount of resin plus aromatics is adequate to keep the asphaltenes in solution. The insertion of saturates or the elimination of aromatics can displace the oil composition such that CII > 1.0, and asphaltenes will form sediment [36].
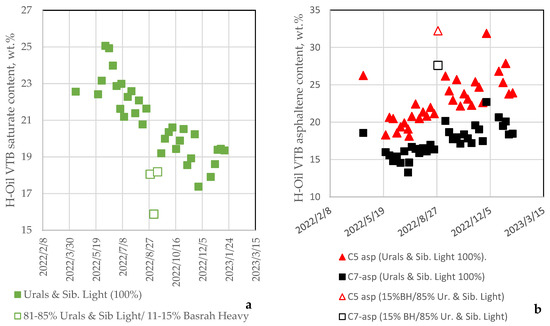
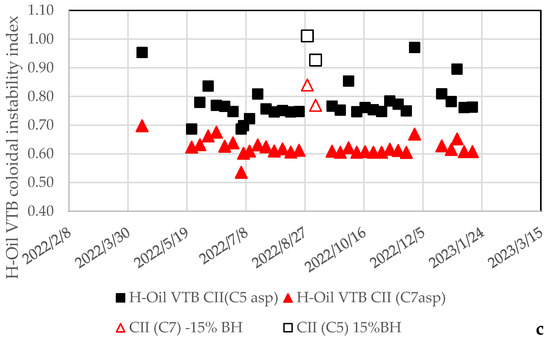
Figure 12.
Variation of saturate (a), and asphaltene (b) contents, and colloidal instability index (c) of the hydrocracked vacuum residue for the investigated period.
The data in Figure 12 indicate that the hydrocracked vacuum residue saturate content decreased while the asphaltene content increased with the progress of time, that is, with conversion enhancement as observed from the data in Figure 8. The colloidal instability index (CII) did not show any trend toward augmentation or reduction. For all cases except one, the CII was lower than 1.00, suggesting high colloidal stability of the H-Oil VTB during the study based on the postulate of Watkinson [36]. It is interesting to note here that during processing the crude oil blend containing Basrah Heavy, the content of saturates in the hydrocracked vacuum residue dropped while that of asphaltenes went up. The colloidal instability index showed a step change towards enhancement when the Basrah Heavy content in the crude oil blend was 15%.
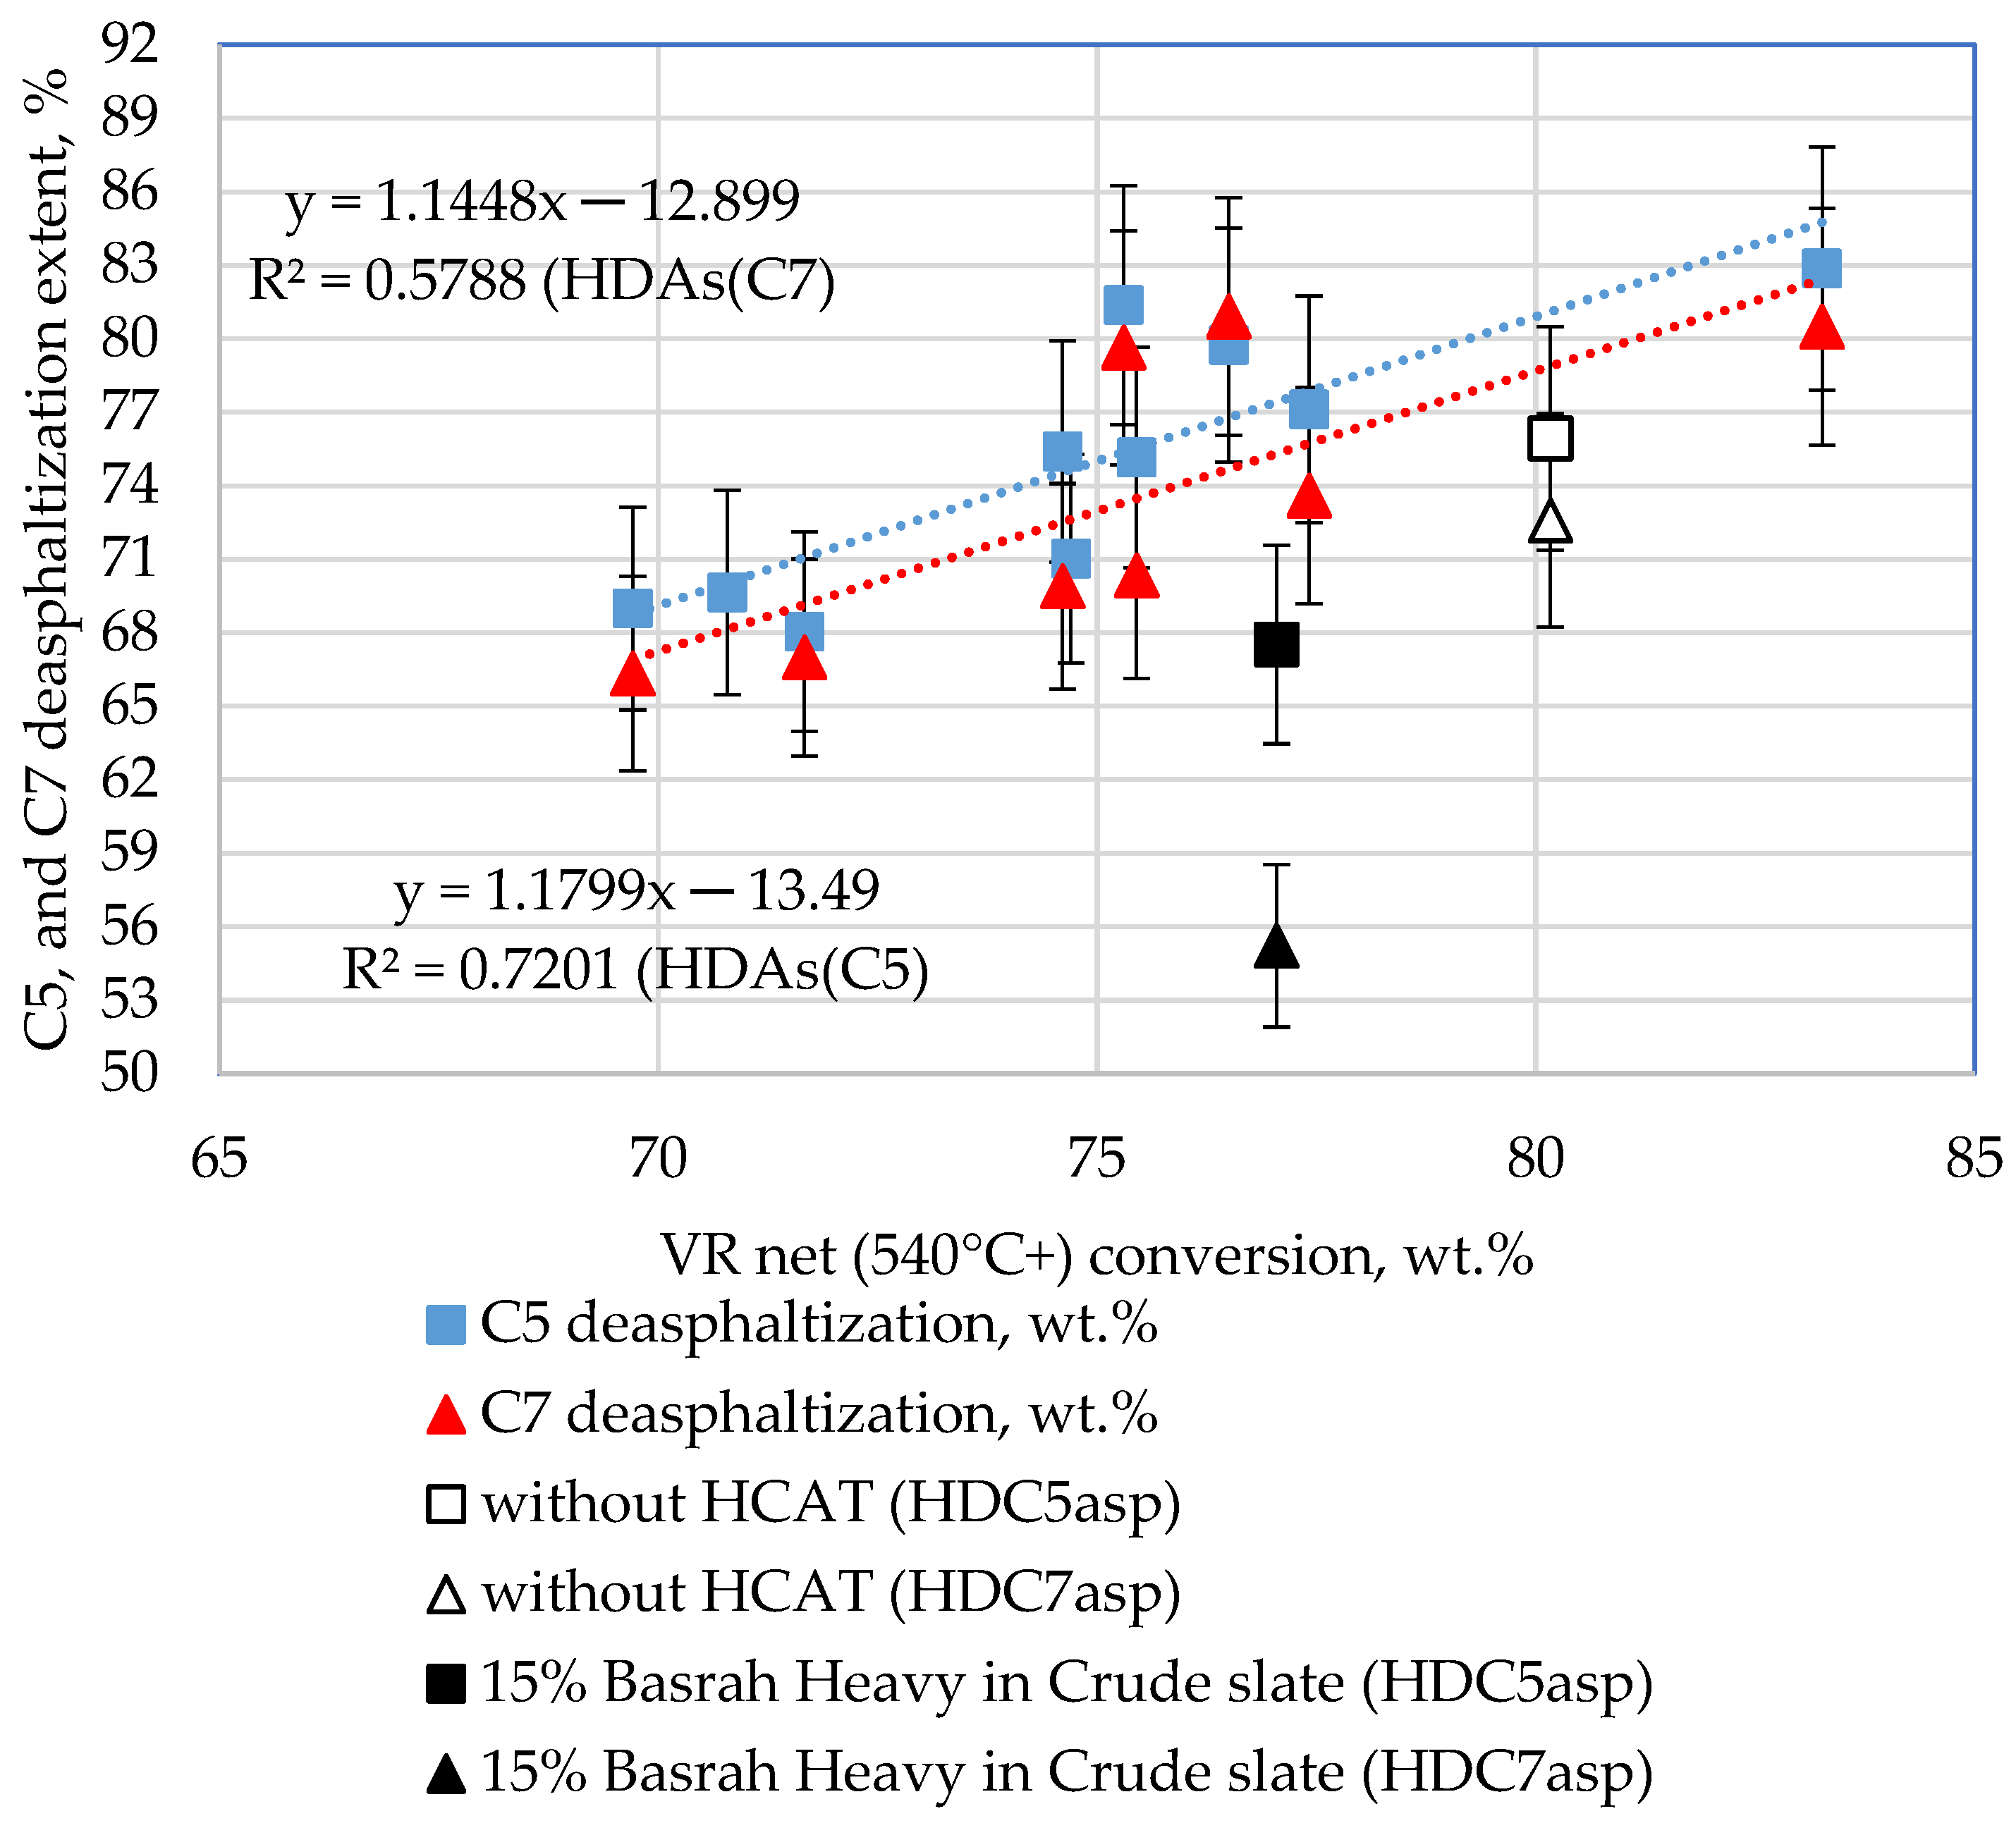
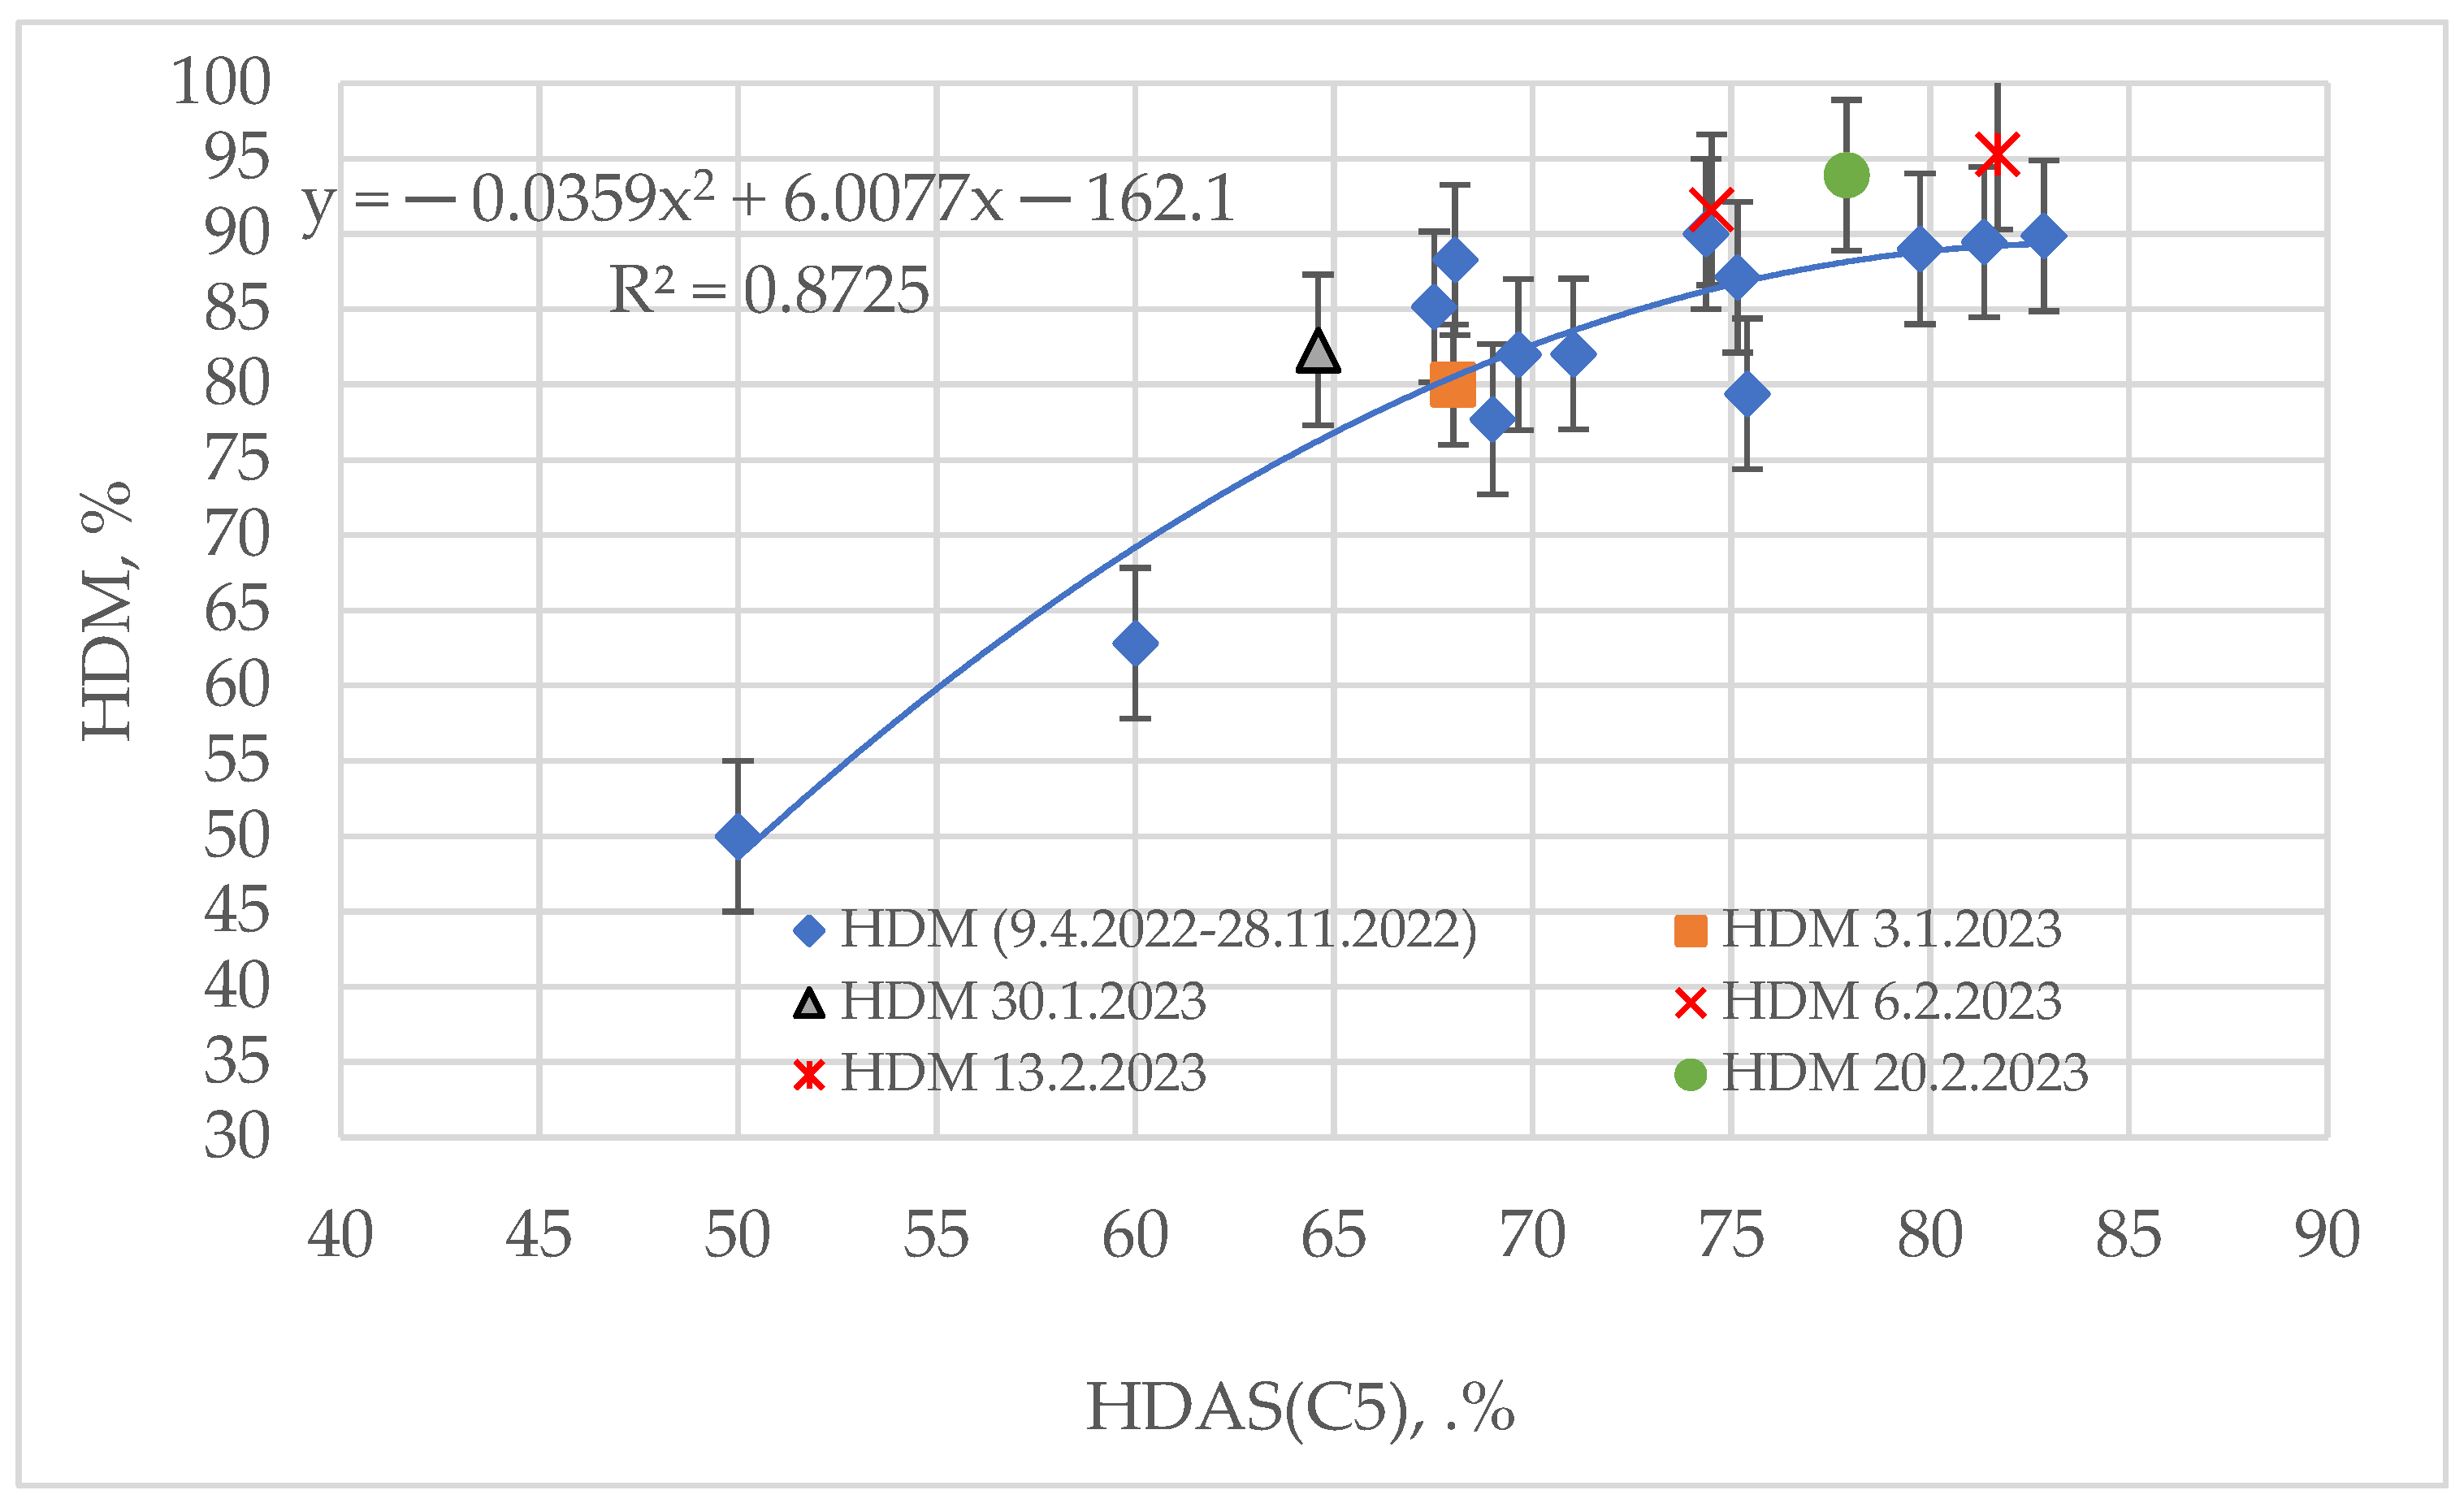
Figure 13 shows the relation of hydrodeasphaltization to vacuum residue net conversion. It is evident from this data that both HDAs (C5) and HDAs (C7) increase with vacuum residue conversion. The error in the determination of HDM was found ±3%. It is interesting to note here that during processing Basrah Heavy crude oil in the amount of 15% in the crude oil blend, the hydrodeasphaltization fell to 10% for the HDAs (C5) and to 20% for the HDAs (C7), which is bigger than the HDM repeatability of ±3%. The interruption of the liquid nano dispersed HCAT catalyst addition was also associated with a 6–7% reduction of HDAs.

Figure 13.
Relation of hydrodeasphaltization to vacuum residue net conversion.
4. Discussion
Our previous experience documented in [2,11,17] showed that the sediment content in the ATB (atmospheric tower bottom) product and the fouling rate are within the acceptable limits during processing Urals or Siberian Light vacuum residues when the conversion is not higher than 60%. This can also be seen from the data shown in Figure 1 and Figure 2. For the investigated period of time, as apparent from the data in Figure 5, the periods when 100% Urals and Siberian Light vacuum residues were processed were between 17 May 2022 and 15 August 2022, and between 15 October 2022 and 28 November 2022. Table 2 summarizes the main performance indicators extracted from the data in Figure 6, Figure 7, Figure 8, Figure 9 and Figure 12.
Table 2.
Main performance indicators of the commercial ebullated bed vacuum residue hydrocracker during the periods when 100% Urals and Siberian Light vacuum residues were processed.
The data in Table 2 indicate that, similar to the previous experience [2,11,17] with processing Urals and Siberian Light vacuum residues at a conversion level of 67 wt.% (17 May 2022), although the sediment content in the ATB was not higher than the acceptable limit of 0.40 wt.%, the fouling rate was unacceptably high, suggesting a need for reaction temperature reduction. The HDM extent for that date was the lowest for the four cases in Table 2—58.2%. The ΔT of the first reactor was also the lowest—58 °C. The end of the first period (15 August 2022) demonstrated a 9.1 wt.% higher conversion due to the reaction temperature enhancement by 11 °C. Irrespective of reaction temperature augmentation, no magnification in ATB sediment content was observed. The HDM extent, however, showed a remarkable enhancement of 27.5% (abs.). This data suggests that the HDM enhancement may be responsible for the much better performance on 15 August 2022 relative to that registered on 17 May 2022. The second period with the processing of 100% Urals and Siberian Light vacuum residues between 15 October 2022 and 28 November 2022 shows further improvement of the hydrocracker’s performance, reaching the conversion level of 82.7 wt.% at the lowest ATB sediment content of 0.12 wt.% and the remarkably high HDM extent of 97.9%. The data in Table 2 exhibits that although the case 28 November 2022 was characterized by the highest asphaltene content in the hydrocracked vacuum residue, the fouling rate and sediment content were not affected by this fact. This observation is in line with the finding reported in our recent research [16] that the asphaltene content in the hydrocracked residual oils does not correlate with sediment formation or fouling rates. As reported by Rogel et al. [37], the sediment content is dependent on asphaltene content and asphaltene stability. The data in Table 2 may suggest that the asphaltenes in the case 28 November 2022 should have the highest stability because they have the highest concentration, which in principle facilitates precipitate formation, but on the other hand, this case exhibited the lowest ATB sediment content. A possible explanation for this observation is the highest HDM extent of that case. The metals in vacuum residues are mainly concentrated in asphaltenes and resins [38,39,40]. Zheng [41], and Zheng et al. [42] reported that approximately 80% of total asphaltene vanadium presents in the form of nanoaggregates. They conclude that the intercommunion of metalloporhyrins concentrated in the asphaltene fraction seems to have a crucial role in the association of asphaltenes. Their results suggest that the association of metal porphyrins with asphaltene molecules is a general form of metal-containing compounds present in asphaltenes [41,42]. Thus, the higher extent of metal removal from the vacuum residue during hydrocracking may contribute to the reduction of the content of these compounds, which facilitate aggregation with asphaltene molecules, which eventually leads to a lower extent of aggregation, precipitate formation, and fouling.
Data shown in Figure 5, Figure 7, Figure 8 and Figure 9 were extracted in the form of Table S2 and processed by the intercriteria analysis (ICrA). The ICrA evaluation results as μ and υ values of the different hydrocracking process variables is presented in Table 3 and Table 4. One can see from the data in Table 3 and Table 4 that the vacuum residue conversion has a statistically meaningful positive relationship with the reactor temperatures, HDM, and the first reactor ΔT. The first reactor ΔT also exhibits a statistically meaningful negative relationship with the ATB sediment content and a statistically meaningful positive relationship with HDM. The second reactor ΔT does not display any statistically meaningful relation to either HDM or ATB sediment content. These findings imply that the activity of the catalyst in the first reactor affects to a greater extent both HDM and sediment formation rate than the activity in the second reactor. Therefore, the separate addition of the fresh catalyst in both reactors instead of fresh catalyst addition only in the second reactor and the addition of equilibrium catalyst taken from the second reactor in the first reactor, a practice employed until this study, has allowed to improve both total HDM extent and reduce sediment formation rate. The activity of the catalyst in the first reactor seems to have a considerable impact on both HDM and sediment control. The lower sediment formation rate was a result of the higher equilibrium activity of the catalyst in the first reactor, which allowed reaction temperature enhancement and consequently conversion augmentation.
Table 3.
μ-value of the ICrA evaluation of relations between the different variables characterizing hydrocracker performance.
Table 4.
μ-value of the ICrA evaluation of relations between the different variables characterizing hydrocracker performance.
An interesting fact observed during the processing of Basrah Heavy crude oils is the lower registered hydrodeasphaltization extent, as shown in Figure 13. The data in Table 3 also suggests that the processing of Basrah Heavy crude oil has a negative impact on HDM extent (μ = 0.17). However, υ-value of Basrah Heavy (Table 4) of 0.19 suggests a very big uncertainty in this evaluation, and therefore it cannot be confidentially considered that the processing of Basrah Heavy vacuum residue definitely affects negatively HDM. Nevertheless, if one takes a look at the data in Figure 5, he will see that Basrah Heavy has been processed in the period 16 August 2022–10 October 2022, and the data in Figure 8 shows that HDM falls from 88% down to 81% in the period 16 August 2022–19 September 2022. Moreover, during the processing of Basrah Heavy, the HDAs (C5) fall by 10% and the HDAs (C7) fall by 20% (see Figure 13), and Ancheyta et al. [43] and Nguyen et al. [44] report that the HDM and hydrodeasphaltization (HDAs) are linearly related. This data suggests some negative effects of the processing of Basrah Heavy vacuum residue on HDM; however, this hypothesis features a great deal of uncertainty. More data is needed to categorically prove the detrimental effect of Basrah Heavy vacuum residue processing in the hydrocracker on HDM. Indeed, the data in Table 3 and Table 4 show that the improvement of HDM has a negative statistically meaningful relation to the sediment content in the ATB, confirming that the HDM improvement retards the process of sediment formation. Ancheyta et al. [43], and Takahashi et al. [45] showed in their studies that the demetallization efficiency is proportional to the conversion of asphaltenes. Our data, although characterized by a higher dispersion than the data of Ancheyta et al. [43] (see Figure 14), also supports their conclusion, indicating that HDM and hydrodeasphaltization are interrelated.
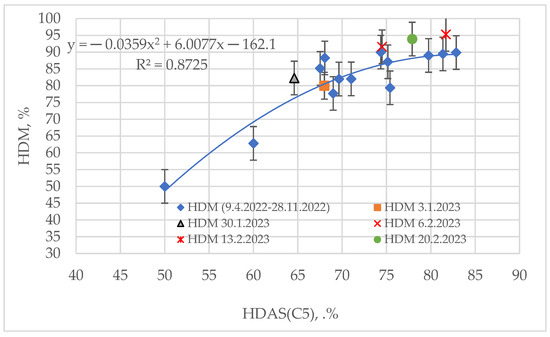
Figure 14.
Relation between HDM, and HDAs (C5) for the commercial ebullated bed vacuum residue hydrocracking.
The data in Figure 14 indicate that the regression developed on the basis of the data for the period 9 April 2022–28 November 2022 is very well fitted to the points fot the dates beyond that period obtained after the maintenance work performed in December 2022 on the commercial ebullated bed vacuum residue hydrocracker.
An evidence for the predominant effect of HDM and the first reactor ΔT on the conversion is the nonlinear regression developed by the use of these two variables and processing the data in Table S2. The nonlinear regression is shown as Equation (5).
where,
- Conversion = net vacuum residue conversion, wt.%;
- HDM = HDM extent, %;
- ΔT(R1) = the first reactor ΔT, °C.
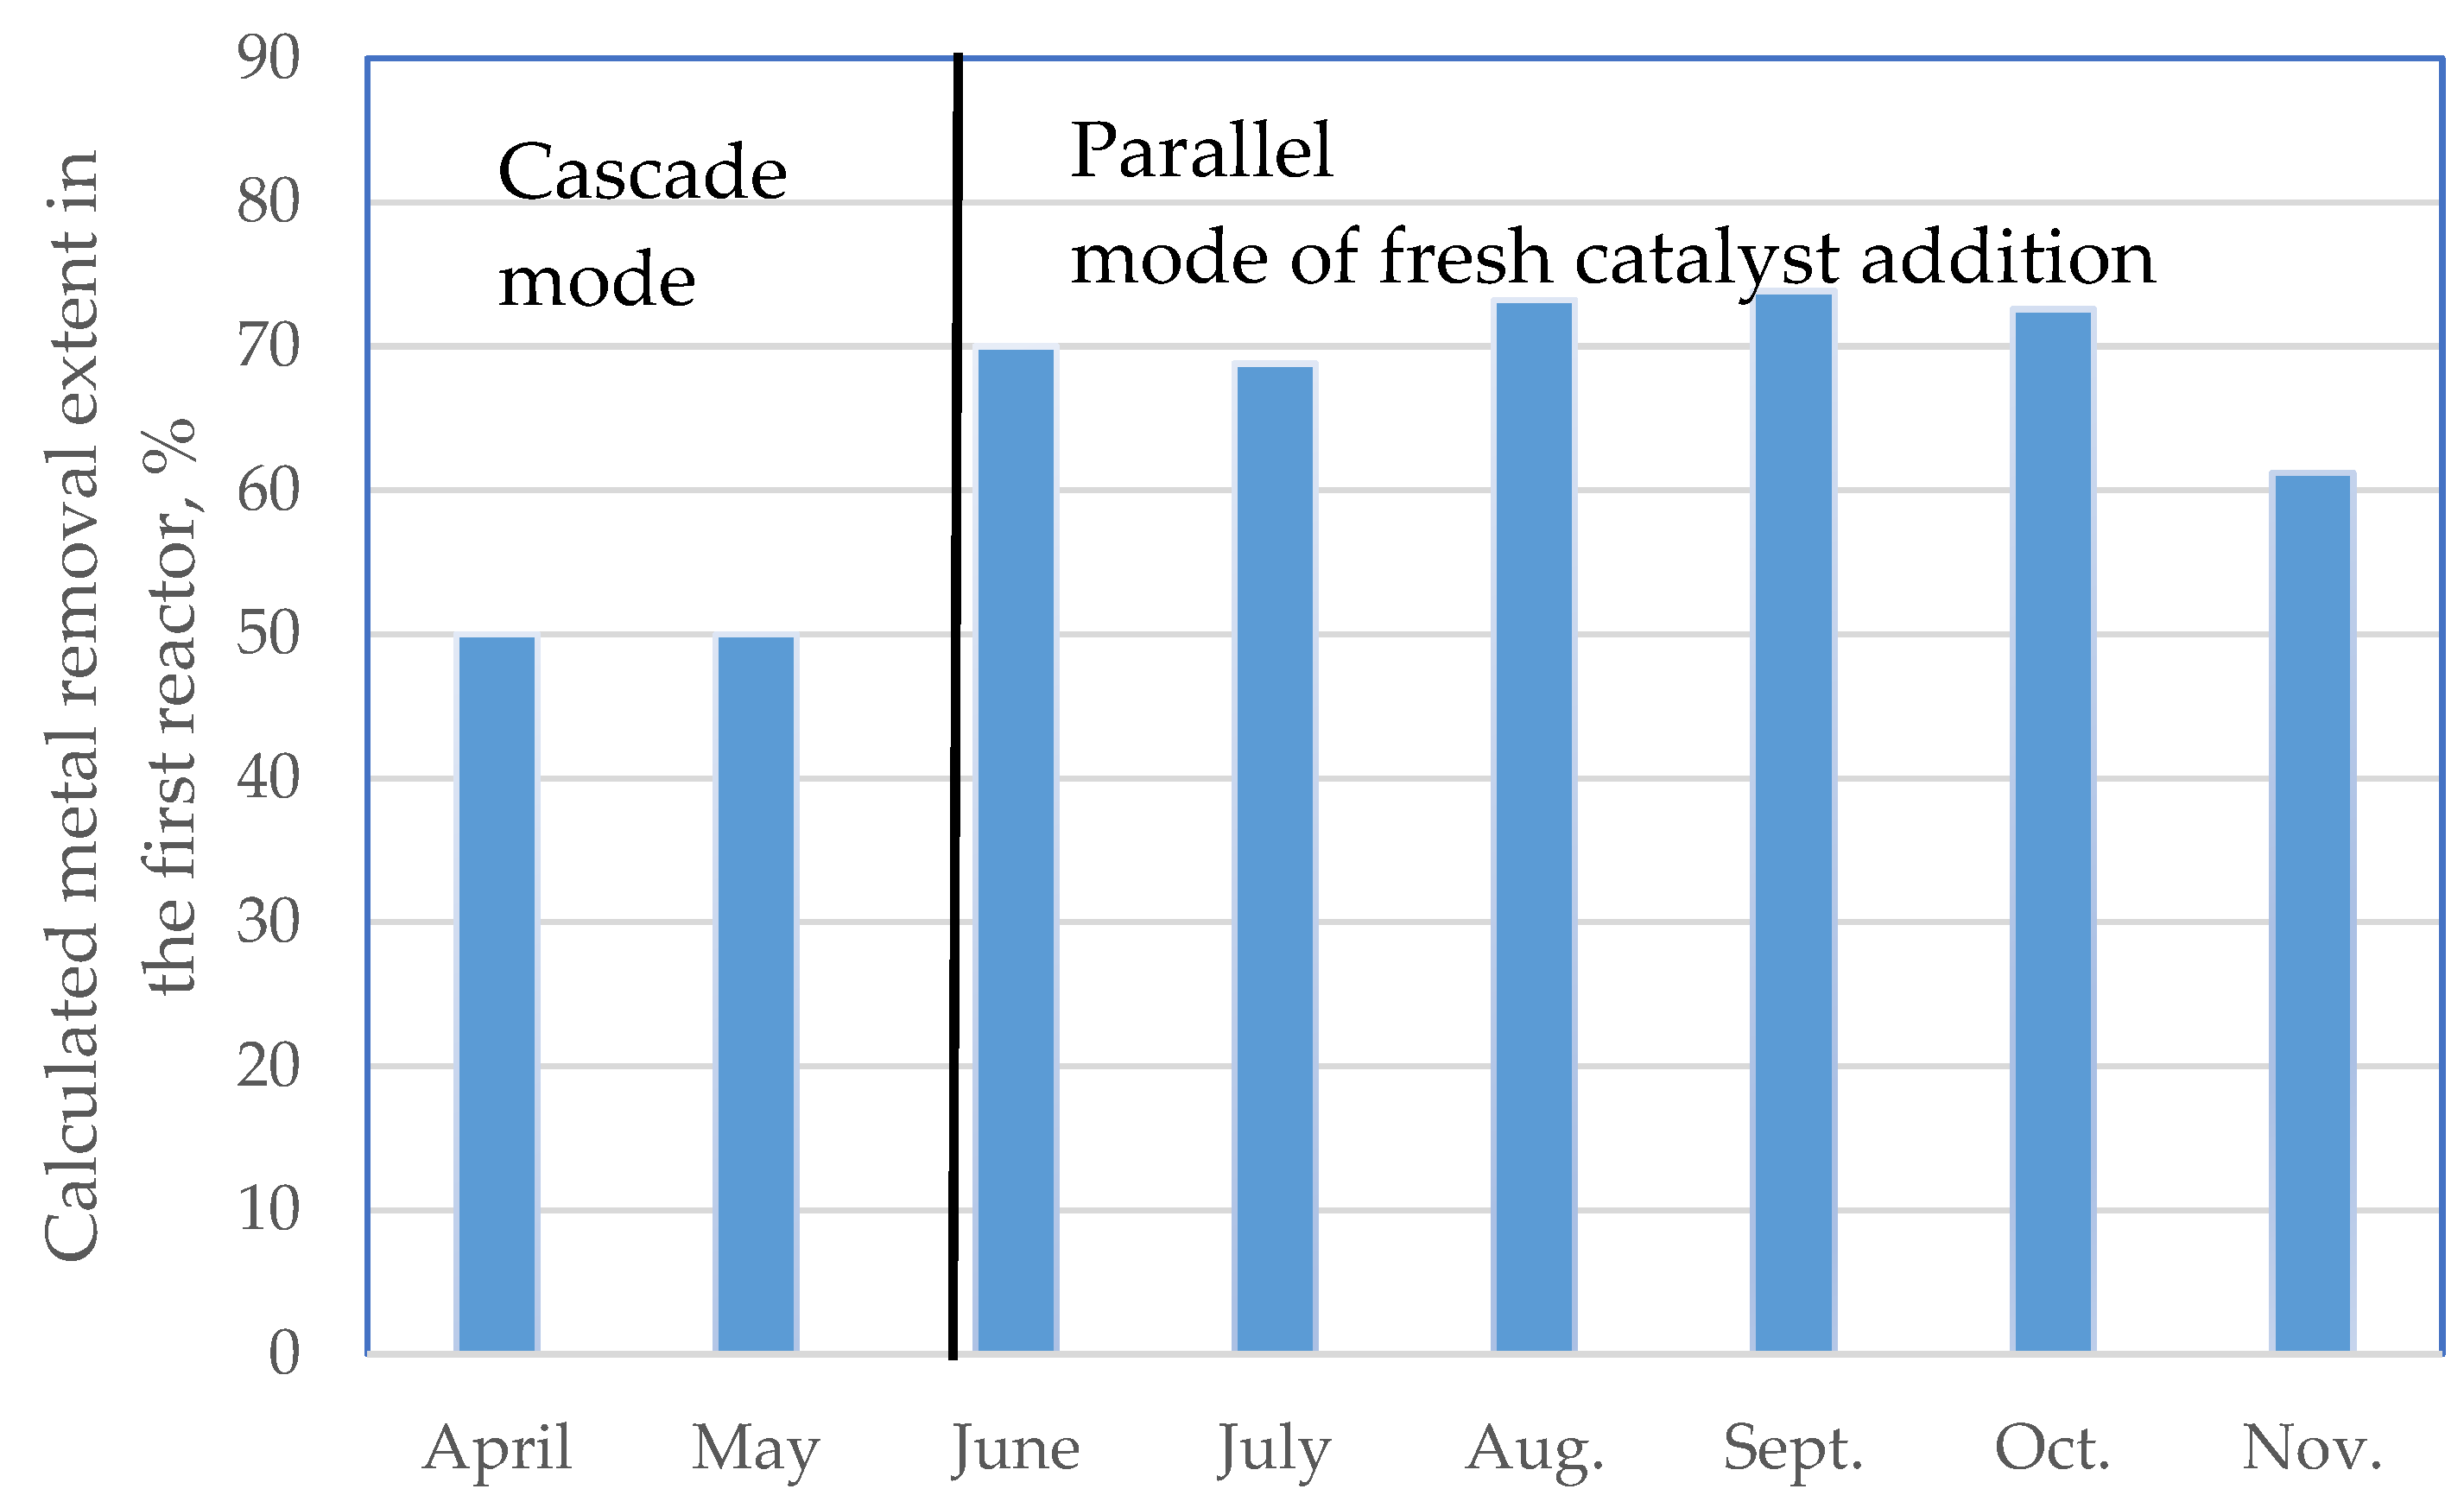
Equation (5) was developed for the following range of variation of HDM, between 39.4 and 97.9%, and the first reactor ΔT, between 49 and 91 °C. It predicts conversion with an average absolute deviation of 1.36 wt.%; maximum absolute deviation of 4.3 wt.%, and a bias of 0.00 wt.%. By simulating different cases of HDM enhancement while keeping ΔT(R1) constant and ΔT(R1) increase while keeping HDM constant, one can see that Equation (5) quantifies a stronger influence of ΔT(R1) on conversion than the HDM extent. From the data generated in this study, it is difficult to segregate the effect of HDM from that of ΔT(R1) because both variables are statistically meaningfully related, as shown in Table 3 and Table 4. However, the effect of ΔT(R1) on sediment formation, as observed from the data in Table 3 and Table 4, is stronger than that of the HDM, which is in line with the statement made above that ΔT(R1) more strongly affects conversion enhancement than the HDM. A calculation of metal removal extent occurring in the first reactor indicates 50% for the cascade mode versus about 70% for the parallel mode when the fresh catalyst addition in the first reactor is about 70% (Figure 15). Therefore, one may suggest that the greater metal removal extent in the first reactor is crucial for the sediment control, allowing operation at a higher reactor temperature and consequently registering a higher conversion level.
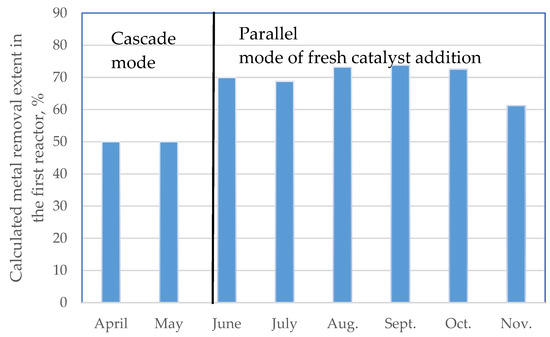
Figure 15.
Calculated metal removal extent in the first ebullating bed reactor.
Therefore, the conversion augmentation during processing the Urals and Siberian Light vacuum residues should be mainly ascribed to the higher catalyst activity and the higher metal removal in the first reactor during implementation of the parallel mode of fresh catalyst addition. The data in Figure 11 indicates that higher activity of the catalyst in the first reactor is a result of a higher addition rate in this reactor 60–70% versus 30–40% in the second reactor.
Another regression equation for conversion prediction from data on LHSV and reaction temperature was developed using the data in Table S3. It is shown as Equation (6).
where,
- LHSV = liquid hourly space velocity, h−1;
- WABT = weight average bed temperature, °C.
Equation (6) was developed for the following range of variation of LHSV, between 0.10 and 0.24 h−1, and WABT, between 411 and 431 °C. It predicts conversion with an average absolute deviation of 1.21 wt.%; maximum absolute deviation of 4.7 wt.%, and a bias of −0.039. Equation (6) reflects the impact of process variables such as reaction time and reaction temperature on vacuum residue conversion, while Equation (5) allows to quantify the effect of HDM and ΔT(R1) on conversion. As a whole, this study has shown that the separate addition of fresh catalyst in both reactors with a higher percent added in the first reactor contributes to HDM enhancement, metal removal in the first reactor, and ΔT(R1). This, in turn, has a retardation effect on the sediment formation rate that allows the reaction temperature to increase and the conversion rate to raise.
5. Conclusions
The number of papers published in referenced journals dealing with commercial vacuum residue hydrocracking data is enormously small relative to that related to laboratory hydrocracking experiments. Therefore, there is a need for more publications discussing commercial vacuum residue hydrocracking data to appear in the referenced journals to make the academic audience familiar with the real-world vacuum residue hydrocracking issues.
The earlier commercial experience with the processing of higher saturate content vacuum residues derived from Urals and Siberian Light crude oils during the employment of cascade mode of fresh catalyst addition in the ebullated bed hydrocracking and running at LHSV of 0.25 h−1 showed that their conversion was about 60%. The replacement of the cascade by the parallel mode of fresh catalyst addition, where 60–70% of the fresh catalyst is inserted in the first reactor and 30–40% in the second reactor, allowed achievement of 83% conversion during operation at a LHSV of 0.17 h−1.
The use of intercriteria analysis evaluation of the commercial ebullated bed vacuum residue hydrocracker data enabled identification of the factors influencing conversion improvement. They are itemized below:
- HDM extent enhancement
- First reactor ΔT increase
- Higher metal removal from the first reactor
The results of this study suggest that the higher metal removal and higher catalyst activity in the first reactor as a consequence of the higher portion of fresh catalyst added to the first reactor contribute to the suppression of the sediment formation rate during the processing of higher saturate content Urals and Siberian light vacuum residues. This underlines the significance of the activity and metal removal capacity of the catalyst in the first reactor for the overall performance of the commercial hydrocracker.
It was observed a decreased HDM extent during the processing of Basrah Heavy vacuum residue. The relation between HDM and HDAs observed at laboratory hydrocracking experiments was confirmed with the commercial data generated in this study.
Supplementary Materials
The following supporting information can be downloaded at: https://www.mdpi.com/article/10.3390/app13063755/s1, Table S1: Properties of crude oils under study; Table S2: Different variables characterizing the ebullated bed vacuum residue hydrocracker performance to be evaluated by ICrA.; Table S3: Ebullated bed vacuum residue hydrocracker data for LHSV, reaction temperature (WABT), and net convesion.
Author Contributions
Conceptualization, D.S.S. and A.N.; methodology, R.D. and I.K.S.; software, S.R., S.N. and D.D.S.; validation, D.P., S.S. and E.S.; formal analysis, M.I.; investigation, G.N.P., G.S.A., M.I. and B.E.G.; resources, K.A.; data curation, S.N. and D.P.; writing—original draft preparation, D.S.S.; writing—review and editing, D.S.S.; visualization, G.S.A.; supervision, K.A. All authors have read and agreed to the published version of the manuscript.
Funding
This research received no external funding.
Institutional Review Board Statement
Not applicable.
Informed Consent Statement
Not applicable.
Data Availability Statement
Not applicable.
Acknowledgments
The authors Krassimir Atanassov, and Simeon Ribagin acknowledge the support from the Bulgarian National Science Fund under Grant Ref. No. KP-06-N22-1/2018 “Theoretical research and applications of InterCriteria Analysis”.
Conflicts of Interest
The authors declare no conflict of interest.
Nomenclature
| Aro | Aromatics |
| ATB | Ebullated bed vacuum residue hydrocracker atmospheric tower bottom product |
| ATB TSE | Total sediment existent (sediment content) in ATB, wt.% |
| CH2Cl2 | Fraction of asphaltenes soluble in dichloromethane (SAR-ADTM method) |
| C5-asp | n-pentane asphaltenes |
| C7-asp | n-heptane asphaltenes |
| CII | Colloidal instability index |
| CII (C5asp) | Colloidal instability index determined on the base of C5 asphaltene content |
| CII (C7asp) | Colloidal instability index determined on the base of C7 asphaltene content |
| Conv. | Vacuum residue net (540 °C+) conversion |
| CyC6 | Fraction of asphaltenes soluble in cyclohexane (SAR-ADTM method) |
| DT1─DT4 | Differences between temperature of ATB product and the different ATB skin thermocouples |
| ΔT | Diference between outlet and inlet temperature of the ebullated bed reactors |
| HDAs | Hydrodeasphaltizatition |
| HDAs(C5) | Hydrodeasphaltizatition of C5-asphaltenes |
| HDAs(C7) | Hydrodeasphaltizatition of C7-asphaltenes |
| HDM | Hydrodemetallization |
| HDS | Hydrodesulphurization |
| Kin. vis. | Kinematic viscosity |
| R-1 ΔT | Fisrt reactor ΔT |
| R-2 ΔT | Second reactor ΔT |
| Res | Resins |
| Sat | Saturates |
| Toluene | Fraction of asphaltenes soluble in toluene (SAR-ADTM method) |
| Total Asp | Total asphaltene content in residues (SAR-ADTM method) |
| T-R1 | Weight average bed temperature in the first H-Oil ebullated bed reactor |
| T-R2 | Weight average bed temperature in the second H-Oil ebullated bed reactor |
| VTB | Ebullated bed vacuum residue hydrocracker vacuum tower bottom product |
| VR | Vacuum residue |
References
- Bellussi, G.; Rispoli, G.; Landoni, A.; Millini, R.; Molinari, D.; Montanari, E.; Moscotti, D.; Pollesel, P. Hydroconversion of heavy residues in slurry reactors: Developments and perspective. J. Catal. 2013, 308, 189–200. [Google Scholar] [CrossRef]
- Stratiev, D.; Nenov, S.; Shishkova, I.; Georgiev, B.; Argirov, G.; Dinkov, R.; Yordanov, D.; Atanassova, V.; Vassilev, P.; Atanassov, K. Commercial investigation of the ebullated-bed vacuum residue hydrocracking in the conversion range of 55–93%. ACS Omega 2020, 5, 33290–33304. [Google Scholar] [CrossRef] [PubMed]
- Frecon, J.; Le-Bars, D.; Rault, J. Flexible upgrading of heavy feedstocks. PTQ 2019, Q1, 1–11. Available online: https://www.digitalrefining.com/article/1002259 (accessed on 20 February 2023).
- Panariti, N.; Rispoli, G. The first EST Commercial Unit: Achieving the goal of residue conversion. In Proceedings of the 13th International Bottom of the Barrel Conference, Istanbul, Turkey, 13–14 May 2015. [Google Scholar]
- Mukherjee, U.; Gillis, D. Advances in residue hydrocracking. PTQ 2018, Q1, 1–12. [Google Scholar]
- Alonso, F.; Ancheyta, J.; Centeno, G.; Marroquín, G.; Rayo, P.; Silva-Rodrigo, R. Effect of Reactor Configuration on the Hydrotreating of Atmospheric Residue. Energy Fuels 2019, 33, 1649–1658. [Google Scholar] [CrossRef]
- Stratiev, D.S.; Shishkova, I.K.; Nikolaychuk, E.; Anastasov, M.; Stanulov, K.; Toteva, V. Effect of catalyst condition on sedimentation and conversion in the ebullated bed vacuum residue H-Oil hydrocracking. Pet. Sci. Technol. 2019, 37, 1463–1470. [Google Scholar] [CrossRef]
- Respini, M.; Ekres, S.; Wright, B.; Žajdlík, R. Strategies to control sediment and coke in a hydrocracker. PTQ 2013, Q2. Available online: https://www.digitalrefining.com/article/1000794 (accessed on 20 February 2023).
- Kunnas, J.; Ovaskainen, O.; Respini, M. Mitigate fouling in ebullated-bed hydrocrackers. Hydrocarb. Process. 2010, 10, 59–64. [Google Scholar]
- Sayles, S.; Ohmes, R.; Manner, R. Seven rules of sedimentation in hydrocracking. PTQ 2015, Q2, 1–7. [Google Scholar]
- Stratiev, D.; Dinkov, R.; Shishkova, I.; Sharafutdinov, I.; Ivanova, N.; Mitkova, M.; Yordanov, D.; Rudnev, N.; Stanulov, K.; Artemiev, A.; et al. What is behind the high values of hot filtration test of the ebullated bed residue H-Oil hydrocracker residual oils? Energy Fuels 2016, 30, 7037–7054. [Google Scholar] [CrossRef]
- Stratiev, D.S.; Shishkova, I.K.; Dinkov, R.K.; Petrov, I.P.; Kolev, I.V.; Yordanov, D.; Sotirov, S.; Sotirova, E.N.; Atanassova, V.K.; Ribagin, S.; et al. FCC slurry oil, Recycle, and operating conditions effects on H-Oil product quality. Processes 2021, 9, 952. [Google Scholar] [CrossRef]
- Stratiev, D.; Shishkova, I.; Dinkov, R.; Atanassova, V.; Ribagin, S.; Stratiev, D.D.; Atanassov, K. Evaluation of crude slate and processing of recycle effects on H-Oil performance. Int. J. Oil Gas Coal Technol. 2022, 30, 130–156. [Google Scholar] [CrossRef]
- Manek, E.; Haydary, J. Hydrocracking of vacuum residue with solid and dispersed phase catalyst: Modeling of sediment formation and hydrodesulfurization. Fuel Process. Technol. 2017, 159, 320–327. [Google Scholar] [CrossRef]
- Sundaram, K.M.; Mukherjee, U.; Baldassari, M. Thermodynamic model of sediment deposition in the LC-FINING process. Energy Fuels 2008, 2, 3226–3236. [Google Scholar] [CrossRef]
- Stratiev, D.; Shishkova, I.; Dinkov, R.; Kolev, I.; Argirov, G.; Ivanov, V.; Ribagin, S.; Atanassova, V.; Atanassov, K.; Stratiev, D.; et al. Intercriteria analysis to diagnose the reasons for increased fouling in a commercial ebullated bed vacuum residue hydrocracker. ACS Omega 2022, 7, 30462–30476. [Google Scholar] [CrossRef] [PubMed]
- Stratiev, D.; Shishkova, I.; Nikolaychuk, E.; Ijlstra, W.; Holmes, B.; Caillot, M. Feed properties effect on the performance of vacuum residue ebullated bed H-Oil hydrocracking. Oil Gas Eur. Mag. 2019, 45, 194–200. [Google Scholar]
- Stratiev, D.; Shishkova, I.; Argirov, G.; Yankov, V.; Mountainland, D.; Silverman, B.; Toteva, V. Improving H-Oil ebullated bed vacuum residue hydrocracking performance by the use of molecularly dispersed HCAT® catalyst. Pet. Coal 2021, 63, 655–667. [Google Scholar]
- Available online: https://www.sciencedirect.com/search?qs=residue%20hydrocracking (accessed on 20 January 2023).
- Gragnani, A.; Putek, S. Resid hydrocracker produces low-sulfur diesel from difficult feeds. Hydrocarb. Process. 2006, 85, 95–100. [Google Scholar]
- Stratiev, D.; Shishkova, I.; Dinkov, R.; Nikolova, R.; Mitkova, M.; Stanulov, K.; Sharpe, R.; Russell, C.A.; Obryvalina, A.; Telyashev, R. Reactivity and stability of vacuum residual oils in their thermal conversion. Fuel 2014, 123, 133–142. [Google Scholar] [CrossRef]
- Atanassov, K.; Mavrov, D.; Atanassova, V. Intercriteria decision making: A new approach for multicriteria decision making, based on index matrices and intuitionistic fuzzy sets. Issues Intuit. Fuzzy Sets Gen. Nets 2014, 11, 1–8. [Google Scholar]
- Atanassov, K.; Atanassova, V.; Gluhchev, G. Intercriteria analysis: Ideas and problems. Notes Intuit. Fuzzy Sets 2015, 21, 81–88. [Google Scholar]
- Atanassov, K. Index Matrices: Towards an Augmented Matrix Calculus; Springer: Cham, Switzerland, 2014. [Google Scholar]
- Mavrov, D. Software for InterCriteria Analysis: Implementation of the Main Algorithm. Notes Intuit. Fuzzy Sets 2015, 21, 77–86. [Google Scholar]
- Stratiev, D.; Nedelchev, A.; Shishkova, I.; Ivanov, A.; Sharafutdinov, I.; Nikolova, R.; Mitkova, M.; Yordanov, D.; Rudnev, N.; Belchev, Z.; et al. Dependence of visbroken residue viscosity and vacuum residue conversion in a commercial visbreaker unit on feedstock quality. Fuel Process. Technol. 2015, 138, 595–604. [Google Scholar] [CrossRef]
- Stratiev, D.; Shishkova, I.; Nedelchev, A.; Kirilov, K.; Nikolaychuk, E.; Ivanov, A.; Sharafutdinov, I.; Veli, A.; Mitkova, M.; Tsaneva, T.; et al. Investigation of relationships between petroleum properties and their impact on crude oil compatibility. Energy Fuels 2015, 29, 7836–7854. [Google Scholar] [CrossRef]
- Stratiev, D.S.; Sotirov, S.; Shishkova, I.; Nedelchev, A.; Sharafutdinov, I.; Vely, A.; Mitkova, M.; Yordanov, D.; Sotirova, E.; Atanassova, V.; et al. Investigation of relationships between bulk properties and fraction properties of crude oils by application of the Intercriteria analysis. Petrol. Sci. Technol. 2016, 34, 1113–1120. [Google Scholar] [CrossRef]
- Stratiev, D.; Shishkova, I.; Nikolova, R.; Tsaneva, T.; Mitkova, M.; Yordanov, D. Investigation on precision of determination of SARA analysis of vacuum residual oils from different origin. Pet. Coal 2016, 58, 109–119. [Google Scholar]
- Adams, J.J.; Rovani, J.F.; Planche, J.-P.; Stratiev, D.; Shishkova, I.; Kolev, I.; Atanassov, K.; Nenov, S.; Ribagin, S.; Stratiev, D.; et al. SAR-AD Method to Characterize Vacuum Residues from Different Origins as a Tool to Investigate the Performance of a Commercial Ebullated Bed Vacuum Residue Hydrocracker. Available online: https://papers.ssrn.com/sol3/papers.cfm?abstract_id=4252478 (accessed on 1 December 2022).
- Wu, Z.; Huiqing, L.; Wang, X.; Zhang, Z. Emulsification and improved oil recovery with viscosity reducer during steam injection process for heavy oil. J. Ind. Eng. Chem. 2018, 61, 348–355. [Google Scholar] [CrossRef]
- Wu, Z.; Huiqing, L.; Pang, Z.; Wu, C.; Gao, M. Pore-scale experiment on blocking characteristics and EOR mechanisms of nitrogen foam for heavy oil: A 2D visualized study. Energy Fuels 2016, 30, 9106–9113. [Google Scholar] [CrossRef]
- Mountainland, D.; Argirov, G.; Stratiev, D.; Shishkova, I. Lukoil Neftohim Burgas AD (LNB) Enhancing EB Flexibility with HCAT Technology. In Proceedings of the International Downstream Week (IDW), Dubrovnik, Croatia, 30 September 2022; pp. 1–22. [Google Scholar]
- Hong, E.; Watkinson, P. Precipitation and fouling in heavy oil–diluent blends. Heat Transf. Eng. 2009, 30, 786–793. [Google Scholar]
- Robert, E.C.; Merdrignac, I.; Rebours, B.; Harlé, V.; Kressmann, S.; Colyar, J. Contribution of analytical tools for the understanding of sediment formation: Application to H-Oil® process. Pet. Sci. Technol. 2003, 21, 615–627. [Google Scholar] [CrossRef]
- Watkinson, P. Deposition from crude oils in heat exchangers. Heat Transf. Eng. 2007, 28, 177–184. [Google Scholar] [CrossRef]
- Rogel, E.; Ovalles, C.; Pradhan, A.; Leung, P.; Chen, N. Sediment formation in residue hydroconversion processes and its correlation to asphaltene behavior. Energy Fuels 2013, 27, 6587–6593. [Google Scholar] [CrossRef]
- Reynolds, J.G. Characterization of heavy residua by application of a modified D2007 separation and electron paramagnetic resonance. Liquid Fuels Technol. 1985, 3, 73–105. [Google Scholar] [CrossRef]
- Zhao, X.; Xu, C.; Shi, Q. Porphyrins in Heavy Petroleums: A Review; Structure and Bonding; Springer International Publishing: Cham, Switzerland, 2015. [Google Scholar] [CrossRef]
- Stratiev, D.; Shishkova, I.; Tsaneva, T.; Mitkova, M.; Yordanov, D. Investigation of relations between properties of vacuum residual oils from different origin, and of their deasphalted and asphaltene fractions. Fuel 2016, 170, 115–129. [Google Scholar] [CrossRef]
- Zheng, F. Molecular Composition and Structure of Metal Compounds in Asphaltene. Ph.D. Thesis, Université de Pau et des Pays de l’Adour, Pau, France, China University of Petroleum, Beijing, China, 2020. [Google Scholar]
- Zheng, F.; Zhang, Y.; Zhang, Y.; Han, Y.; Zhang, L.; Bouyssiere, B.; Shi, Q. Aggregation of petroporphyrins and fragmentation of porphyrin ions: Characterized by TIMS-TOF MS and FT-ICR MS. Fuel 2021, 289, 119889. [Google Scholar] [CrossRef]
- Ancheyta, J.; Centeno, G.; Trejo, F.; Marroquín, G. Changes in asphaltene properties during hydrotreating of heavy crudes. Energy Fuel 2003, 17, 1233–1238. [Google Scholar] [CrossRef]
- Nguyen, T.-H.; Nguyen, Q.-A.; Cao, A.N.T.; Ernest, T.; Nguyen, T.B.; Pham, P.T.; Nguyen, T.M. Hydrodemetallization of heavy oil: Recent progress, challenge, and future prospects. J. Pet. Eng. 2022, 216, 110762. [Google Scholar] [CrossRef]
- Takahashi, T.; Higashi, H.; Kai, T. Development of a new hydrodemetallization catalyst for deep desulfurization of atmospheric residue and the effect of reaction temperature on catalyst deactivation. Catal. Today 2005, 104, 76–85. [Google Scholar] [CrossRef]

Disclaimer/Publisher’s Note: The statements, opinions and data contained in all publications are solely those of the individual author(s) and contributor(s) and not of MDPI and/or the editor(s). MDPI and/or the editor(s) disclaim responsibility for any injury to people or property resulting from any ideas, methods, instructions or products referred to in the content. |
© 2023 by the authors. Licensee MDPI, Basel, Switzerland. This article is an open access article distributed under the terms and conditions of the Creative Commons Attribution (CC BY) license (https://creativecommons.org/licenses/by/4.0/).