Abstract
The aim of this study was to describe and analyse the effects of a 12-week football programme on body composition (fat mass, muscle mass, and bone mass) in children compared to a sedentary lifestyle, as well as the physical demands and loads required in training and matches in young football players (U10–U12). Forty children were included, divided into two groups: a football group (FG; n = 20) and a control group (CG; n = 20). Body composition was analysed using DXA and physical demands were analysed using GPS, with a total of 504 observations. Total bone mineral content (BMC) was significantly increased in FG-U12 (p = 0.025) after training. Total bone mineral density (BMD) was increased after the 12 weeks in FG-U10 (p = 0.001) and FG-U12 (p = 0.002). Leg BMC in FG-U10 (p < 0.05; 2.2 to 7.1 g) and FG-U12 (p < 0.05; 2.0 to 17.0 g) was increased after 12 weeks. VO2 max after training was significantly improved in FG-U10 (p < 0.05; ES: 1.7 to 5.2 mL/kg/min) and FG-U12 (p < 0.05; 0.3 to 3.8 mL/kg/min). Among U10s, midfielders covered greater distances and had higher intensity accelerations (p < 0.05; ES: 1.05 to 2.00) than forwards and defenders. Among U12s, midfielders in matches covered greater distances and at higher intensity than in training (p < 0.05; ES: 1.05 to 2.39). Football practice produces benefits in total and lower limb BMC, BMD, and VO2 max. The training and position of midfielders require higher physical demands.
Keywords:
U10; U12 football players; BMC; fat mass; load; match and training analysis; player positions 1. Introduction
There has been a significant increase in the number of overweight children [1], with as many as 100 million young people now being overweight [2]. One cause is the decrease or lack of physical activity, which, in turn, generates other diseases such as type 2 diabetes mellitus, and overweight and/or obesity in childhood has been associated with possible early death in adulthood [3]. Long-term physical inactivity is transformed into a sedentary lifestyle, generating osteoarticular diseases such as osteoporosis, which has grown into a public health problem with economic repercussions associated with treatment and rehabilitation [4]. This osteogenic disease is quite common in women and the elderly because of low bone density [5]. Although many factors influence the risk of developing osteoporosis [6], adequate bone mass acquisition in childhood reduces the risk of osteoporosis in adulthood or old age. The beneficial effects of physical activity can counteract the negative influence of a sedentary lifestyle on body composition and physical condition in children [7].
Currently, international guidelines recommend that young people should engage in 60 min or more of moderate to vigorous physical activity, along with muscle and bone strengthening activities or exercises at least 3 times a week [8]. Regular physical activity is a key factor in the prevention, development, and treatment of childhood diseases such as obesity and osteoporosis, as recurrent physical activity has positive effects on body composition, osteogenic development, cardiorespiratory fitness, and psychological state [9].
Football is a widely played game around the globe, and due to its high aerobic component, it produces a high energy expenditure, which is why it can be considered an effective tool to reduce and prevent obesity, overweight, and thus cardiovascular diseases [10]. Previous research has shown that 70–80% of maximal heart rate, indicating a high level of physical exertion, results in greater fat oxidation and fat loss during exercise compared to other activities of lower physical intensity [11]. Football is considered an impact sport, and as such, it produces benefits in bone development [12]. These high intensity levels may lead to an improvement in bone health through increased BMC and BMD during a child’s growth period [13]. Previous studies of 12 weeks of football training in an untrained adult population [14], children with obesity [15], or older people [16] have shown benefits in body composition, bone quality, and physical condition variables. Therefore, it is important to know the adaptations in a healthy child population, together with the physical demands that children have in football training and matches, and thus design training programmes appropriate to their stage of growth and development in order to ensure healthy parameters in children [17].
The Global Positioning System (GPS) is the appropriate device to determine and analyse these physical demands. It provides data on the external load experienced by players [18,19,20]. Utilising this technology in football training and contests enables coaches to comprehend the specific physical demands of different positions and tailor conditioning for each player’s specific role on the team [21,22]. In youth soccer, GPS is frequently employed to evaluate match performance, primarily for players aged 11 to 16 years [23,24,25]. However, to date, there is a paucity of data on the external load experienced by U10 and U12 football players in training and matches, which is needed to determine whether these physical demands are sufficient to improve body composition and enhance bone development in children. Therefore, the aim of this study was to describe and analyse the effects of a 12-week football programme on body composition (fat mass, muscle mass, and bone mass) in male children compared to a sedentary lifestyle, as well as the physical demands and loads required in training and matches in young football players.
2. Materials and Methods
2.1. Sample
The study sample consisted of 40 male children and was divided in two groups: a football group (FG) and a control group (CG). The FG was formed by 20 children from a football team in Toledo (Spain) (9.3 ± 1.2 years and BMI 18.0 ± 2.1 kg/m2) with a football training frequency of 3 h per week. The FG had 1 to 2 years of previous football experience. The CG was formed by 20 children from schools in Toledo (Spain) who did not perform any sports practice except for two weekly physical education classes at school (9.3 ± 1.3 years and BMI 19.0 ± 3.0 kg/m2). The players had a weekly schedule of two practices and one match. A total of 504 observations were obtained with the GPS devices. The footballers were separated into 4 forwards (FWs), 8 midfielders (MFs), and 8 defenders (DFs). All children and their legal representatives completed written informed consent forms. Castilla-La Mancha Health Service’s Clinical Research Ethics Committee approved this study following the latest Declaration of Helsinki guidelines (Ref.: 489/24022020).
2.2. Testing Procedures
Weight and height values were taken at the beginning of the study. Weight (kg) was measured using an electronic scale (Seca 813, Hamburg, Germany) and height (cm) was measured using a scientific height rod (Seca 214, Hamburg, Germany). CG did not perform any type of physical activity apart from the physical education classes at school, which comprised two classes per week for 60 min. FG, in addition to physical education classes at school, completed a 12-week football programme with a frequency of two days per week for 60 min per session, plus a 25-minute two-part match over the weekend. Training load data were analysed based on the number of days before a match (MD minus). MD-4 was the session 4 days before competition aimed at improving physical skills (endurance, speed, strength, and flexibility). MD-2 was the session 2 days before competition to prepare for the match with technical (ball handling, ball control, shooting, and ball skills) and tactical (offensive and defensive positioning, substitutions, foul and corner strategy, and attack–defence and defence–attack transitions) exercises and small-size games. A match day (MD) was played every Saturday. The football players completed a 15-minute warm-up before each game, which was not analysed in this study.
2.3. Design
One week prior to the initial assessment, CG and FG were familiarised with the different tests and technologies. Subsequently, initial or baseline (pre) assessments were conducted under conditions like those of the familiarisation tests in both groups. Subsequently, the final (post) assessments took place 12 weeks after the pre-assessments. The assessments took place in the evening, between 17:00 and 20:00 for each measurement. They were conducted at the same time using the same order and conditions as the first assessment. Body composition, manual dynamometry, countermovement jump (CMJ), and cardiorespiratory fitness were evaluated at the pre- and post-assessments.
Bone mass (BMC in g, and BMD in g/cm2), fat mass (g and %), and fat free mass (g) were calculated using a dual X-ray densitometry (Hologic Series Discovery QDR, Software Physician’s Viewer, APEX System Software Version 3.1.2. Bedford, MA, USA). The bone densitometer was calibrated before each day of testing using a lumbar spine phantom and following the guidelines set by the manufacturer. Participants were evaluated lying down with limbs extended, within scanner limits. The same operator performed all tests for consistency. The explosive force was evaluated by the CMJ. Each subject performed 3 jumps with 1 min rest between each jump, considering the flight time in centimeters. The highest flight time among the 3 jumps was taken for the result. The flight time (s) was measured using an optical data collection system (Optojump; Optojump Next v. 1.12.1.0; Bolzano, Italy). Upper body muscle strength (kg) was evaluated using an electronic dynamometer (Camry Mod: EH101, Valencia, Spain). Each subject made 3 attempts with 1 min rest in between, all with their dominant hand. The highest kg value of the 3 attempts was chosen as the result. VO2 max was estimated using the Course Navette Test, a progressive test measuring maximum oxygen uptake. The test was performed once for each measurement, obtaining the value of the period made by each subject. A formula was used to estimate the VO2 max.
FG was monitored using a GPS unit (15 Hz, Spi Pro X, GPSports, Canberra, NSW, Australia) attached to the player’s torso [26]. GPS software (Team AMS R1 2019.1 software, GPSports, Canberra, NSW, Australia) provided total distance (TD), high-speed running (Z5: 13.1–17 km·h−1), and sprinting information (Z6: ≥17.1 km·h−1). Players participated in a 10 m sprint test to calculate speed zones [27]. Sprint time (s) (≥17.1 km·h−1) and distance (m) were recorded. The GPS also recorded peak acceleration peaks, number of accelerations, and high-intensity accelerations above 2.5 m/s². High-intensity accelerations (ACCMAX) were based on Osgnach (2010) [28], defined as accelerations above 2.5 m/s². The average peak velocity of each acceleration (VMaxACC; km·h−1), time between accelerations (IACC; s), distance covered and number of high-intensity accelerations (HI acceleration; n), and average distance covered in accelerations exceeding 2.5 m/s² (TDACC; m) were calculated for comparison of the results. All variables are calculated both in absolute terms to analyse each training and match of each player and in relative terms to determine the relative difference in the percentage of training load compared to match load.
2.4. Data Analysis
First, the normality of the variables was checked by the Kolmogorov–Smirnov test, concluding that they all followed normal distribution. A sample size calculation was performed. For the analysis of within- (pre vs. post) and between-group (FG vs. CG) changes in anthropometry and physical condition variables, two-way ANCOVA was performed with a repeated measurement (time × group). Height and weight were included as covariates due to their influence on bone parameters. For the analysis of physical demands in absolute terms between the three positions (DF, MF, and FW) and the sessions (MD-4, MD-2, and MD), two-way ANOVA was used. Furthermore, two-way ANOVA was also used to compare the physical performance variables in relative terms between the three positions and the age categories. A Bonferroni post-hoc test was used for all pairwise comparisons. In addition, the 95% confidence interval and effect size (ES; Cohen’s d) were included. The effect size (ES) was calculated and categorized: trivial (0–0.2), small (0.2–0.5), moderate (0.5–0.8), and high (>0.8). A p-value of less than 0.05 was considered statistically significant. Data analyses were carried out using the SPSS 25.0 statistical package (SPSS Inc., Chicago, IL, USA).
3. Results
3.1. Body Composition
The results for body composition are shown in Table 1. In relation to total BMC, there was a significant increase in FG-U12 (p = 0.025) after training. Regarding total BMD, a significant increase was observed after the 12 weeks of intervention in FG-U10 (p = 0.001) and FG-U12 (p = 0.002). Total fat mass (g and %) obtained higher levels in CG-U12 compared to FG-U12 before (p < 0.05; ES = 1.27, p < 0. 05; ES = 1.43, respectively) and after the intervention (p < 0.05; ES = 1.27, p < 0.05; ES = 1.31, respectively).

Table 1.
Body composition before (pre) and after (post) a 12-week intervention with two days of training football plus one match per week in young U10 and U12 players (FG) and without football training in young controls (CG).
Regarding the body composition of the legs, a significant increase in BMC was evident in FG-U10 (p < 0.05; ES = 0.14) and FG-U12 (p < 0.05; ES= 0.22) after 12 weeks of training. The same was true for BMD in FG U10 (p < 0.05; ES = 0.26) and FG-U12 (p < 0.05; ES = 0.14). In relation to fat mass (g and %) of the legs, higher values were obtained in CG-U12 before (ES = 1.46; p < 0.05, p < 0.05; ES = 1.57, respectively) and after (p < 0.05; ES = 1.53, p < 0.05; ES = 1.42, respectively) 12 weeks compared with FG-U12.
With respect to the body composition of the arms, an increase in fat mass (g and %) was observed in CG-U12 before (p < 0.05; ES = 1.29, p < 0.05; ES = 1.35, respectively) and after (p < 0.05; ES = 1.25, p < 0.05; ES = 1.24, respectively) 12 weeks compared with FG-U12.
3.2. Physical Condition
The results of the physical condition testing are shown in Table 2. The interaction showed significant differences in VO2 max in U10 (p = 0.001) and U12 (p = 0.023) players in favor of FG compared with CG before and after the 12-week training period. In turn, VO2 max after training was significantly improved in FG-U10 (ES = 0.97; p < 0.05) and FG-U12 (ES = 0.61; p < 0.05). CMJ height was higher in FG-U12 than in CG before (ES = 1.37; p < 0.05) and after the intervention (ES = 1.87; p < 0.05).
Table 2.
Physical condition before (pre) and after (post) a 12-week intervention with two days of training football plus one match per week in young U10 and U12 players (FG) and without football training in young controls (CG).
3.3. Load
Table 3 presents the results in terms of the variables in absolute values obtained by GPS in the U10 and U12 categories for MD-4, MD-2, and MD in the different game positions (DFs, MFs, and FWs). The U10 results with respect to MD-4, MD-2, and MD showed that MD had significantly higher values than MD-2 and MD-4 in TD, distance Z5, and distance Z6 for MFs and higher values than MD-4 in HI acceleration for MFs (p < 0.05; ES = 0.72 to 1.57). The U10 results in relation to the playing positions (DFs, MFs, and FWs) showed that the MFs presented significantly higher values than DFs and FWs in TD, distance Z5, distance Z6, and HI acceleration in MD, higher values than FWs in distance Z6 in MD-2, and higher values than FWs in ACCMAX in MD (p < 0.05; ES = 1.05 to 2.00). FWs showed significantly lower values than DFs and MFs in VMaxACC in MD-4 (p < 0.05; ES = 0.25 to 0.79).
Table 3.
Absolute training and match load metrics for U10 and U12 football players.
On the other hand, the U12 results with respect to MD-4, MD-2, and MD were as follows. MD showed significantly higher values than MD-4 in TD for MFs, higher values than MD-2 and MD-4 in distance Z5 for MFs, and higher values than MD-2 in VMaxACC for FWs (p < 0.05; ES = 1.05 to 2.39). In addition, MD-4 showed significantly higher values than MD-2 in IACC and TDACC for DFs (p < 0.05; ES = 1.08 to 1.17). The U12 results in relation to the playing positions (DFs, MFs, and FWs) showed that FWs had significantly higher values than DFs in IACC in MD (ES = 1.71; p < 0.05).
Figure 1 shows the results in terms of the variables in relative values obtained by GPS for MD in the U10 and U12 categories for the different game positions (DFs, MFs, and FWs). In the relative results in relation to the game positions (DFs, MFs, and FWs), in the U10 category, MFs showed a significantly lower percentage of TD than DFs and FWs (p < 0.05; ES = 0.76 to 0.83). DFs showed a significantly higher percentage in distance Z5 than MFs (p < 0.05; ES = 0.97). No significant difference was obtained in the U12 category or between the two age categories.
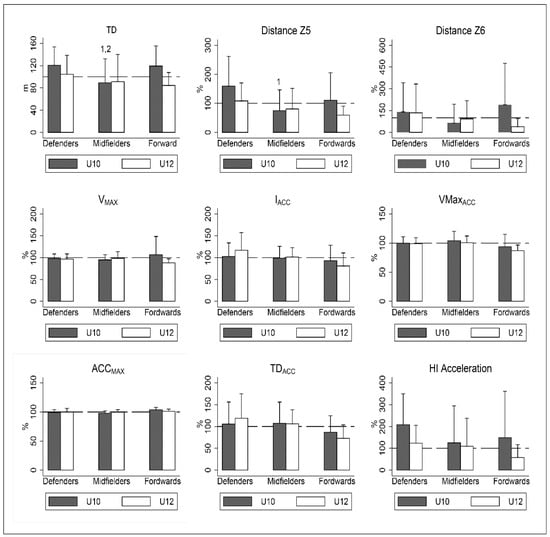
Figure 1.
Training load metrics for U10 and U12 players relative to competitive match play. Data are presented across positions: defenders (DFs), midfielders (MFs), and forwards (FWs). TD = total distance; distance Z5: distance zone 5; distance Z6: distance zone 6; VMAX = maximum speed; IACC = time interval between accelerations; VMaxACC = average maximum speed acceleration; ACCMAX = maximum acceleration; TDACC = average distance travelled in acceleration greater than 2.5 m·s−2; HI acceleration = number of high-intensity accelerations; 1 = differences between DFs and MFs; 2 = differences from FWs.
4. Discussion
The present study aimed to describe and analyse the effects of a 12-week football programme on body composition (fat mass, muscle mass and bone mass) in male children compared to a sedentary lifestyle, as well as the physical demands and loads required in training and matches in young football players. The main results regarding body composition indicated a significant increase in total BMD, BMD, and BMC of the legs in FG (U10 and U12). Higher whole-body values were found in CG-U12 for fat mass. FG U10 and U12 had significantly increased VO2 max values after 12 weeks of training. The physical demands and loads required in training and matches in FG differed according to the position, being higher for the U10 MFs. However, no significant differences between positions were obtained for U12 players. In addition, the load and physical demands were higher in training for U10 players than in matches. This variability was lower for U12 players. The results of the body composition testing together with the analysis of the load and physical demands of U10 and U12 football training in the present study are novel, as such a study has not been previously carried out.
When analysing baseline body composition and fitness values, differences were observed between FG and CG, and these differences persisted or increased after 12 weeks of football training. Similar results were shown in the study by Zouch (2008) [29] in which the football group with at least 3 years of practice showed differences from the sedentary control group that only performed physical education classes, in terms of baseline values and after 5 and 10 months of football training. CG-U12 had higher fat mass values than FG-U12 before the intervention. However, these basal differences were not evident between CG-U10 and FG-U10. Furthermore, baseline VO2 max values were higher in FG-U10 and FG-U12 than in CG-U10 and CG-U12. This difference was greater in the U12 category. This may be due to the length of time spent playing football, as the U12 players had been playing football for two years longer than the U10 players. This length of time playing sport may have resulted in a greater difference in energy expenditure and calorie consumption compared to CG-U12, which may have led to greater differences in fat mass levels [30]. Football is an aerobic sport that leads to improvement in cardiorespiratory fitness from childhood to adolescence and can lead to improvement in VO2 max compared to CG [31]. Additionally, CMJ values were higher in FG-U12 before and after the intervention than in CG-U12. Football is a combination of jumping, sprinting, changing direction, shooting, and passing [10]. These physical activities mainly use the skeletal muscles of the lower extremities, resulting in greater strength and power compared to CG. Therefore, previous football experience is a factor to consider when analysing body composition and physical fitness in U10 and U12 children.
In relation to the values obtained in the bone development of U10 and U12 children, we found higher levels of total BMC and BMD and in the legs of both groups (FG-U10 and FG-U12) after the 12 weeks of training. This is due to the fact that a sport such as football is associated with high-impact exercise, as it involves sprints, jumps, and movements that require abrupt changes in the centre of mass [32]. In addition, greater differences in BMC and BMD values were observed in the lower extremities than in the upper extremities. The causes of these differences may be due to the higher physical activity that the leg bones have to tolerate, as they are continuously supporting the actions of the body and interactions with the ball and the opponent. However, the increase in BMC and BMD levels was greater for FG-U12. Age may play a major role in bone development. The stage of growth and sexual maturity is most noticeable at age 12, which may be decisive for their bone mineralization [33] and may be a cause of these differences compared to FG-U10.
Regarding the results observed in the fat mass variable, both groups (CG- and FG-U10 and CG- and FG-U12) showed similar levels after the 12 weeks of intervention. As these were healthy children with a low BMI (18–19 kg/m2), the impact of the training might not have caused an alteration in fat mass levels [30]. Additionally, possible variations in diet or physical activity outside the study were not considered. In relation to muscle mass, which is similar to fat mass, no variations were observed between the two groups after 12 weeks. The time factor may be the cause of the results obtained, since greater gains in muscle mass were achieved in children who play football in interventions carried out over a longer period [34].
In relation to the load and physical demands required for football training in U10 and U12 players, we observed that position plays an important role. U10 MFs had higher load values in training and matches than DFs and FWs. This was due to the influence of both their offensive and defensive roles in the game, which leads to higher physical demands [35]. In contrast, differentiating between U10 and U12 players, U12 players showed less variability between their playing positions. According to previous research, young players’ notions of tactics and rules of the game are very low or non-existent and are influenced by training and competition experience [36]. These tactical notions have different levels of knowledge depending on age [37] and the position of the player on the pitch [38]. On the other hand, differentiating between training sessions and matches, both in absolute and relative values, greater physical demands were found in training for both age categories. In this age group, training was focused on the development of physical and technical skills [39,40], which together with good locomotor coordination [41] produce improvements in the physical condition (VO2 max, CMJ, or dynamometry) of young football players [42,43].
Extrapolating these differences in physical demands in training and matches between positions in both age categories to the pitch of body composition and physical condition, a future line of research could be the influence of the playing position in training and matches on the variables of body composition and physical condition. Certain positions require more physical activity than others depending on whether the activity is performed in training or in a match. Therefore, the benefits to body composition and physical condition could be different.
This study had limitations that must be acknowledged. The division of the groups was not random, as the subjects in the football group were predisposed to play football because they already had one year of previous experience. Various factors that may affect body composition, such as physical activity outside of football training, hours of physical education at school, and dietary intake of the subjects, were not considered. Furthermore, this research was carried out with males, so the results cannot be generalised to all children.
5. Conclusions
The present study indicates that football practice for 12 weeks in young U10 and U12 football players produces benefits in body composition and physical fitness. The main improvement in body composition was bone development (BMC and BMD) in both the whole body and lower extremities. These improvements were most notable in the U12 category. Regarding physical fitness, the main benefit was in VO2 max, with significant improvement in both age categories. In relation to physical demands, the playing position and whether the activity was performed in training or in a match were influential factors. U10 and U12 MFs had higher physical loads in training and matches than DFs and FWs. The demands required in training were higher than in matches for both age categories.
Author Contributions
Conceptualization, J.S.-S. and J.G.-U.; data curation, A.H.-M.; formal analysis, J.G.-U. and S.M.-C.; investigation, S.M.-C., J.L.F., and A.H.-M.; methodology, A.H.-M.; project administration, L.G.; resources, J.S.-S. and J.L.F.; software, J.G.-U.; supervision, L.G. and J.L.F.; validation, J.G.-U. and J.L.F.; writing—original draft, A.H.-M. and S.M.-C.; writing—review and editing, L.G., J.S.-S., J.L.F., and J.G.-U. All authors have read and agreed to the published version of the manuscript.
Funding
This research received no external funding.
Institutional Review Board Statement
Castilla-La Mancha Health Service’s Clinical Research Ethics Committee approved this study following latest Declaration of Helsinki guidelines (Ref.: 489/24022020).
Informed Consent Statement
All participants in the study provided written consent for their participation and publication of the results.
Acknowledgments
The authors extend their gratitude to the football sport schools and all players involved in the study. Additionally, they acknowledge the funding support from the Spanish Ministry of Science, Innovation and Universities (Grant Number: FPU18/03222) for A.H.-M.’s PhD, University of Castilla-La Mancha for S.M.-C.’s PhD (2019/5964), and “Fondo Europeo de Desarrollo Regional, Programa Operativo de la Región de Castilla-LaMancha” (2018/11744) for J.G.-U.’s research.
Conflicts of Interest
The authors declare no conflict of interest.
References
- Emamian, M.H.; Hashemi, H.; Fotouhi, A. Obesity and underweight: Serious health problems in Iranian primary school children. Int. J. Pediatr. 2019, 61, 1030–1035. [Google Scholar] [CrossRef] [PubMed]
- Lee, E.Y.; Yoon, K.H. Epidemic obesity in children and adolescents: Risk factors and prevention. Front. Med. 2018, 12, 658–666. [Google Scholar] [CrossRef] [PubMed]
- Wabitsch, M. Overweight and obesity in European children: Definition and diagnostic procedures, risk factors and consequences for later health outcome. Eur. J. Pediatr. 2000, 159, S8–S13. [Google Scholar] [CrossRef] [PubMed]
- Cruz, J.G.; Martínez, R.F.; Martínez, J.G.; Gutiérrez, E.S.; Serrano, M.E.; de las Deses, C.D.H. Osteoporosis. Conceptos básicos para la práctica diaria. Rev. Espec. Méd.-Quirúrg. 2009, 14, 128–140. [Google Scholar]
- Bliuc, D.; Alarkawi, D.; Nguyen, T.V.; Eisman, J.A.; Center, J.R. Risk of subsequent fractures and mortality in elderly women and men with fragility fractures with and without osteoporotic bone density: The Dubbo Osteoporosis Epidemiology Study. J. Bone Miner. Res. 2015, 30, 637–646. [Google Scholar] [CrossRef]
- Jarrosay, L.F.; Speck, C.M.J.; Fernandez, G.S.; Duvergel, N.S.; Martínez, R.H. Osteoporosis. Probl. Soc. Actual RIC 2016, 95, 1052–1066. [Google Scholar]
- Ørntoft, C.; Fuller, C.W.; Larsen, M.N.; Bangsbo, J.; Dvorak, J.; Krustrup, P. ‘FIFA 11 for Health’ for Europe. II: Effect on health markers and physical fitness in Danish schoolchildren aged 10–12 years. Br. J. Sport. Med. 2016, 50, 1394–1399. [Google Scholar] [CrossRef]
- Bull, F.C.; Al-Ansari, S.S.; Biddle, S.; Borodulin, K.; Buman, M.P.; Cardon, G.; Carty, C.; Chaput, J.-P.; Chastin, S.; Chou, R.; et al. World Health Organization 2020 guidelines on physical activity and sedentary behaviour. Br. J. Sport. Med. 2020, 54, 1451–1462. [Google Scholar] [CrossRef]
- Vasconcellos, F.; Seabra, A.; Katzmarzyk, P.T.; Kraemer-Aguiar, L.G.; Bouskela, E.; Farinatti, P. Physical activity in overweight and obese adolescents: Systematic review of the effects on physical fitness components and cardiovascular risk factors. Sport. Med. 2014, 44, 1139–1152. [Google Scholar] [CrossRef]
- Krustrup, P.; Aagaard, P.; Nybo, L.; Petersen, J.; Mohr, M.; Bangsbo, J. Recreational football as a health promoting activity: A topical review. Scan. J. Med. Sci. Sport. 2010, 20, 1–13. [Google Scholar] [CrossRef]
- Aguiar, M.; Botelho, G.; Lago, C.; Maças, V.; Sampaio, J. A review on the effects of soccer small-sided games. J. Hum. Kinet. 2012, 33, 103. [Google Scholar] [CrossRef]
- Maillane-Vanegas, S.; Agostinete, R.R.; Lynch, K.R.; Ito, I.H.; Luiz-de-Marco, R.; Rodrigues-Junior, M.A.; Fernandes, R.A. Bone mineral density and sports participation. J. Clin. Densitom. 2020, 23, 294–302. [Google Scholar] [CrossRef]
- Tenforde, A.S.; Fredericson, M. Influence of sports participation on bone health in the young athlete: A review of the literature. PMR 2011, 3, 861–867. [Google Scholar] [CrossRef]
- Krustrup, P.; Nielsen, J.J.; Krustrup, B.R.; Christensen, J.F.; Pedersen, H.; Randers, M.B.; Bangsbo, J. Recreational soccer is an effective health-promoting activity for untrained men. Br. J. Sport. Med. 2009, 43, 825–831. [Google Scholar] [CrossRef] [PubMed]
- Faude, O.; Kerper, O.; Multhaupt, M.; Winter, C.; Beziel, K.; Junge, A.; Meyer, T. Football to tackle overweight in children. Scand. J. Med. Sci. Sport. 2010, 20, 103–110. [Google Scholar] [CrossRef] [PubMed]
- Matias, G.H.D.L.; Costa, A.D.S.; Fonseca, R.M.C. Effect of 12 weeks of recreational soccer on bone mineral density and sarcopenia in the elderly: A randomized clinical trial. Phys. Educ. Sport 2022, 2022, 32. [Google Scholar] [CrossRef]
- Carling, C.; Bloomfield, J.; Nelsen, L.; Reilly, T. The role of motion analysis in elite soccer. Sport. Med. 2008, 38, 839–862. [Google Scholar] [CrossRef]
- Anderson, L.; Orme, P.; Di Michele, R.; Close, G.L.; Morgans, R.; Drust, B.; Morton, J.P. Quantification of training load during one-, two-and three-game week schedules in professional soccer players from the English Premier League: Implications for carbohydrate periodisation. J. Sport Sci. 2016, 34, 1250–1259. [Google Scholar] [CrossRef]
- Gaudino, P.; Iaia, F.M.; Strudwick, A.J.; Hawkins, R.D.; Alberti, G.; Atkinson, G.; Gregson, W. Factors influencing perception of effort (session rating of perceived exertion) during elite soccer training. Int. J. Sport. Physiol. Perform. 2015, 10, 860–864. [Google Scholar] [CrossRef]
- Cetolin, T.; Teixeira, A.S.; Netto, A.S.; Haupenthal, A.; Nakamura, F.Y.; Guglielmo, L.G.A.; da Silva, J.F. Training loads and RSA and aerobic performance changes during the preseason in youth soccer squads. J. Hum. Kinet. 2018, 65, 235–248. [Google Scholar] [CrossRef]
- Mallo, J.; Mena, E.; Nevado, F.; Paredes, V. Physical demands of top-class soccer friendly matches in relation to a playing position using global positioning system technology. J. Hum. Kinet. 2015, 47, 179–188. [Google Scholar] [CrossRef] [PubMed]
- Castellano, J.; Alvarez-Pastor, D.; Bradley, P.S. Evaluation of research using computerised tracking systems (Amisco and Prozone) to analyse physical performance in elite soccer: A systematic review. Sport. Med. 2014, 44, 701–712. [Google Scholar] [CrossRef] [PubMed]
- Silva, C.D.D.; Natali, A.J.; Carling, C.; Lima, J.R.; Bara Filho, M.G.; Garcia, E.S.; Marins, J.C.B. Match internal load in youth elite soccer players is period, playing position and intermittent running capacity dependent. Mot. Rev. Educ. Física 2018, 24, 40. [Google Scholar] [CrossRef]
- Vigh-Larsen, J.F.; Dalgas, U.; Andersen, T.B. Position-specific acceleration and deceleration profiles in elite youth and senior soccer players. J. Strength Cond. Res. 2018, 32, 1114–1122. [Google Scholar] [CrossRef]
- Abbott, W.; Brickley, G.; Smeeton, N.J. Physical demands of playing position within English Premier League academy soccer. J. Hum. Sport Exerc. 2018, 13, 285–295. [Google Scholar] [CrossRef]
- Sanchez-Sanchez, J.; Sanchez, M.; Hernandez, D.; Ramirez-Campillo, R.; Martínez, C.; Nakamura, F.Y. Fatigue in U12 Soccer-7 players during repeated 1-day tournament games: A pilot study. J. Strength Cond. Res. 2019, 33, 3092–3097. [Google Scholar] [CrossRef]
- Goto, H.; Morris, J.G.; Nevill, M.E. Match analysis of U9 and U10 English premier league academy soccer players using a global positioning system: Relevance for talent identification and development. J. Strength Cond. Res. 2015, 29, 954–963. [Google Scholar] [CrossRef]
- Osgnach, C.; Poser, S.; Bernardini, R.; Rinaldo, R.; Di Prampero, P.E. Energy cost and metabolic power in elite soccer: A new match analysis approach. Med. Sci. Sport. Exerc. 2010, 42, 170–178. [Google Scholar] [CrossRef]
- Zouch, M.; Jaffré, C.; Thomas, T.; Frère, D.; Courteix, D.; Vico, L.; Alexandre, C. Long-term soccer practice increases bone mineral content gain in prepubescent boys. Jt. Bone Spine 2008, 75, 41–49. [Google Scholar] [CrossRef]
- Skoradal, M.B.; Purkhús, E.; Steinholm, H.; Olsen, M.H.; Ørntoft, C.; Larsen, M.N.; Krustrup, P. “FIFA 11 for Health” for Europe in the Faroe Islands: Effects on health markers and physical fitness in 10- to 12-year-old schoolchildren. Scan. J. Med. Sci. Sport. 2018, 28, 8–17. [Google Scholar] [CrossRef]
- Vargas, P.C.; Jiménez, J.M. A meta-analysis on the effects of exercise training on the VO2max in children and adolescents. Retos 2015, 27, 184–187. [Google Scholar] [CrossRef]
- Seabra, A.; Marques, E.; Brito, J.; Krustrup, P.; Abreu, S.; Oliveira, J.; Rêgo, C.; Mota, J.; Rebelo, A. Muscle strength and soccer practice as major determinants of bone mineral density in adolescents. Jt. Bone Spine 2012, 79, 403–408. [Google Scholar] [CrossRef] [PubMed]
- Larsen, M.N.; Nielsen, C.M.; Helge, E.W.; Madsen, M.; Manniche, V.; Hansen, L.; Krustrup, P. Positive effects on bone mineralization and muscular fitness after 10 months of intense school-based physical training for children aged 8–10 years: The FIT FIRST randomised controlled trial. Br. J. Sport. Med. 2018, 52, 254–260. [Google Scholar] [CrossRef] [PubMed]
- Hernandez-Martin, A.; Garcia-Unanue, J.; Martínez-Rodríguez, A.; Manzano-Carrasco, S.; Felipe, J.L.; Carvalho, M.J.; Sanchez-Sanchez, J. The Effects of Football Practice on Nutritional Status and Body Composition in Children: A Systematic Review and Meta-Analysis. Nutrients 2021, 13, 2562. [Google Scholar] [CrossRef] [PubMed]
- Saward, C.; Morris, J.G.; Nevill, M.E.; Nevill, A.M.; Sunderland, C. Longitudinal development of match-running performance in elite male youth soccer players. Scand. J. Med. Sci. Sport. 2016, 26, 933–942. [Google Scholar] [CrossRef]
- Serra-Olivares, J.; García-López, L.M.; Calderón, A.; Cuevas-Campos, R. Relationship between young soccer players’ tactical knowledge and age, experience and level of expertise. Cuad. Psicol. Deporte 2015, 15, 105–112. [Google Scholar] [CrossRef]
- Giacomini, D.S.; Soares, V.O.; Santos, H.F.; Matias, C.J.; Greco, P.J. O conhecimento tático declarativo e procesual em jogadores de futebol de diferentes escalões. Motricidade 2011, 1, 43–53. [Google Scholar]
- Kannekens, R.; Elferink-Gemser, M.T.; Visscher, C. Tactical skills of world-class youth soccer teams. J. Sport. Sci. 2009, 27, 807–812. [Google Scholar] [CrossRef]
- Leyhr, D.; Kelava, A.; Raabe, J.; Höner, O. Longitudinal motor performance development in early adolescence and its relationship to adult success: An 8-year prospective study of highly talented soccer players. PLoS ONE 2018, 13, e0196324. [Google Scholar] [CrossRef]
- Huijgen, B.C.; Elferink-Gemser, M.T.; Lemmink, K.A.; Visscher, C. Multidimensional performance characteristics in selected and deselected talented soccer players. Eur. J. Sport Sci. 2014, 14, 2–10. [Google Scholar] [CrossRef]
- Rommers, N.; Mostaert, M.; Goossens, L.; Vaeyens, R.; Witvrouw, E.; Lenoir, M.; D’Hondt, E. Age and maturity related differences in motor coordination among male elite youth soccer players. J. Sport. Sci. 2018, 37, 196–203. [Google Scholar] [CrossRef] [PubMed]
- Deprez, D.; Valente-Dos-Santos, J.; Coelho-e-Silva, M.J.; Lenoir, M.; Philippaerts, R.; Vaeyens, R. Longitudinal development of explosive leg power from childhood to adulthood in soccer players. Int. J. Sport. Med. 2015, 36, 672–679. [Google Scholar] [CrossRef] [PubMed]
- Deprez, D.; Valente-dos-Santos, J.; Coelho-e-Silva, M.; Lenoir, M.; Philippaerts, R.M.; Vaeyens, R. Modeling developmental changes in the yo-yo intermittent recovery test level 1 in elite pubertal soccer players. Int. J. Sport. Physiol. Perform. 2014, 9, 1006–1012. [Google Scholar] [CrossRef] [PubMed]
Disclaimer/Publisher’s Note: The statements, opinions and data contained in all publications are solely those of the individual author(s) and contributor(s) and not of MDPI and/or the editor(s). MDPI and/or the editor(s) disclaim responsibility for any injury to people or property resulting from any ideas, methods, instructions or products referred to in the content. |
© 2023 by the authors. Licensee MDPI, Basel, Switzerland. This article is an open access article distributed under the terms and conditions of the Creative Commons Attribution (CC BY) license (https://creativecommons.org/licenses/by/4.0/).