
A Simple and Low-Cost Technique for 5G Conservative Human Exposure Assessment

 ,
,  ,
,  and
and 
Abstract
1. Introduction
2. Maximum Power Extrapolation Technique for 5G
3. The Conservative Maximum Power Estimation Procedure
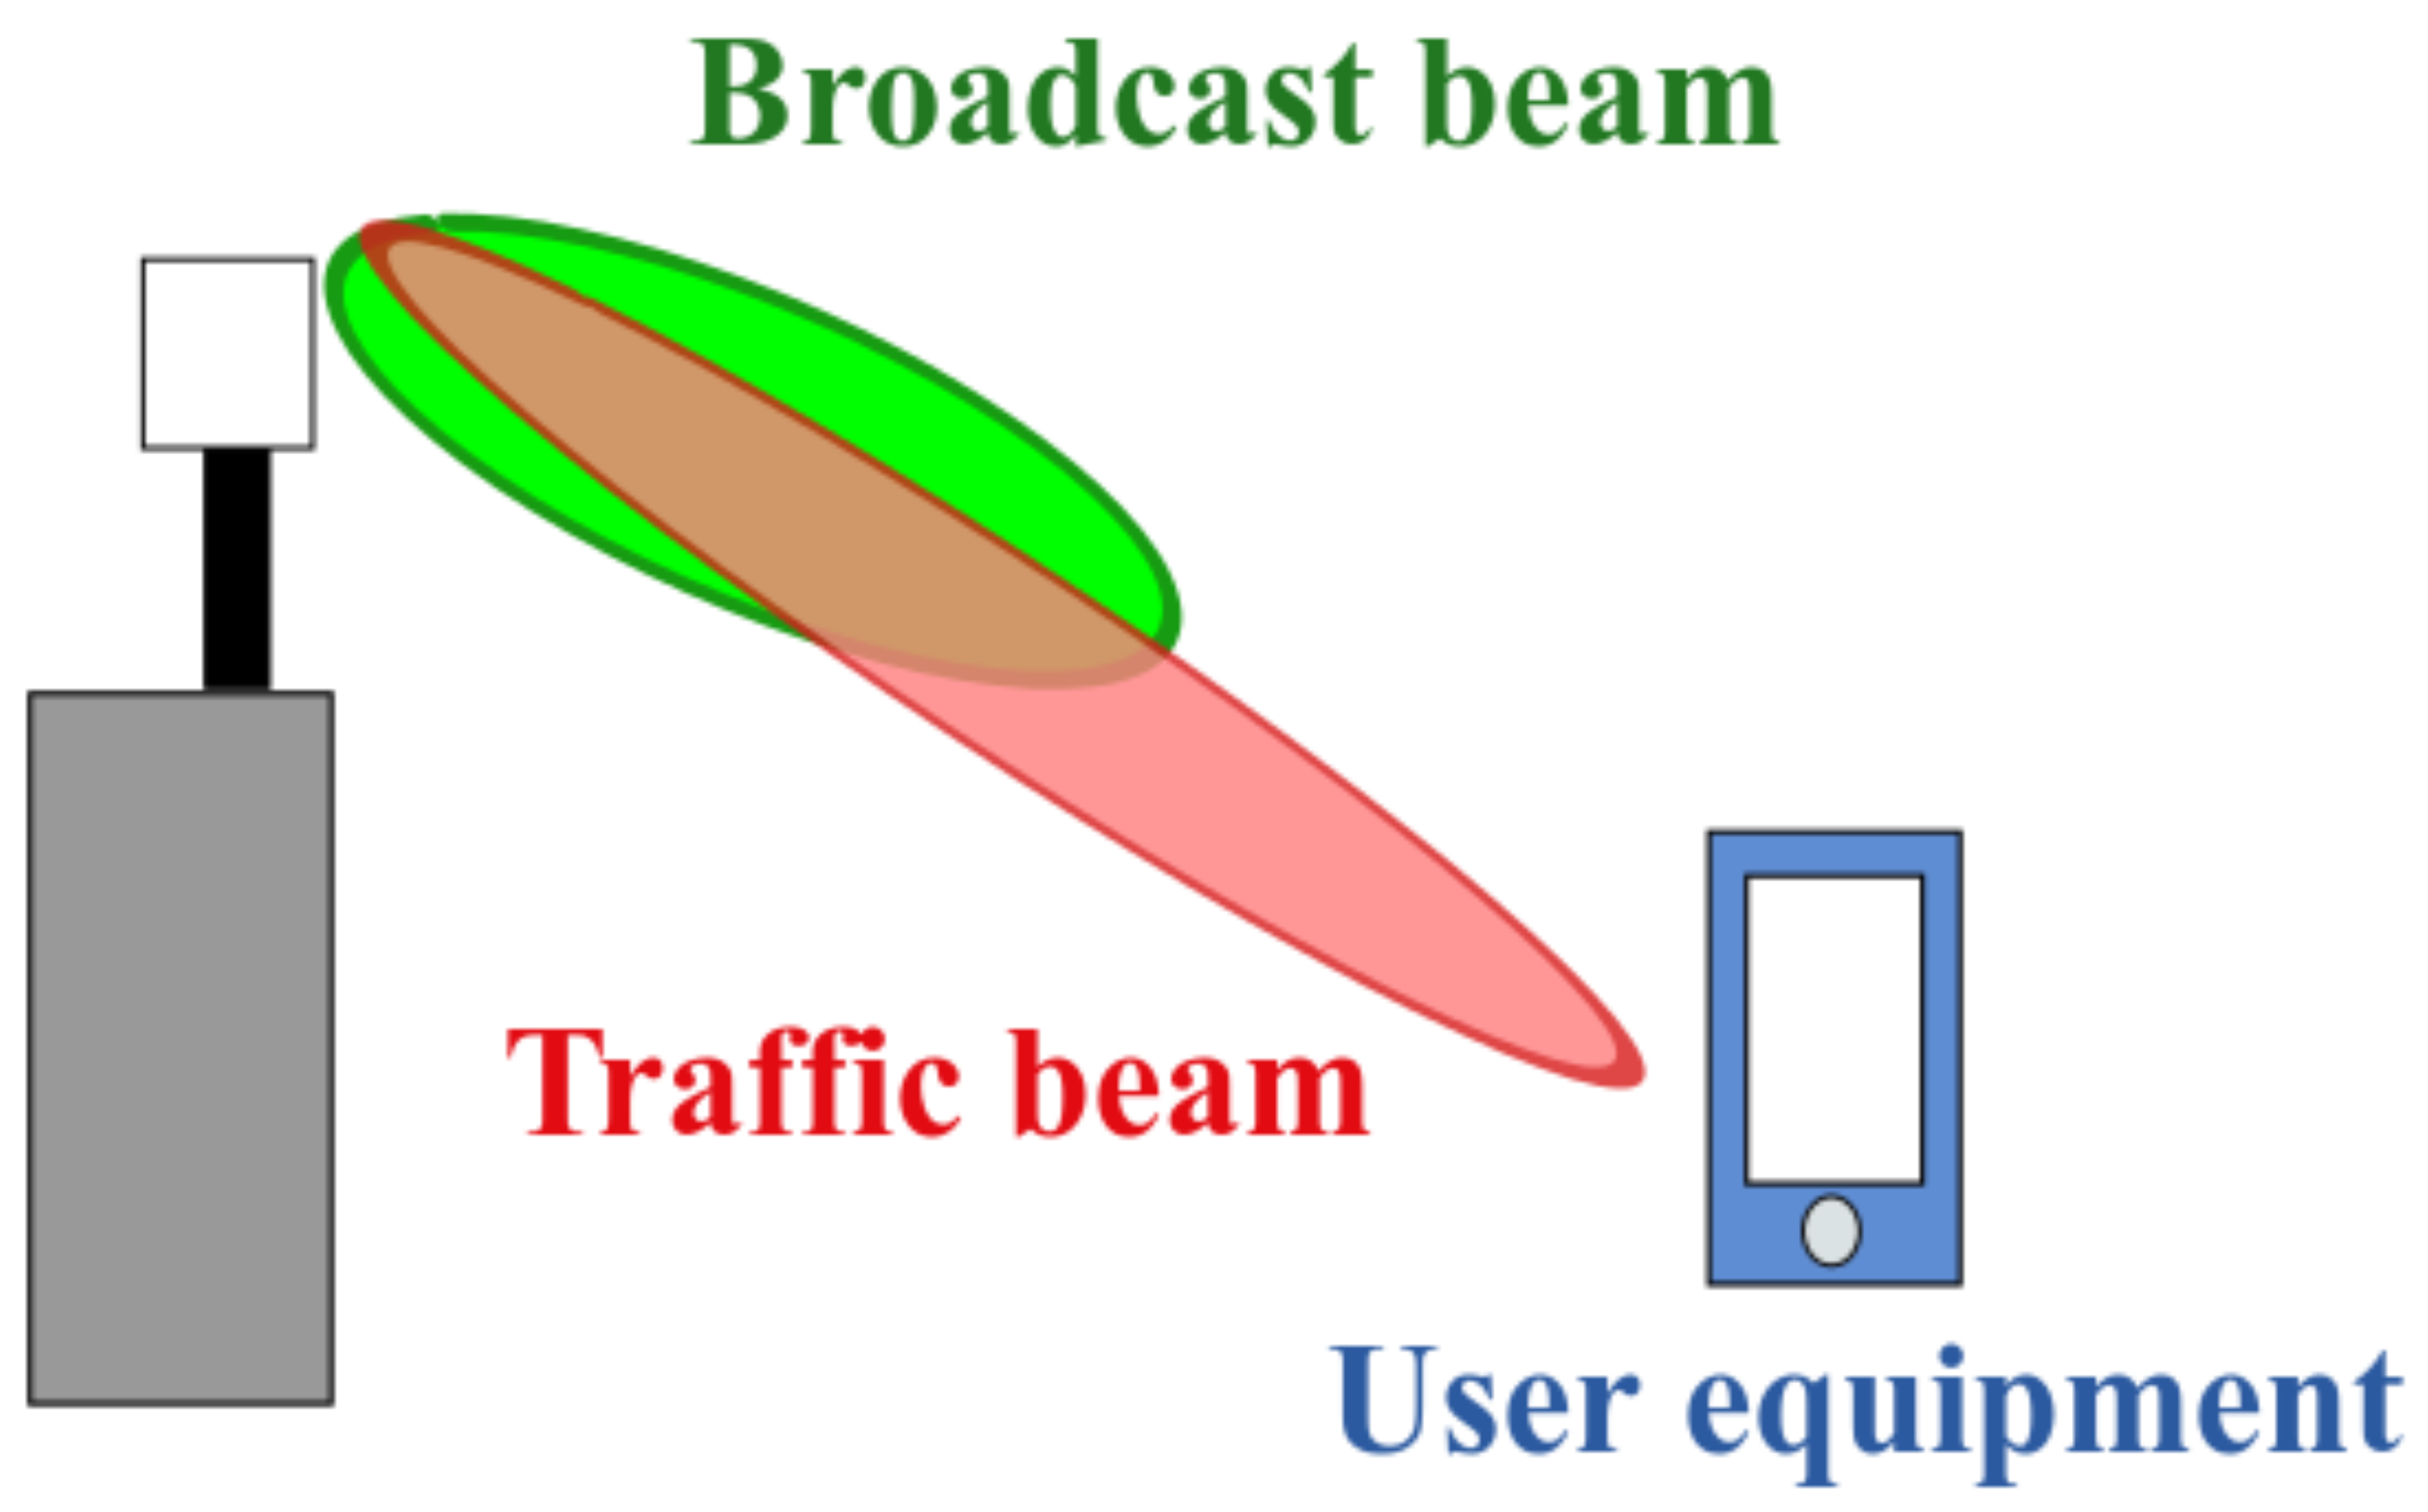
- The Broadcast Envelope Radiation Pattern (BERP) is the envelope pattern of each Broadcast Beam Configuration; since the AAS can have different broadcast configurations available for specific coverage requirements, there are as many BERP as the number of configurations implemented by the AAS.
- The Traffic Envelope Radiation Pattern (TERP) is the envelope pattern of the traffic beams associated with a Broadcast Configuration; TERP could be associated with more than one Broadcast Configuration.
- BERP and TERP are valid in far-field and free-space propagation conditions.
- BERP and TERP can be obtained by measurement or numerical simulation.
- No uncertainty information on BERP and TERP is usually available.
- Information on the mechanical and (if applied) electrical tilting is not included in the data and must be obtained from the operator.
- Central frequency of the SSB;
- Bandwidth B;
- Numerology ;
- duty cycle .
- 1.
- Preliminary calculations of in different angular ranges.
- (a)
- (b)
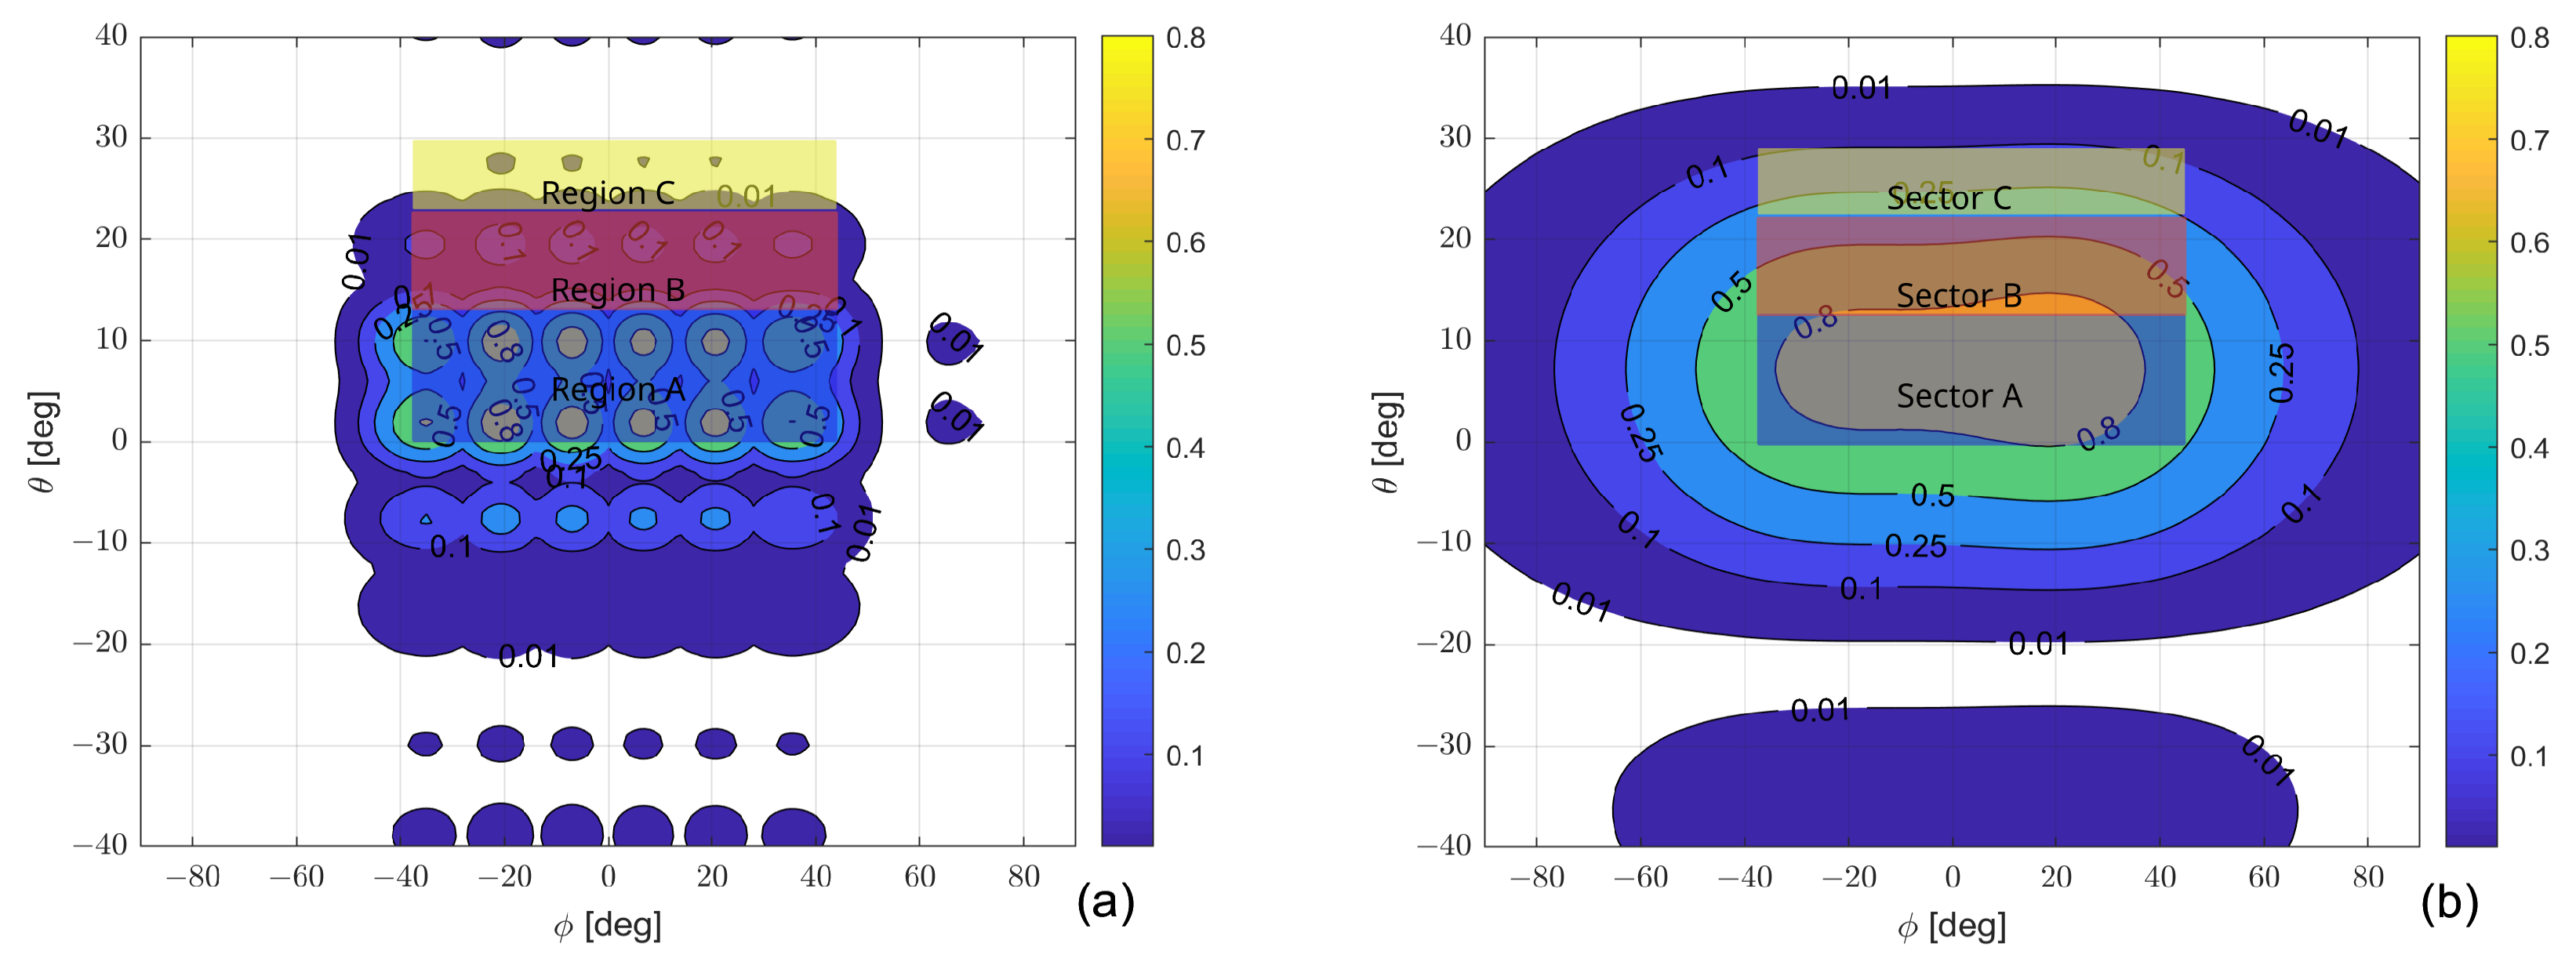
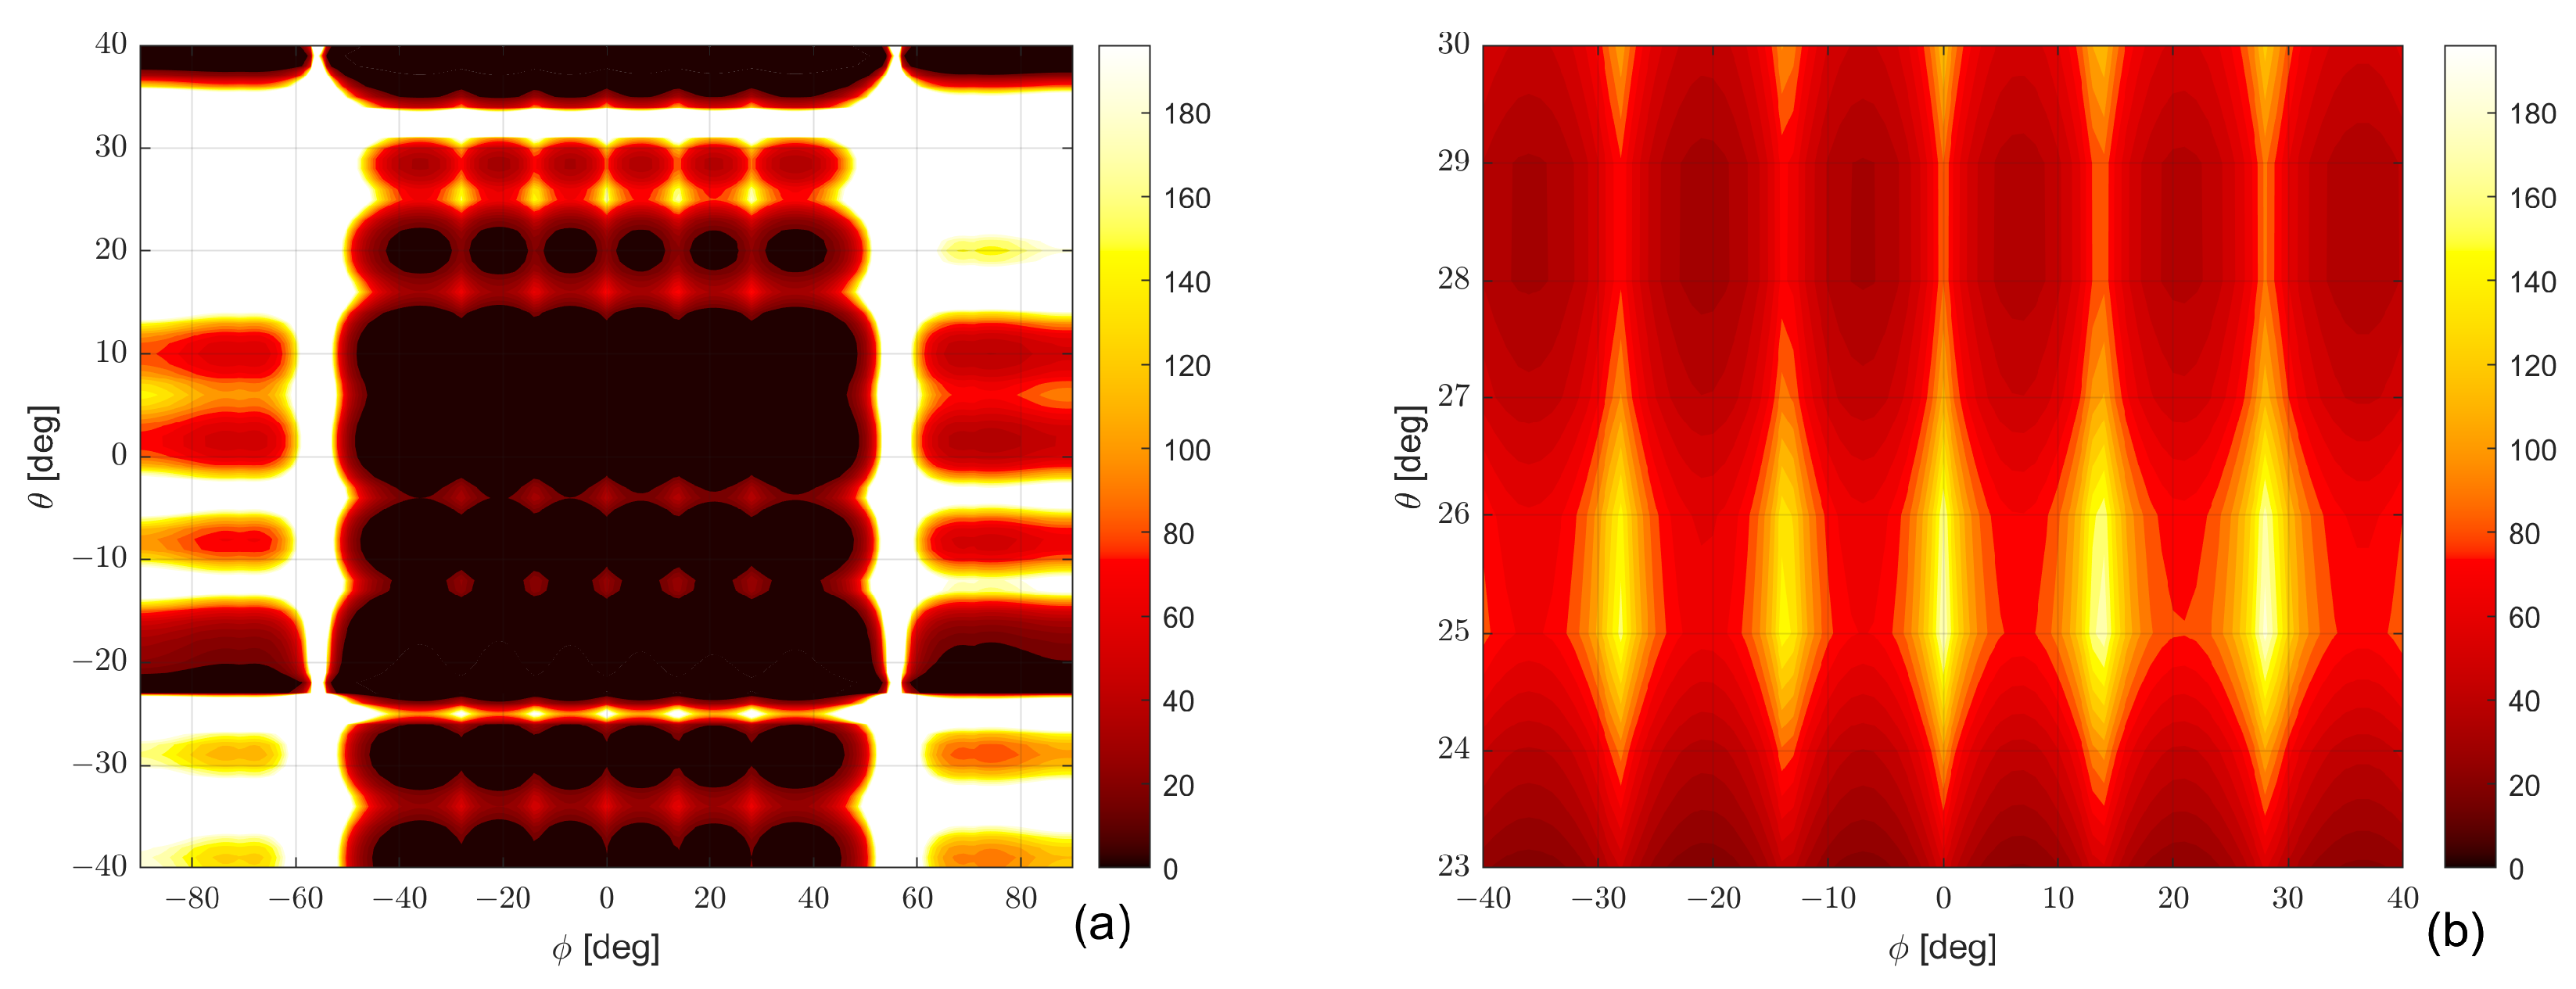
- Plot the and identify a suitable number of angular ranges where the function is relatively homogeneous;
- (c)
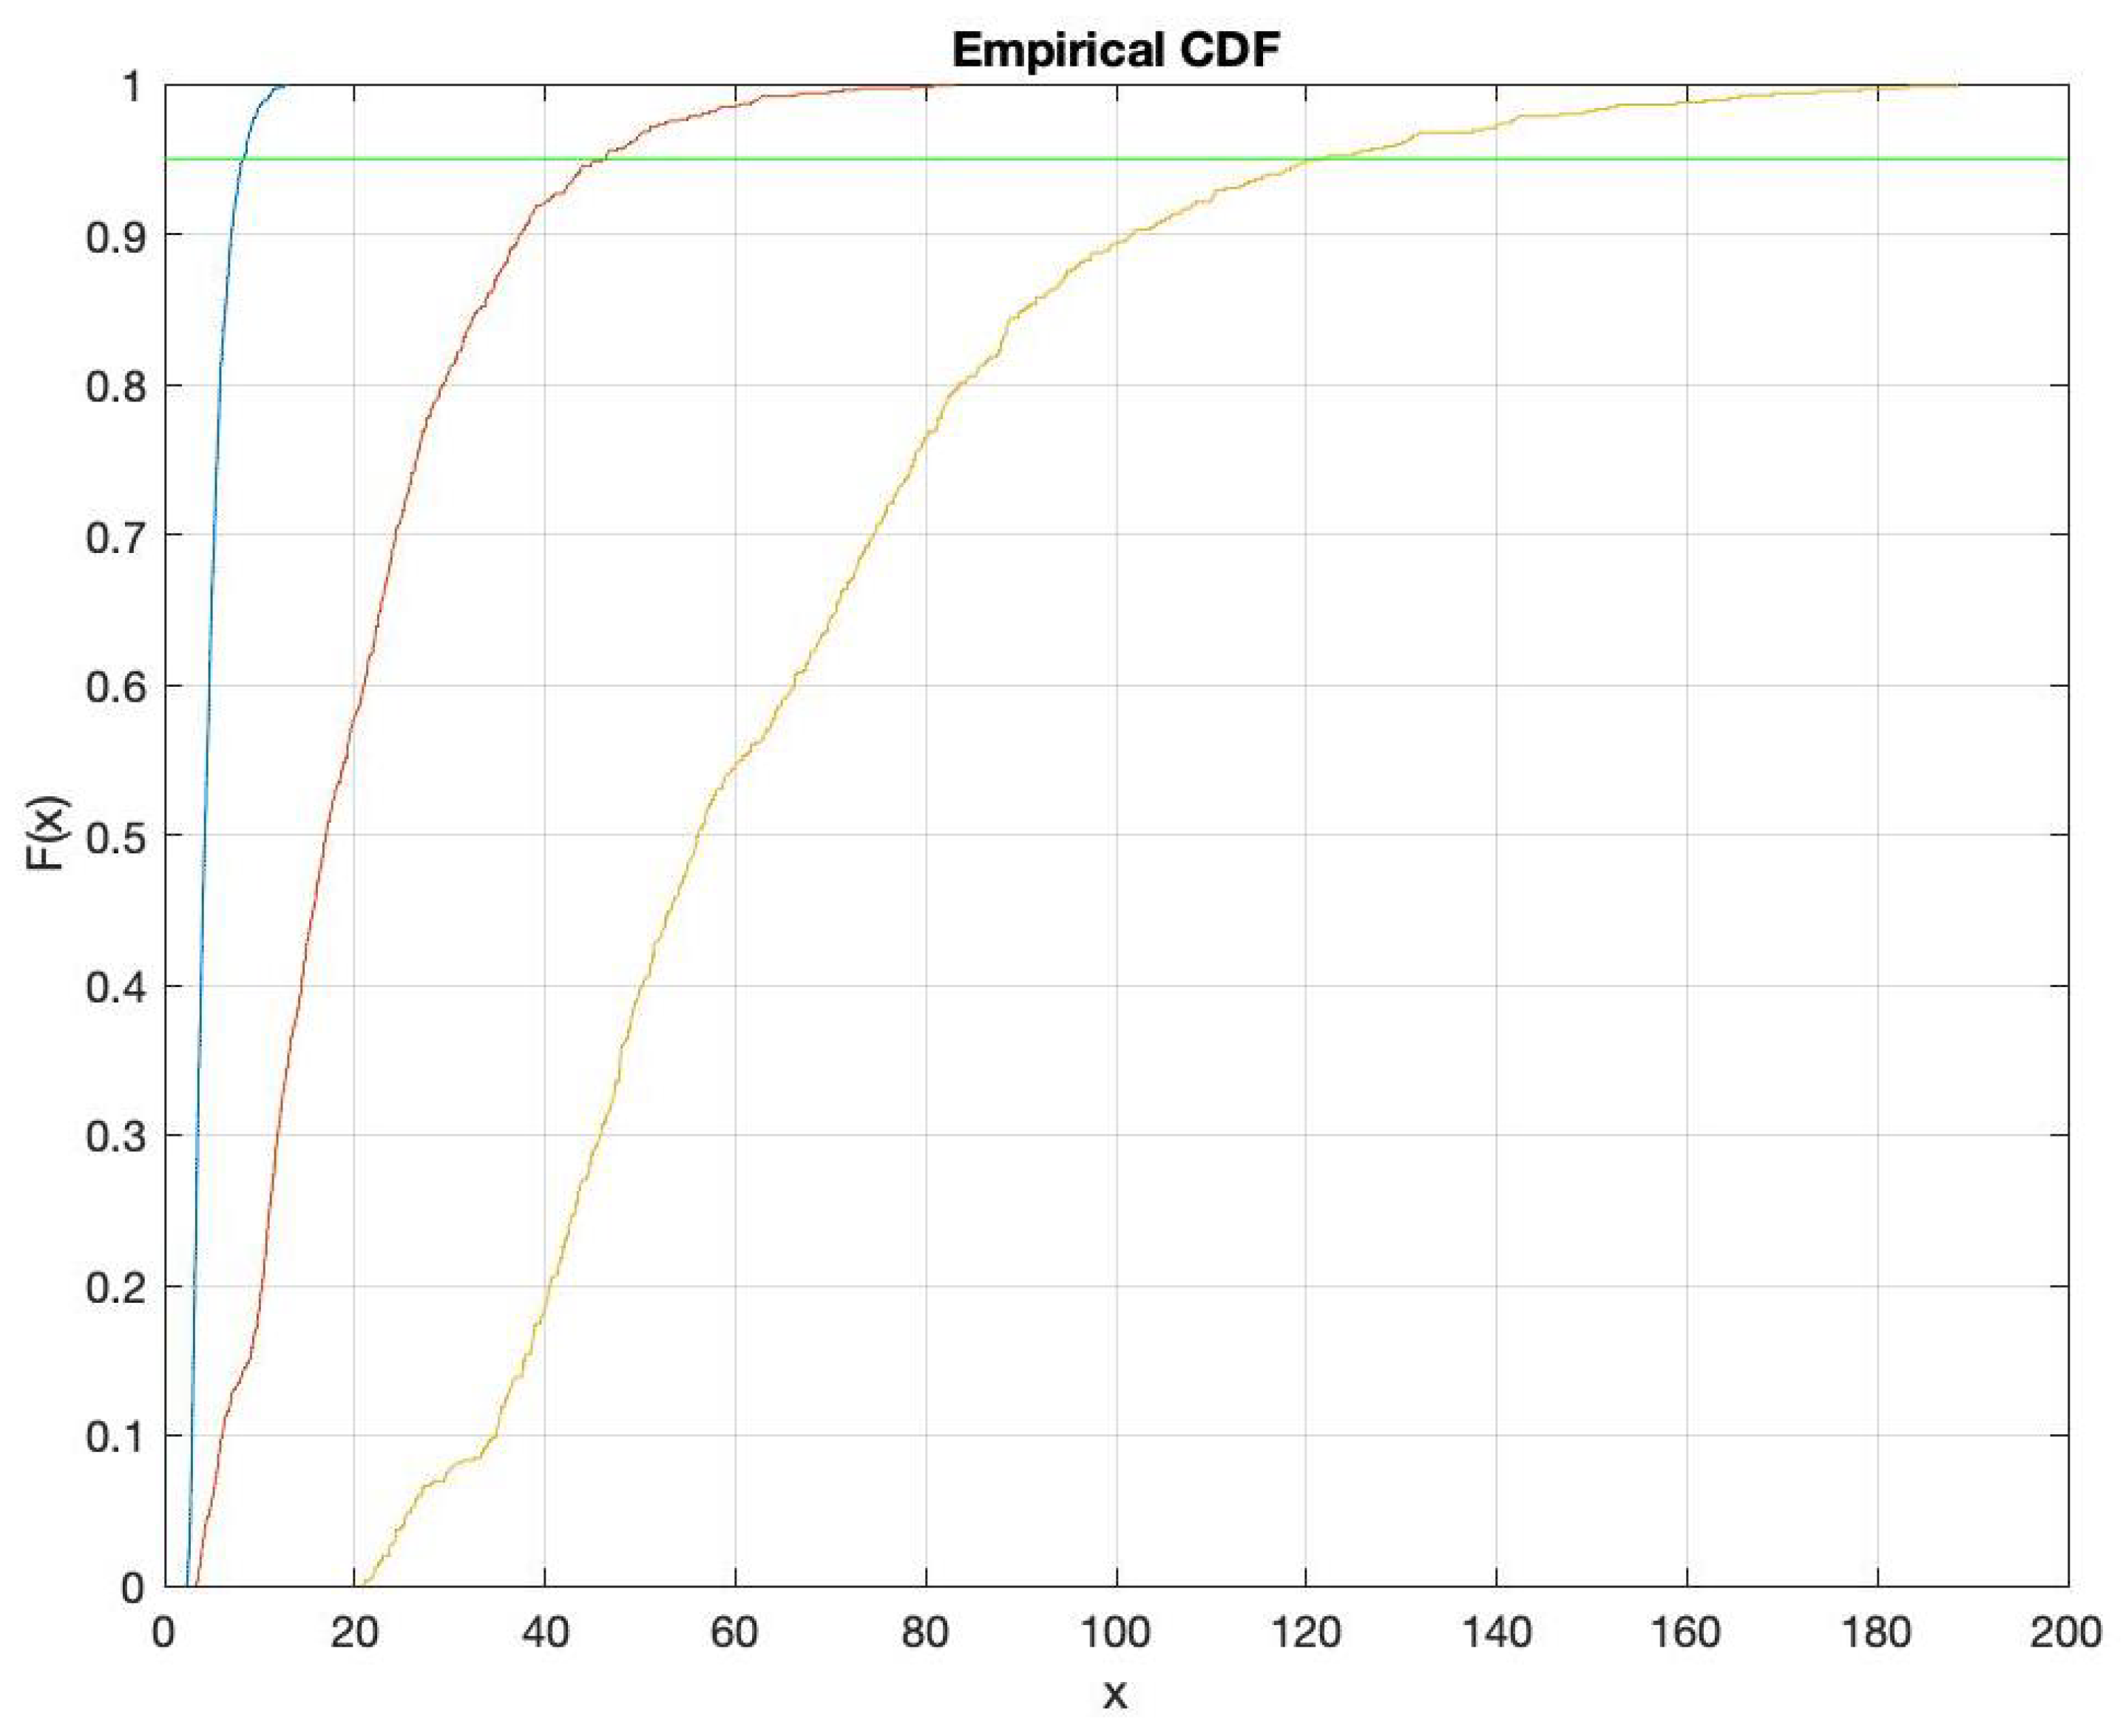
- For each angular range, evaluate the CDF of the aforementioned quantity; at the end of this step, we have the curves associated with the different angular ranges.
- 2.
- Calculations of useful parameters
- (a)
- Calculation of the number of subcarriers in the Resolution Bandwidth (RBW) of the Spectrum Analyzer:where is the numerology;
- (b)
- Calculation of the number of subcarriers of the 5G signal:where B is the bandwidth of the 5G signal;
- 3.
- Measurement
- (a)
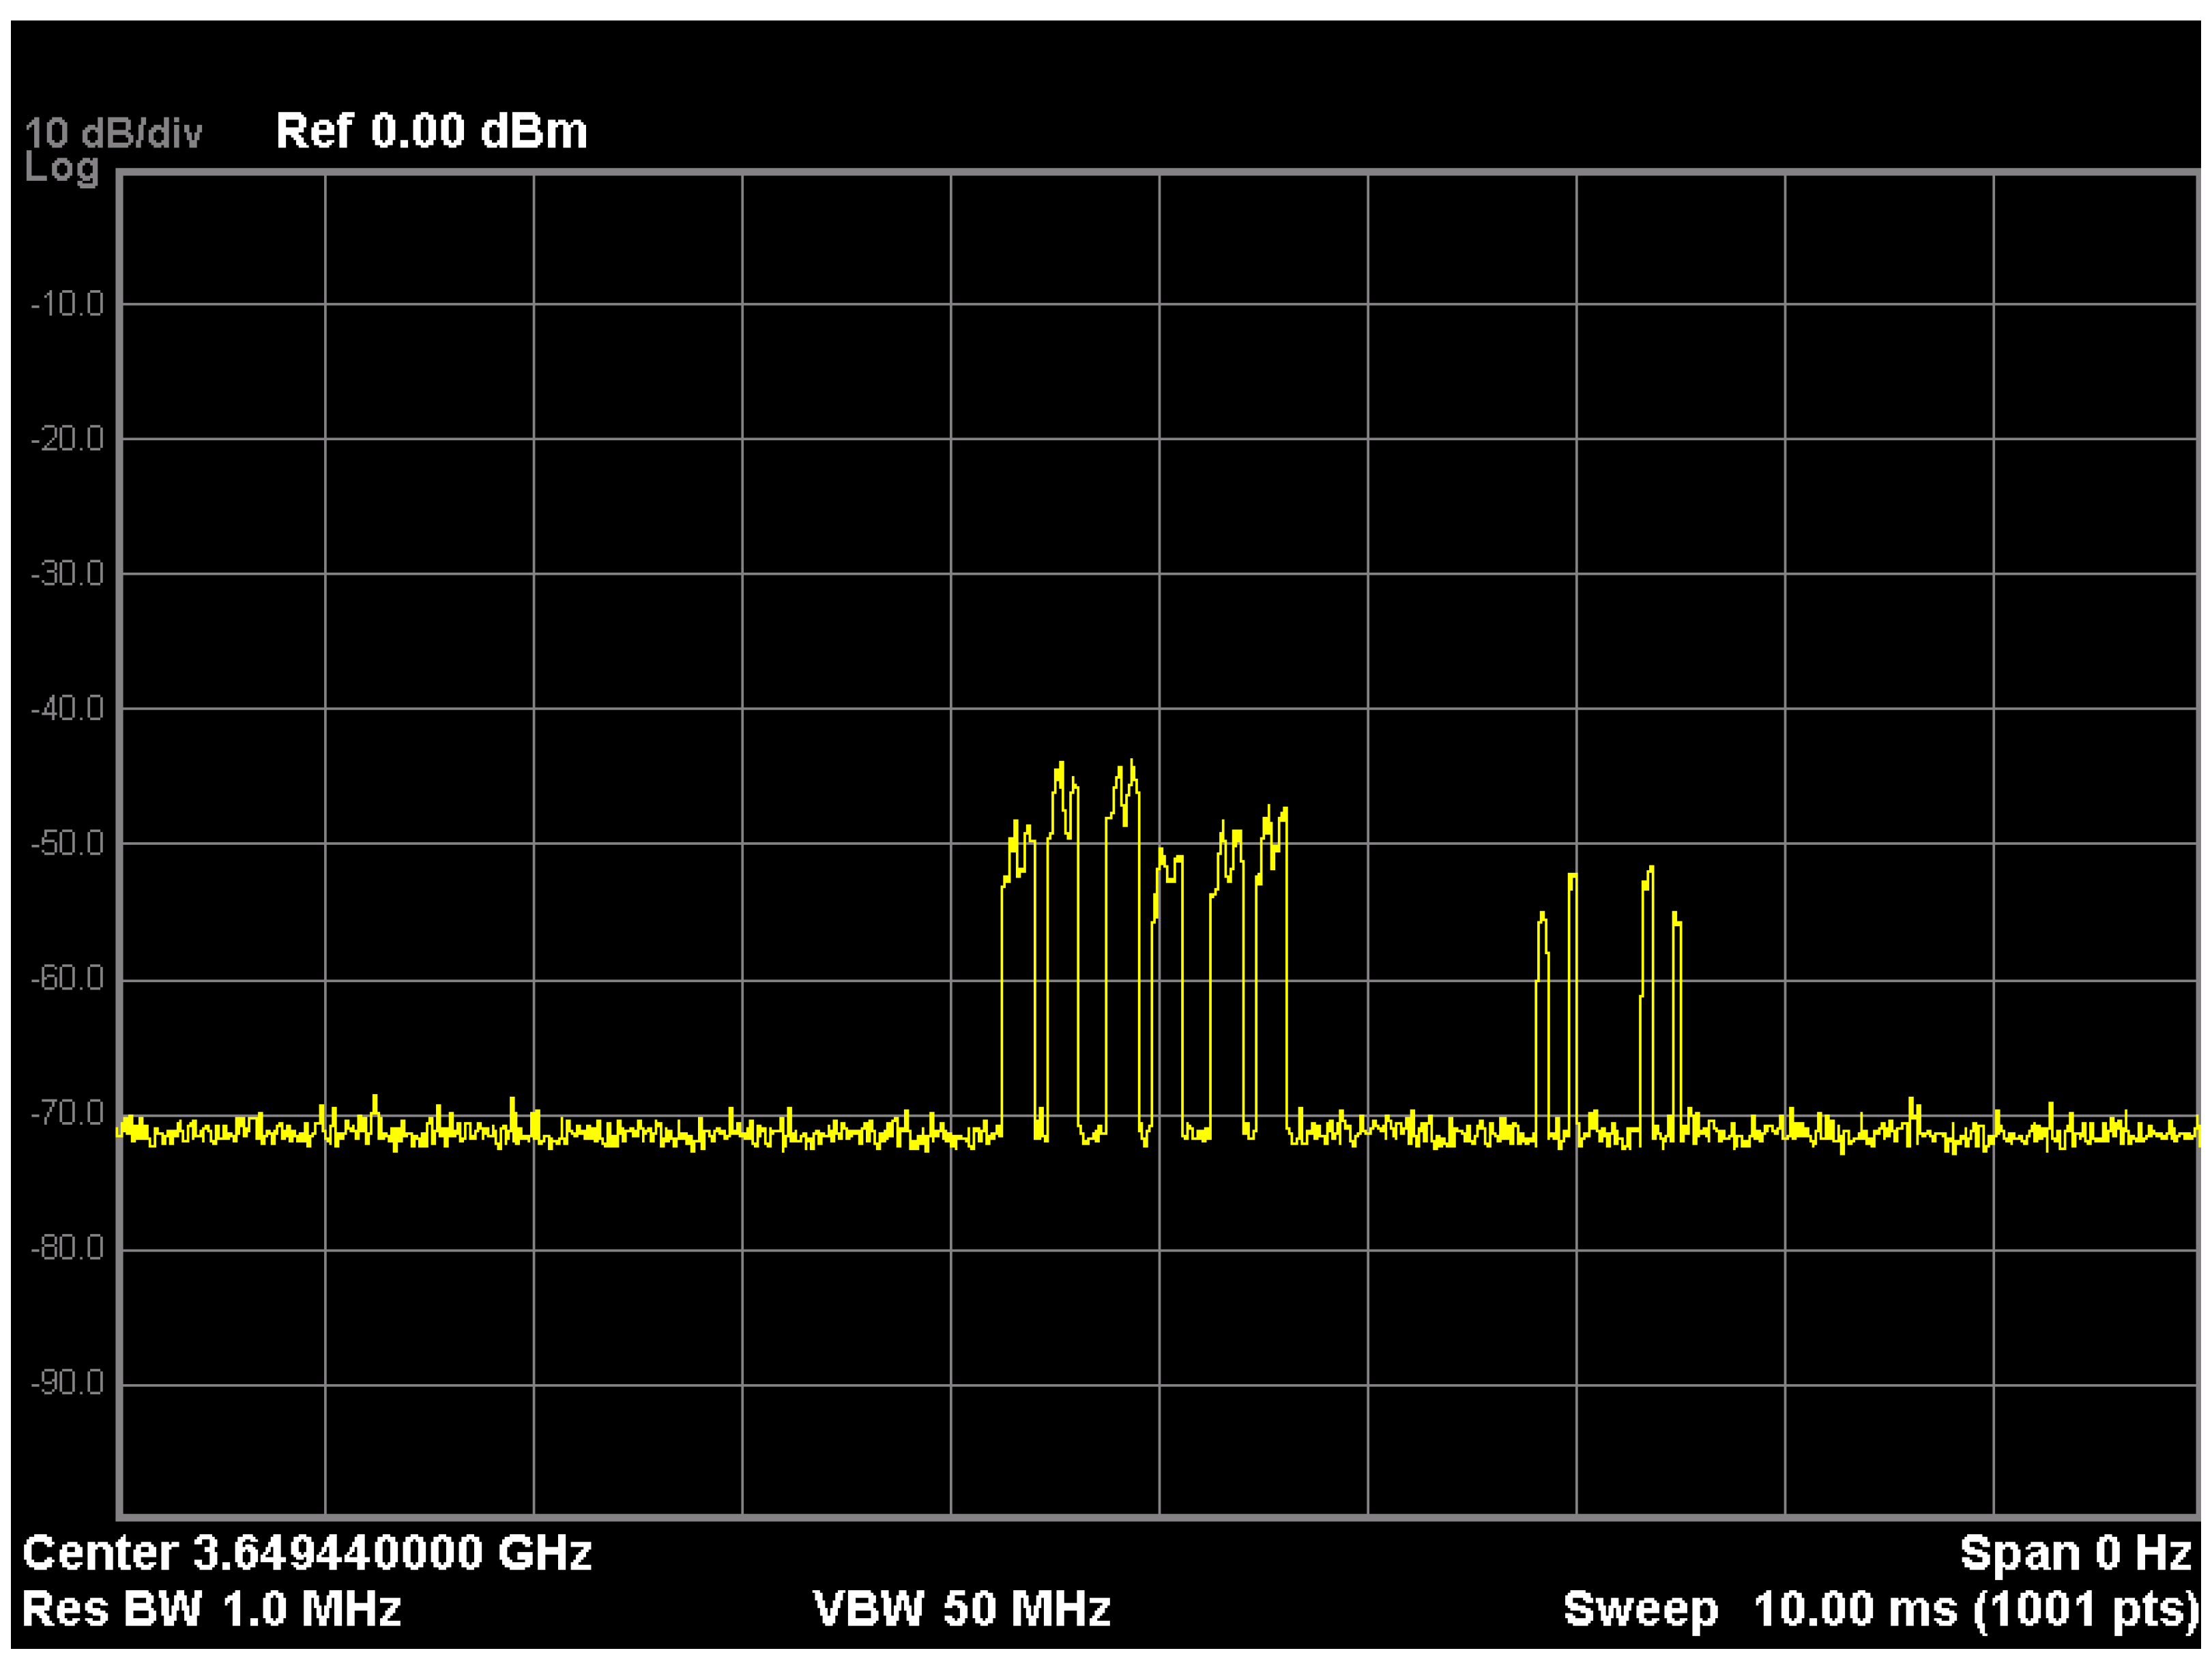
- Setting of the Spectrum Analyzer (SA). A description of the scalar spectrum analyzer setting for SSB power measurement is reported in [22,24]. The following setting is suggested: span zero mode, RMS detector, Max Hold mode, and central frequency of the SA equal to the central frequency of the SS-PBCH, RBW equal to 1 MHz.
- (b)
- Measurement: acquisition of the SSBs power level in zero-span mode and identification of the power level in dBm of the SSB with the highest power.
- 4.
- MPE estimation
- (a)
- Calculation of the power of a Resource Element associated with the SSB with the highest power as
- (b)
- Calculation of the field amplitude aswhere () is the input impedance of the instrument, is the power attenuation of the cable, and (1/m) is the Antenna Factor of the antenna connected to the measurement equipment;
- (c)
- Calculation of the maximum level in the measurement location considering the REs of the broadcast beamwherein is the power per RE of the signal used as a reference and transmitted along the broadcast beam, and is the maximum value of the field supposing a fully filled frame where all the REs are transmitted using a broadcast beam.
- (d)
- Identification of the angular range in which the measurement direction falls and the evaluation of associated with this angular range is at the desired probability ; let be such a value.
- (e)
- Evaluation of the maximum EMF level in the measurement location with probability, as
4. Experimental Validation of the Procedure
- Central frequency of the SSB: 3649.44 MHz;
- Bandwidth: MHz;
- Numerology: ;
- Duty cycle: .
- -
- Region A: ,
- -
- Region B: ,
- -
- Region C: ,
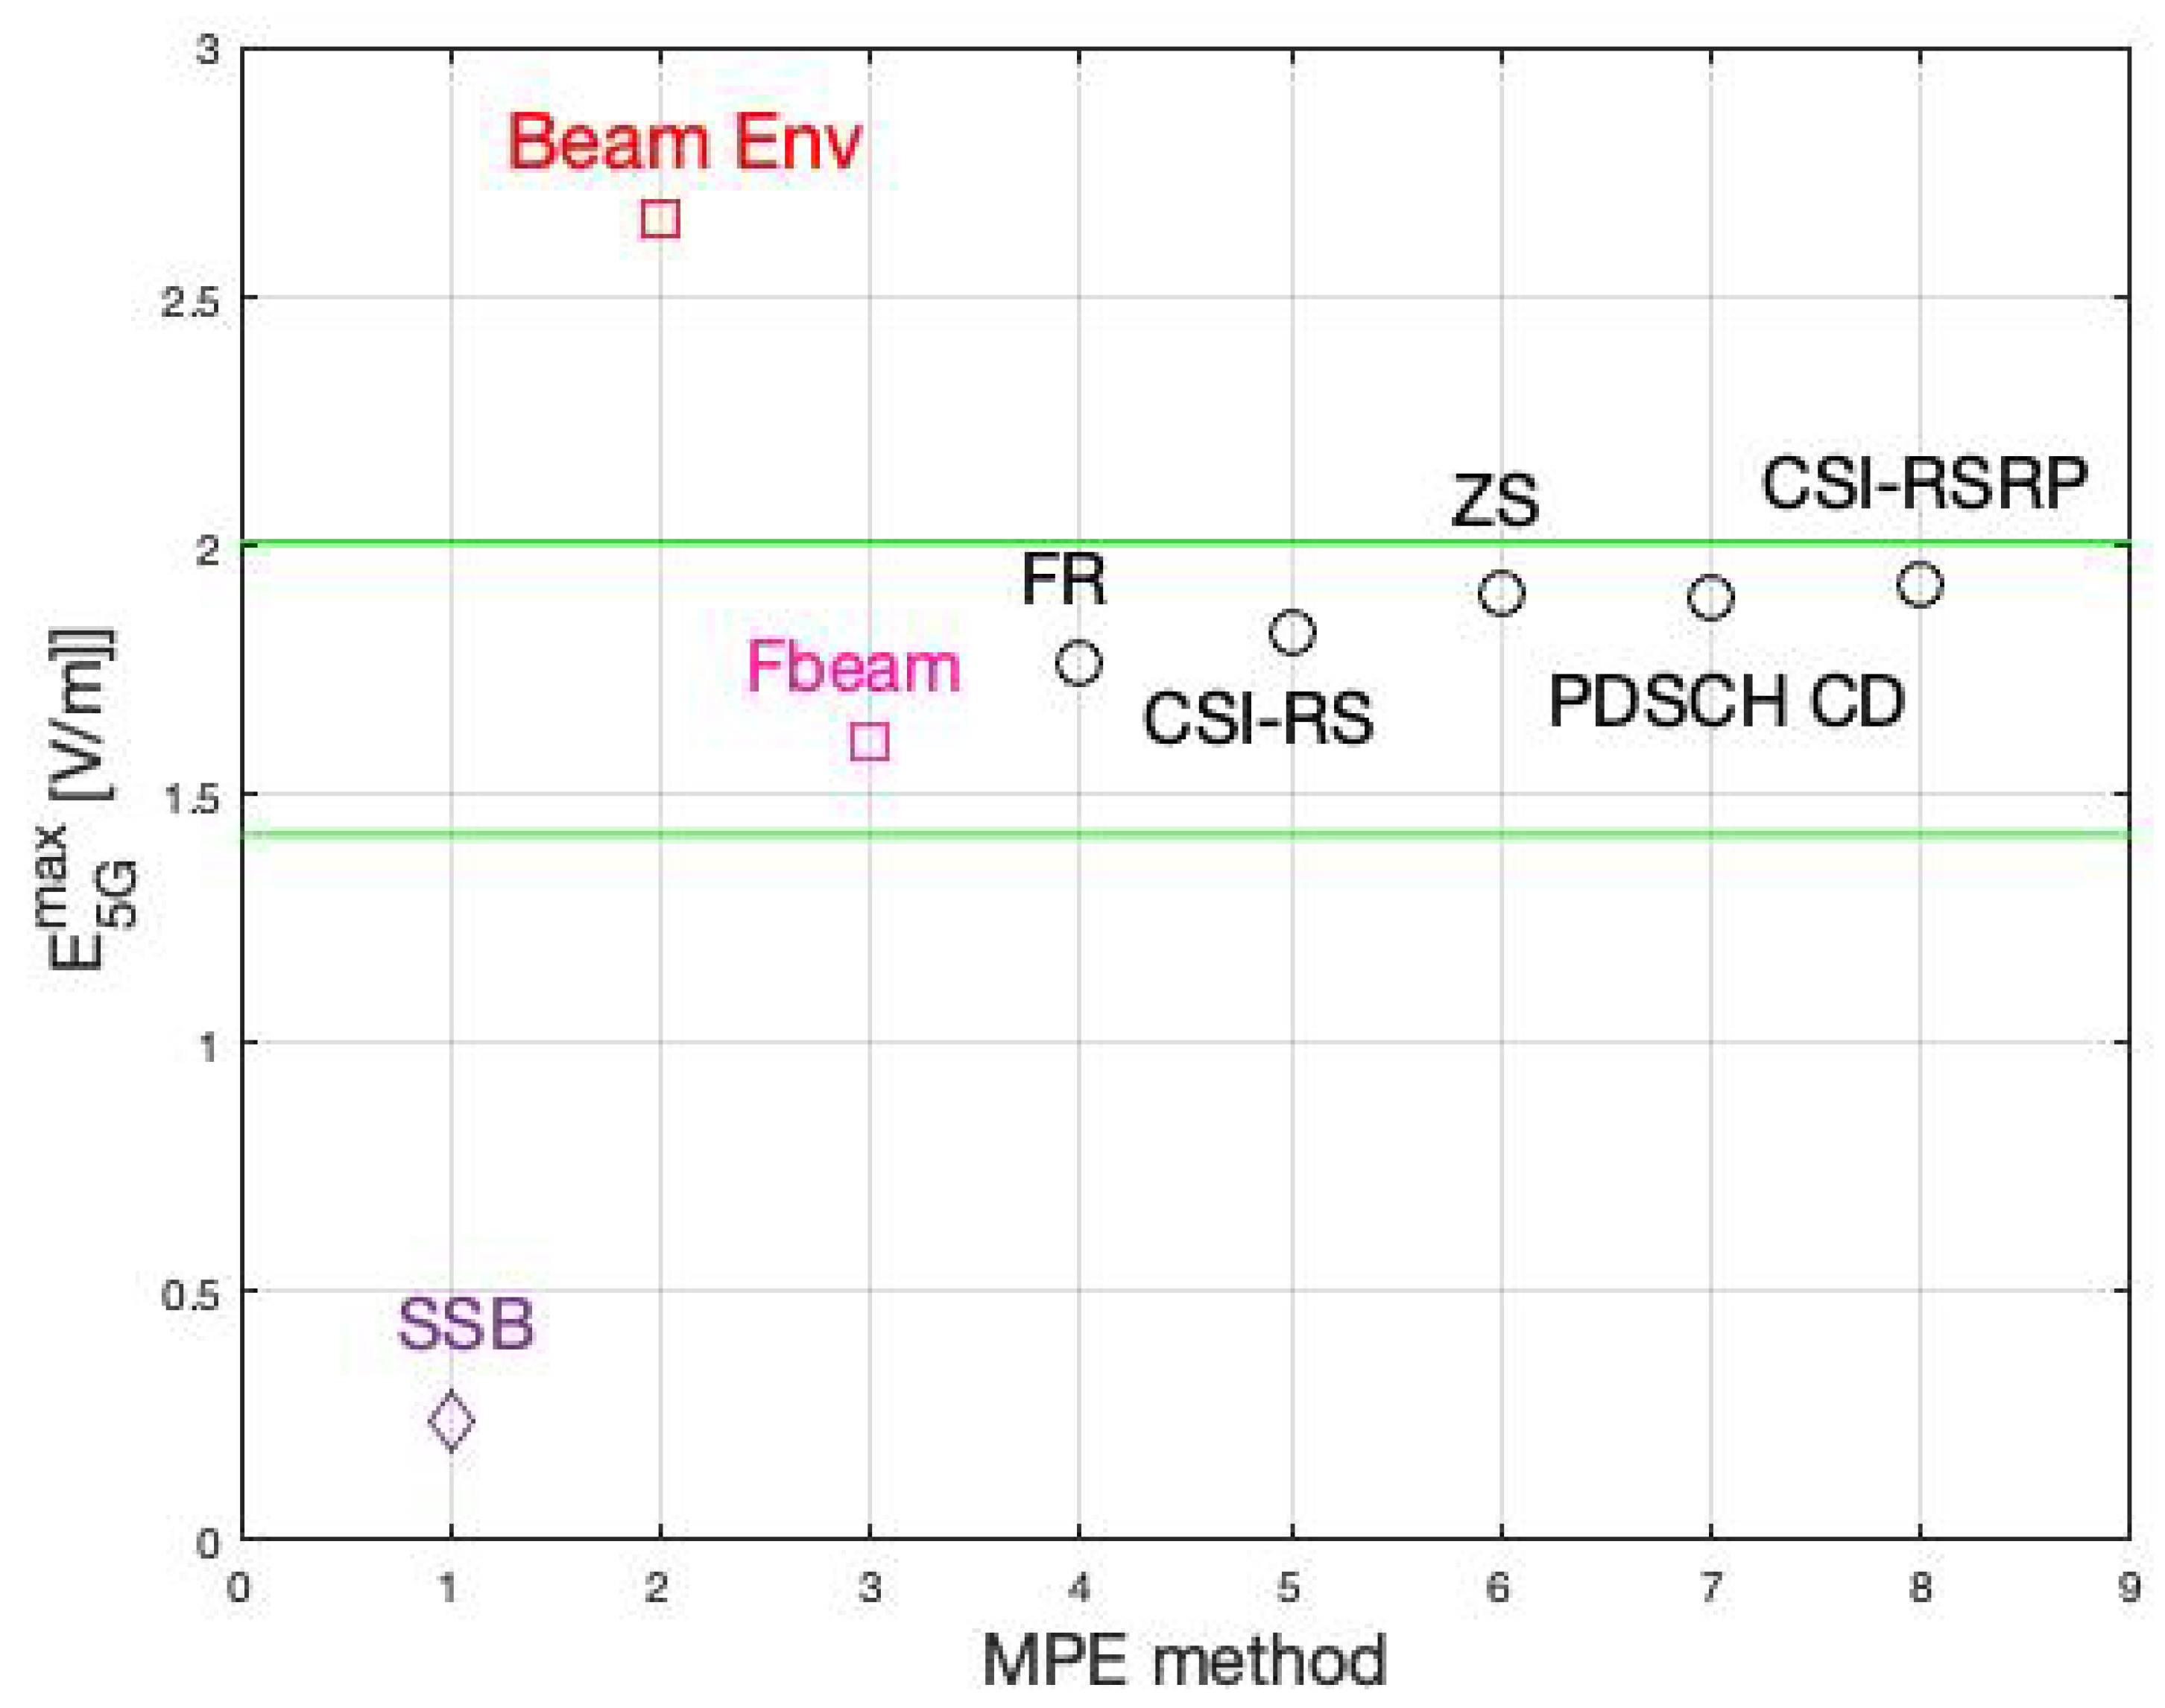
- SSB: MPE from SSB-related signals without correction;
- Beam Env: the method discussed in this paper, i.e., MPE from SSB-related signals corrected by that is statistically estimated from TERP and BERP using CDF;
- : MPE from SSB-related signals corrected by measured value [24];
- FR: field level estimated by summing the power of all the REs in the frame using data acquired by signal analyzer [26];
- CSI-RS: MPE from the power of the REs of the CSI-RS using data acquired with a signal analyzer [26];
- ZS: MPE from the power of the REs measured using a spectrum analyzer in zero-span mode [26];
- PDSCH CD: MPE from the power of the REs of the PDSCH directly measured in the Code Domain using the data acquired by a signal analyzer [26];
- CSI-RSRP: MPE reading the CSI-RSRP acquired using a signal analyzer or network scanner [26];
5. Estimation of a Realistic Value of the Field Level from the MPE Value
6. Conclusions
Author Contributions
Funding
Informed Consent Statement
Data Availability Statement
Acknowledgments
Conflicts of Interest
References
- Zaidi, A.; Athley, F.; Medbo, J.; Gustavsson, U.; Durisi, G.; Chen, X. 5G Physical Layer: Principles, Models and Technology Components; Academic Press: Cambridge, MA, USA, 2018. [Google Scholar]
- Ma, Z.; Zhang, Z.; Ding, Z.; Fan, P.; Li, H. Key techniques for 5G wireless communications: Network architecture, physical layer, and MAC layer perspectives. Sci. China Inf. Sci. 2015, 58, 041301:1–041301:20. [Google Scholar] [CrossRef]
- Medjahdi, Y.; Traverso, S.; Gerzaguet, R.; Shaiek, H.; Zayani, R.; Demmer, D.; Zakaria, R.; Doré, J.B.; Mabrouk, M.B.; Le Ruyet, D.; et al. On the road to 5G: Comparative study of physical layer in MTC context. IEEE Access 2017, 5, 26556–26581. [Google Scholar] [CrossRef]
- Abu-Rgheff, M.A. 5G Physical Layer Technologies; John Wiley & Sons: Hoboken, NJ, USA, 2019. [Google Scholar]
- Hong, W.; Jiang, Z.H.; Yu, C.; Zhou, J.; Chen, P.; Yu, Z.; Zhang, H.; Yang, B.; Pang, X.; Jiang, M.; et al. Multibeam antenna technologies for 5G wireless communications. IEEE Trans. Antennas Propag. 2017, 65, 6231–6249. [Google Scholar] [CrossRef]
- Fager, C.; Eriksson, T.; Barradas, F.; Hausmair, K.; Cunha, T.; Pedro, J.C. Linearity and efficiency in 5G transmitters: New techniques for analyzing efficiency, linearity, and linearization in a 5G active antenna transmitter context. IEEE Microw. Mag. 2019, 20, 35–49. [Google Scholar] [CrossRef]
- Pinchera, D.; Migliore, M.D.; Schettino, F. Optimizing antenna arrays for spatial multiplexing: Towards 6G systems. IEEE Access 2021, 9, 53276–53291. [Google Scholar] [CrossRef]
- Maldonado, G.; Maldonado, A.R.; Balderas, L.I.; Panduro, M.A. Time-Modulated Antenna Arrays for Ultra-Wideband 5G Applications. Micromachines 2022, 13, 2233. [Google Scholar] [CrossRef]
- Mumtaz, S.; Rodriguez, J.; Dai, L. MmWave Massive MIMO: A Paradigm for 5G; Academic Press: Cambridge, MA, USA, 2016. [Google Scholar]
- Prasad, K.S.V.; Hossain, E.; Bhargava, V.K. Energy efficiency in massive MIMO-based 5G networks: Opportunities and challenges. IEEE Wirel. Commun. 2017, 24, 86–94. [Google Scholar] [CrossRef]
- Chataut, R.; Akl, R. Massive MIMO systems for 5G and beyond networks—Overview, recent trends, challenges, and future research direction. Sensors 2020, 20, 2753. [Google Scholar] [CrossRef]
- Aslan, Y.; Puskely, J.; Janssen, J.; Geurts, M.; Roederer, A.; Yarovoy, A. Thermal-aware synthesis of 5G base station antenna arrays: An overview and a sparsity-based approach. IEEE Access 2018, 6, 58868–58882. [Google Scholar] [CrossRef]
- Anselmi, N.; Gottardi, G.; Rocca, P.; Oliveri, G.; Massa, A. Unconventional M-MIMO phased array design for 5G wireless systems. In Proceedings of the 2019 IEEE International Symposium on Phased Array System & Technology (PAST), Waltham, MA, USA, 15–18 October 2019; pp. 1–3. [Google Scholar]
- Buttazzoni, G.; Babich, F.; Vatta, F.; Comisso, M. Geometrical synthesis of sparse antenna arrays using compressive sensing for 5G IoT applications. Sensors 2020, 20, 350. [Google Scholar] [CrossRef]
- Pinchera, D.; Migliore, M.D.; Panariello, G. Isophoric inflating deflating exploration algorithm (i-idea) for equal-amplitude aperiodic arrays. IEEE Trans. Antennas Propag. 2022, 70, 10405–10416. [Google Scholar] [CrossRef]
- Lucido, M.; Schettino, F.; Migliore, M.D.; Pinchera, D.; Di Murro, F.; Panariello, G. Electromagnetic scattering by a zero-thickness PEC annular ring: A new highly efficient MoM solution. J. Electromagn. Waves Appl. 2017, 31, 405–416. [Google Scholar] [CrossRef]
- Lucido, M.; Schettino, F.; Panariello, G. Scattering from a thin resistive disk: A guaranteed fast convergence technique. IEEE Trans. Antennas Propag. 2021, 69, 387–396. [Google Scholar] [CrossRef]
- Dukhopelnykov, S.V.; Sauleau, R.; Nosich, A.I. Integral equation analysis of terahertz backscattering from circular dielectric rod With partial graphene cover. IEEE J. Quantum Electron. 2020, 56, 1–8. [Google Scholar] [CrossRef]
- Dukhopelnykov, S.V.; Lucido, M.; Sauleau, R.; Nosich, A.I. Circular dielectric rod with conformal strip of graphene as tunable terahertz antenna: Interplay of inverse electromagnetic jet, whispering gallery and plasmon effects. IEEE J. Sel. Top. Quantum Electron. 2021, 27, 1–8. [Google Scholar] [CrossRef]
- IEC 62232:2022; Determination of RF Field Strength, Power Density and SAR in the Vicinity of Radiocommunication Base Stations for the Purpose of Evaluating Human Exposure. IEC: Geneva, Switzerland, 2022.
- Pawlak, R.; Krawiec, P.; Żurek, J. On measuring electromagnetic fields in 5G technology. IEEE Access 2019, 7, 29826–29835. [Google Scholar] [CrossRef]
- Aerts, S.; Verloock, L.; Van Den Bossche, M.; Colombi, D.; Martens, L.; Törnevik, C.; Joseph, W. In-situ measurement methodology for the assessment of 5G NR Massive MIMO base station exposure at sub-6 GHz frequencies. IEEE Access 2019, 7, 184658–184667. [Google Scholar] [CrossRef]
- Keller, H. On the assessment of human exposure to electromagnetic fields transmitted by 5G NR base stations. Health Phys. 2019, 117, 541–545. [Google Scholar] [CrossRef]
- Adda, S.; Aureli, T.; D’Elia, S.; Franci, D.; Grillo, E.; Migliore, M.D.; Pavoncello, S.; Schettino, F.; Suman, R. A Theoretical and Experimental Investigation on the Measurement of the Electromagnetic Field Level Radiated by 5G Base Stations. IEEE Access 2020, 8, 101448–101463. [Google Scholar] [CrossRef]
- Aerts, S.; Deprez, K.; Colombi, D.; Van den Bossche, M.; Verloock, L.; Martens, L.; Törnevik, C.; Joseph, W. In Situ Assessment of 5G NR Massive MIMO Base Station Exposure in a Commercial Network in Bern, Switzerland. Appl. Sci. 2021, 11, 3592. [Google Scholar] [CrossRef]
- Migliore, M.D.; Franci, D.; Pavoncello, S.; Grillo, E.; Aureli, T.; Adda, S.; Suman, R.; D’Elia, S.; Schettino, F. A New Paradigm in 5G Maximum Power Extrapolation for Human Exposure Assessment: Forcing gNB Traffic Toward the Measurement Equipment. IEEE Access 2021, 9, 101946–101958. [Google Scholar] [CrossRef]
- Kopacz, T.; Schießl, S.; Schiffarth, A.M.; Heberling, D. Effective SSB Beam Radiation Pattern for RF-EMF Maximum Exposure Assessment to 5G Base Stations Using Massive MIMO Antennas. In Proceedings of the 2021 15th European Conference on Antennas and Propagation (EuCAP), Dusseldorf, Germany, 22–26 March 2021; pp. 1–5. [Google Scholar]
- Lee, A.K.; Jeon, S.B.; Choi, H.D. EMF Levels in 5G New Radio Environment in Seoul, Korea. IEEE Access 2021, 9, 19716–19722. [Google Scholar] [CrossRef]
- Jiang, T.; Skrivervik, A.K. Assessment of the Electromagnetic Field Exposure due to 5G Base Stations using a Monte-Carlo Method: Initial Results. In Proceedings of the 2021 15th European Conference on Antennas and Propagation (EuCAP), Dusseldorf, Germany, 22–26 March 2021; pp. 1–4. [Google Scholar]
- Bornkessel, C.; Kopacz, T.; Schiffarth, A.M.; Heberling, D.; Hein, M.A. Determination of Instantaneous and Maximal Human Exposure to 5G Massive-MIMO Base Stations. In Proceedings of the 2021 15th European Conference on Antennas and Propagation (EuCAP), Dusseldorf, Germany, 22–26 March 2021; pp. 1–5. [Google Scholar]
- Adda, S.; Aureli, T.; Bastonero, S.; D’Elia, S.; Franci, D.; Grillo, E.; Migliore, M.D.; Pasquino, N.; Pavoncello, S.; Schettino, F.; et al. Methodology Based on Vector and Scalar Measurement of Traffic Channel Power Levels to Assess Maximum Exposure to Electromagnetic Radiation Generated by 5G NR Systems. IEEE Access 2022, 10, 12125–12136. [Google Scholar] [CrossRef]
- Migliore, M.D.; Franci, D.; Pavoncello, S.; Aureli, T.; Merli, E.; Lodovisi, C.; Chiaraviglio, L.; Schettino, F. Application of the Maximum Power Extrapolation Procedure for Human Exposure Assessment to 5G Millimeter Waves: Challenges and Possible Solutions. IEEE Access 2022, 10, 103438–103446. [Google Scholar] [CrossRef]
- Alliance, N. Recommendation on Base Station Active Antenna System Standards. 2021. Available online: https://www.ngmn.org/publications/basta-active-antenna-systems-v1-0.html (accessed on 10 February 2023).
- Asplund, H.; Astely, D.; von Butovitsch, P.; Chapman, T.; Frenne, M.; Ghasemzadeh, F.; Hagström, M.; Hogan, B.; Jöngren, G.; Karlsson, J.; et al. Advanced Antenna Systems for 5G Network Deployments: Bridging the Gap between Theory and Practice; Academic Press: Cambridge, MA, USA, 2020. [Google Scholar]
- Paul, C.R. Introduction to Electromagnetic Compatibility; John Wiley & Sons: Hoboken, NJ, USA, 2006; Volume 184. [Google Scholar]
- WEB Site. Available online: https://sites.google.com/unicas.it/electromagnetic-information/home (accessed on 1 March 2021).
- 3GPP. Radio Transmission and Reception (Release 15), 3GPP Technical Specification Group Radio Access Network. NR, TS 38.104, V15.5.0, May 2019. Available online: https://www.etsi.org/deliver/etsi_ts/138100_138199/138104/15.05.00_60/ts_138104v150500p.pdf (accessed on 1 March 2023).
- International Commission on Non-Ionizing Radiation Protection. Guidelines for limiting exposure to Electromagnetic Fields (100 kHz to 300 GHz). Health Phys. 2020, 118, 483–524. [Google Scholar] [CrossRef] [PubMed]
- Baracca, P.; Weber, A.; Wild, T.; Grangeat, C. A statistical approach for RF exposure compliance boundary assessment in massive MIMO systems. In Proceedings of the WSA 2018; 22nd International ITG Workshop on Smart Antennas, Bochum, Germany, 14–16 March 2018; pp. 1–6. [Google Scholar]
- Colombi, D.; Joshi, P.; Xu, B.; Ghasemifard, F.; Narasaraju, V.; Törnevik, C. Analysis of the Actual Power and EMF Exposure from Base Stations in a Commercial 5G Network. Appl. Sci. 2020, 10, 5280. [Google Scholar] [CrossRef]
- Pinchera, D.; Migliore, M.D.; Schettino, F. Compliance Boundaries in 5G Communication Systems: A Statistical Approach. IEEE Access 2020, 1, 620–628. [Google Scholar]
- Schiavoni, A.; Bastonero, S.; Lanzo, R.; Scotti, R. Methodology for electromagnetic field exposure assessment of 5G massive MIMO antennas accounting for spatial variability of radiated power. IEEE Access 2022, 10, 70572–70580. [Google Scholar] [CrossRef]
- Migliore, M.D.; Schettino, F. Power Reduction Estimation of 5G Active Antenna Systems for Human Exposure Assessment in Realistic Scenarios. IEEE Access 2020, 8, 220095–220107. [Google Scholar] [CrossRef]
- IEC 62669:2019; Case Studies Supporting IEC 62232—Determination of RF Field Strength, Power Density and SAR in the Vicinity of Radiocommunication Base Stations for the Purpose of Evaluating Human Exposure. IEC: Geneva, Switzerland, 2019.


Disclaimer/Publisher’s Note: The statements, opinions and data contained in all publications are solely those of the individual author(s) and contributor(s) and not of MDPI and/or the editor(s). MDPI and/or the editor(s) disclaim responsibility for any injury to people or property resulting from any ideas, methods, instructions or products referred to in the content. |
© 2023 by the authors. Licensee MDPI, Basel, Switzerland. This article is an open access article distributed under the terms and conditions of the Creative Commons Attribution (CC BY) license (https://creativecommons.org/licenses/by/4.0/).
Share and Cite
Schettino, F.; Chirico, G.; D’Elia, C.; Lucido, M.; Pinchera, D.; Migliore, M.D. A Simple and Low-Cost Technique for 5G Conservative Human Exposure Assessment. Appl. Sci. 2023, 13, 3524. https://doi.org/10.3390/app13063524
Schettino F, Chirico G, D’Elia C, Lucido M, Pinchera D, Migliore MD. A Simple and Low-Cost Technique for 5G Conservative Human Exposure Assessment. Applied Sciences. 2023; 13(6):3524. https://doi.org/10.3390/app13063524
Chicago/Turabian StyleSchettino, Fulvio, Gaetano Chirico, Ciro D’Elia, Mario Lucido, Daniele Pinchera, and Marco Donald Migliore. 2023. "A Simple and Low-Cost Technique for 5G Conservative Human Exposure Assessment" Applied Sciences 13, no. 6: 3524. https://doi.org/10.3390/app13063524
APA StyleSchettino, F., Chirico, G., D’Elia, C., Lucido, M., Pinchera, D., & Migliore, M. D. (2023). A Simple and Low-Cost Technique for 5G Conservative Human Exposure Assessment. Applied Sciences, 13(6), 3524. https://doi.org/10.3390/app13063524