Article

Radio Link Model for Node Deployment in Underground Mine Sensor Networks

1
Department of Electrical and Computer Engineering, Air University, Islamabad 44000, Pakistan
2
School of Engineering, Faculty of Science and Engineering, Macquarie University, Sydney, NSW 2109, Australia
3
CoNNekT Lab, National University of Sciences and Technology (NUST), Islamabad 44000, Pakistan
4
School of Science and Engineering, Lahore University of Management Sciences (LUMS), Lahore 54792, Pakistan
*
Authors to whom correspondence should be addressed.
Appl. Sci. 2023, 13(15), 8987; https://doi.org/10.3390/app13158987
Submission received: 8 June 2023 / Revised: 1 August 2023 / Accepted: 2 August 2023 / Published: 5 August 2023

Abstract

:
This paper presents an experimental characterization of the proposed radio link model for an underground mine sensor network. Power efficiency and range are critical factors to consider when designing a wireless sensor network, particularly for low data rate applications where the goal is to have a long-lasting, low-maintenance network. A ‘deploy and forget’ strategy is desirable because it allows the network to operate autonomously without requiring frequent maintenance or intervention from network operators. DASH7 and IEEE 802.15.4f are both excellent choices for low-power, long-range wireless sensor networking applications. The proposed radio link model was developed and evaluated for 433 MHz DASH7 in underground mines, considering the practical electromagnetic properties of mine walls and the propagation medium, which helps in calculating accurate signal characteristics. Radio wave propagation is a critical factor that needs to be considered when designing a wireless sensor network for complex mine structures. The received signal strength indicator (RSSI) and packet error rate (PER) are two key parameters that are used to measure wave propagation and assess the quality of the radio link between sensor nodes. The radio link design has been optimized for complex mine structures by utilizing these parameters in a model, leading to improved performance and reliability. The measurements were carried out in the world’s second largest salt mine at Khewra, Pakistan, with representative irregular mine structures. The RSSI and PER were measured at different node positions and with variable separation between the nodes. The proposed model allows for the easy placement of nodes on either the rooftop or near the side walls of the mine corridors, with an average variation of 6% in RSSI and 1.9% in PER. The proposed model was validated using off-the-shelf wizzi sensor nodes received from Wizzi Lab, France, and was programmed to measure RSSI and PER while operating under the 433 MHz DASH7 protocol. An agreement between modeled and measured parameters has been noted, making the proposed model a decent method for efficient node deployment in underground mine sensor networks.

1. Introduction

Radio wave propagation in underground tunnels and mines has been studied extensively over the last few decades. Radio wave signal strength naturally decreases when the propagation distance increases [1,2,3]. For underground mines, the spatial structure is more complex than the above-ground scenario, which makes the phenomena of multi-path and propagation loss more prevalent [2,3]. An extensive literature review revealed the lack of a linear relationship between radio wave attenuation and node placement in mines due to reflection from the walls and diffraction produced by lossy minerals [4,5,6]. In [7], a theoretical model was proposed to describe radio wave propagation in straight rectangular tunnels. Additionally, ref. [8] reported on the typical structures of underground mines and road tunnels. The multi-mode model proposed in [8] suggests that node positioning should be kept in the middle of the tunnel cross-section in order to achieve the best possible performance. It is also reported that the behavior of radio waves in the presence of lossy walls needs to be modeled more precisely and analytically so that optimal node position and separation between the nodes can be predicted accurately [9,10]. It is necessary to understand the mine environment and to derive a radio propagation link model for node deployment in an underground mine sensor network. This will help the radio link designers to estimate the underground communication range and efficient positioning of sensor nodes. In a mine environment, radio waves can be absorbed or reflected by lossy mine walls, metal objects, and the gaseous environment, leading to attenuation and multi-path fading [9]. For example, the lossy mine walls can cause significant attenuation of the radio signal, particularly at higher frequencies. Metal objects, such as mining equipment and vehicles, can also cause reflection and scattering of the radio waves, leading to interference and signal distortion. The gaseous environment in mines can also affect radio propagation. The presence of gases, such as methane and carbon monoxide, can absorb or scatter radio waves, leading to attenuation and fading. The humidity and temperature of the mine environment can also affect the dielectric properties of the medium and alter the propagation of radio waves. To account for these factors, the radio propagation model needs to be re-evaluated using appropriate techniques and tools, such as ray tracing, electromagnetic simulations, or measurements. To the best of the authors’ knowledge, the available radio propagation models could not determine the node position and node separation for underground mines when considering real-time measured data and experimental characterization. Owing to a higher path loss at GHz frequencies, the range of Zigbee and Bluetooth transceivers is quite limited, which is why the proposed radio model experiments were carried out on off-the-shelf wizzi sensor motes operating at 433 MHz with DASH7 [3,11]. Recently, 433 MHz technologies have recaptured the attention of researchers as a substitute for 868/915 MHz and 2.4 GHz bands. Currently, there are two physical layer standards available at 433 MHz, namely, DASH7 Mode 2 [11] and IEEE 802.15.4f [12]. Besides that, the 433 MHz band has relatively good propagation features due to its lower frequency; it is less crowded compared to the 2.4 GHz band and bears fewer external interferences [2]. Prior to this study, to the best of our knowledge, there has been no characterization of salt mines at 433 MHz in complex structural scenarios. In the literature, high-gain electrical dipole antennas have been used, which increase the separation range but are only effective for the middle node position [13,14]. Quarter-wavelength monopole antennas with omnidirectional radiation patterns and 3 dBi gain were used for the experiments in this study. Table 1 lists the key parameters of similar wireless technologies [15,16,17], such as operating frequency, range, data rate, power consumption, and other features of each technology side-by-side for ease of reference in subsequent sections.
This paper presents a radio link model for underground mines, where the electromagnetic properties of mine walls and other lossy objects have been incorporated together with various underground mine structures. The wave propagation and polarization issues related to optimal node position, coverage range, and antenna orientation have been formulated and addressed in the proposed radio link model. After conducting continuous field experiments over a duration of 3 weeks in the Khewra salt mine, we confirmed that the sensor node can be deployed on either the rooftop or near the side wall of the mine using an Omni directional monopole antenna. A standard transmit power of 12.6 dBm was used in all the experiments. In Section 2, we present the proposed radio propagation model for the tunnel and room–pillar environments of an underground mine. In Section 3, we describe the experimental setup in the salt mine, present the validation of the proposed model, and discuss the results, along with an outline of the theoretical approach used for determining node position and node separation in the mine environment. Section 4 presents an application-based evaluation of the proposed radio link model in a salt mine, and Section 5 concludes the paper.

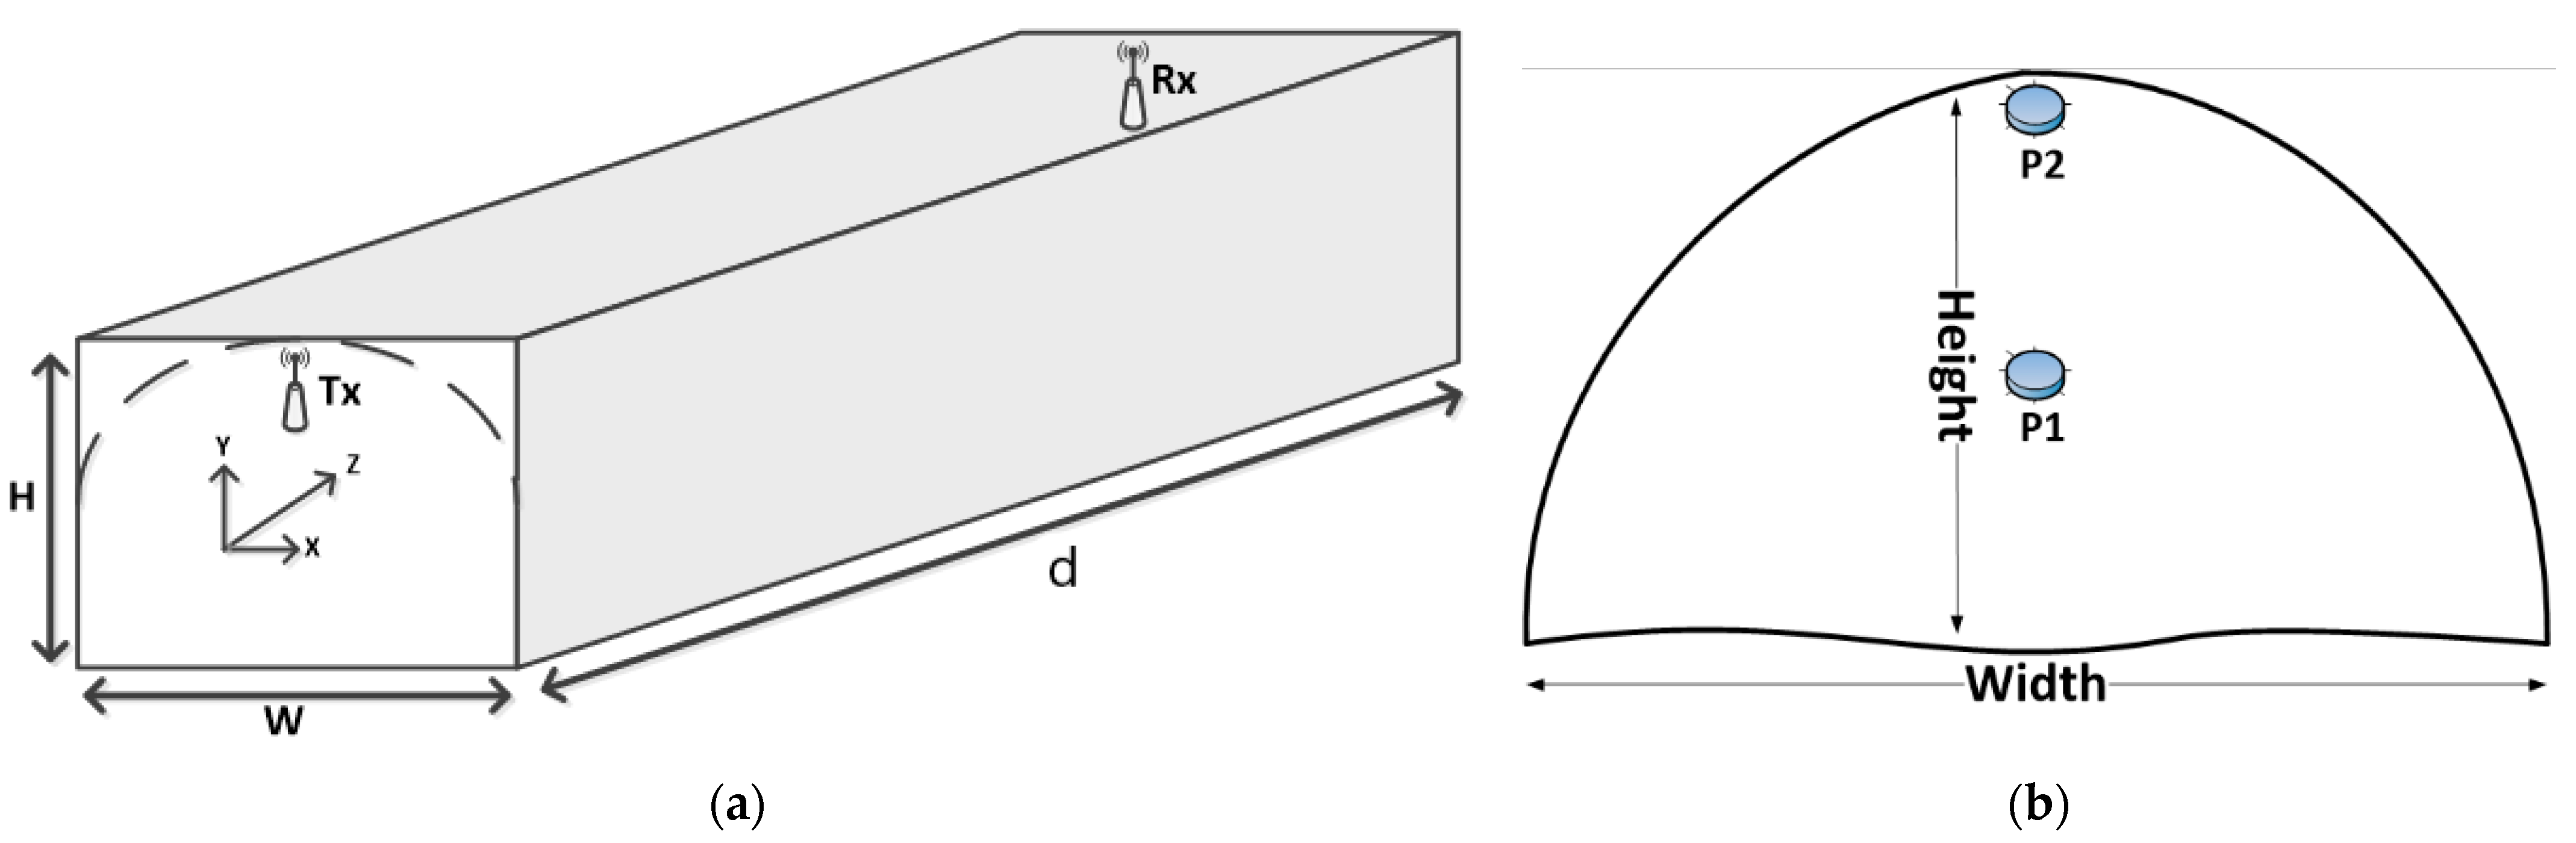
2. Proposed Radio Link Model for Underground Mines

An important aspect of underground propagation is the hypothesis that, at the UHF band, the wavelength becomes comparable to mine dimensions, and the mine acts as a waveguide, allowing the low-loss propagation of EM waves [2]. Waveguides have characteristic cut-off frequencies, below which EM waves cannot propagate. Frequencies that are above the cut-off can propagate via multiple bounces off the walls, though at the expense of reflection path losses [18,19]. The loss increases at higher frequencies, which is why 433 MHz-based devices have been used for experiments within the proposed study for low data rates and high-range applications. The prior studies contain propagation measurements at the 433 MHz band conducted in various environments, such as underground to underground and underground to above-ground communication, but not in underground mine environments [1,2,4,5,12]. Prior research does not contain radio models for different cross-sections of underground mines and tunnels in different structural layouts [18,19].
It is very important to precisely and analytically analyze the behavior of radio waves in the presence of lossy walls so that the optimal separation distance between nodes and radio propagation zones can be estimated accurately. It is necessary to understand the mine environment and re-derive the path loss equations for wireless mine sensor networks which help communication engineers to estimate underground communication range and signal characteristics. The proposed model considers tunnel environments with different mine cross-sections, particularly cross-sections lower than 2 × 2 m2, due to the availability of operational mines in Pakistan for practical experiments.

2.1. Path Loss Model

It is always essential to consider the actual shape of the tunnel cross-sections when designing a wireless sensor network for underground mines. These cross-sections may not always have perfectly rectangular or circular shapes and can often have irregular or complex geometries. A Cartesian coordinate system is utilized to simplify the analysis and design process, with its origin located at the center of the tunnel cross-section. This approach allows the representation of the tunnel geometry in a two-dimensional space, making it easier to position sensor nodes and antennas. The proposed model considers lossy materials and irregular cross-sections in the mine, as shown in Figure 1. The Fresnel zones are important in determining the level of signal attenuation or loss as a signal travels from a transmitter (Tx) to a receiver (Rx). The first Fresnel zone is assumed to be relatively small and is represented by an ellipsoid-shaped region around the direct line of sight between the Tx and Rx, ensuring that most of the transmitted signal energy propagates through the mine tunnel. Equation (1) calculates the free space path loss in the underground mine environment [2].
L F S = 20 log 10 ( | H r H t | ) + 20 log ( f o ) 184.85
where Hr and Ht are the Tx and Rx antenna heights from the ground. At lower frequencies, the size of the Fresnel zones is typically smaller, and the angles of incidence between the wave and the walls of the tunnel are also smaller, resulting in relatively low attenuation of the reflected waves. The reflected waves from the tunnel walls contribute significantly to the received power where the size of the Fresnel zones is small because they travel a shorter distance than the direct wave, resulting in less attenuation. This region near the Tx, where the reflected waves are significant, is considered the multi-mode propagation zone. LM represents the mining loss, which includes different losses experienced in mines, such as tilt angle loss caused by any bend in the mine pathway, roughness loss due to the irregular surface or roughness of mine walls, and obstacle loss resulting from obstacles, such as vehicles or carts, and human movement in the mine that obstruct the propagation of waves. The LM can be defined as follows:
L M = L t i l t + L r o u g h n e s s + L o b s t a c l e
The tilt angle loss is calculated as follows:
L M = 4.343 π 2 θ 2 d λ
where Ɵ is the tilt angle, which is an attenuation factor assumed to be greater than 90° for separation distances above 5 m. Similarly, roughness loss is calculated as follows:
L r o u g h n e s s = 4.343 π 2 h r 2 λ 1 w 4 + 1 h 4 d
where hr is the roughness of the mine walls and is normally considered to be 400 mm2 [3]. Similarly, Lobstacle is calculated as follows:
L o b s t a c l e = i = 1 n x i β i i 1
In the above equation, the accumulated power reduction due to any obstacles along the signal path can be modeled using an attenuation parameter, x(i), for the ith obstacle encountered by the signal. This loss can be influenced by various factors, such as the size, shape, and material properties of the obstacle. In addition, the penetration rate of the material of ith obstacle, β(i), can also influence the amount of signal loss, which has a range from 0 to 1. The first obstacle encountered by the signal produces the most significant power loss, whereas subsequent obstacles produce less attenuation [2,3,4]. For multi-mode propagation zones, the path loss is calculated as follows:
L M M = 20 log 10 10 2 α H d + 10 2 α V d + 20 log L r o u g h n e s s + 20 log L o b s t a c l e
where,
α H = 4.343 λ 2 ε r h w 3 ε r h 1 + 1 h 3 ε r v 1
α V = 4.343 λ 2 1 w 3 ε r h 1 + ε r v h 3 ε r v 1
Ɛr(h) and Ɛr(v) are considered to be 5–6 for salt mines [3]. The tilt angle loss is neglected in the multi-mode propagation zone due to the attenuation caused by higher-order Transverse Electric (TE) modes.

2.2. Propagation Zone Model

The dividing point calculations are performed for variable cross-sections of the mine tunnels, with some as small as 2 × 2 mm2. The dividing point theory is illustrated in Figure 2.

2.2.1. Free Space Dividing Point

The Dividing Point 1 (DP1), also called the free space dividing point, refers to the distance from Tx at which the boundary of the first Fresnel zone can be defined for the nearest walls of the tunnel. At this point, the signal starts to encounter significant attenuation due to the presence of the tunnel walls, which is determined using Rmax and Dmin.
R m a x = 1 2 λ d
D m i n = x z f i x t + x r 2 2 + y z f i y t + y r 2 2 + z z f i z t + z r 2 2
D P 1 = M i n Z r | R m a x = D m i n , Z r ϵ R +
where zr is the Rx antenna height, Rmax denotes the radius of the maximum first Fresnel zone, and Dmin denotes the minimal distance between the middle point on the line-of-sight (LOS) between the Tx and receiver (Rx) and the intersection between the maximum Fresnel zone plane and the tunnel surface. The details and simplified formulas of the Dividing Point 1 in arbitrary cross-sectional tunnels are given by [11].

2.2.2. Multi-Mode (Limited) Dividing Point

The multi-mode propagation zone is divided into two sub-zones: the multi-mode (limited) and multi-mode (fundamental) zones. The multi-mode zones occur in between DP1 and DP3, where we experience high Transverse Electric (TE) and Transverse Magnetic (TM) modes of propagation as compared to the free space zone. To determine the location of DP2, an assumption is made that the tunnel has an equivalent rectangular cross-section. Based on this assumption, the distance from the transmitter (Tx) to DP2 can be calculated by considering the second fundamental mode of the tunnel. These modes are essentially standing waves that can be established in the tunnel, and they are defined by the number of times they reflect off the vertical or horizontal walls. According to the model described in [2], DP2 is located at the distance where the second fundamental mode has undergone one reflection from the walls. This distance is calculated in Equation (12), with w and h regarded as the width and height of the tunnel.
D P 2 = M a x w 4 λ + w h , h 4 λ + w h

2.2.3. Multi-Mode (Fundamental) Dividing Point

The distance of Dividing Point 3 (DP3) from Tx is calculated in Equation (13), where only the horizontal and vertical walls of the tunnel are used without any surface roughness.
D P 3 = M a x Z h , Z v
where,
Z h = w 2 × M a x x t , w x t λ + w 2 × M a x x r , w x r λ
Z v = h 2 × M a x y t , h y t λ + h 2 × M a x y r , h y r λ
where Zh and Zv are the horizontal and vertical distances between Tx and Rx, xt and xr are the horizontal coordinates of Tx and Rx, respectively, and yt and yr are the horizontal coordinates of Tx and Rx, respectively. The detailed path loss analysis of the model calculations and measured results is shown in Figure 3. The different multi-mode zones are well separated by 19 m and 30 m distances.

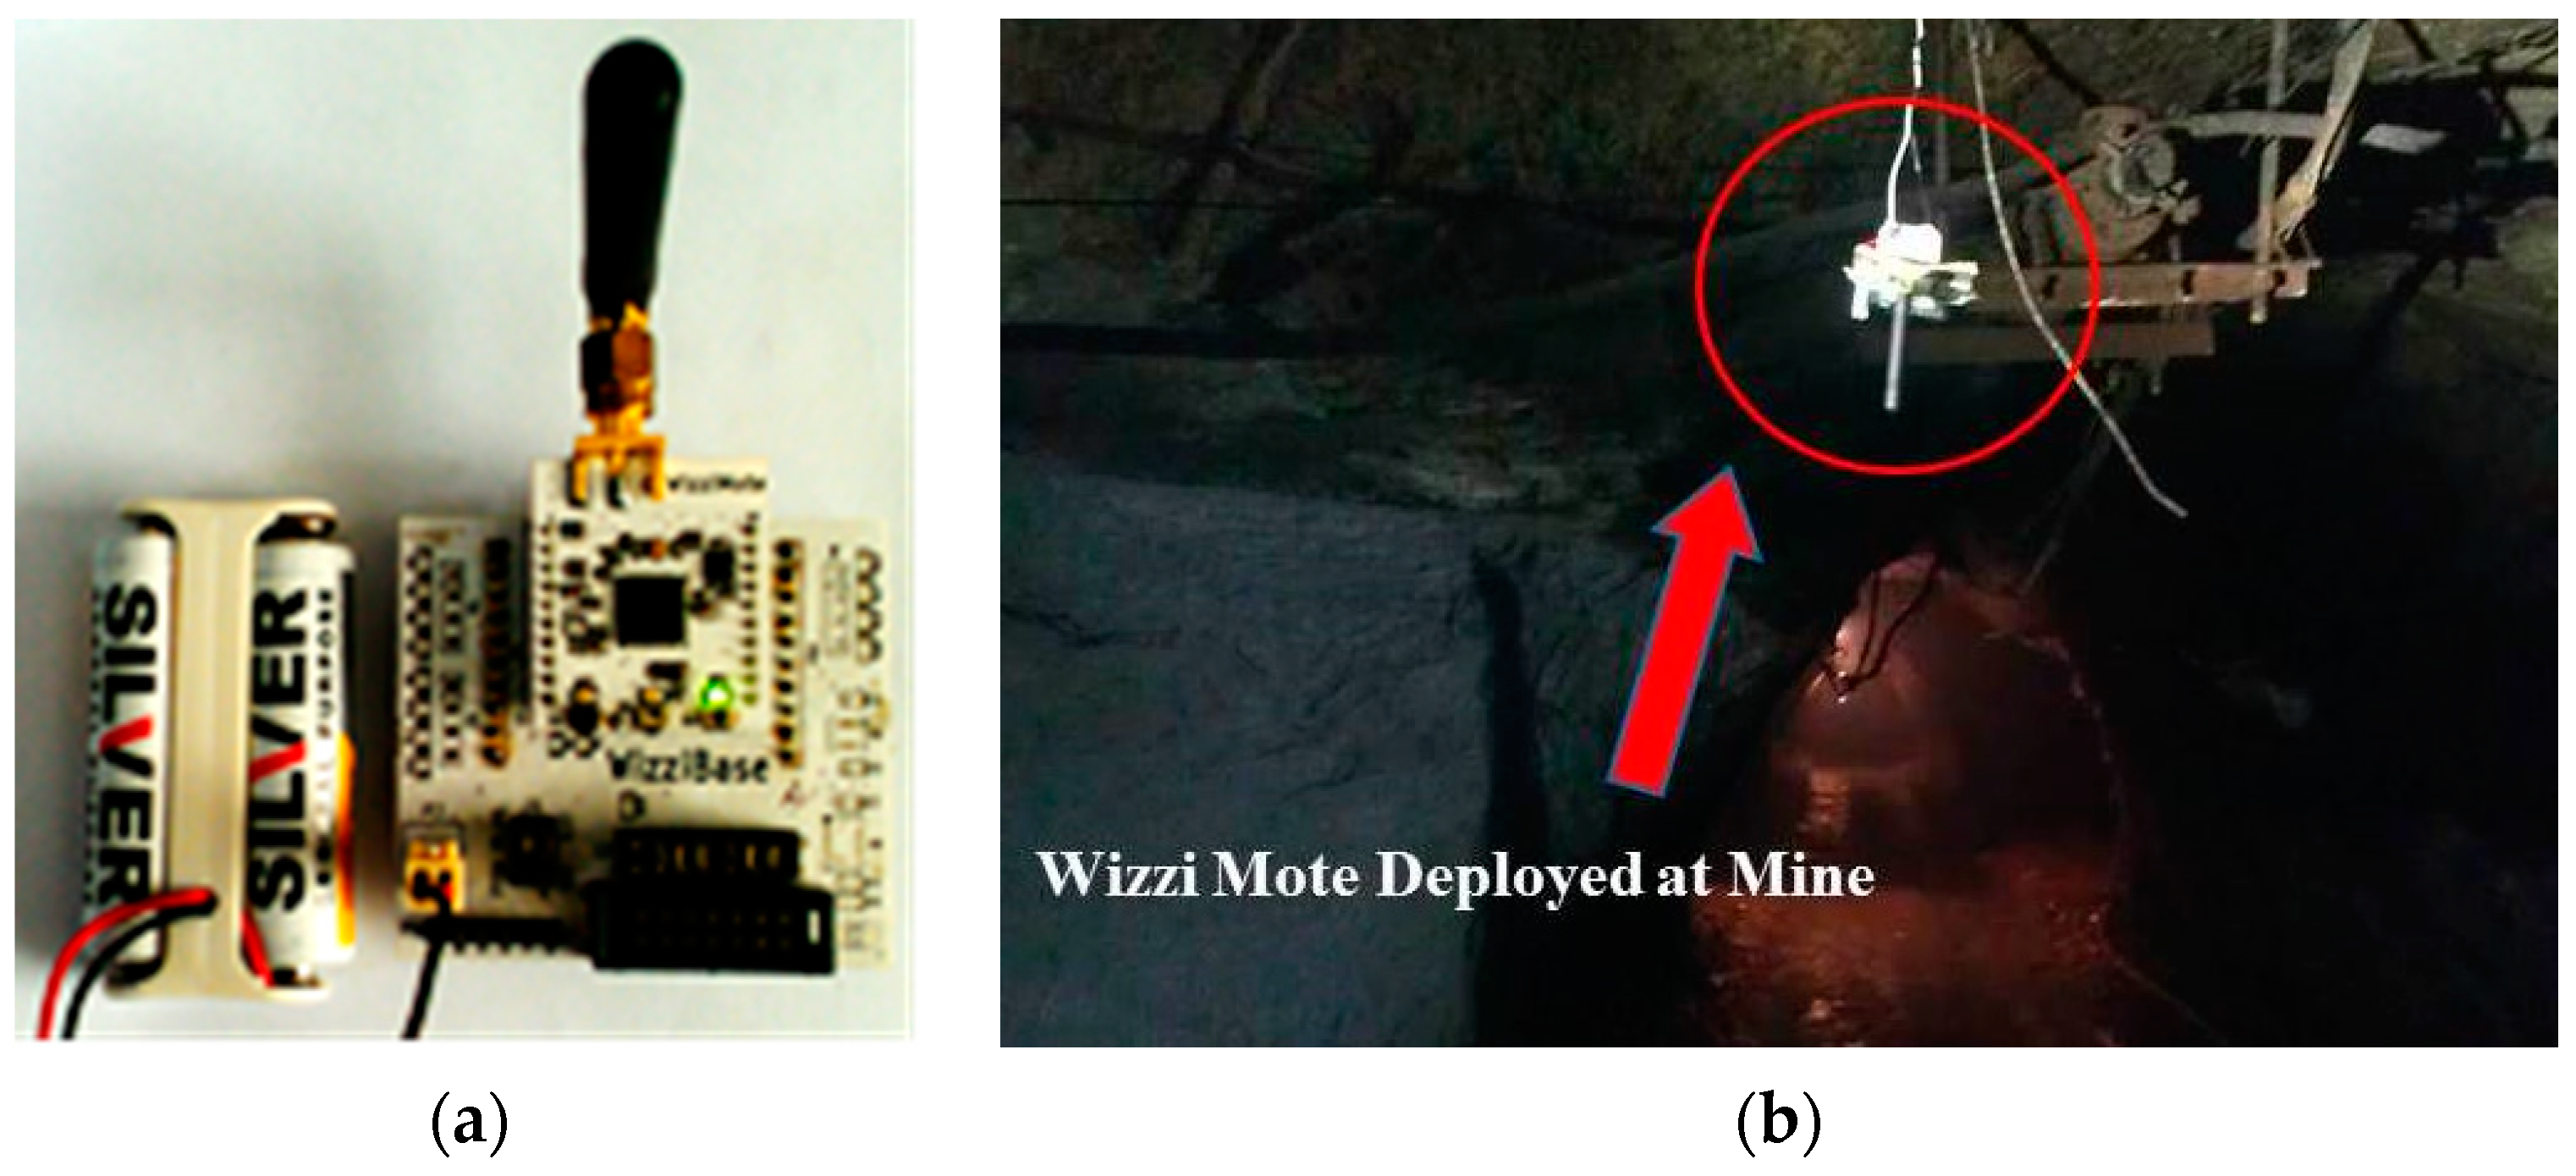
3. Experimental Setup and Measured Results in the Salt Mine

The Khewra Salt mine has 19 levels, similar to stories in a building, where all the levels are operational except the ground level, which is reserved for tourists. Seven levels are above ground and twelve are underground, with an average clearance of 50 ft of salt/rock between each level. The mine is 350 m above sea level and extends 730 m deep into the mountain. The ‘room and pillar’ method is still being used in the Khewra mining operation, with a cumulative length of tunneling inside the mine of more than 40 km, including straight passages and curves. The experiments were conducted on level three, which is an underground level, in straight passages and near the pillars. The actual tunnel cross-sections are usually between rectangles and circles. In our study, the experimental mine tunnel was treated as an equivalent rectangle, with a maximum width of 2.2 m and a maximum height of 2.6 m, for ease of comparison.
The radio model was validated using link performance experiments carried out on wizzi motes [3,8,9,10]. The hardware of the wizzi mote transceiver is shown in Figure 4a and node deployment in the salt mine is shown in Figure 4b. The nodes were deployed on the roof, as well as the side walls of the mine tunnels. The embedded RF core in the onboard controller can transmit and receive sensor data using the 433 MHz DASH7 protocol. During the experiments, one transmission cycle consisted of 1000 packets, each containing 255 bytes of data, transmitted at a carrier frequency of 433 MHz. The transmission data was modulated via 2GFSK at a baud rate of 200 K baud [10]. Every transmission took 200 ms of time and was attempted five times before declaring that the connection was lost. It was observed that, for every 1000 packets transmitted using a fixed transmitter power of 12.6 dBm, the measurements consumed 0.1–0.25 mW power. The experiment campaign was carried out for three continuous weeks at different locations of level 3, with an average of 68,000 data packets transmitted every day.

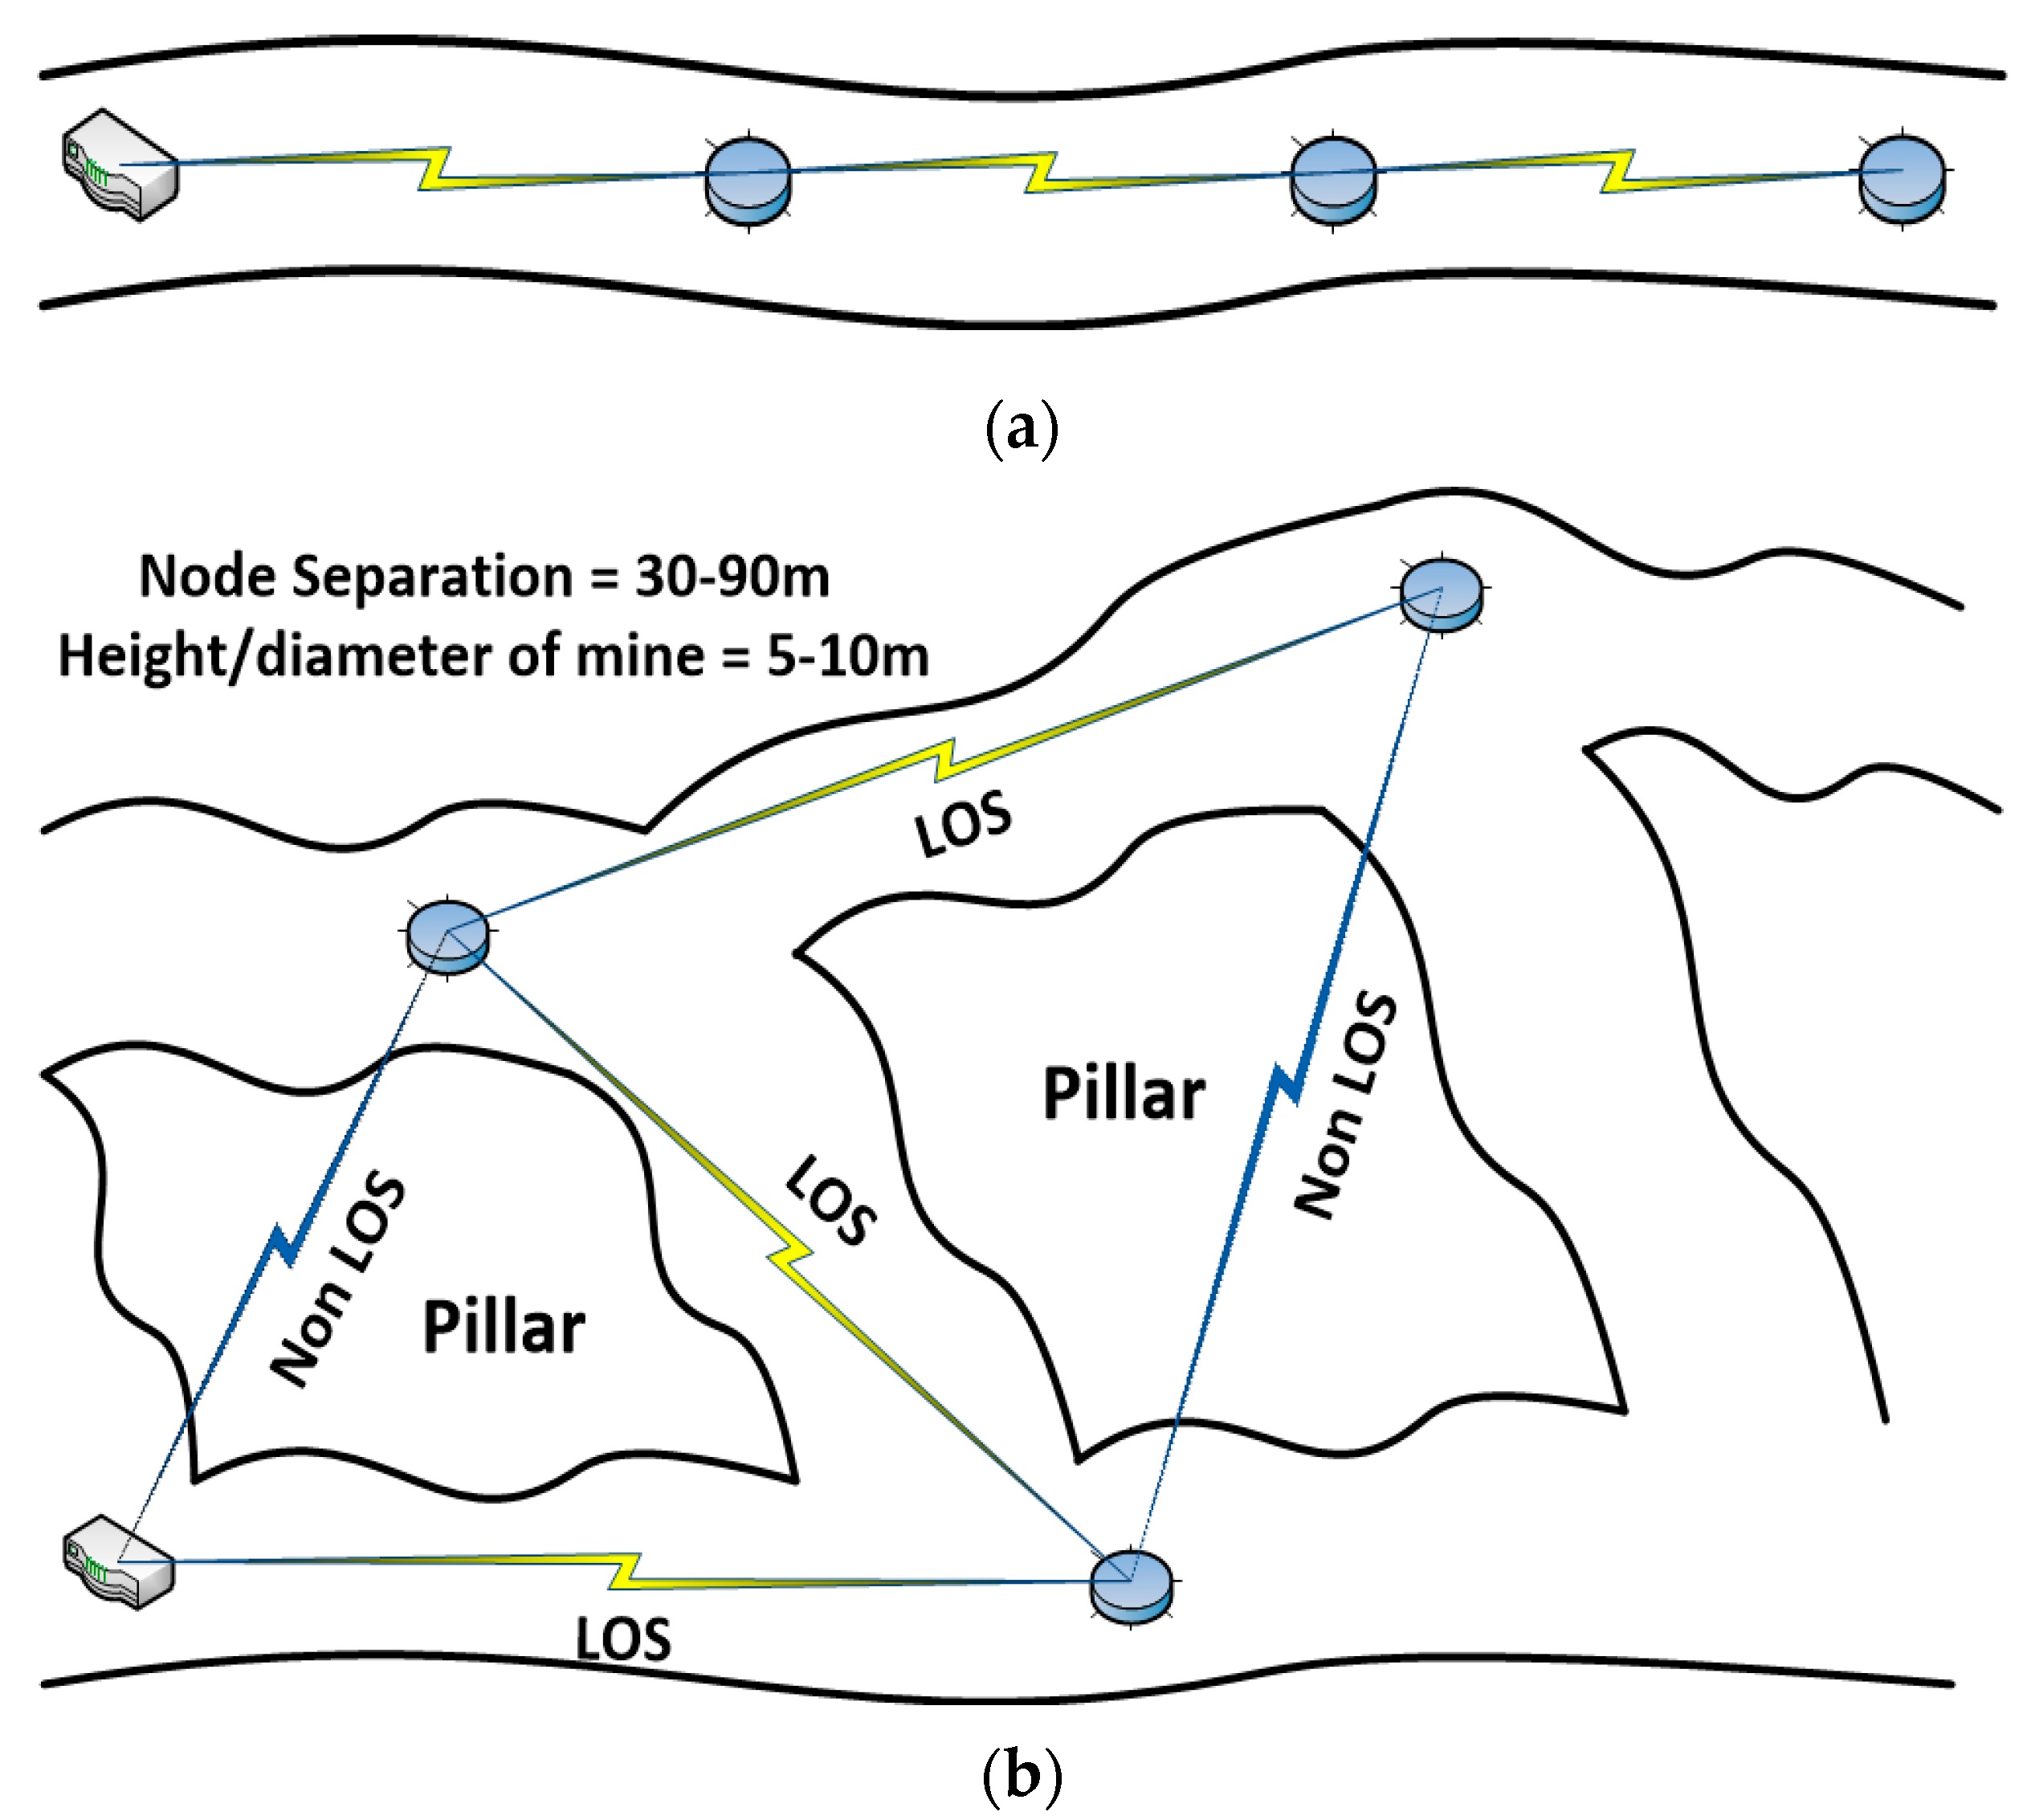
3.1. Different Mining Structures in Underground Mines

Figure 5 shows the tunnel and room–pillar mining schemes in the Khewra salt mine. Using the deployment scenario shown in Figure 2, RSSI was measured in a mine tunnel with node separation of up to 110 m. Theoretical calculations indicate that RSSI decreases from −41 to −85 dBm. During the experiments, fluctuations in RSSI were observed, with an irregular trend ranging from −60 to −84 dBm. These variations in the propagation range may be described in terms of human (miner) and metal object movements and multi-path effects. Furthermore, the presence of different gases in the atmosphere can also affect wave propagation and signal strength.
An average variation of 2.6% was observed between the theoretical and measured values. The comparison of RSSIs measured for single and multi-hop tunnel scenarios with up to 70 m of separation is shown in Figure 6a. In the room–pillar mining scenario, the RSSI values displayed a consistent trend of decrease in all the scenarios, except for an abrupt increase, which was observed at 40 m. This could have been due to potential reflected waves at the receiver. The behavior described persisted consistently across all node placements, with an average variation of 3.8% recorded across multiple measurements taken on different days. Figure 6b depicts the measured RSSI values for both single and multi-hop room–pillar scenarios, with node separations of up to 70 m.

3.2. Node Deployment Analysis in the Mine

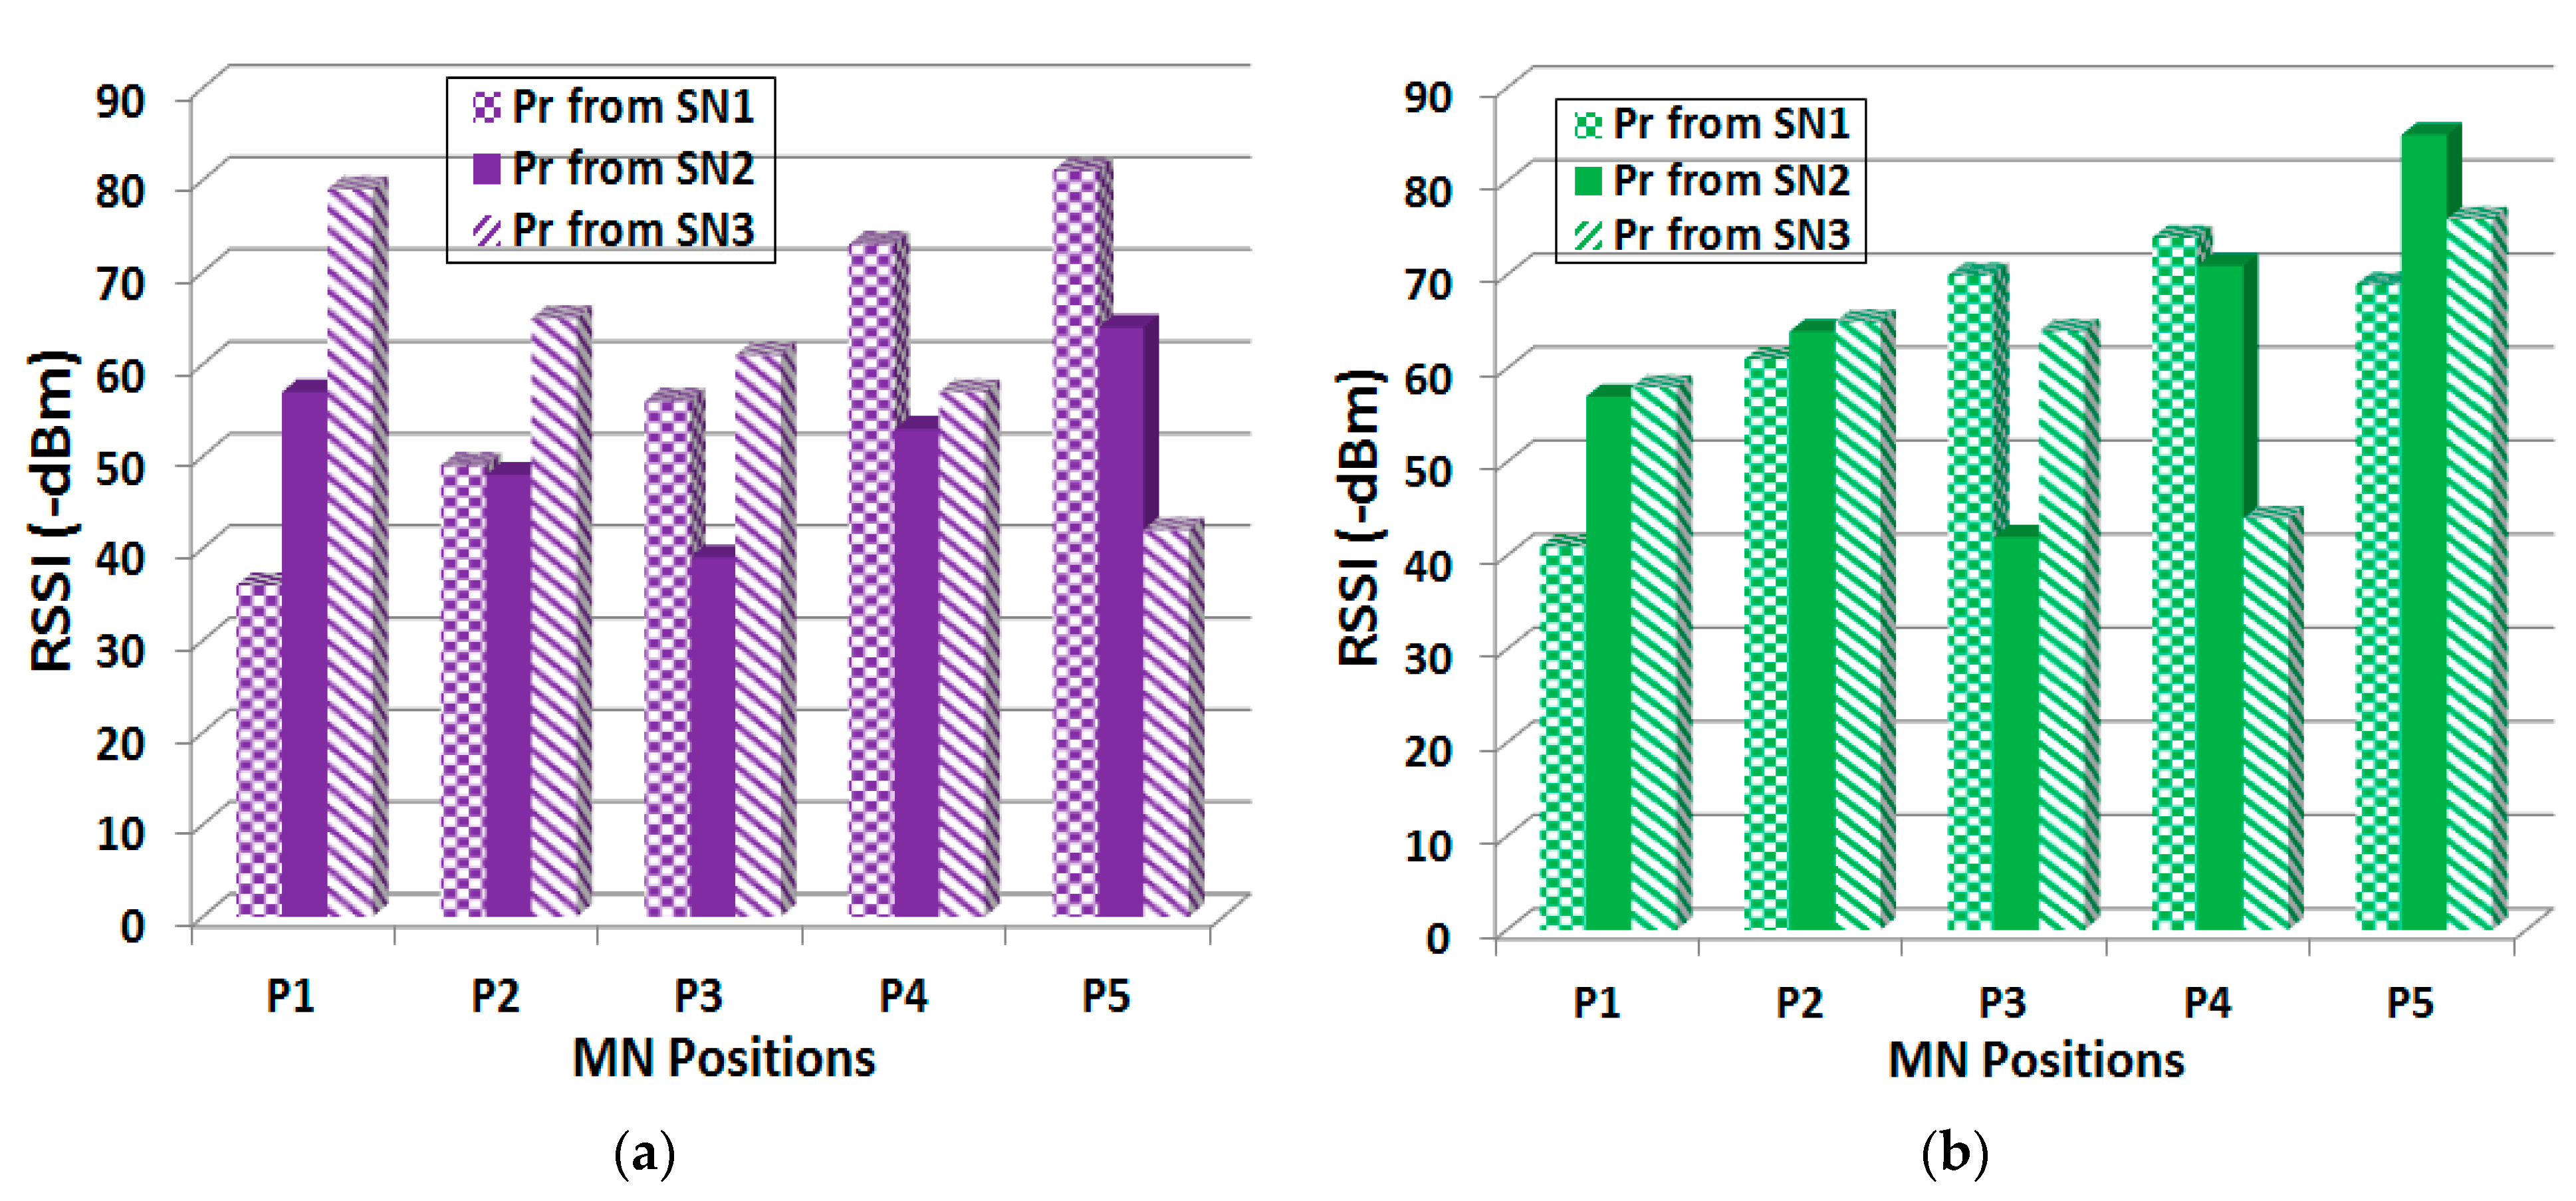
3.2.1. Node Position

The propagation model presented in this study mainly focuses on node location and node separation in underground mines. To determine these metrics, it was important that the Transverse Electric (TE) and Transverse Magnetic (TM) modes of propagating waves were controlled. The sensor nodes were placed at the 1/10 th distance from the mine roof ceiling and at the side walls in order to find a suitable node position. The following four scenarios of node position were used during the experiments: P(1,1), when both Tx and Rx were placed at the roof ceiling; P(1,2), when Tx was placed at the roof ceiling and Rx was placed at the side wall; P(2,1), when Tx was placed at the side wall and Rx was placed at the roof ceiling; and P(2,2), when both Tx and Rx were placed at the side wall. Figure 6c,d shows the trend for RSSI and the modes of propagation versus the node separation derived from Equation (12). There was only a 6% mean variation in RSSI values for the node position matrix when monopole omnidirectional antennas were used. A separation distance of 110 m was achieved between the sensor nodes for single-hop communication after continuous experimentation over 3 weeks. The higher modes of propagation attenuated after a 50 m separation distance between the sensor nodes was established, which reduced the impact of reflected waves on the overall propagation link performance and provided the chance to establish a link for larger node separations (see Figure 6d).

3.2.2. Node Separation

Figure 6e shows the theoretical and measured values for node separation using wizzi motes with monopole antennas. The theoretical separation was calculated as 148 m, whereas a measured separation of 110 m was achieved in the mine due to unpredicted multi-path and random human activities. For the multi-hop experiments, stationary nodes were placed with equal separations between them, both in tunnel and room–pillar mining. A non-LOS scenario was also tested, where the link went down at 70 m apart with average fluctuations of 5% in RSSI. In the non-NLOS experiments, the pillar width and the dominance of higher mode multi-path reflections had an impact on the separation range. A comparison between the LOS and non-LOS cases in an underground mine is depicted in Figure 6f.
The results show a smooth increase in RSSI for tunnel mining and an unpredicted deviation for room–pillar mining. A mean deviation in RSSI of 9% was observed in the single-hop scenario, 4% in 2-hop scenario, and 14% in the 3-hop scenario between tunnel and room–pillar scenarios. The maximum calculated node separation was 148 m, with 12.6 dBm transmit power and −85 dBm receiver sensitivity, which increased with an increase in transmit power and antenna gains. The maximum measured node separation with four different node positions was 110 m using the same configuration. The main reason for the decrease in separation range was found to be lossy mine walls and higher propagation mode dominance, but only 6% mean variation was noticed for the node matrix, which indicates that radio link performance is independent of node position. It was noticed that the RSSI can be influenced by various factors, such as human presence, metal object interference, and antenna orientation. These factors were kept constant in repeated experimental trials to ensure consistency in the results.

3.2.3. Packet Error Rate (PER) Analysis

In Figure 7a, PER was calculated in different environments at 433 MHz using wizzi nodes, where the separation between a stationary node and a mobile node was varied in order to observe the change in PER values. The measurements were taken in an anechoic chamber, indoor corridor, outdoor plane pathway, and underground salt mine to validate the viability of the sensor nodes and to define reference propagation link performance. The PER remained consistent at 0% in the anechoic chamber; however, for outdoor environments, the PER was recorded up to 1.1% lower at 433 MHz compared to the indoor hallways results. Moreover, the peak value was recorded to be up to 1.4% for changing weather conditions. Experiments were also carried out in an underground salt mine, where reflections from lossy mine walls and irregular structures were most likely to occur and affect the overall performance of the radio link. At a Tx power of 12.6 dBm, the PER remained consistent at 0% within a range of 20 m at 433 MHz. However, it increased exponentially from 0.1 to 1.9%, with abrupt changes occurring until a range of 70 m, which means a maximum of 19 out of 1000 packets were lost during each transmission, as illustrated in Figure 7a.
An asymmetrical link refers to a connection where there is a difference in connectivity and transmission between the Tx–Rx link and vice versa. Various factors, such as the orientation of the experimental setup, the presence of metal objects, unpredictable multi-paths, and human movement directions, can affect the number of packet deliveries over the radio link, resulting in significant differences in link characteristics between nodes, even with a fixed transmission power. Figure 7b displays the link asymmetry in terms of the difference in RSSI for different environments. In indoor and outdoor environments, the number of received packets was always counted between 3 to 6%, along with the highest link asymmetry of 9 dBm. A difference of 0 to 3 dB in RSSI was observed for 95% of the received packets. The underground mine behaved the same as indoor and outdoor environments and showed an asymmetry of 9 dBm. Moreover, an average variation of 3.5% was noticed for a 2 dBm asymmetry at 433 MHz for almost 80% of the received packets. In an anechoic chamber, a difference in RSSI of 0 to 2 dB was observed, with link asymmetry of up to 5 dBm at 433 MHz for 92% of the received packets. The RSSI had a mean variation of 2.36 dB and an average standard deviation of 1.8 dB for all the discussed environments.

4. Application-Based Performance

To evaluate the potential of using the 433 MHz band for remote monitoring in naturally complex environments, an underground salt mine in Khewra, Pakistan was used to conduct the customized experimentation. The mine consisted of 19 floors, with 12 underground floors and 7 floors on and above ground level. For the experiments, the third underground level was utilized and tunnel and room–pillar areas were chosen. Stationary sensor nodes and miner positions were placed in both areas, as depicted in Figure 8a,b, respectively. To validate the trilateration technique for miner localization, five different positions of randomly moving miners were utilized. The experiments were conducted in both mine tunnels and room–pillar mining, where the mobile nodes (miner) were randomly moved up to a maximum of 50 m of Tx–Rx separation in order to calculate the RSSI at three stationary nodes. The stationary nodes were positioned at the ceiling and side walls of the mine to avoid ground reflections. Nevertheless, repeated experiments showed random fluctuations in RSSI, with an irregular trend ranging from −60 to −84 dBm, possibly caused by human (miner) and metal object movements and multi-path effects in the propagation range. Additionally, it was noted that the RSSI was also affected by increased concentrations of gases present in the atmosphere. The measured RSSI values for miner nodes at one of the three stationary nodes are displayed in Figure 9. Due to the influence of multiple factors, the localization accuracy was limited to 5–10 m during the experiments, which is considered sufficient for safety assurance applications.
Over the span of three weeks, multiple experiments were conducted, and the results showed an average variation of 3.5%. The RSSI values for the localization setup in the mine tunnel are depicted in Figure 9a. Similarly, in room and pillar mining, RSSI showed a uniform pattern for all the miner node (MN) positions, except for a sudden increase at P2, which might have been due to reflected waves at the receiver nodes. The observed pattern remained consistent across all the stationery and miner node positions, with an average variation of 2.8% in repeated experiments conducted on different days, which had random temperature and gas concentrations. Figure 9b presents the analysis of RSSI values for the moving miner in the mine room–pillar configuration.

5. Conclusions

This paper presents an investigation of the proposed radio link model for underground mine sensor networks. The analytical radio link model is proposed to determine the best node position and node separation in underground mines, considering different mining structural schemes. The proposed model was validated using wizzi motes operating at 433 MHz, which were obtained from Wizzi Lab, France. The experimental characterization of the radio link model was determined in terms of RSSI and PER, which were obtained from the signal strengths of transmitted and received radio waves. RSSI and PER were measured for tunnel and room–pillar mining, along with different propagation modes, to verify the optimized node position defined in the node position matrix. The presented model gives freedom to radio link designers, allowing them to place a stationary node at the rooftop or near the side wall of the mine, which eventually improves link reliability and increases node separation distance without affecting the received signal strength. Furthermore, the effectiveness of the DASH7 protocol in localizing miners among multiple stationary nodes in a salt mine was demonstrated, highlighting its potential in the deployment of application-specific sensor networks. The radio link model presented in this study can be utilized by design engineers to address concerns regarding node placement and separation when designing sensor networks that utilize the DASH7 protocol for use in underground mines.

Author Contributions

Conceptualization, S.S. and I.H.N.; Methodology, S.S., H.Z. and S.B.Q.; Software, S.B.Q.; Validation, H.Z., S.B.Q., S.M.A. and S.M.; Formal analysis, S.S. and I.H.N.; Investigation, S.S. and I.H.N.; Resources, S.B.Q.; Data curation, S.S., H.Z. and I.H.N.; Writing—original draft, S.S. and I.H.N.; Writing—review & editing, H.Z., S.B.Q., S.M.A. and S.M.; Supervision, S.M.A. and S.M.; Project administration, S.M.A. and S.M.; Funding acquisition, S.M.A. and S.M. All authors have read and agreed to the published version of the manuscript.

Funding

This research received no external funding.

Conflicts of Interest

The authors declare no conflict of interest.

References

  1. Kumar, P.P.; Paul, P.S.; Ananda, M. Development of LoRa Communication System for Effective Transmission of Data from Underground Coal Mines. Processes 2023, 11, 1691. [Google Scholar] [CrossRef]
  2. Forooshani, A.E.; Bashir, S.; Michelson, D.G.; Noghanian, S. A Survey of Wireless Communications and Propagation Modeling in Underground Mines. IEEE Commun. Surv. Tutorials 2013, 15, 1524–1545. [Google Scholar] [CrossRef]
  3. Minhas, U.I.; Naqvi, I.H.; Qaisar, S.; Ali, K.; Shahid, S.; Aslam, M.A. A WSN for Monitoring and Event Reporting in Underground Mine Environments. IEEE Syst. J. 2018, 12, 485–496. [Google Scholar] [CrossRef]
  4. Zhang, H.; Li, B.; Karimi, M.; Saydam, S.; Hassan, M. Recent Advancements in IoT Implementation for Environmental, Safety, and Production Monitoring in Underground Mines. IEEE Internet Things J. 2023, 1. [Google Scholar] [CrossRef]
  5. Branch, P. Propagation Measurements and Models of 915 MHz LoRa Radio in a Block Cave Gold Mine. In Proceedings of the International Conference on Information Networking (ICOIN), Jeju Island, Republic of Korea, 13–16 January 2021; pp. 333–338. [Google Scholar]
  6. Guan, K.; Zhong, Z.; Ai, B.; He, R.; Chen, B.; Li, Y.; Briso-Rodriguez, C. Complete Propagation Model in Tunnels. IEEE Antennas Wirel. Propag. Lett. 2013, 12, 741–744. [Google Scholar] [CrossRef]
  7. Shi, J.; Wang, F.; Zhang, D.; Huang, H.; Wu, Y. Refined numerical simulation of signal propagation in soils for wireless underground sensor networks. Tunn. Undergr. Space Technol. 2023, 140, 105312. [Google Scholar] [CrossRef]
  8. Ranjan, A.; Sahu, H.B.; Misra, P. DeepSense: Sensing the radio signal behavior in metal and non-metal underground mine workings. In Proceedings of the IEEE Conference on Computer Communications Workshops, Honolulu, HI, USA, 15–19 April 2018; pp. 913–918. [Google Scholar]
  9. Guan, K.; Zhong, Z.; Ai, B.; He, R.; Chen, B.; Li, Y.; Briso-Rodriguez, C. Complete propagation model structure inside tunnels. Prog. Electromagn. Res. 2013, 141, 711–726. [Google Scholar] [CrossRef]
  10. Rissafi, Y.; Talbi, L.; Ghaddar, M. Experimental Characterization of an UWB Propagation Channel in Underground Mines. IEEE Trans. Antennas Propag. 2012, 60, 240–246. [Google Scholar] [CrossRef]
  11. Arsalan, M.; Umair, A.; Verma, V.K. Dash7: Performance. IOSR J. Electron. Commun. Eng. 2012, 2, 8–11. [Google Scholar] [CrossRef]
  12. Yu, X.; Zhang, Z.; Chai, R. RSSI Estimation for Wireless Sensor Network Through-the-earth Communication at Frequency 433 MHz. J. Intell. Fuzzy Syst. 2020, 38, 1401–1410. [Google Scholar] [CrossRef]
  13. Ranjan, A.; Misra, P.; Sahu, H.B. On the importance of link characterization for wireless sensor networks in underground mines. In Proceedings of the International Conference on Communication Systems and Networks (COMSNETS), Bengaluru, India, 4–8 January 2017; pp. 576–577. [Google Scholar]
  14. Moridi, M.A.; Kawamura, Y.; Sharifzadeh, M.; Chanda, E.K.; Jang, H. An investigation of underground monitoring and communication system based on radio waves attenuation using ZigBee. Tunn. Undergr. Space Technol. 2014, 43, 362–369. [Google Scholar] [CrossRef]
  15. Karanth, N.; Choudhary, D.; Reddy, J.F.; Athulla, U. LoRaWAN-Based Communication Protocol for Wearable Safety Devices in Mining Fields. In Emerging Research in Computing, Information, Communication and Applications ERCICA 2020; Springer: Cham, Switzerland, 2021; Volume 2, pp. 441–453. [Google Scholar]
  16. Moiroux-Arvis, L.; Cariou, C.; Chanet, J.-P. Evaluation of LoRa technology in 433-MHz and 868-MHz for underground to aboveground data transmission. Comput. Electron. Agric. 2022, 194, 106770. [Google Scholar] [CrossRef]
  17. Das, I.; Shaw, R.N.; Das, S. Analysis of Effect of Fading Models in Wireless Sensor Networks. In Proceedings of the 2020 IEEE International Conference on Computing, Power and Communication Technologies (GUCON), Greater Noida, India, 2–4 October 2020; pp. 858–860. [Google Scholar]
  18. Saleem, A.; Zhang, X.; Xu, Y.; Albalawi, U.A.; Younes, O.S. A Critical Review on Channel Modeling: Implementations, Challenges and Applications. Electronics 2023, 12, 2014. [Google Scholar] [CrossRef]
  19. Haneda, K.; Rudd, R.; Vitucci, E.; He, D.; Kyösti, P.; Tufvesson, F.; Salous, S.; Miao, Y.; Joseph, W.; Tanghe, E. Chapter 2-Radio propagation modeling methods and tools. In Inclusive Radio Communications for 5G and Beyond; Academic Press: Cambridge, MA, USA, 2021; pp. 7–48. [Google Scholar]
Figure 1. A theoretical model of the mine tunnel cross-section. (a) Side view and (b) front view.
Applsci 13 08987 g001
Figure 2. Theory of dividing Point 1 for tunnel cross-sections.
Applsci 13 08987 g002
Figure 3. Path loss analysis of the dividing points using calculated and measured results.
Applsci 13 08987 g003
Figure 4. (a) Wizzi mote Tx–Rx and (b) node deployment in the salt mine.
Applsci 13 08987 g004
Figure 5. Multi-hop links between stationary nodes in (a) tunnel and (b) room and pillar mining methods.
Applsci 13 08987 g005
Figure 6. (a) RSSI for the tunnel, (b) RSSI for the room–pillar scenario, (c) RSSI for the node position matrix analysis, (d) propagation mode analysis inside the mine, (e) node separation range, and (f) RSSI for the LOS vs. non-LOS links.
Applsci 13 08987 g006
Figure 7. (a) PER for different link ranges and (b) the no. of packets delivered for different RSSI values.
Applsci 13 08987 g007
Figure 8. Localization of miners in different scenarios: (a) tunnel and (b) room and pillar scenarios.
Applsci 13 08987 g008
Figure 9. RSSI metric for the localization of the miner in (a) a mine tunnel and (b) a mine room–pillar.
Applsci 13 08987 g009
Table 1. Specifications of different wireless technologies.
SpecificationsDASH7LoRaZigBee
Frequency433.04–434.79 MHz866–868 MHz2.402–2.482 GHz
Discrete channels161616
ModulationFSK or GFSKGFSKQPSK
Data Rate55.4 Kbps200 Kbps250 Kbps
Max potential data rate200 Kbps1 Mbps500 Kbps
Range (0 dBm)140 m115 m75 m
Water/Concrete Wall penetrationGoodFairPoor
Disclaimer/Publisher’s Note: The statements, opinions and data contained in all publications are solely those of the individual author(s) and contributor(s) and not of MDPI and/or the editor(s). MDPI and/or the editor(s) disclaim responsibility for any injury to people or property resulting from any ideas, methods, instructions or products referred to in the content.

