Abstract
Ground-penetrating radar (GPR) detects a tunnel with relatively low-frequency electromagnetic waves, which can result in poorly characterized reinforced steel bar (rebar) hyperbolas and make it challenging to recognize rebar. Thus, the rebar is located by using attenuation and reflection coefficients, and the hyperbolic feature of the rebar is reconstructed for recognition. Due to differences in the electromagnetic properties of rebar and other media in the second lining, the position of rebar in the one-dimensional time wave diagram (A-scan) is determined by using the attenuation and reflection coefficients. The rebar is recognized at the peak point in the A-scan. This peak point is in the opposite phase of the incident wave. The amplitude of these peaks is smaller than the peaks of the adjacent points. Then, these negative peak points are reconstructed on the two-dimensional scanning data (B-scan). Finally, the rebar is recognized by using the hyperbolic feature of the rebar. The method is applied in the Husa Tunnel in Yunnan Province, China. Moreover, in the mileage section YK81+506–YK81+542 of the Husa Tunnel, the hyperbolic feature of the reconstructed rebar is evident, and the rebar appears in the region of 5–7 ns in the B-scan.
1. Introduction
The hyperbolic shape of rebar in two-dimensional ground-penetrating radar data (B-scan) is influenced by the frequency of the electromagnetic waves [1]. This influence causes difficulties in recognizing rebar in a B-scan at relatively low frequencies. Therefore, in order to achieve rebar recognition, the first step is to understand the variation in the B-scan hyperbolic shape of the rebar at different frequencies. Xiang et al. [2] used a 500 MHz GPR to probe the Damaoshan highway tunnel. The results showed that the hyperbolic feature of the rebar in the B-scan was not clear in mileage section DK5+46–DK5+66 of the Damaoshan highway tunnel. Alani et al. [3] used GPR at 900 MHz and 2 GHz to detect the details of the tunnel structure. In this case, the 2 GHz B-scan images clearly showed the location of the two-layer rebar structure in the tunnel. In contrast, the hyperbolic features of the rebar were difficult to recognize in the 900 MHz B-scan images. Drahor et al. [4] used GPR with emission frequencies of 270 MHz and 1600 MHz to detect the indoor, bridge deck and pier construction types. In particular, the distribution of rebar within the bridge deck could be obtained when 270 MHz was used for the bridge deck, while 1600 MHz GPR allowed the hyperbolic features of the rebar to be better characterized. Wang et al. [5] used a genetic algorithm to search for buried rebar in the GPR data of the target reflection waveform. Binary images were generated by collecting all local maxima from a one-dimensional time-waveform diagram (A-Scan) using a grayscale gradient threshold in the vertical direction. The initial location of the target was selected from a grayscale frequency wavenumber domain offset image of the GPR data. A best-fit hyperbola was then searched for at each potential location in the binary image based on a genetic algorithm and time-distance analysis of the reflected signal to achieve semi-automatic rebar detection. The results show that the accuracy of rebar recognition decreased as the frequency of GPR emission decreased. The above study revealed that as the main frequency of the GPR antenna decreases, it is more difficult to recognize the hyperbolic shape of the rebar in the B-scan. In the case of GPR inspection of a tunnel’s lining structures, where the frequency of GPR emission is set below 900 Mhz, the hyperbolic shape of the rebar is not evident. Thus, it was necessary to reconstruct the hyperbolic shape of the rebar in the B-scan of the tunnel lining structure to enable recognition of the rebar.
The hyperbolic shape of the rebar is an important feature for recognizing the rebar in a B-scan [6,7,8]. Several scholars have implemented the recognition of rebar based on the hyperbolic shape of rebar combined with image recognition. Dinh et al. [9] proposed the use of offset, normalized intercorrelation and thresholding to obtain the hyperbolic rebar shape in a B-scan. The rebar was then classified and identified using deep convolutional neural networks (CNNs). The experimental results show that the recognition accuracy was higher than 95.75% when applying GPR data analysis to 26 bridge decks. Liu et al. [10] used the Single-Shot Multibox Detector (SSD) to obtain the B-scan’s hyperbolic region of interest for rebar. The experimental results showed that the identification accuracy of 13,026 reinforcement bars was 90.9% in the B-scan image which contained 3992 images. Asadi et al. [11] devised a computer vision-based method for the automatic detection of rebar in complex GPR images of highly degraded concrete bridge decks. In particular, the detection model consists of a fine-tuned histogram of oriented gradient feature descriptors, a multilayer perceptron for classification and a post-processing algorithm. The model was applied to the hyperbolic region for error elimination detection and labeling of rebar. The experimental results showed an overall accuracy of 89.4% on the URIGPRv1.0 dataset. The above studies have shown that it is feasible to recognize rebar in a B-scan using the hyperbolic characteristics of the rebar. Shen et al. [12] used GPR to detect rebar in columns, beams and floor slabs in order to assess the concrete structure of a building. By analyzing the B-scan diagrams obtained from the HF antenna, the amount of rebar was determined from the hyperbolic features of the diagrams. During the experiments, a reverse time migration (RTM) method was used to process the area containing the hyperbolic features of the rebar. The experimental results showed that the amount and location of the rebar could be accurately located using the RTM method based on the hyperbolic features of the rebar. Consequently, in order to recognize rebar, the first step is to figure out how the hyperbolic shape is formed. Compared with other media in the tunnel, rebar has extremely strong electromagnetic properties. The dielectric constant of rebar is considered to be infinite compared with other media [13]. The dielectric inhomogeneity of the rebar buried in the concrete leads to different variations in the reflected wave response. This variation is the basis for the formation of a hyperbola in the B-scan of the rebar. As the GPR moves in the direction of the survey line, the two-way travel time and electromagnetic wave distance from the receiving antenna to the rebar will change. The reflected signal of the rebar is recorded in each A-scan. Each A-scan is then arranged and combined in chronological order to form a B-scan and to give the reflected signal of the rebar a curved shape, which is the main reason for the curved shape of the rebar in the B-scan [14]. Thus, based on the difference in electromagnetic properties between the rebar and the concrete, rebar recognition can be provided to offer a basis.
When electromagnetic waves pass through different media, they are partially absorbed and reflected by the media [15,16]. This phenomenon can cause significant changes in the waveform and electric field strength of the reflected waves from the medium. Therefore, the differences in electromagnetic properties between media are used to recognize buried objects through the time–frequency analysis of reflected waves. Lucia et al. [17] calculated the attenuation coefficients for different layers based on GPR signal attenuation and the electromagnetic property of the medium. The resistivity values were then assigned to the other layers based on the attenuation coefficient, resistivity and dielectric constant. In addition, envelope functions of traces previously corrected for geometrical effects were created to detect the interface of the medium and to generate local attenuation curves and radioactive fraction bands before calculating the attenuation coefficients. Li et al. [18] determined the position of the tunnel lining by using the attenuation and reflection coefficients. When an electromagnetic wave is transmitted from the air (or second lining) to the second lining (or first lining), the reflection coefficient is negative (i.e., the reflected wave is in the opposite phase of incidence). In the A-scan, the lining is located at inflection points determined by the reflection and attenuation coefficients of the electromagnetic waves in the transmission medium. The recognition of the tunnel lining layer is achieved by using these inflection points. Yan et al. [19] studied the propagation of electromagnetic pulses in wind-formed sands with different water contents because GPR signals respond specifically to changes in water content during propagation. The results showed that the wind-formed sand’s dielectric constant and conductivity increased nonlinearly with an increasing water content. The attenuation coefficient of the EMP increased parabolically. At the same time, the time waveform fluctuated significantly at the boundary of the different media. The two-way travel time increased nonlinearly with an increasing water content, and the pulse velocity decreased nonlinearly. In addition, the peak frequency of the spectrum of the signal propagating through the wind-formed sand decreased with an increasing water content. The reflection waveform could therefore be analyzed by using the attenuation and reflection coefficients [20,21]. The rebar was then identified by reconstructing the hyperbolic features of the rebar in the B-scan.
In this paper, we have determined in an A-scan that the intersection of rebar and concrete is located at the peak point, based on the fact that there are differences in the electromagnetic properties of concrete and rebar within the tunnel’s lining structure. The reflection coefficient at the rebar–concrete interface is negative (i.e., the phase at the peak point is the opposite of that of the incident wave). The hyperbolic shape of the rebar is then reconstructed in a B-scan from these peak points containing the rebar location characteristics. The method was applied to the Husa Tunnel in Yunnan Province, China, where the hyperbolic shape of the rebar was reconstructed in a B-scan under the condition that the GPR main frequency antenna was 400 MHz, enabling the recognition of the rebar.
2. Materials and Methods
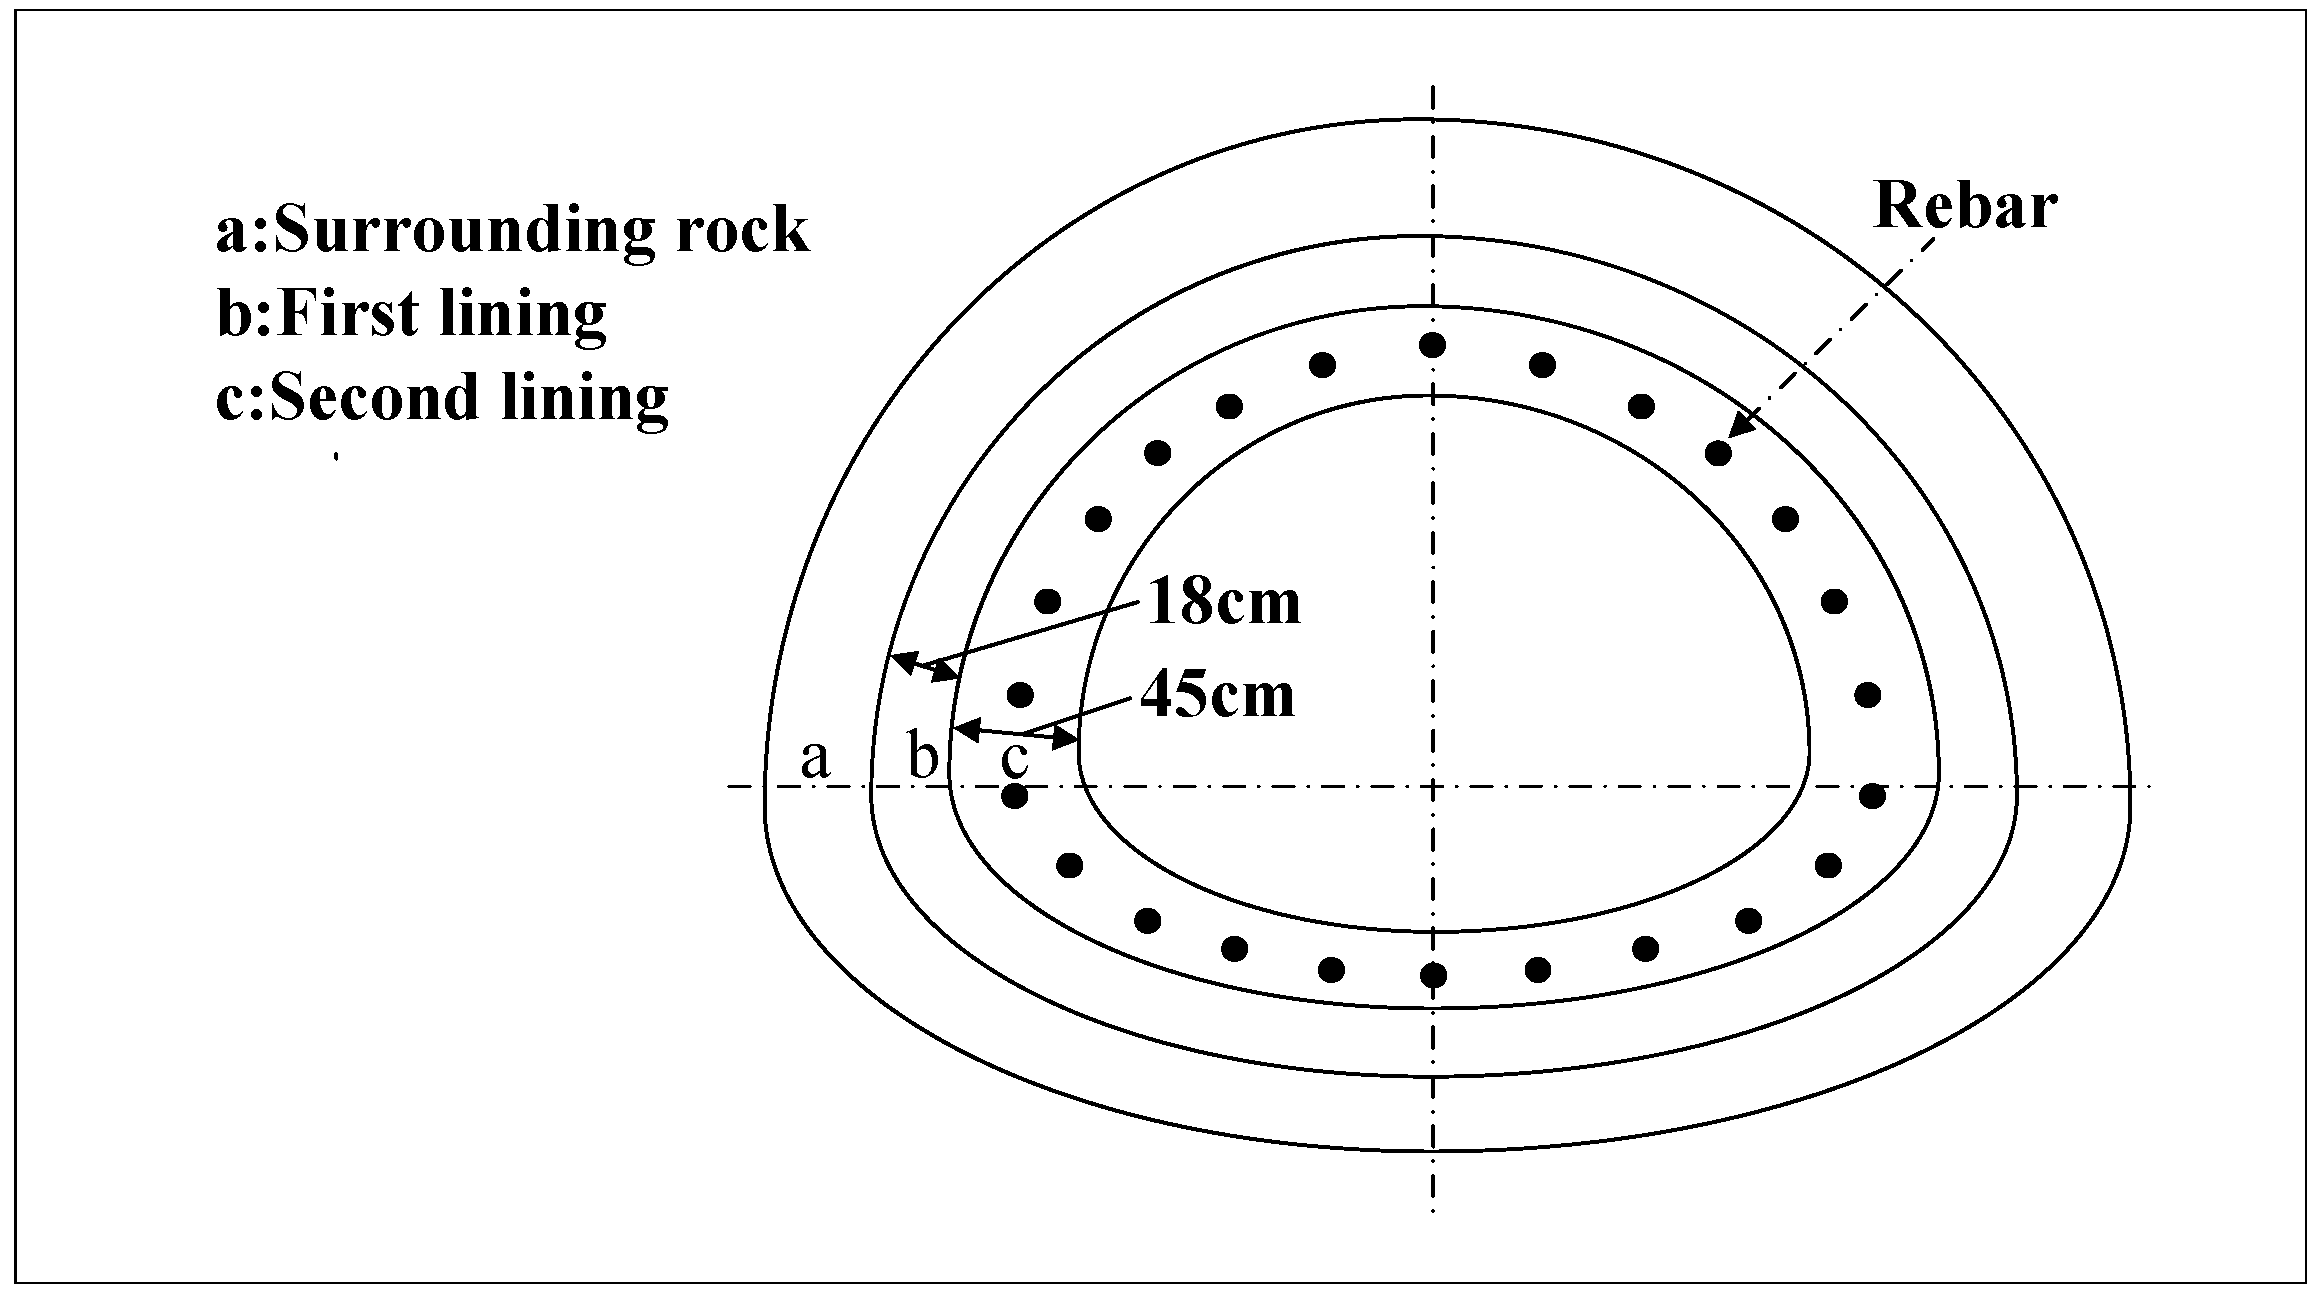
The tunnel consists of different media layers, as shown in Figure 1. Here, the external pressure on the tunnel is nonlinear and asymmetric [22]. As part of the secondary lining’s support structure, rebar was used to reinforce the lining and improve the bearing capacity of the lining.

Figure 1.
The main structural components of the tunnel media.
The essential principle of the GPR system is for the antenna transmitter (T) to emit high-frequency electromagnetic waves as brief broadband pulses to the target medium. These electromagnetic waves are subsequently reflected by the medium and received by the radar antenna receiver (R). The electromagnetic wave emitted by T is reflected at the electromagnetic wave impedance interface formed by the rebar and concrete. Part of the reflected wave penetrates the tunnel’s surface and is received by R, and the other part is reflected again by the tunnel surface back to the rebar. This process is shown in Figure 2a.
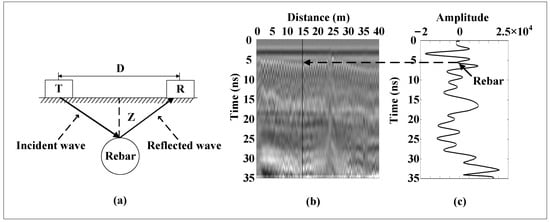
Figure 2.
(a) Principle of GPR detection of rebar in concrete. (b) The rebar shows a hyperbolic feature in the B-scan. (c) The black line corresponds to the A-scan in Figure 1b, where the reflection points of the rebar in the A-scan correspond to the hyperbolic features.
The electromagnetic wave emitted by GPR passes through the tunnel medium. The propagation velocity and attenuation coefficient of the wave are expressed as
where is the relative permittivity, is the electric conductivity and is the magnetic conductivity.
As the electromagnetic wave propagates from concrete with a low dielectric constant to the rebar with a high dielectric constant, the waveform of the reflected wave is changed. The reflection coefficient describes the reflection of an electromagnetic wave when it reaches an interface between media with different electromagnetic properties [18,21]. Therefore, the reflection coefficient can be used to analyze the characteristics of the medium. The reflection coefficient is expressed as
where, and are the angle of incidence of the electromagnetic waves and the angle of reflection of the electromagnetic waves, respectively, and and are the wave resistance of the two media, which are calculated as follows:
In the actual process of detection, the reflection coefficient can be approximately expressed as
The permittivity of the material has a significant role in determining the particular velocity of the electromagnetic waves. The electromagnetic wave starts from a transmitting antenna and travels through the material at a velocity. The wave spreads outward and propagates downward until it hits an object with different electrical properties from the surrounding medium, and thus it is scattered from the object and detected by the receiving antenna. The interval between the propagation of the wave from the transmitting antenna to the receiving antenna is called the propagation time t:
where d is the distance from the transmit antenna to the receiving antenna, z is the depth between the ground surface and the reflective object and v is the speed of propagation of an electromagnetic wave in a medium, which can be expressed as
where c is the velocity of electromagnetic wave propagation in air, taken to be 0.300 m/ns.
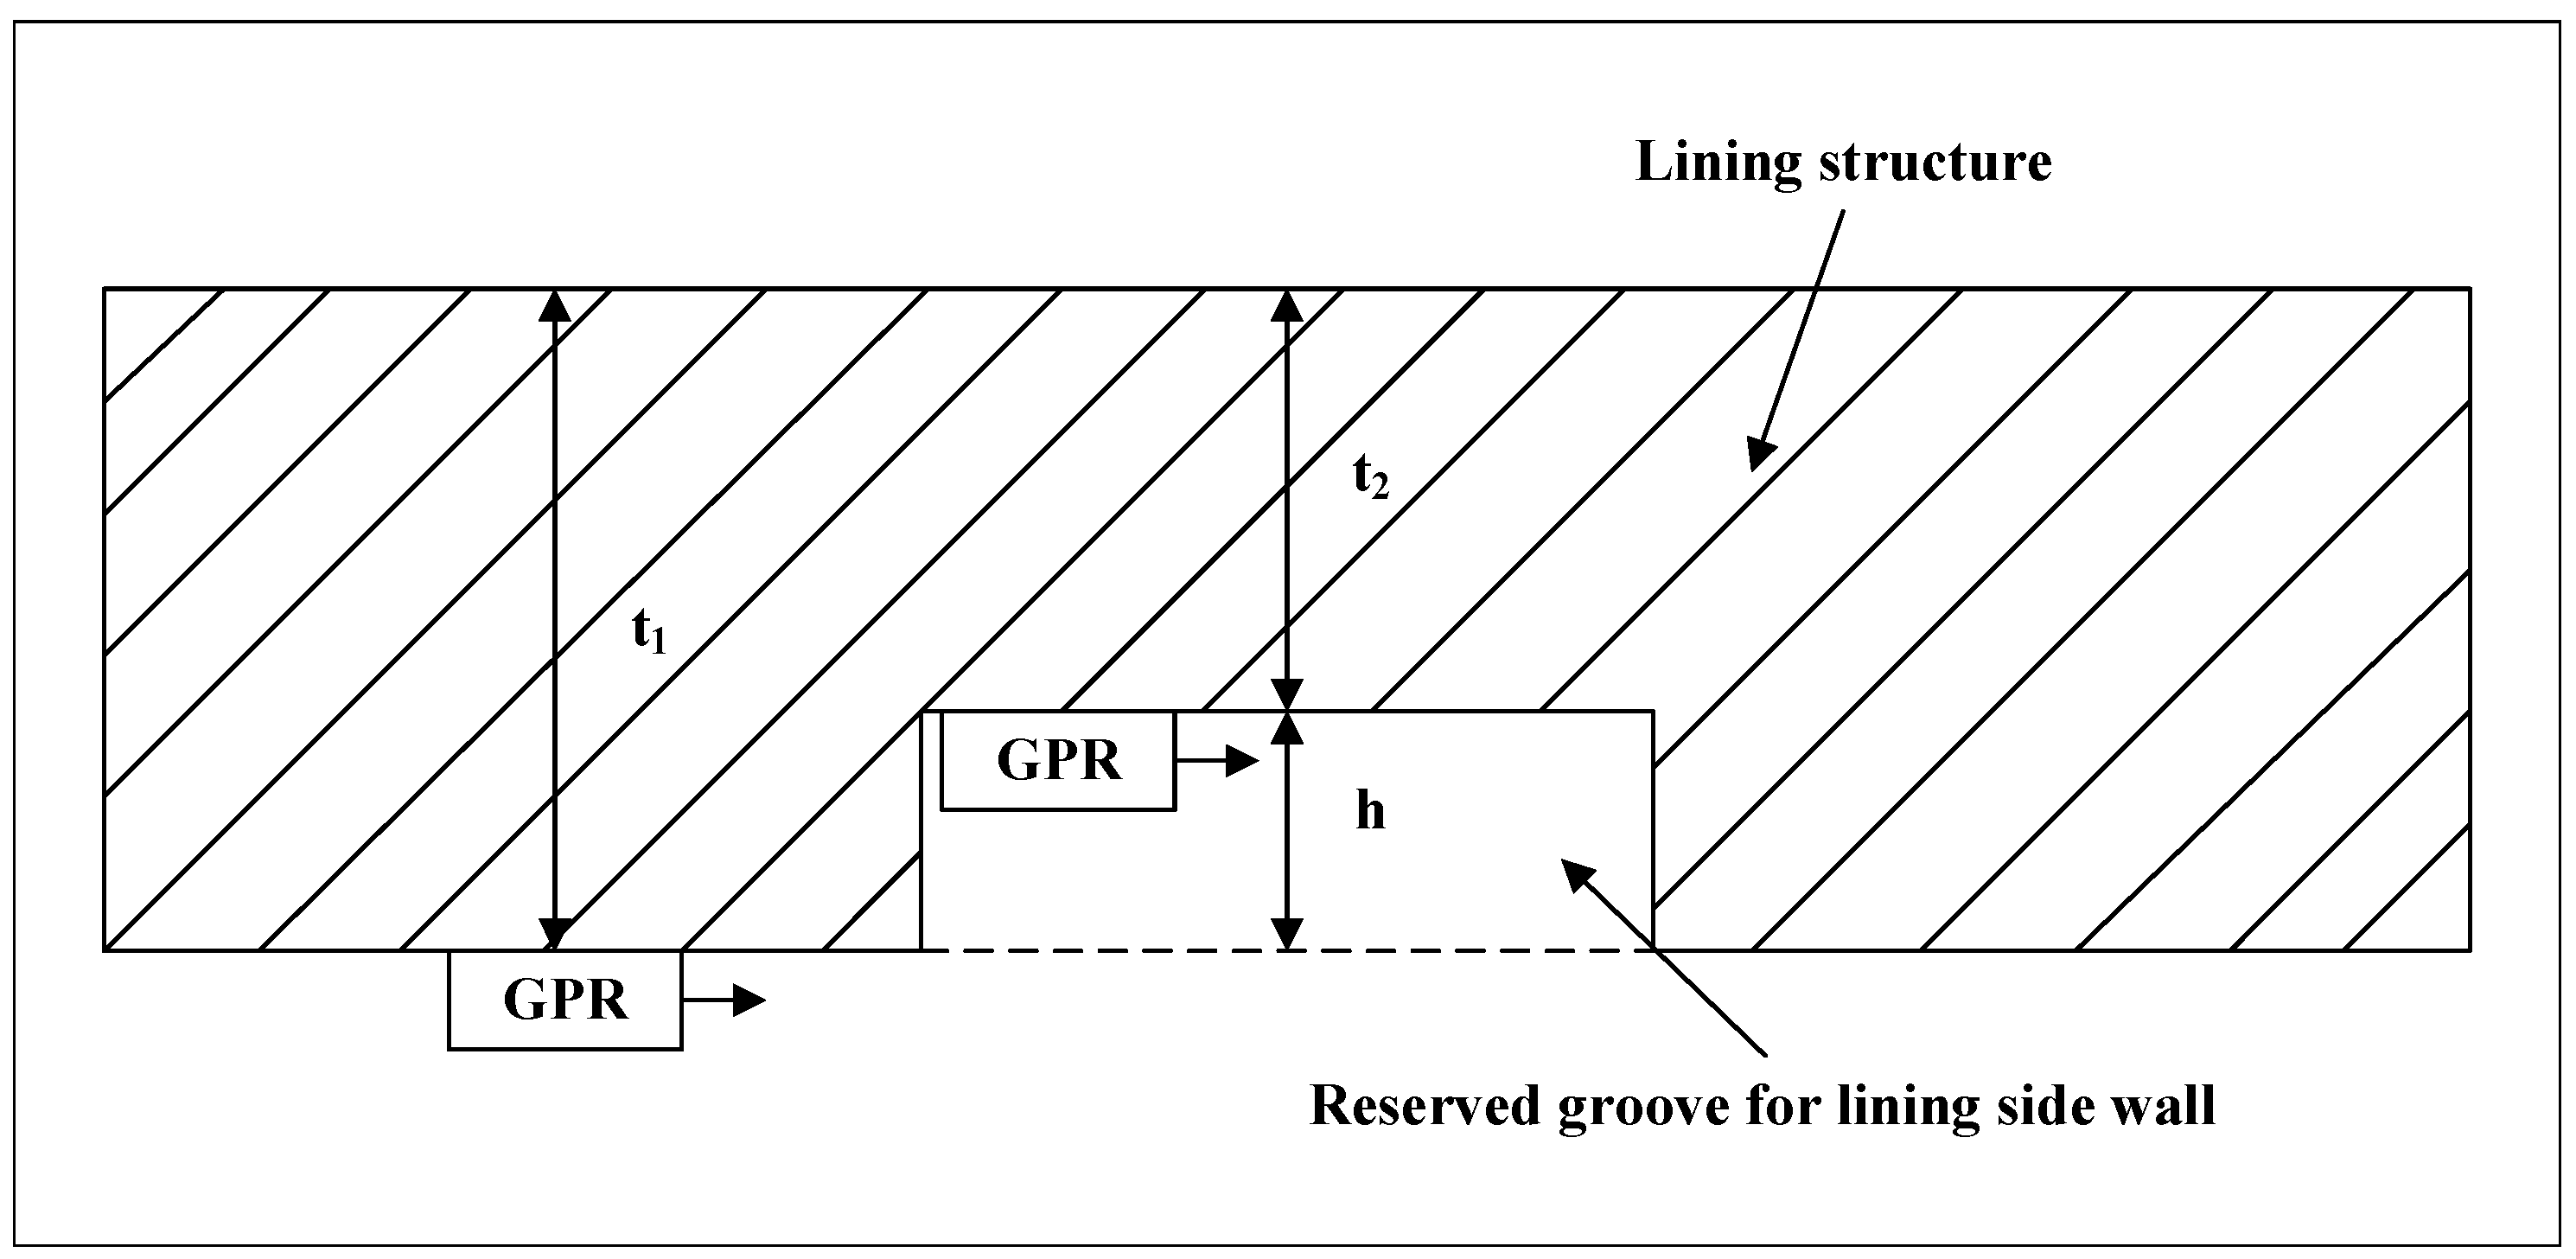
In tunnel lining structures, the calibration of the dielectric constant of concrete can be shown in Figure 3. In Figure 3, the dielectric constant of the concrete can be calculated by measuring the propagation time of the electromagnetic wave throughout the tunnel’s lining, the time for the electromagnetic wave to reach the bottom of the lining structure via the groove reserved for the lining sidewall and the depth of the groove reserved for the lining side wall.
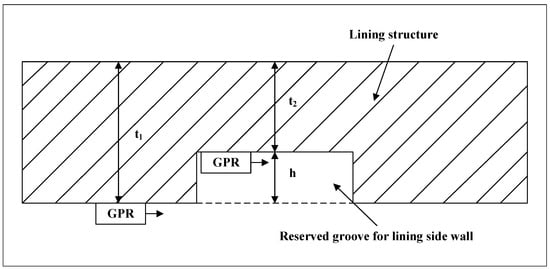
Figure 3.
Measurement of the dielectric constant of concrete within a tunnel’s lining structure.
The dielectric constant can be expressed as
where is the propagation time of the electromagnetic wave in the lining, is the propagation time of the electromagnetic wave from the lining’s reserved side wall groove to the lining bottom and h is the depth of the lining’s reserved side wall groove. By collecting data from the tunnel lining, the dielectric constant of the concrete was calculated to be 6.4. Subsequently, the speed of propagation of the electromagnetic wave in the concrete was obtained to be approximately 0.120 m/ns according to Equation (6).
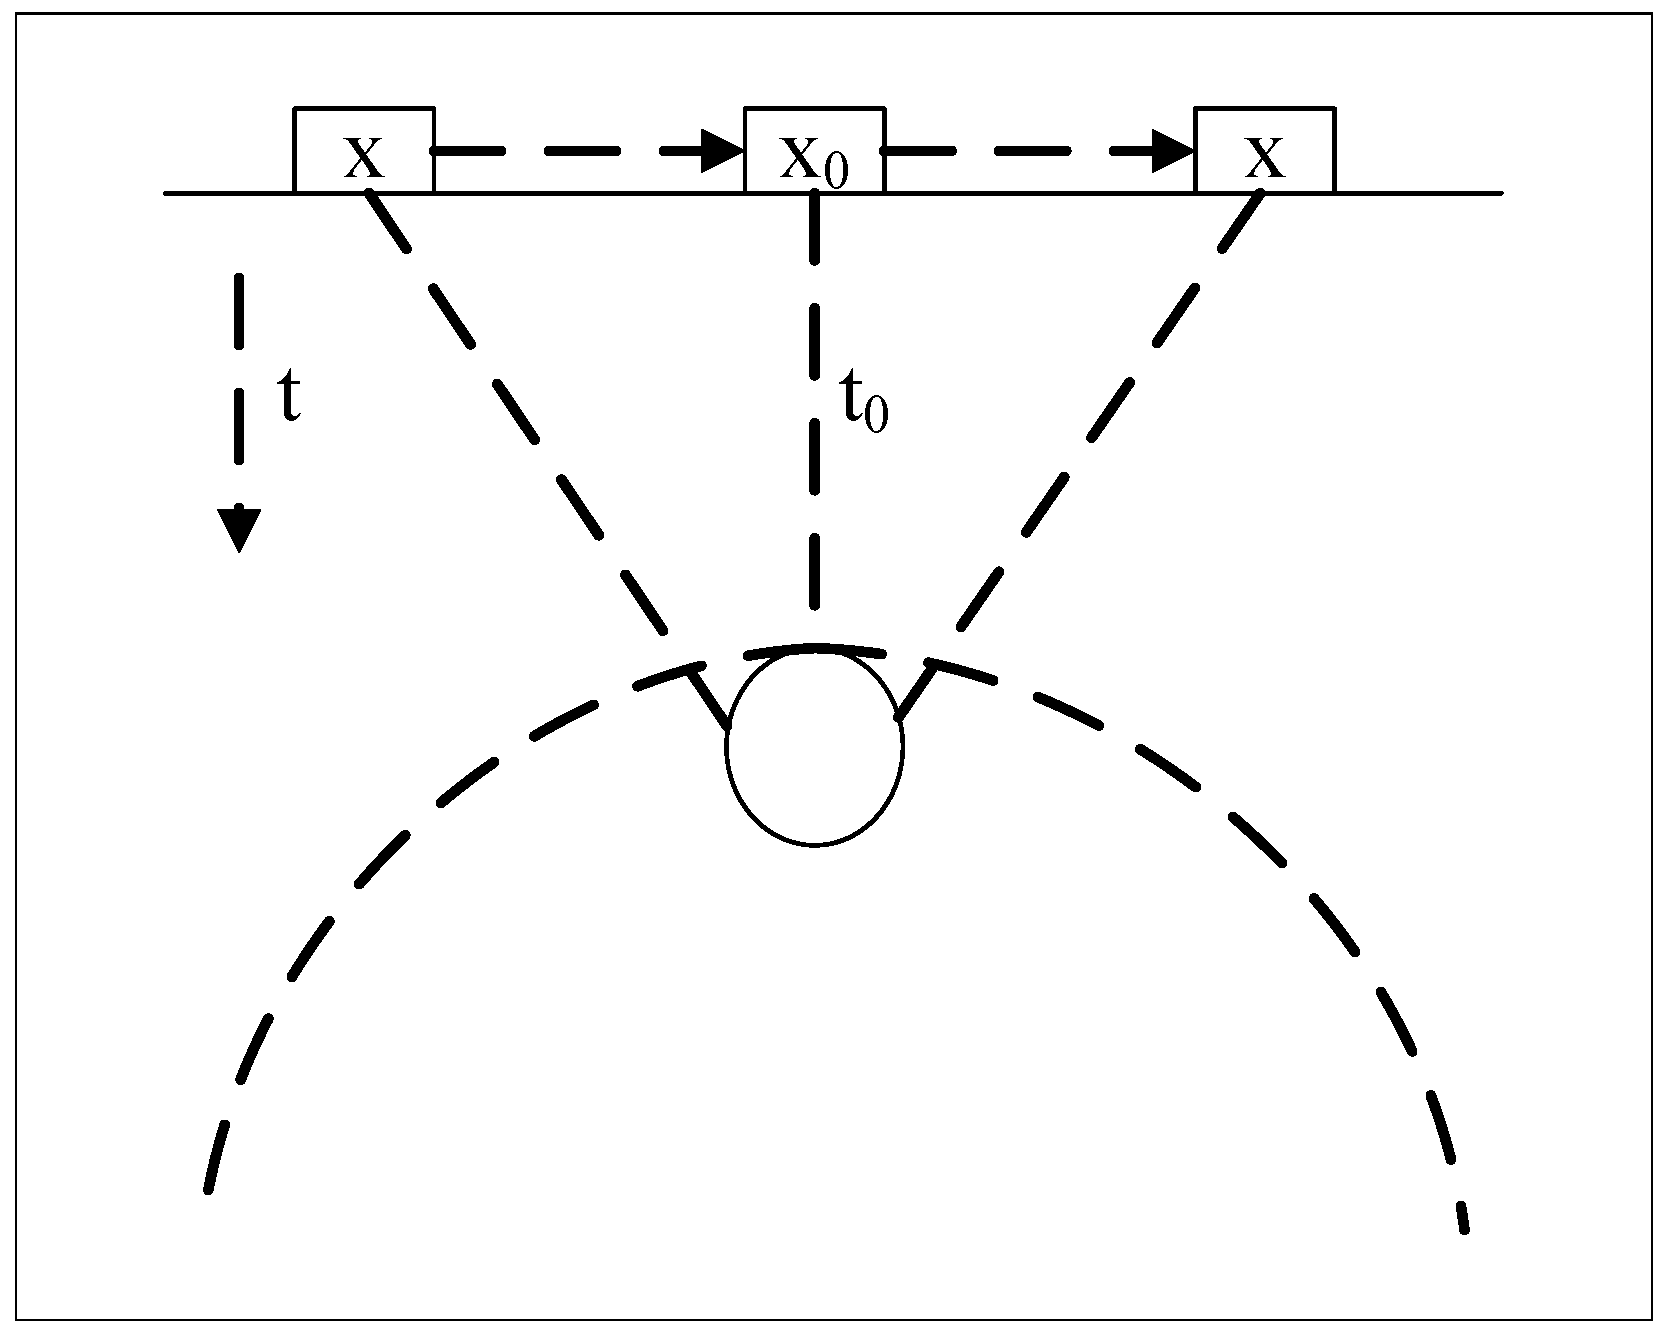
The two-way travel time and electromagnetic wave distance from the receiving antenna to the rebar will alter as the GPR proceeds along the survey line direction. Each A-scan contains the reflected signal from the rebar. The reflected signal from the rebar then takes on a curved shape when each A-scan is ordered and concatenated in a temporal sequence to generate a B-scan. The hyperbolic shape of the rebar is one of the important features in identifying rebar. The process of hyperbolic formation of rebar is shown in Figure 4.
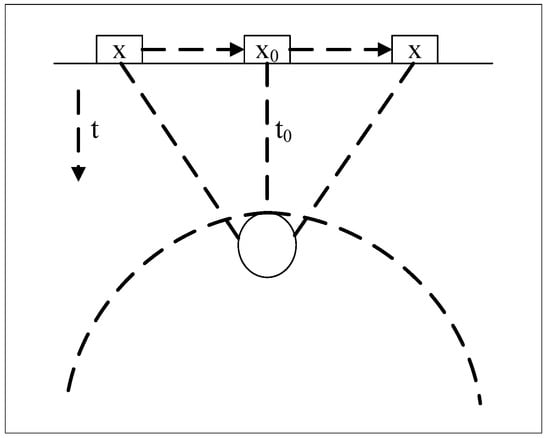
Figure 4.
As the GPR moves, the rebar forms a hyperbolic shape.
GPR emits electromagnetic waves from a horizontal position. The electromagnetic waves are reflected as they propagate from the concrete to the rebar. The receiving antenna receives the return signal, while the receiving signal device feeds back the two-way travel time. This process is continuously repeated and recorded by the recording instrument, which eventually forms the hyperbolic of the rebar in the B-scan as shown in Figure 2b. In the GPR image, the hyperbola of the rebar can be expressed as
where x is the initial position when the GPR transmits electromagnetic waves, t is the start of propagation time, is the position when the transmitting antenna is perpendicular to the rebar, is the two-way propagation time to the rebar, v is the propagation speed of electromagnetic waves in the medium and r is the radius of the rebar.
The short-term mean value of the A-scan data in the time window should be stable so that the reflected wave can correctly reflect the underground target. Therefore, we performed a DC offset removal process for the A-scan. The DC offset removal can be expressed as
where is the sample point data before processing, is the sample point data after processed, n is the number of samples in the A-scan and N is the total number of samples in each A-scan.
Equations (1) and (4) lead to the following conclusions: When the wave is transmitted from a low dielectric constant medium to a high dielectric constant medium, the phase of the reflected wave is opposite to the incident. The electromagnetic wave will propagate in a single medium with exponential attenuation. The denseness of the medium is inversely proportional to the attenuation of the radar wave. Therefore, the reflected waveform of the concrete will be attenuated according to a certain ratio. Then, the electromagnetic wave propagates from the concrete to the peak point where the rebar appears. The phase of the peak point is opposite to the incident wave phase, and the total reflection of the rebar prevents part of the electromagnetic wave from propagating, causing the peak point to exhibit a smaller amplitude in the A-scan than the adjacent peak point amplitude of the same phase. The peak point is shown in Figure 2c.
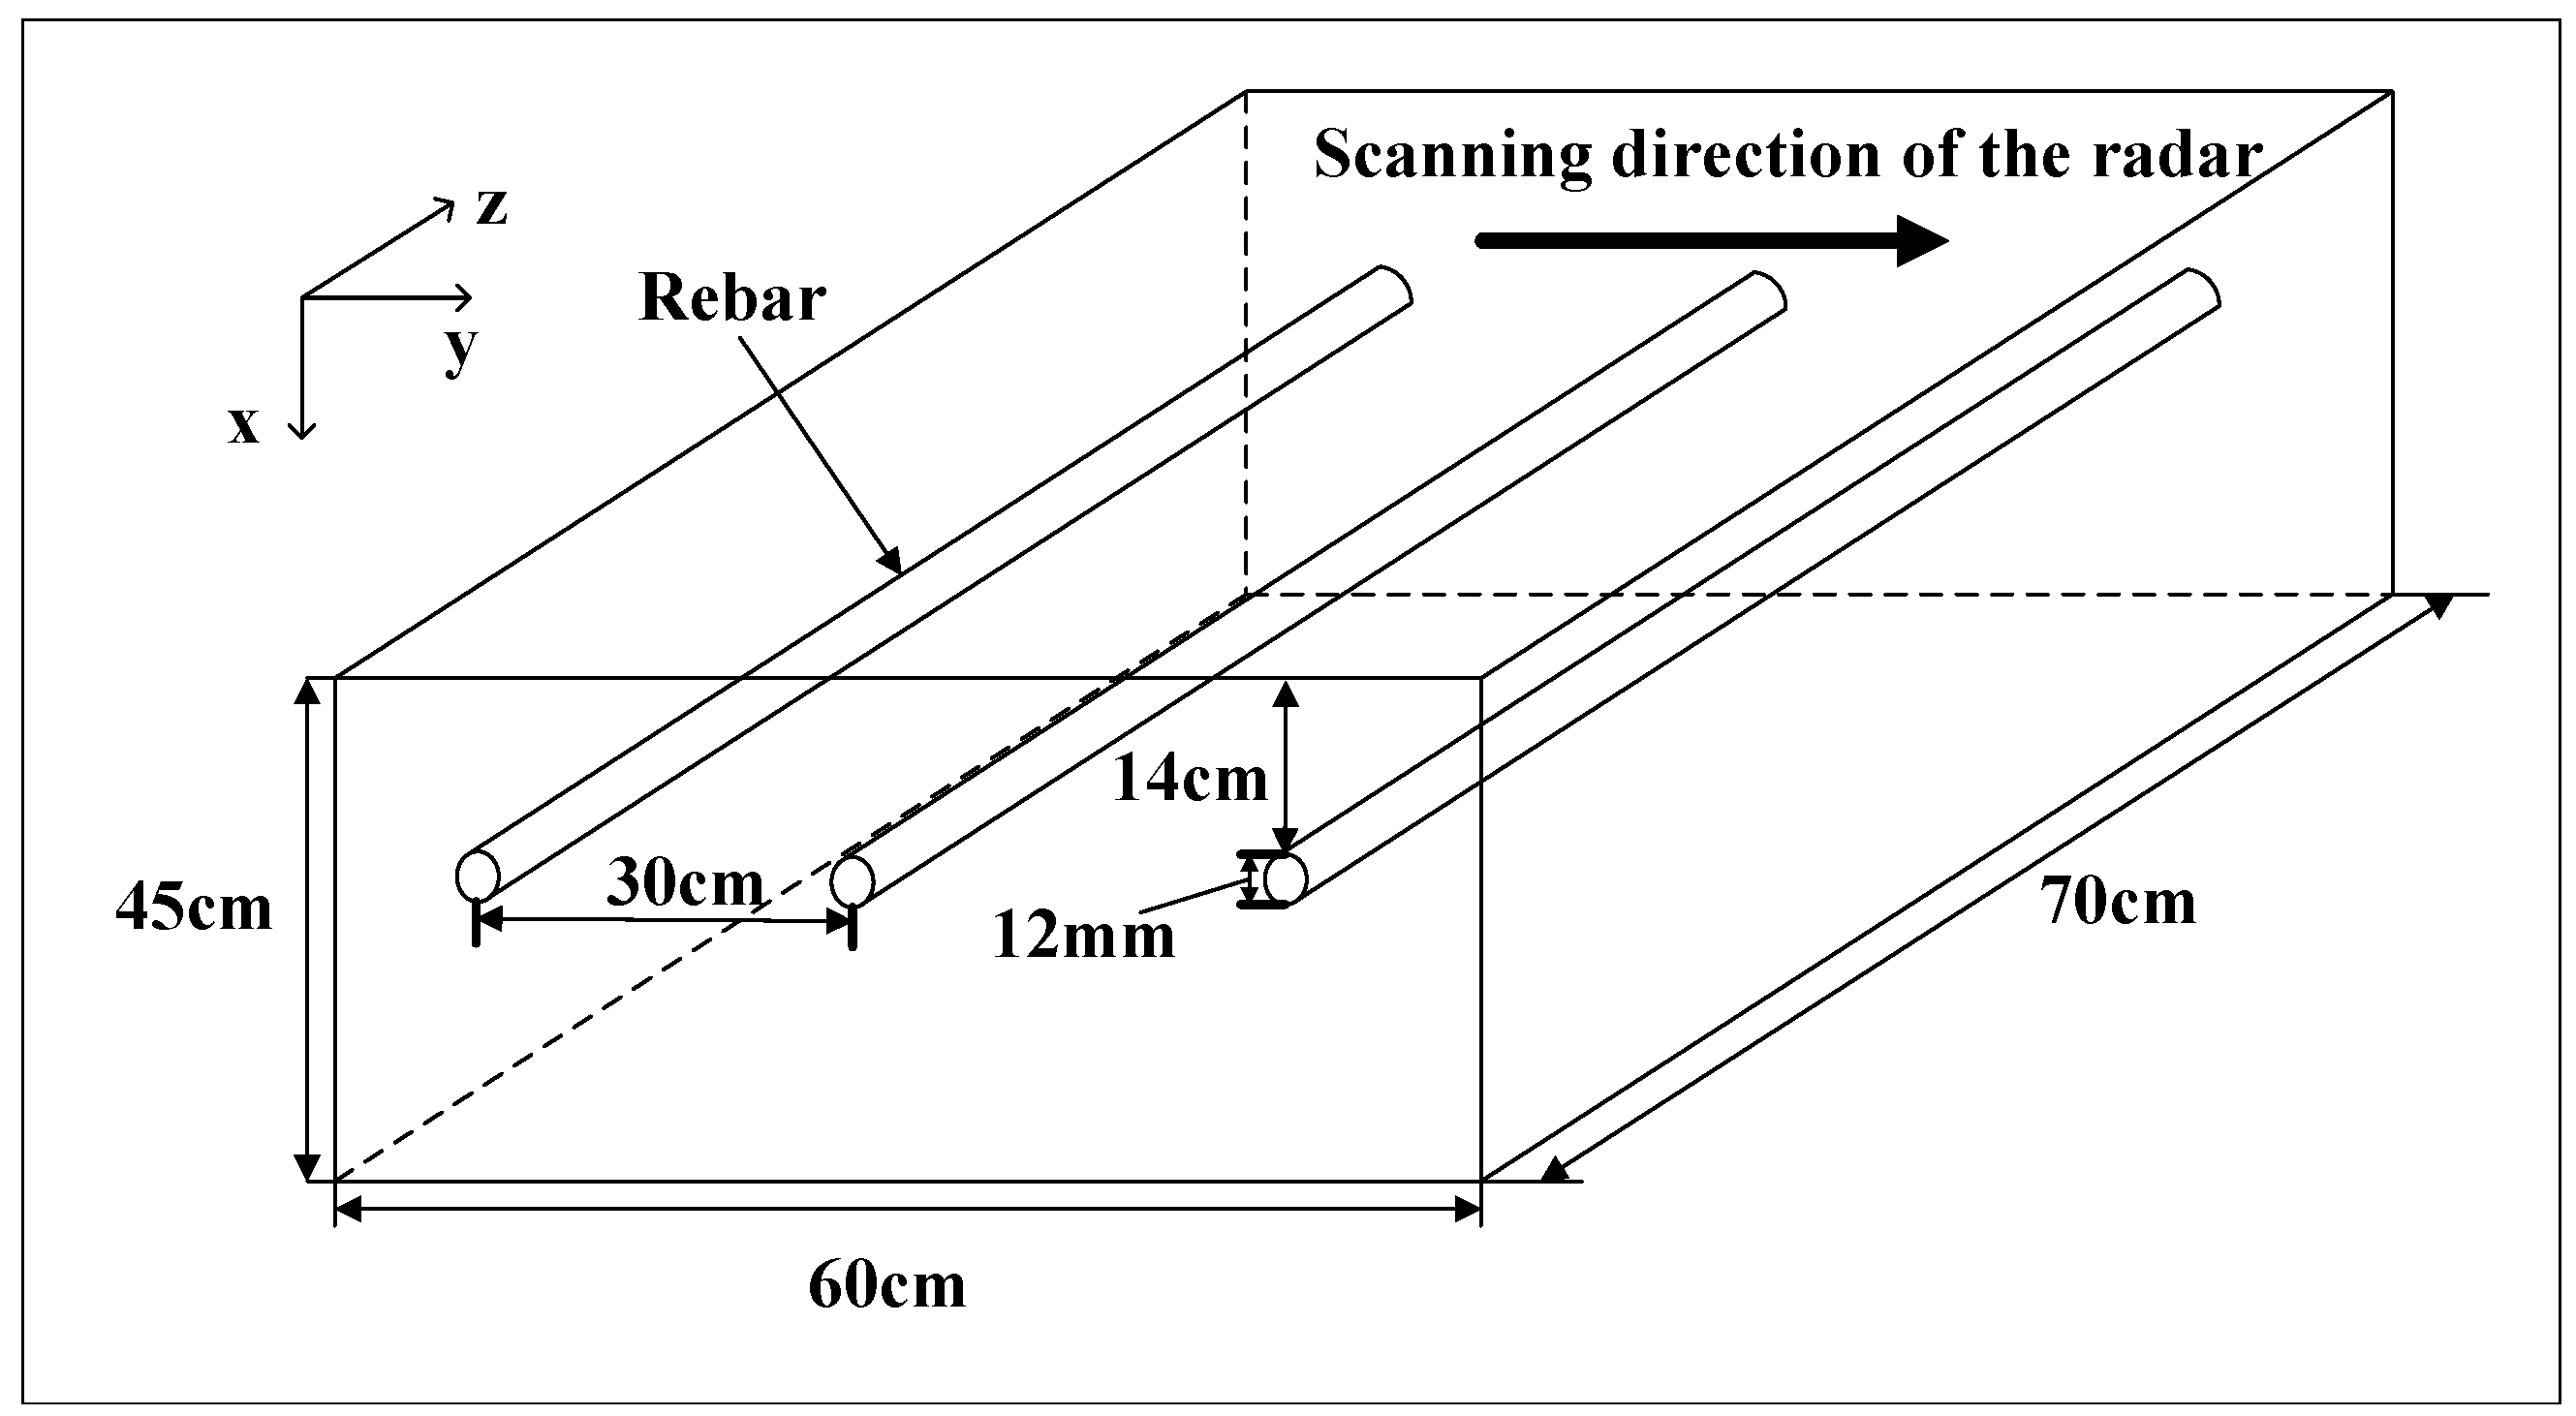
To further understand the variation of rebar within the tunnel’s lining structure in the A-scan and B-scan, gprMax was used to perform a forward simulation of the tunnel’s lining structure containing rebar. In this case, the designed tunnel lining structure model is shown in Figure 5.
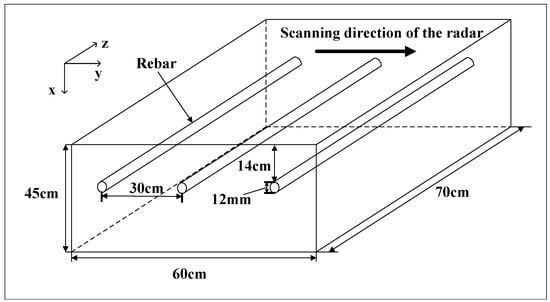
Figure 5.
Simulation of a model of a tunnel’s lining structure containing rebar.
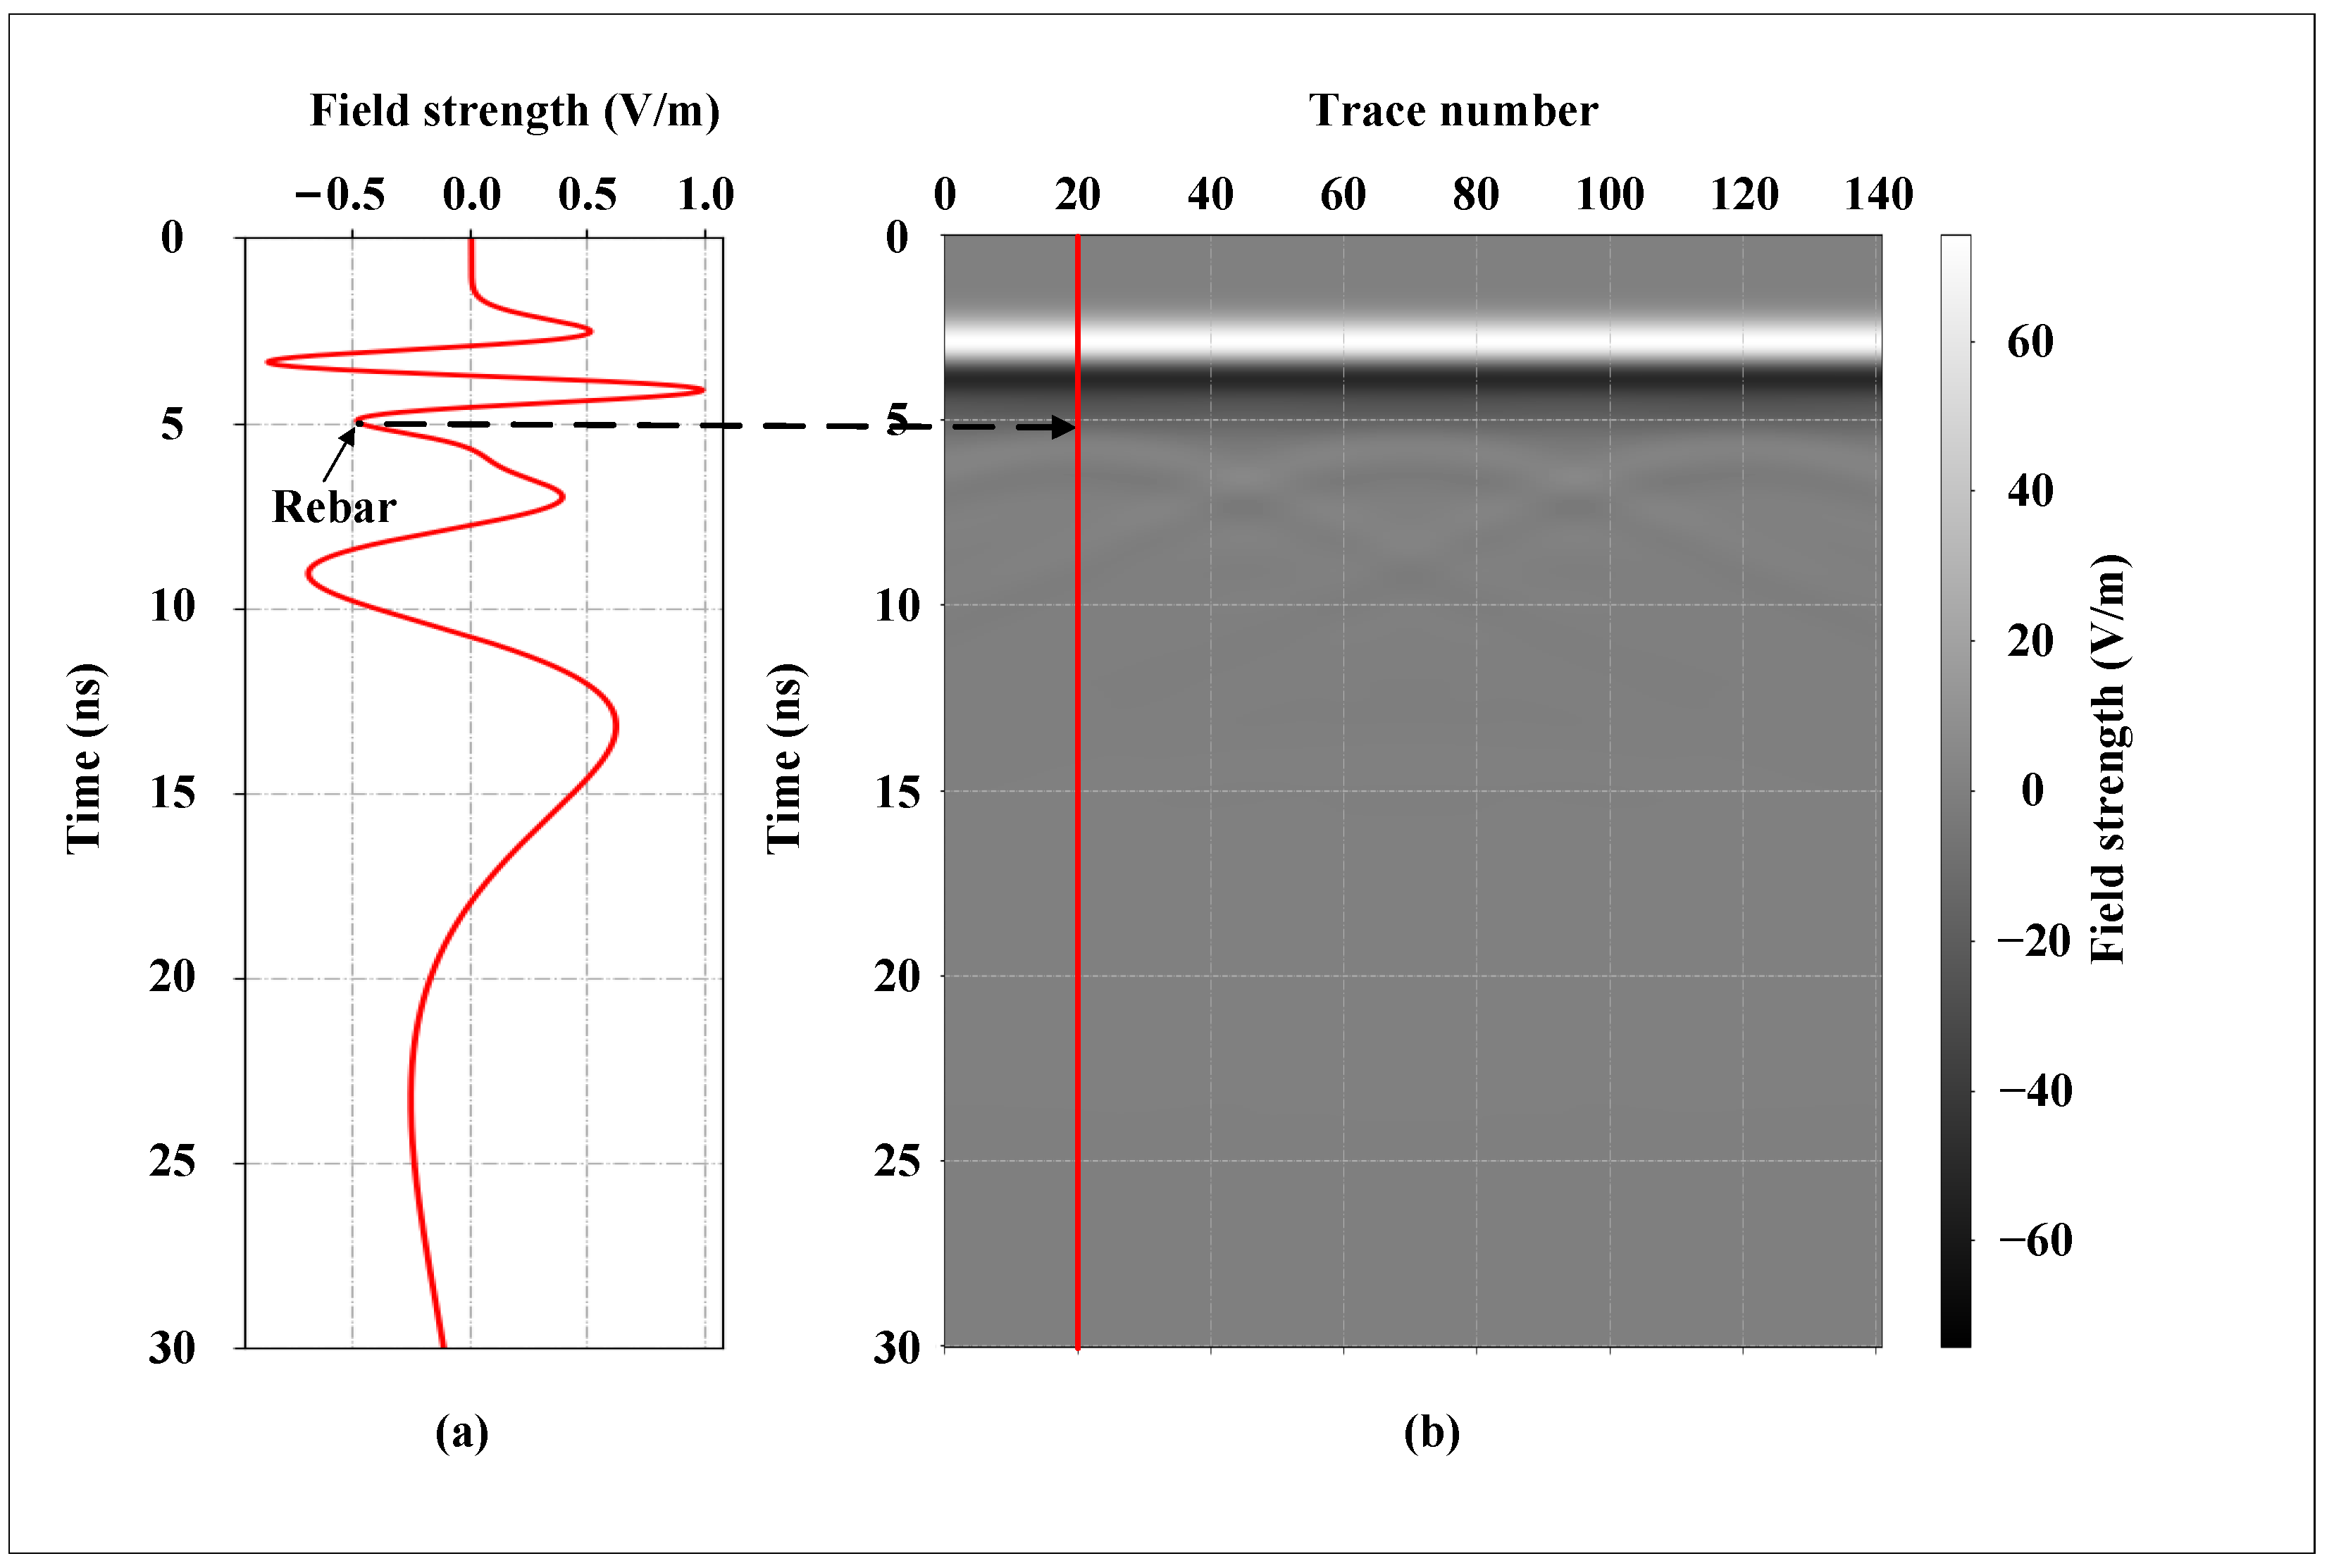
The rebar within the model was not set up as a mesh structure, as the detection target was circumferential rebar within the tunnel’s lining structure. In Figure 5, the lining structure was set to be 60 cm long, 45 cm wide and 70 cm thick, and the diameter of the rebar within the lining structure was set to 12 mm. GPR was scanned in the y-axis direction, and the results of the forward simulation are shown in Figure 6. At the simulated electromagnetic wave frequency of 400 MHz, the hyperbolic feature of the rebar was not clearly recognizable in the B-scan, as shown in Figure 6b. The peak point at the location of the rebar was in the opposite phase of the incident wave, as shown in Figure 6a. This peak point had a smaller amplitude than the amplitude of the adjacent peak point in the same phase.

Figure 6.
(a) Simulated A-scan waveform attenuation plot containing the rebar signal. (b) B-scan simulation diagram of rebar within the tunnel’s lining structure.
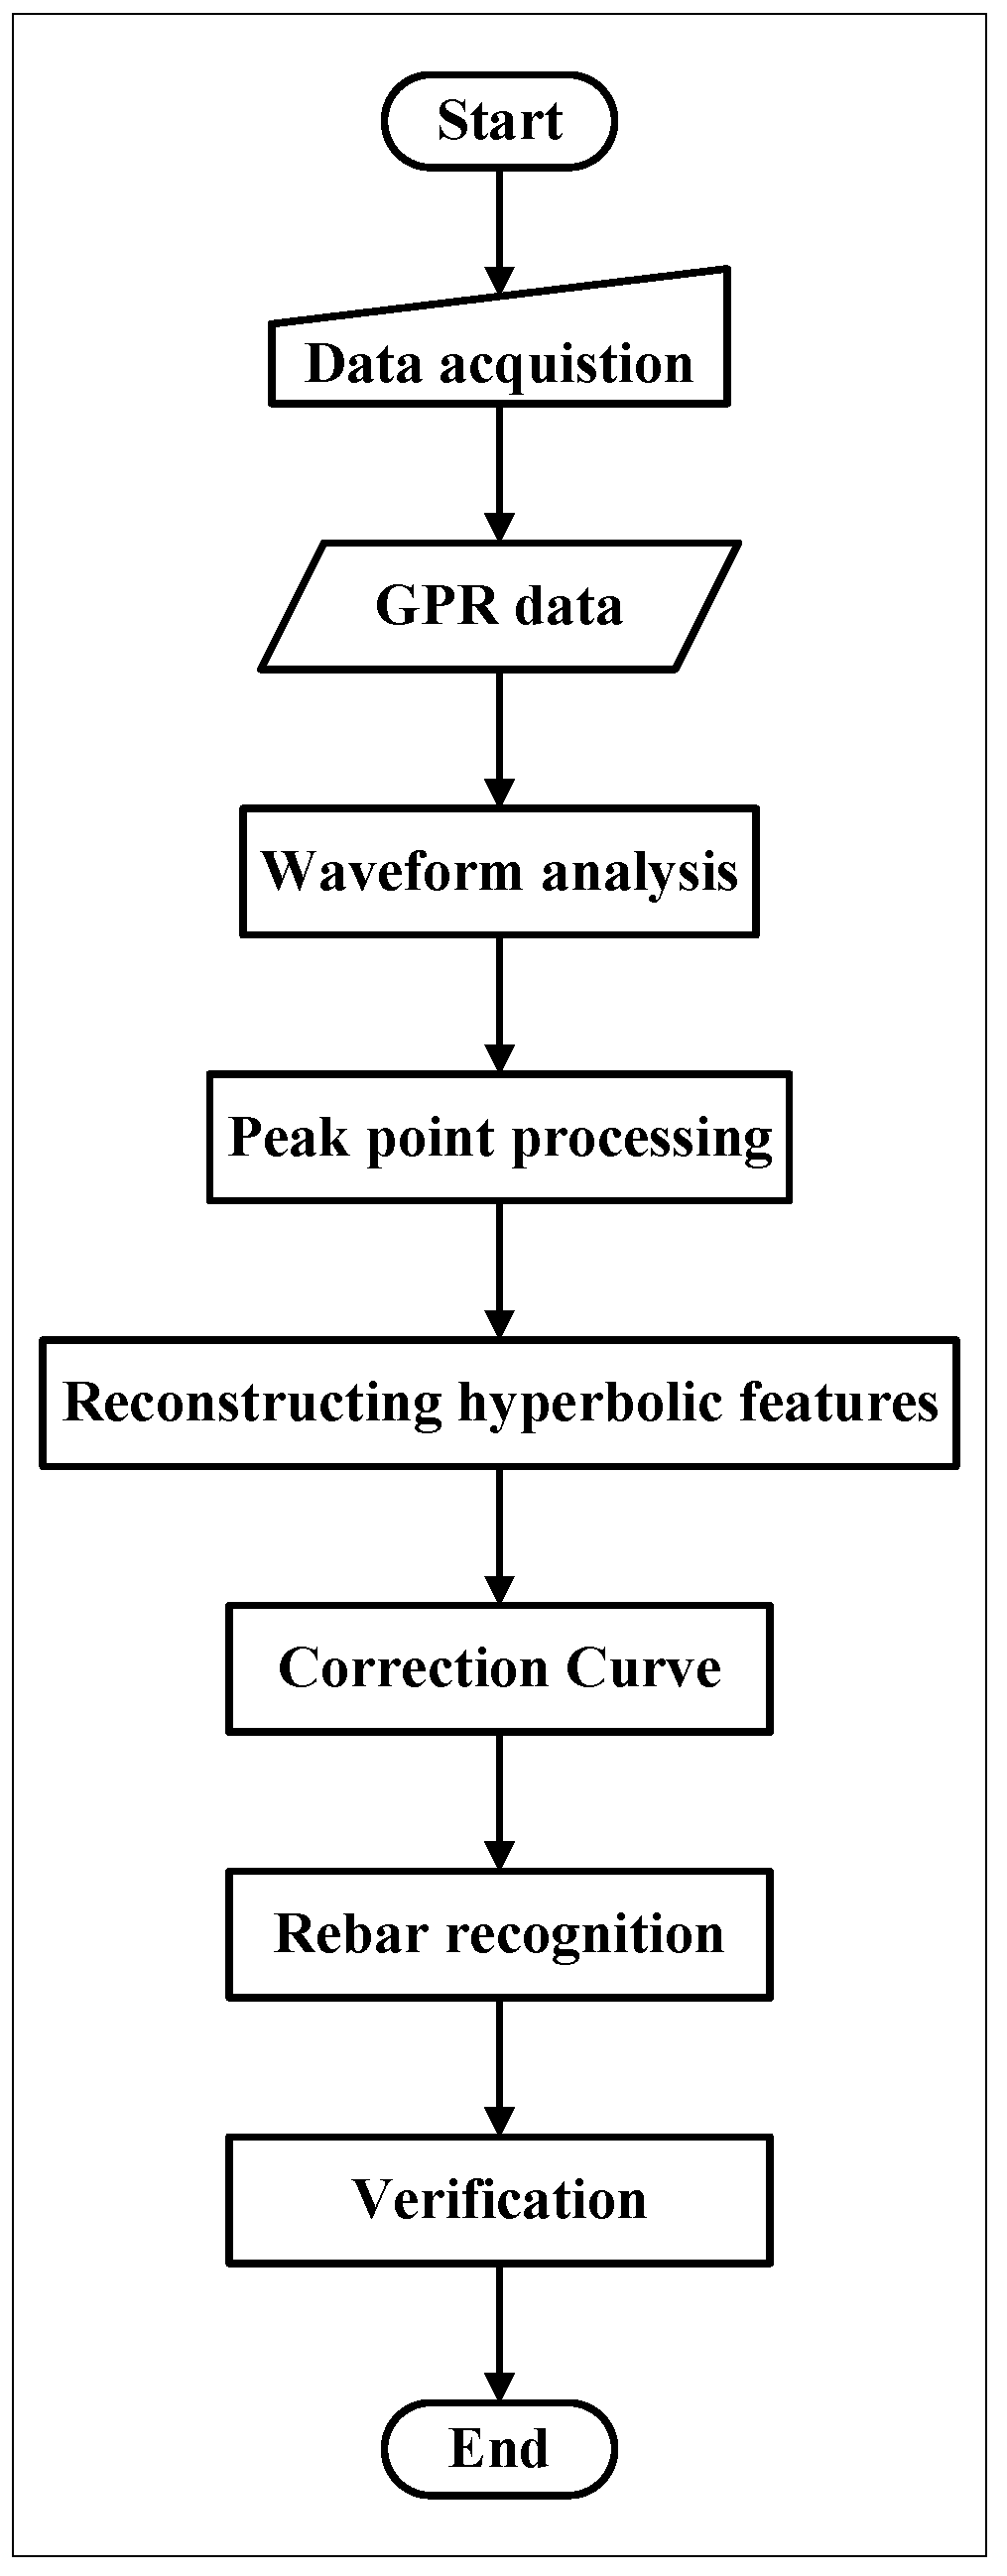
The workflow of this paper is shown in Figure 7. GPR was first used to continuously scan along the lining structure inside the tunnel and obtain data containing the rebar’s information. The GPR data were then not processed to ensure that some of the rebar information was valid, and the experimental data used were the original data collected. Subsequently, the A-scan signal data were extracted, and the rebar signal was located and recognized in the A-scan at a peak point based on the path, amplitude, phase and intensity of the reflected wave as it propagated through different media due to changes in the electromagnetic properties of the media. The phase of this peak point was the opposite of the phase of the incident wave, and its exhibited amplitude was smaller than that of the adjacent peak point in the same phase. The hyperbolic shape of the rebar was reconstructed in the B-scan from these peak points that contained the rebar information features in the A-scan. Since the location information of the rebar was not recorded in some of the A-scan signals, it is assumed in this paper that the difference between the hyperbolic travel times of the rebar appearing in adjacent A-scans will not exceed a certain range based on the in-phase axis characteristics of the medium in the B-scan. If the difference exceeds a set threshold, then it is replaced by the time of occurrence of the peak point in the adjacent A-scan containing the rebar signal. This method makes a correction to the reconstructed hyperbola in the B-scan, allowing the hyperbolic shape of the rebar to be presented. Finally, the method was applied to the Hosa Tunnel. The rebar was recognized and located in the A-scan, and the hyperbolic shape was reconstructed in the B-scan at the 400 MHz antenna’s main frequency.
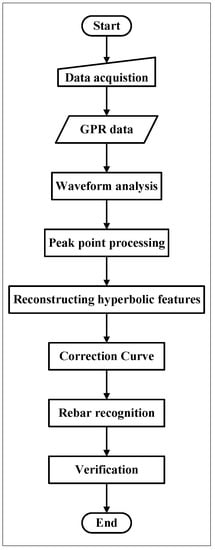
Figure 7.
The workflow of this study.
This paper uses data collected with the GSSI SIR 30 and a 400 MHz shielded antenna, and the data were only processed with a DC offset operation with the aim of avoiding the effective signal of the rebar being filtered. The electromagnetic waves were sent at a rate of 0.120 m/ns, with a sample time frame of 35 ns due to the design thickness of 700 mm in the second lining of the tunnel. The continuous scanning data collecting mode was chosen. It was tuned to 64 Hz for the radar scanning frequency. The radar was calibrated to sample at 512 samples per second.
3. Experimental Study
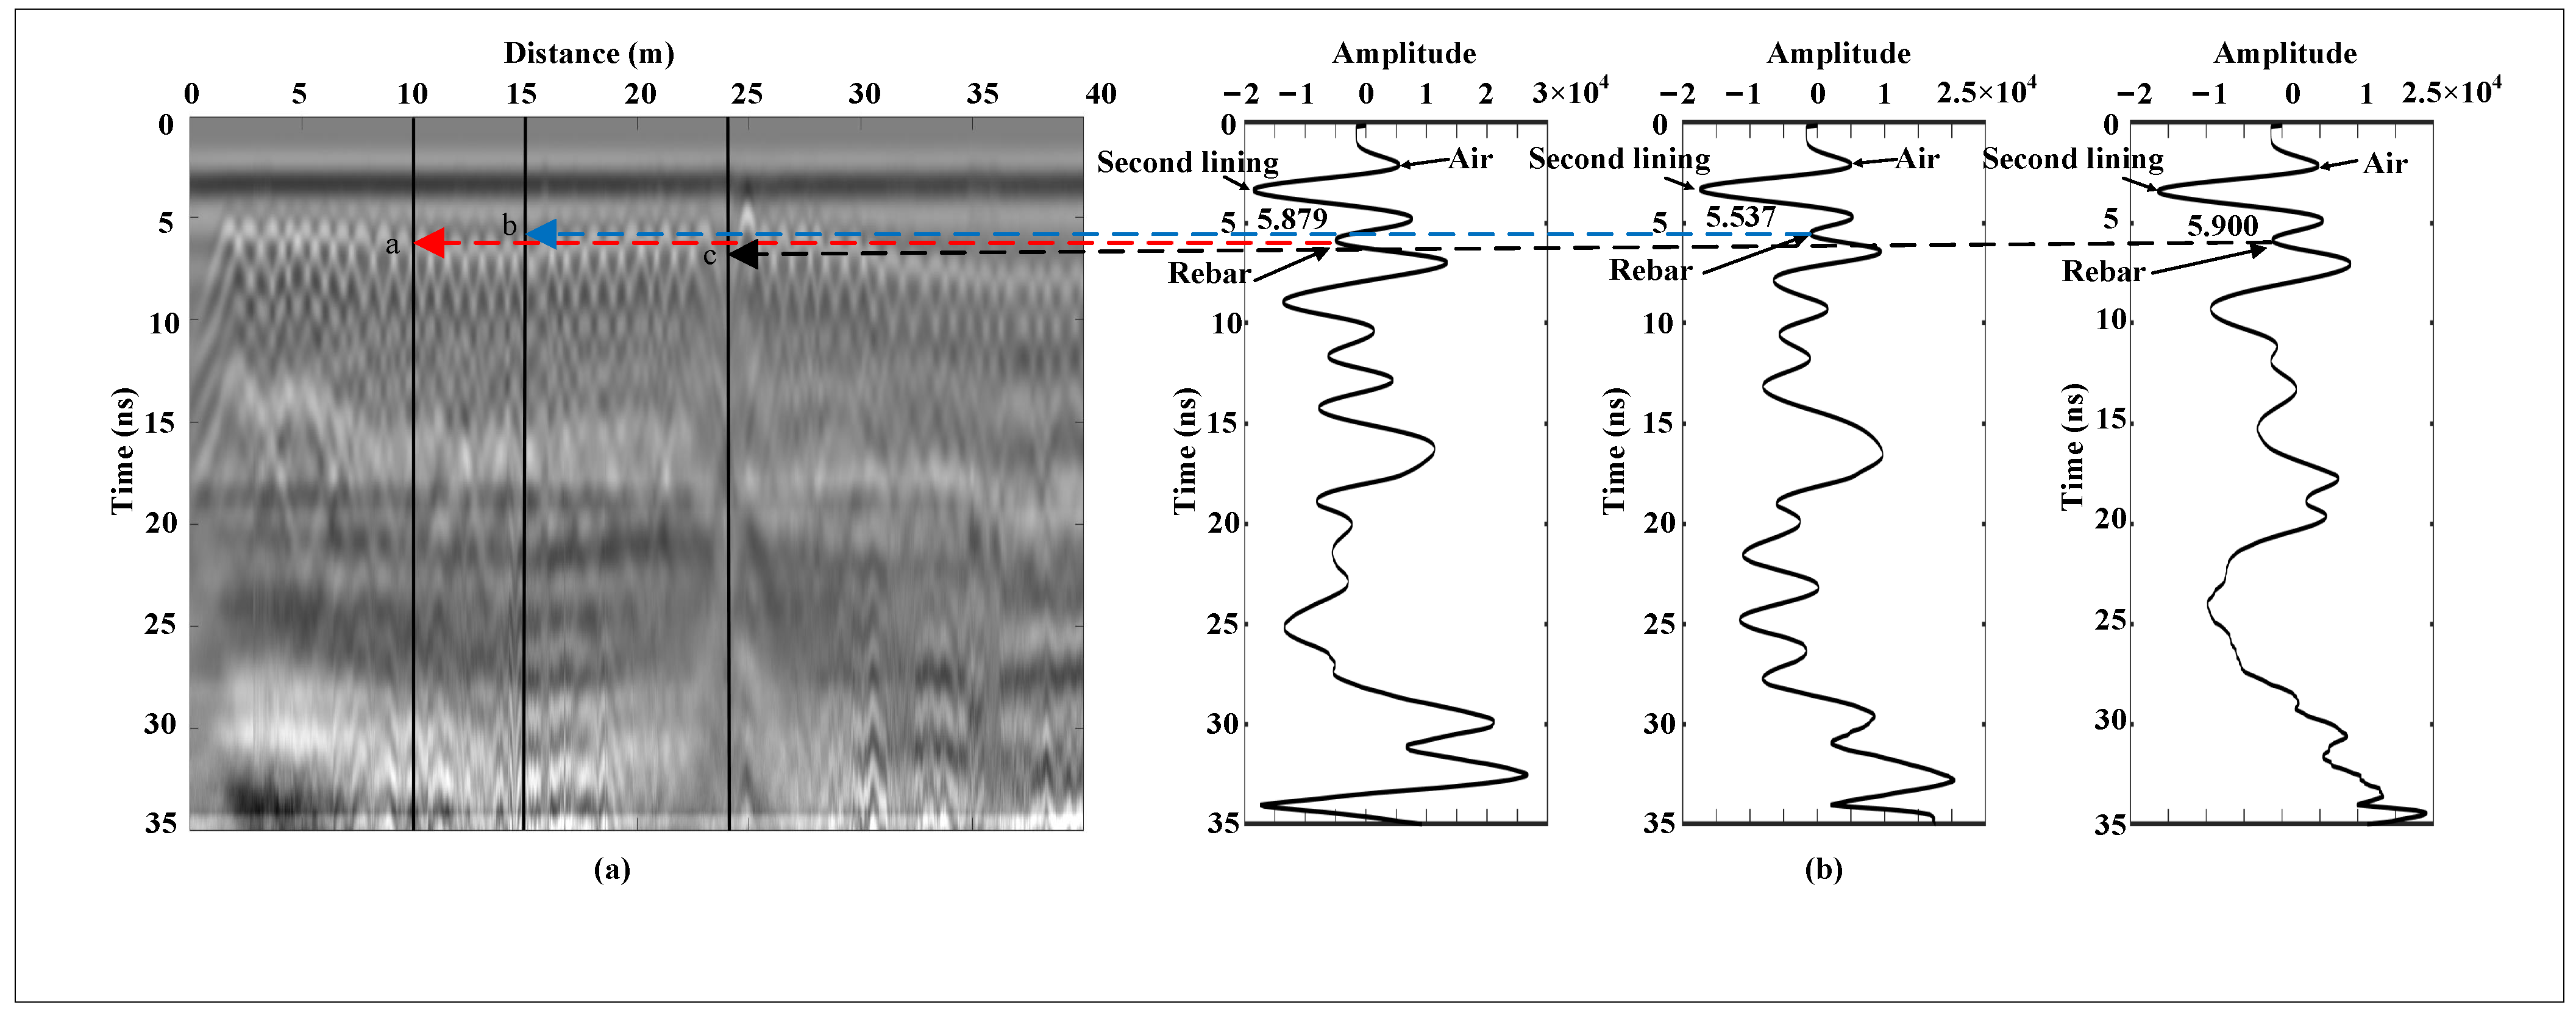
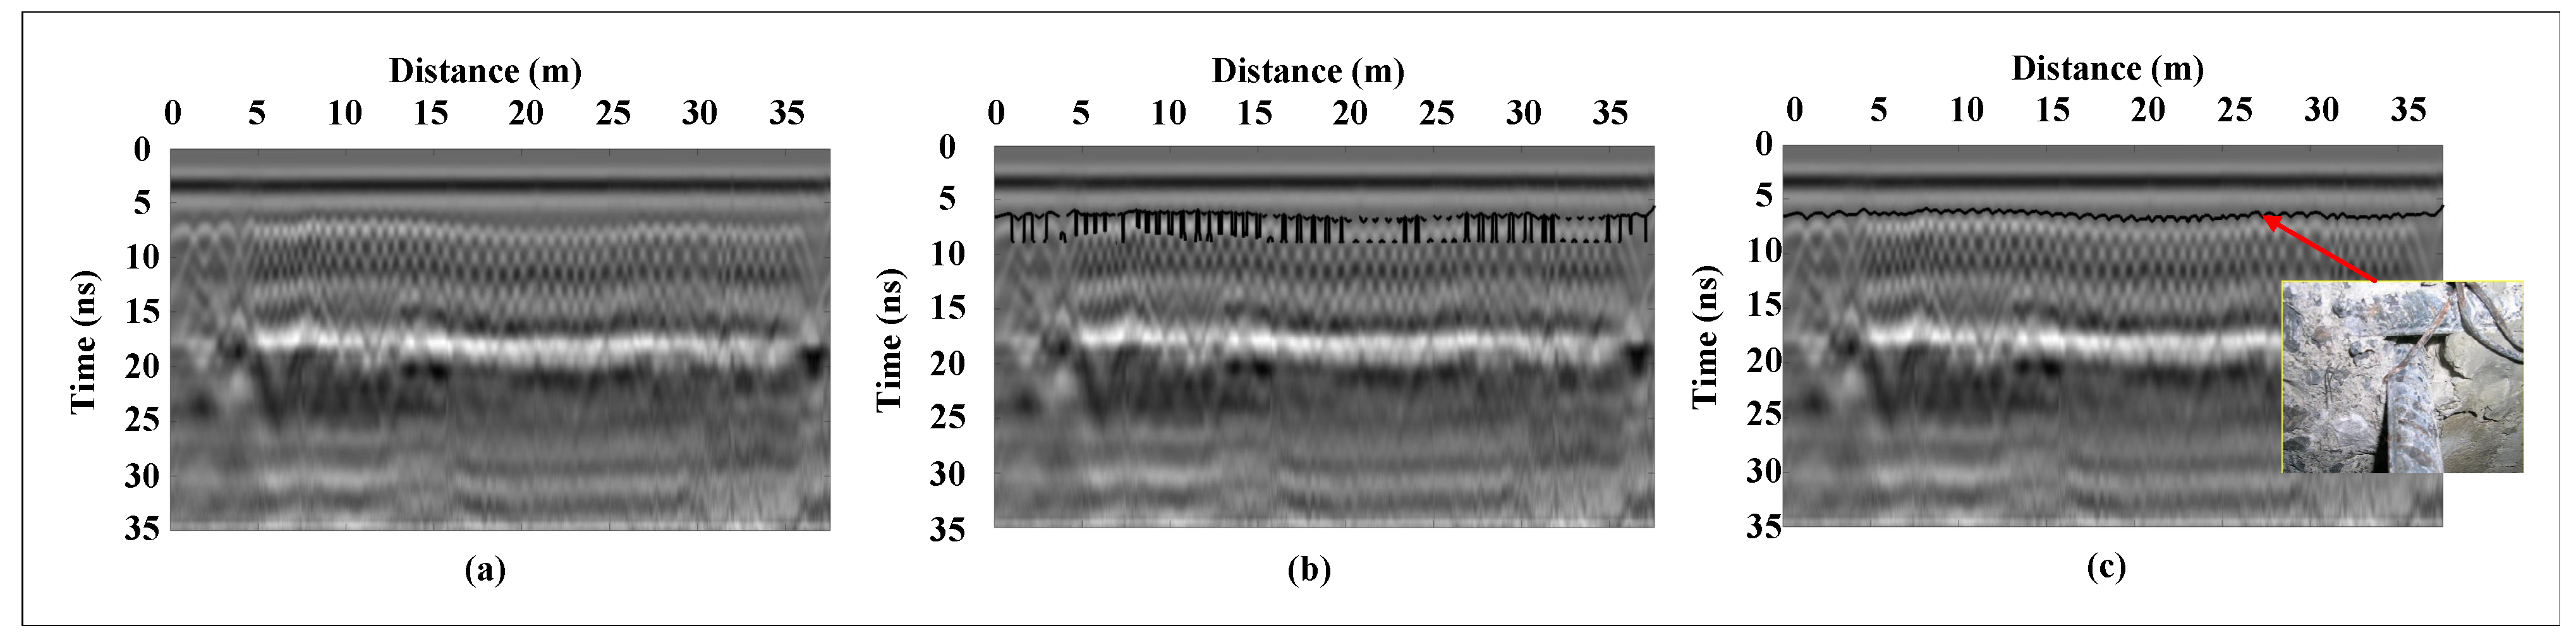
Due to the electromagnetic properties of the rebar, the part of the electromagnetic wave was totally reflected by the rebar, which resulted in the amplitude of the peak point being smaller than the amplitude of the adjacent peak points of the same phase. Therefore, the waveform variation of each A-scan could provide a basis for determining the rebar signal, as shown in Figure 8.
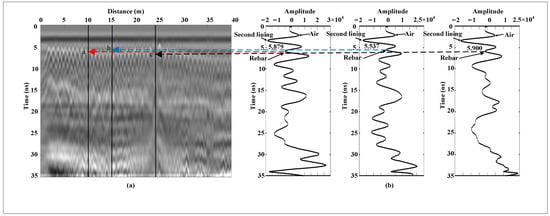
Figure 8.
(a) B-scan with rebar’s hyperbolic features. (b) Waveform attenuation diagram at the letters a, b and c, where the reflected signal of the reinforcement corresponds to the hyperbolic feature appearing in the B-scan.
When GPR detects the tunnel, electromagnetic waves first enter from the air to the second lining. The dielectric constant of air is approximately equal to 1, and the dielectric constant of concrete is approximately equal to 6–9 [18]. According to Equation (4), the phase of the reflected wave at the air–lining interface is opposite that of the incident wave. Then, the electromagnetic wave propagates in the concrete to the rebar. The dielectric constant of the rebar is much larger than that of the concrete, and the rebar totally reflects part of the electromagnetic wave. As a result, the reflected waves from the concrete change, as shown in Figure 8b. This variation is because the dielectric constant of the rebar is considered to be infinite [13], whereas the dielectric constant of concrete is 6–9. Therefore, according to Equations (1) and (4), the reflection coefficient is negative when the electromagnetic wave propagates from the concrete to the rebar. Electromagnetic waves propagating in concrete are interfered with by the rebar, causing the reflected waves from the concrete to fail to attenuate at a certain rate and to show up in the A-scan as peaks with the opposite phase of the incident wave having a smaller amplitude than the adjacent peaks. These peak points are simultaneous for the hyperbolic shape of the rebar, as shown in Figure 8a.
According to these peak points, the hyperbolic shape of the rebar is reconstructed in the B-scan, as shown in Figure 9a. In Figure 9a, the reconstructed curve reflects the hyperbolic feature of the rebar, but discontinuities appear in some regions. Therefore, the A-scan was extracted from the discontinuous regions, as shown in Figure 9b. The reflection signal of the rebar was not detected in these regions, which is the reason for this phenomenon.
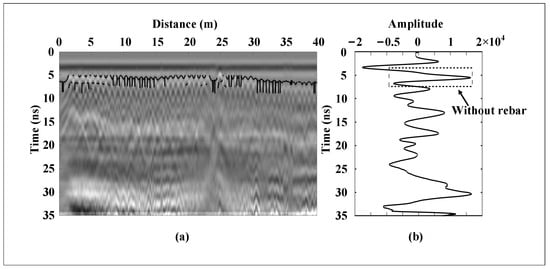
Figure 9.
(a) The hyperbolic shape of the rebar after reconstruction in the B-scan. (b) Waveform attenuation diagram for the missing rebar hyperbolic shape.
A correction method was used to solve the problem due to discontinuities in the reconstructed rebar hyperbolas, due to the phenomenon that the medium in the B-scan would exhibit an in-phase axis characteristic. Therefore, it was assumed that the difference between the appearance times of the medium signals in the adjacent A-scan would not exceed a certain threshold. The threshold value k is expressed as
where is the two-way travel time of the rebar signal in the ith A-scan and is the average of the two-way travel times of the rebar signals in all A-scans.
This method is performed by making a difference between adjacent data and comparing them with 20% of the mean value, where the comparison value is derived from several experiments. If this difference is greater than 20% of the mean value, then it is replaced by the value of the adjacent data. The effect of the correction is shown in Figure 10. On the one hand, the corrected curve reflects the curve feature of the rebar, and on the other hand, the corrected curve indicates that the rebar was located in the 5–7 ns region in the B-scan.
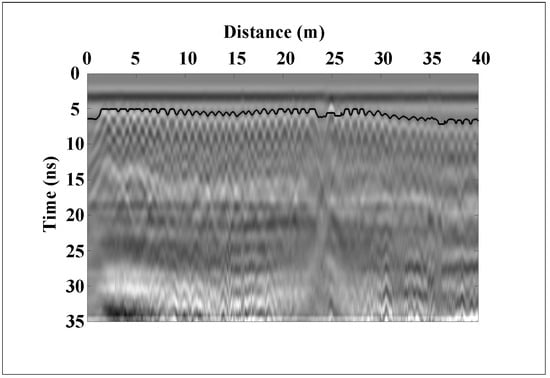
Figure 10.
The hyperbolic shape of the rebar after modification.
4. Results
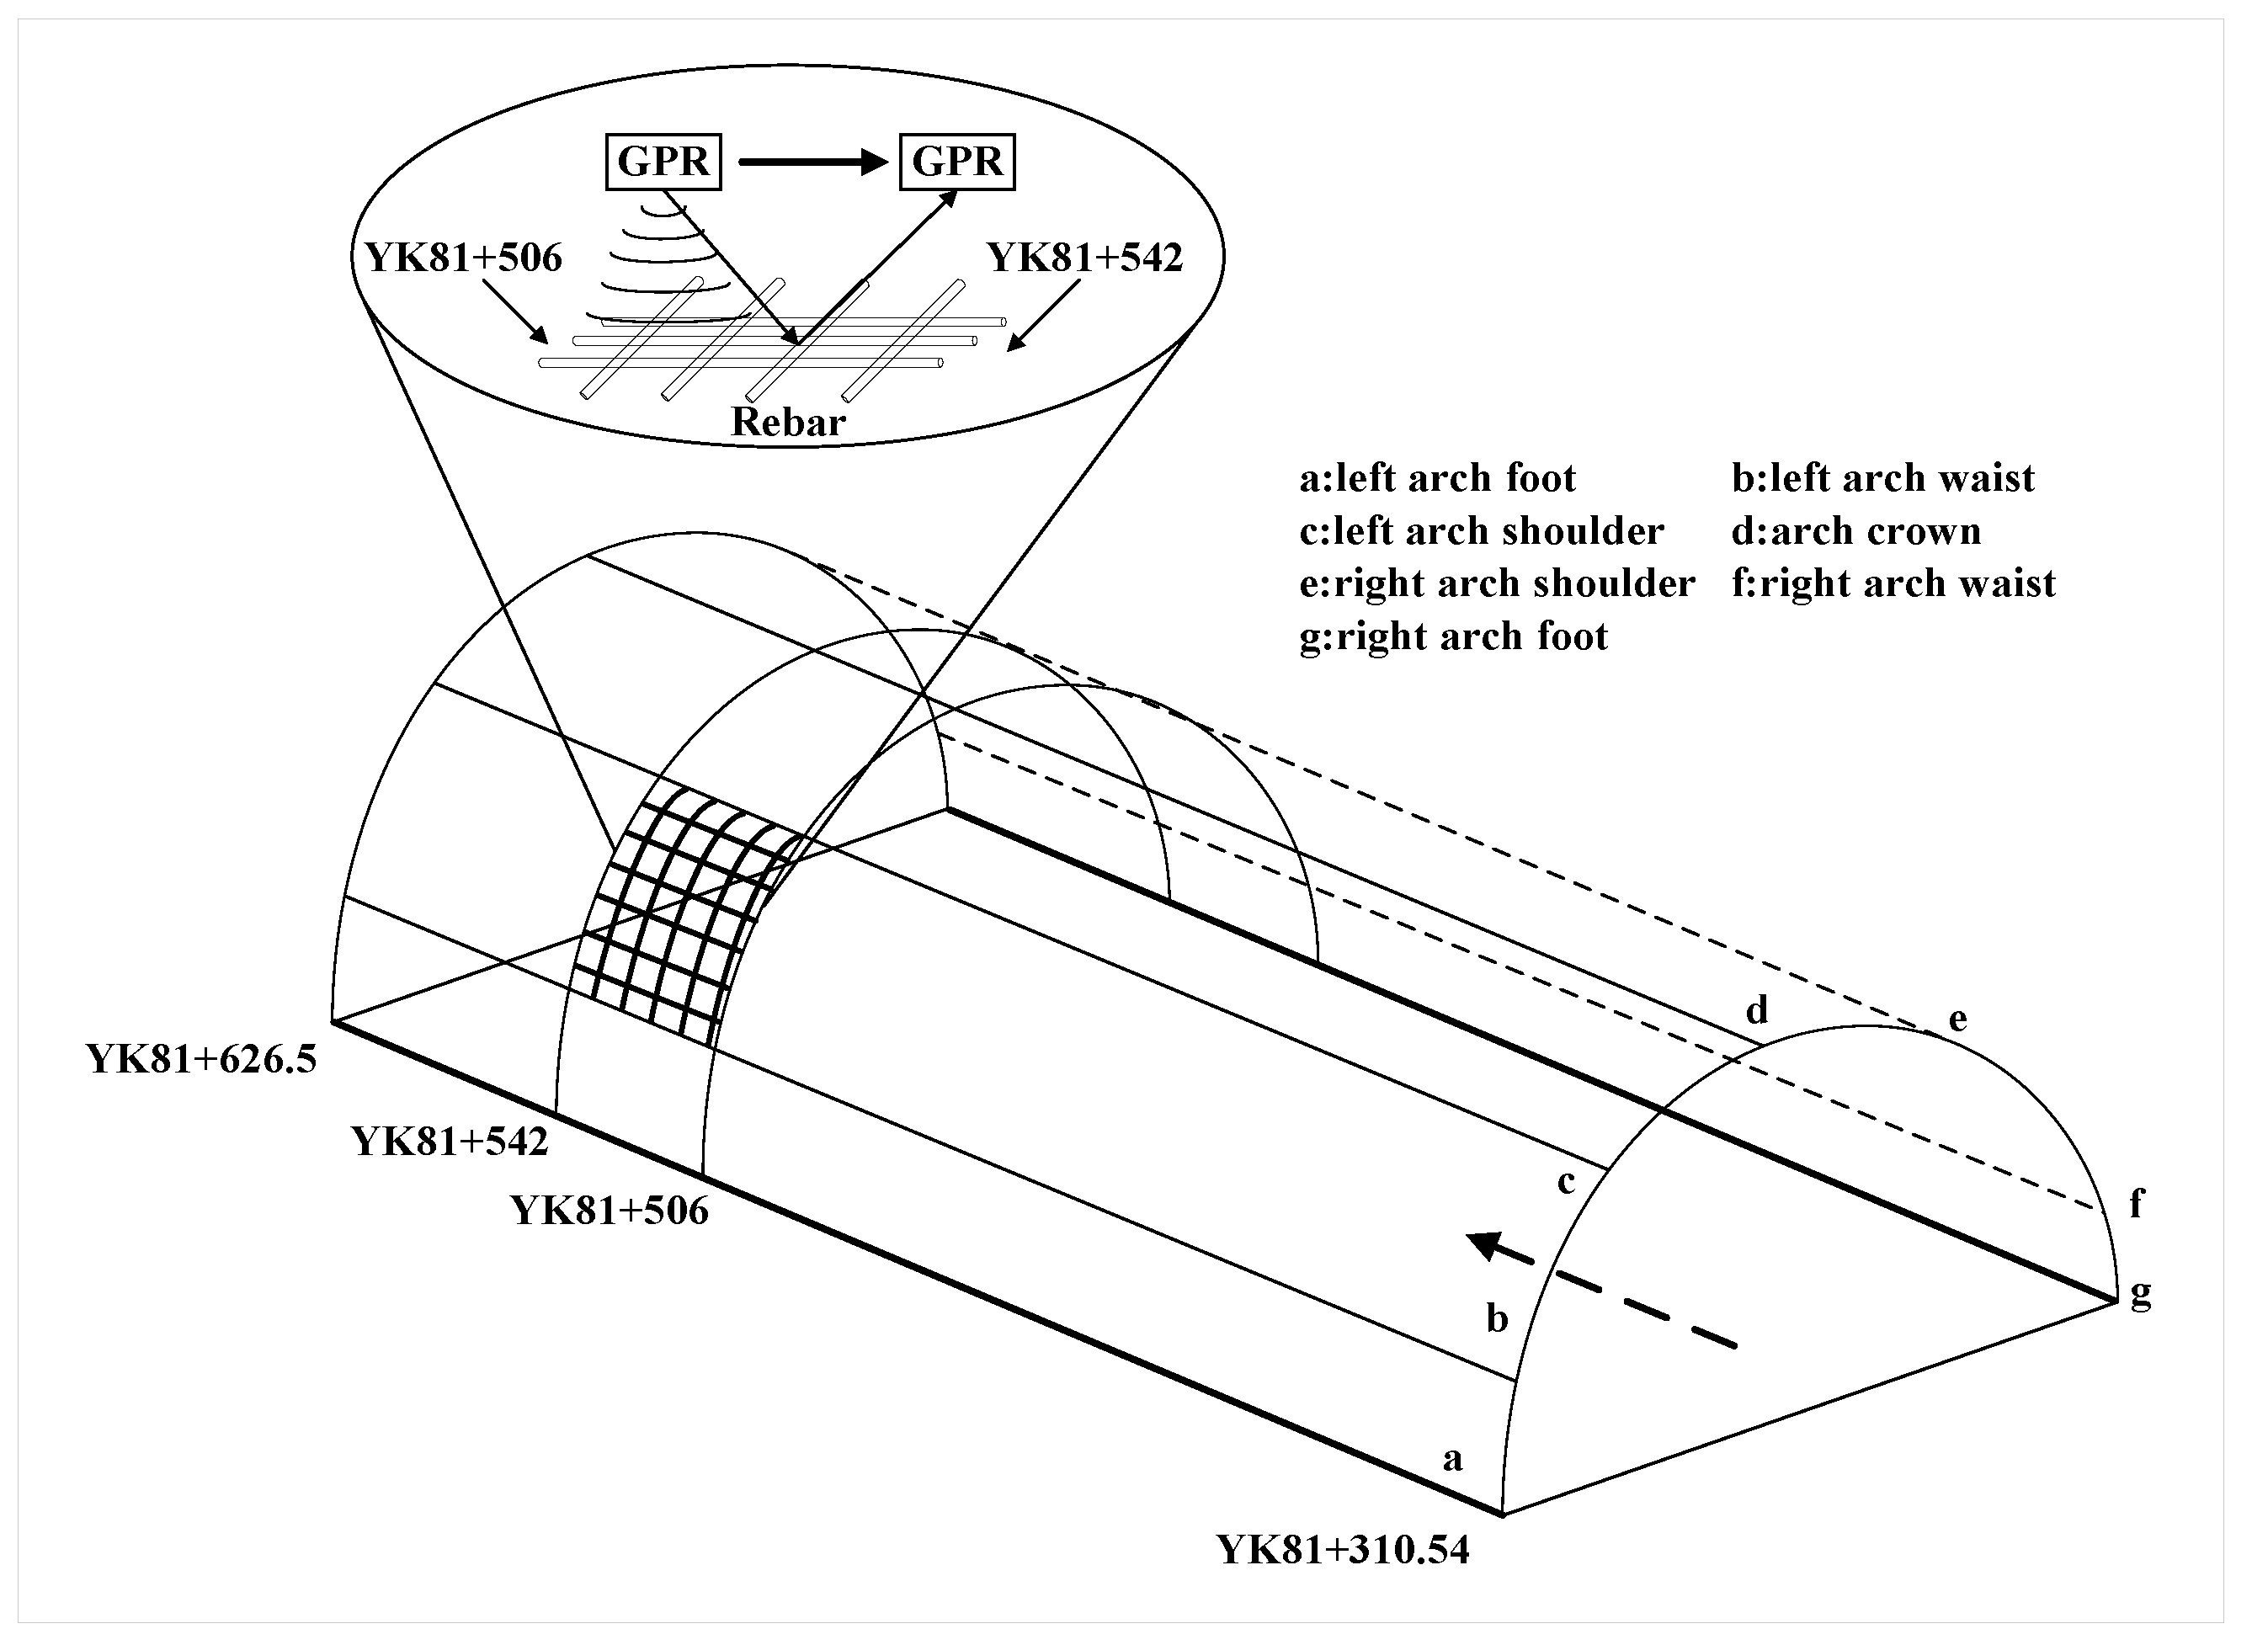
The starting and ending mileage of the right-hand section of the Husa Tunnel are from YK81+310.54 to YK86+650, with a total tunnel length of 5339.46 m. In the area at YK81+506–YK81+542 on the left arch waist of the tunnel in some mileage sections, we were authorized to use GPR to scan the tunnel’s lining structure. The scanning of the lining structure from inside the tunnel is shown in Figure 11.

Figure 11.
A partial structural diagram of the Husa Tunnel, in which GPR was used to identify the rebar within the mileage end of YK81+506–YK81+542.
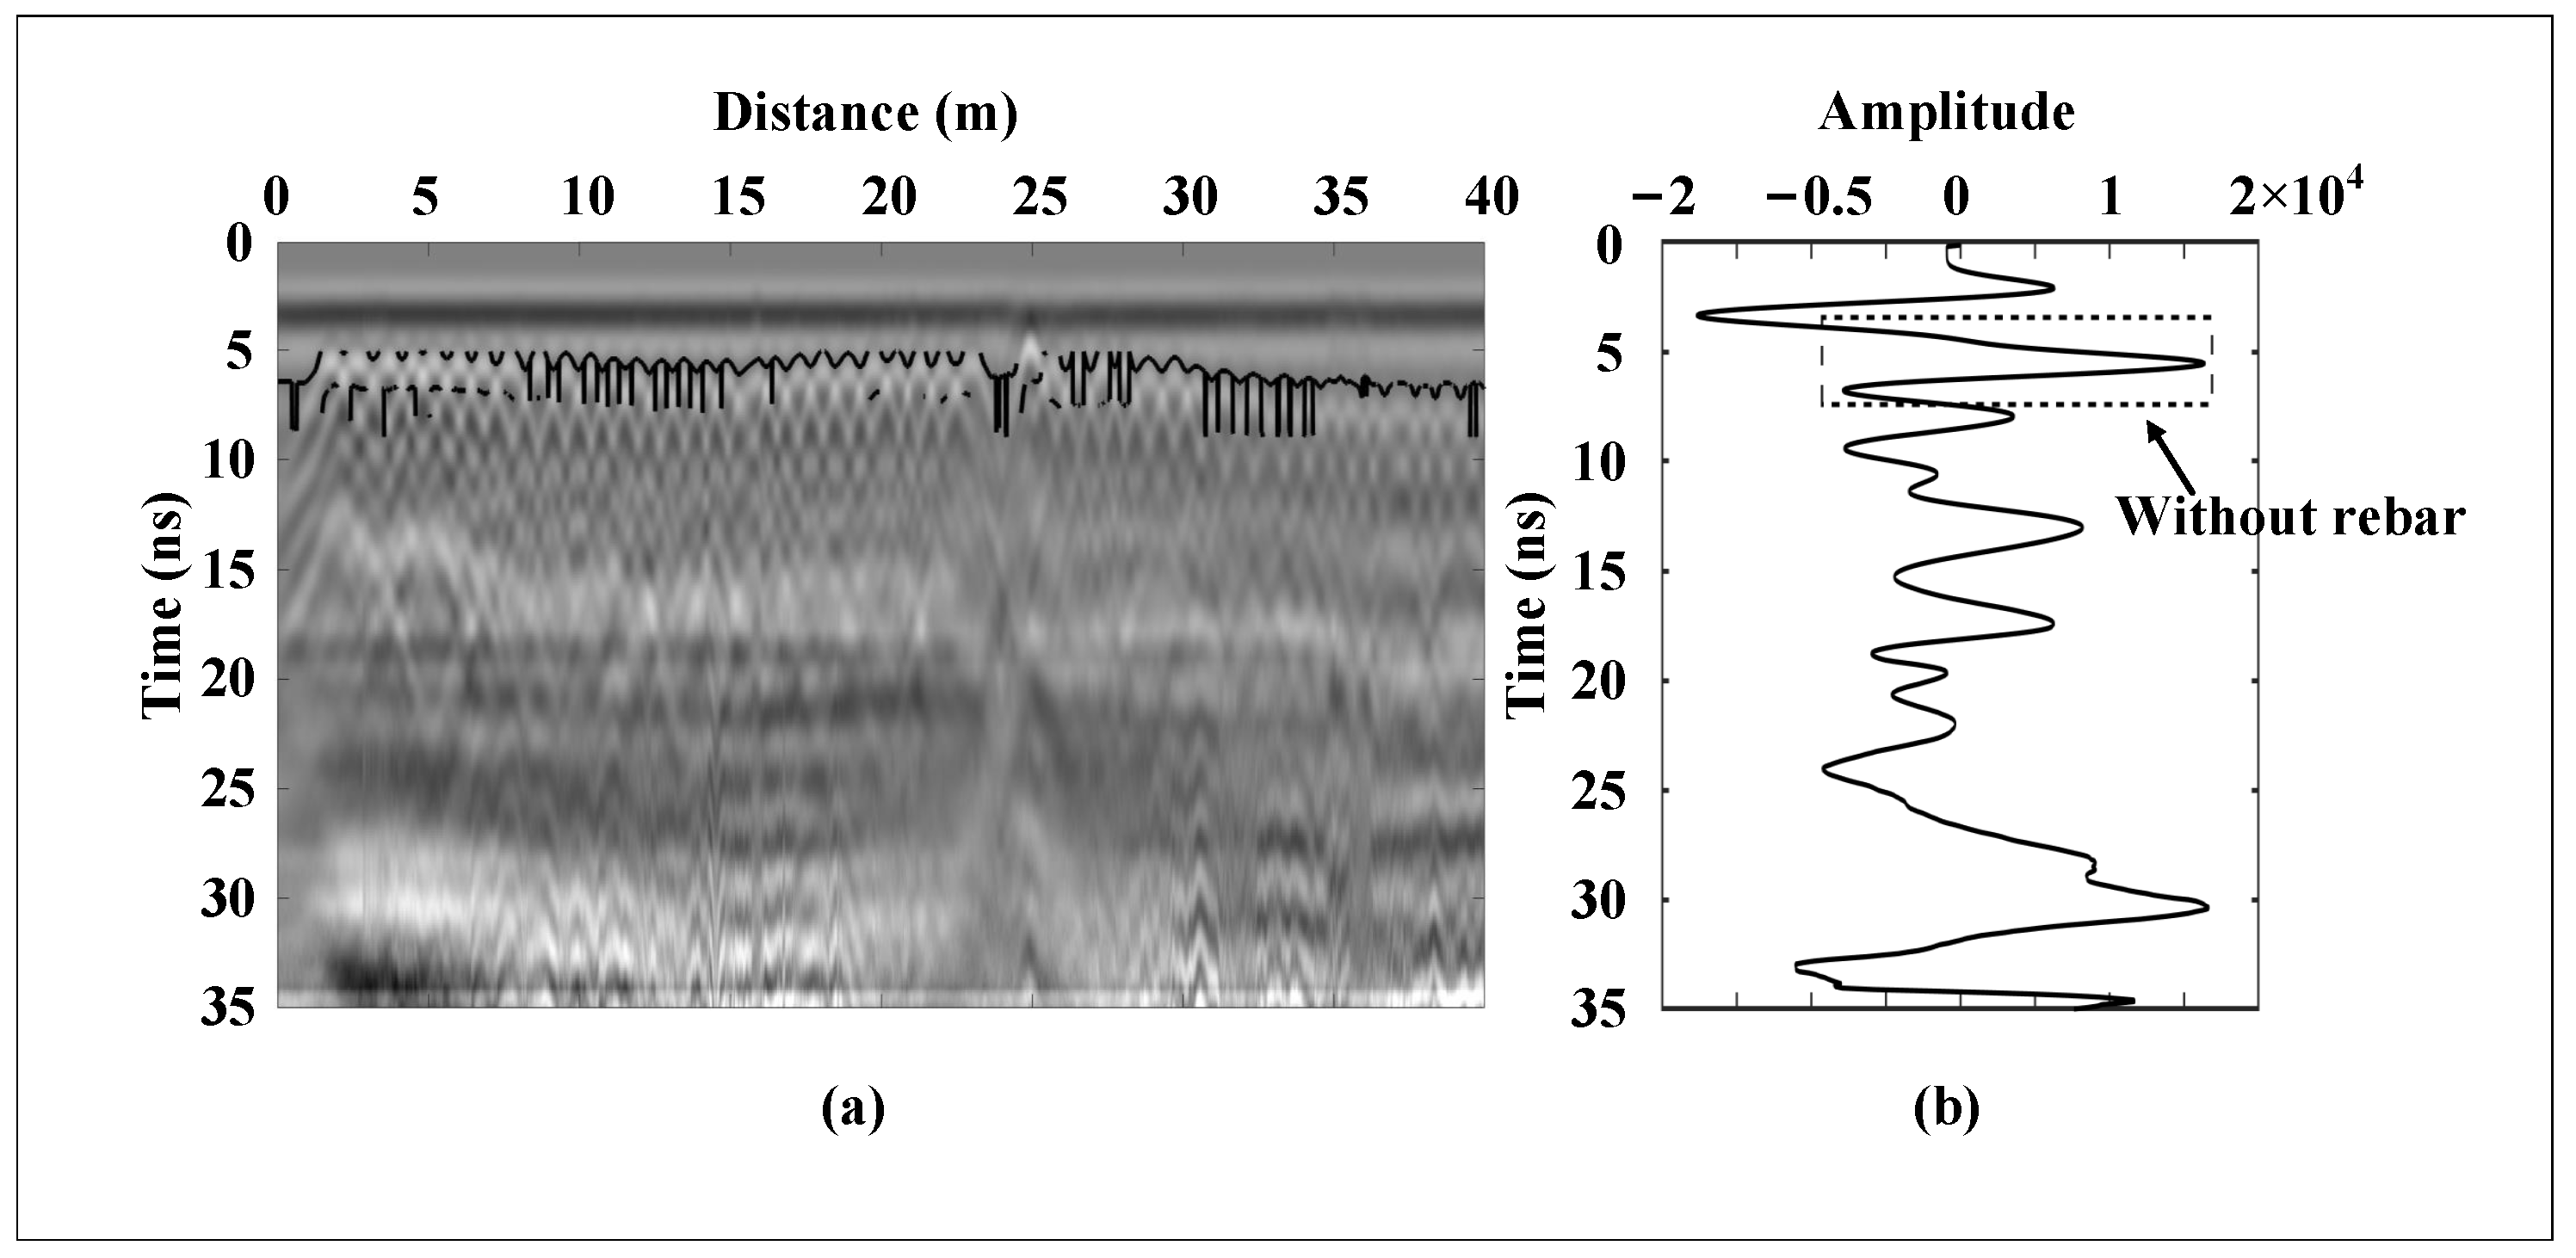
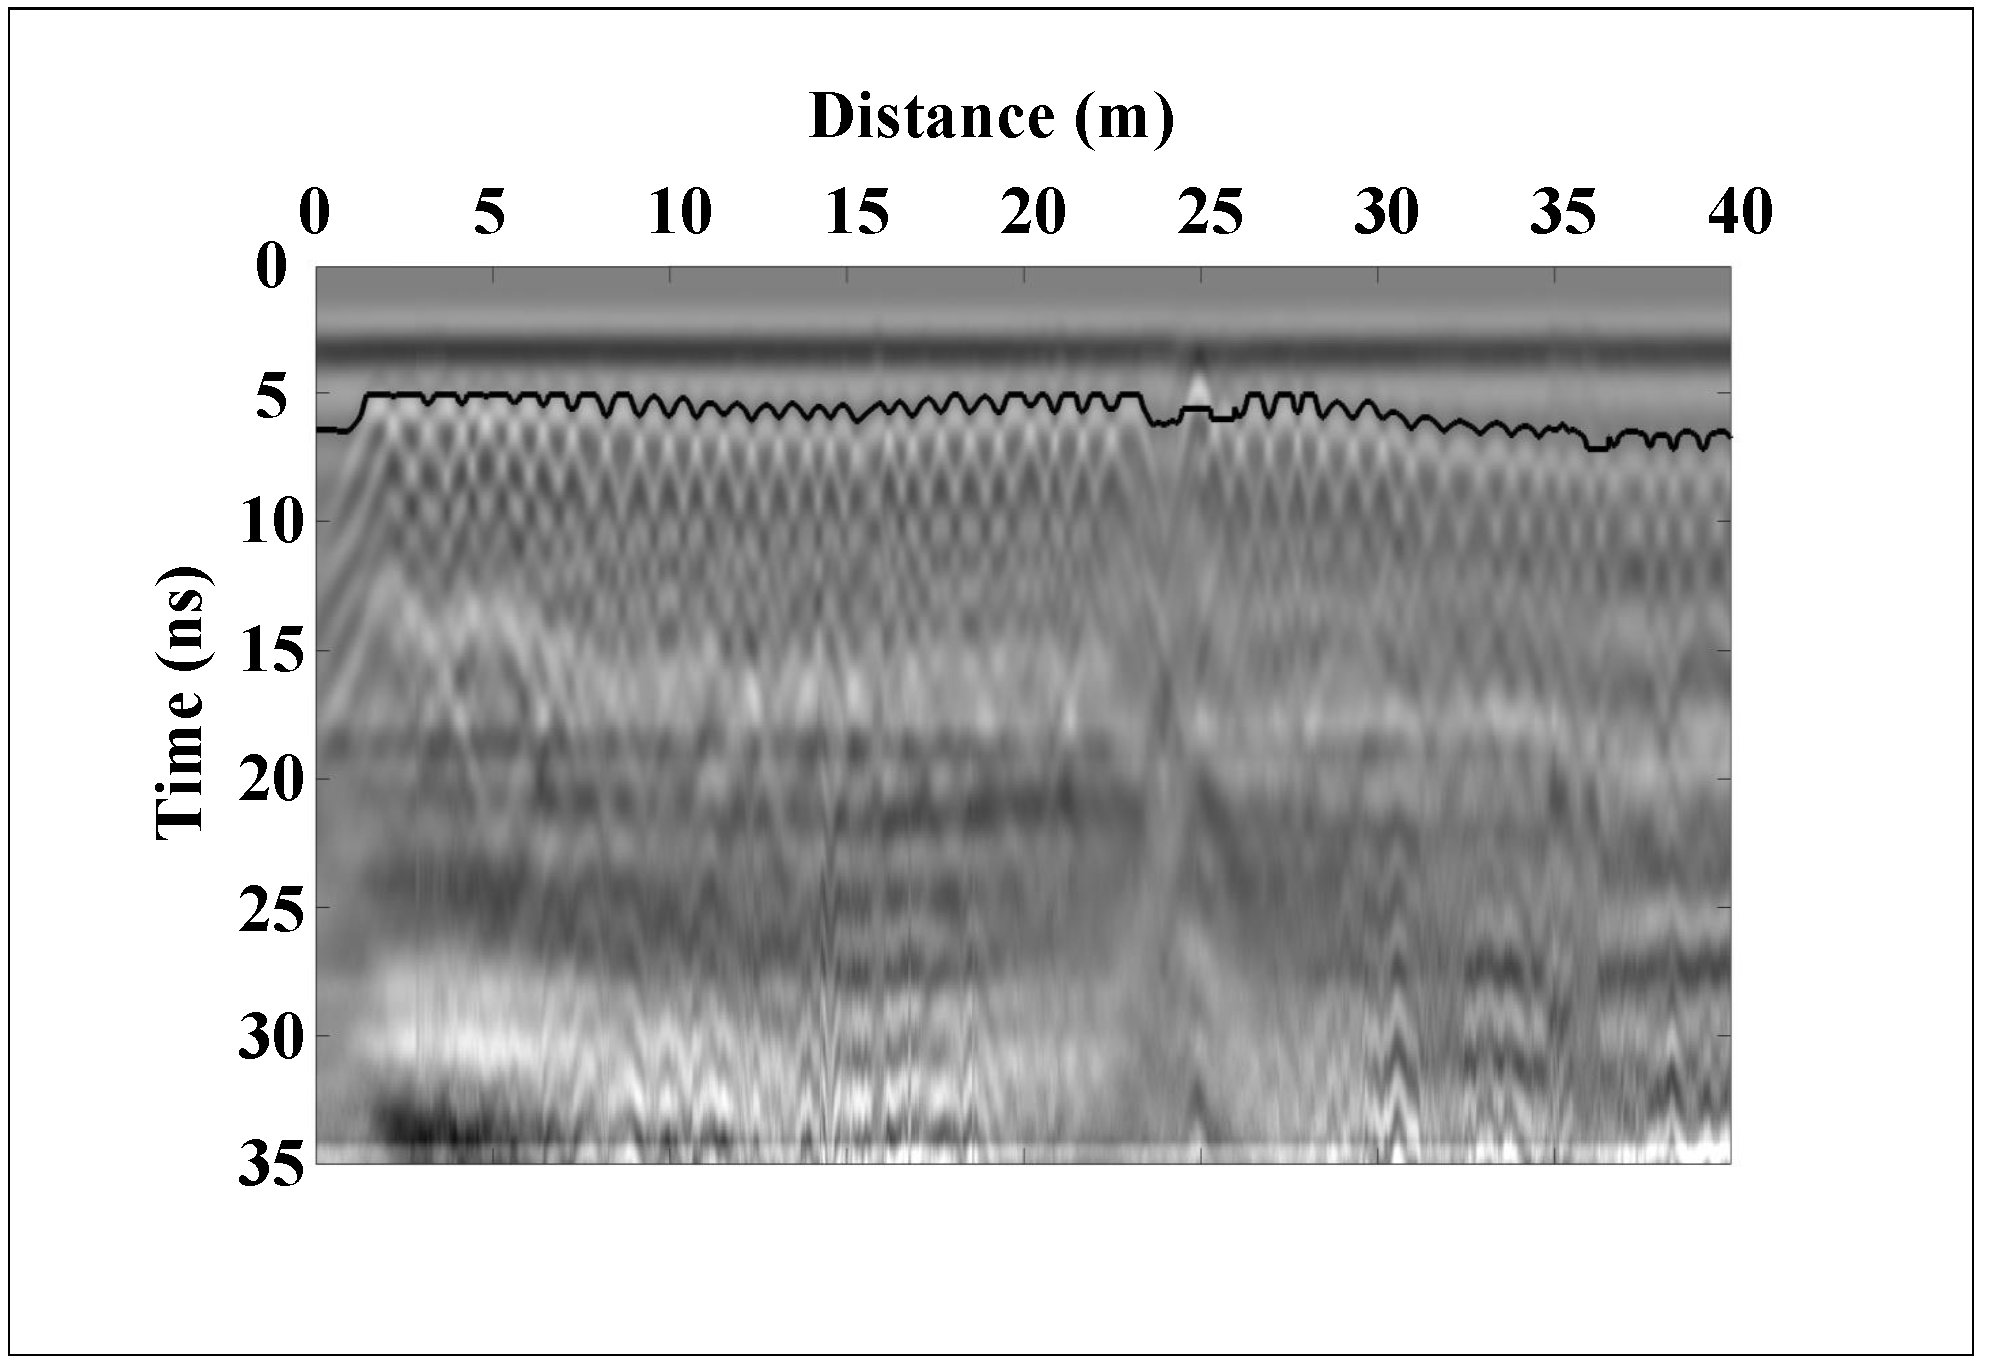
In mileage section YK81+506–YK81+542, some of the hyperbolic features of the rebar overlap each other, and these shapes were not clearly shown in the B-scan, as shown in Figure 12a. Thus, we used the method proposed in this paper to first locate the locations of the peak rebar points automatically in the A-scan. Then, the hyperbolic shape of the rebar was reconstructed in the B-scan based on these peak points. An initial reconstruction of the curves in this region was achieved, as shown in Figure 12b. Due to the discontinuity of the curve for part of the rebar in this region, the curve discontinuity region was corrected according to the correction method proposed in this paper, and the results are shown in Figure 12c. In Figure 12c, it can be seen that the curve feature of the rebar in the mileage section can be recognized at YK81+506–YK81+542, where the rebar lies within the range of 5–7 ns. By determining the interface point between the rebar and the concrete, the depth of embedment of the rebar [18,21] can be expressed as
where v is the electromagnetic wave propagation speed, taken to be 0.120 m/ns, is the electromagnetic wave propagation time from the concrete to the rebar, taking the average value of 5.879 ns, and is the electromagnetic wave from the air into the second lining time, taking the average value of 3.510 ns. According to Equation (11), the depth of burial of the rebar was approximately 0.142 m.
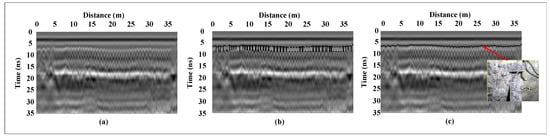
Figure 12.
(a) Mileage section YK81+506–YK81+542 of the B-scan. (b) Reconstructed hyperbolic feature at mileage section YK81+506–YK81+542. (c) The corrected rebar hyperbolic feature is shown in mileage section YK81+506–YK81+542.
5. Discussion and Conclusions
In this paper, the recognition of rebar was achieved, depending on the differences in the electromagnetic properties. The peak point of the rebar located in the A-scan was derived by analyzing the propagation process of electromagnetic waves within the concrete. The phase at this peak point was the inverse of the phase at the incident point. The amplitude of the peak point was smaller than that of the adjacent peak point in the same phase. The above features were used to reconstruct the hyperbolic shape of the rebar in the B-scan, and the discontinuity region was corrected. Finally, the rebar recognition in the second lining was achieved using the reconstructed rebar’s hyperbolic features. The following is a description of the most key findings of this study:
(1) The reflection coefficient was negative when electromagnetic waves propagated from low dielectric constant concrete to high dielectric constant rebar. According to this feature, it can be preliminarily judged that the rebar reflection point was located at the negative peak point in the A-scan.
(2) The rebar reflection point was located at the negative peak point in the A-scan. This negative peak point amplitude was smaller than the adjacent negative peak point. According to these peak points containing the rebar feature, the hyperbolic shape of the rebar was reconstructed in the B-scan for recognition.
(3) The recognition results from YK81+506 to YK81+542 in Husa Tunnel show that the rebar was located in the area from 5 ns to 7 ns in the second lining of the tunnel. The depth of burial of the rebar was approximately 0.142 m.
Author Contributions
Conceptualization, C.L. and Y.Z.; methodology, C.L., Y.Z. and X.Y. (Xiumei Yang); software, Y.Z.; validation, X.Y. (Xi Yang) and W.Z.; formal analysis, Y.Z.; investigation, X.Y. (Xi Yang); data curation, L.W., W.Z. and X.Y. (Xi Yang); writing—original draft preparation, Y.Z.; writing—review and editing, C.L.; project administration, C.L. and L.W.; funding acquisition, C.L. All authors have read and agreed to the published version of the manuscript.
Funding
This work was supported by the National Natural Science Foundation of China (Grant No. 62263015).
Institutional Review Board Statement
Not applicable.
Informed Consent Statement
Not applicable.
Data Availability Statement
The data used to support the findings of this study are available from the corresponding author upon request.
Conflicts of Interest
The authors declare no conflict of interest.
References
- Oikonomopoulou, E.C.; Palieraki, V.A.; Sfikas, I.P.; Trezos, C.G. Reliability and limitations of GPR for identifying objects embedded in concrete–Experience from the lab. Case Stud. Constr. Mater. 2022, 16, e00898. [Google Scholar] [CrossRef]
- Xiang, L.; Zhou, H.L.; Shu, Z.; Tan, S.H.; Liang, G.Q.; Zhu, J. GPR evaluation of the Damaoshan highway tunnel: A case study. Ndt E Int. 2013, 59, 68–76. [Google Scholar] [CrossRef]
- Alani, A.M.; Tosti, F. GPR applications in structural detailing of a major tunnel using different frequency antenna systems. Case Stud. Constr. Mater. 2018, 158, 1111–1122. [Google Scholar] [CrossRef]
- Drahor, M.G.; Öztürk, C.; Ongar, A.; Berge, M.A. Applications of the GPR Technique to indoor, bridge deck and pier structures: Case studies in Turkey. Near Surf. Geophys. 2016, 14, 156–169. [Google Scholar] [CrossRef]
- Wang, Y.; Cui, G.; Xu, J. Semi-automatic detection of buried rebar in GPR data using a genetic algorithm. Autom. Constr. 2020, 114, 103186. [Google Scholar] [CrossRef]
- Cassidy, N.J.; Eddies, R.; Dods, S. Void detection beneath reinforced concrete sections: The practical application of ground-penetrating radar and ultrasonic techniques. J. Appl. Geophys. 2011, 74, 263–276. [Google Scholar] [CrossRef]
- Kilic, G.; Unluturk, M.S. Wavelet analysis with different frequency GPR antennas for bridge health assessment. J. Test. Eval. 2016, 44, 647–655. [Google Scholar] [CrossRef]
- Ramya, M.; Balasubramaniam, K.; Shunmugam, M. On a reliable assessment of the location and size of rebar in concrete structures from radargrams of ground-penetrating radar. Insight-Non-Destr. Test. Cond. Monit. 2016, 58, 264–270. [Google Scholar] [CrossRef]
- Dinh, K.; Gucunski, N.; Duong, T.H. An algorithm for automatic localization and detection of rebars from GPR data of concrete bridge decks. Autom. Constr. 2018, 89, 292–298. [Google Scholar] [CrossRef]
- Liu, H.; Lin, C.; Cui, J.; Fan, L.; Xie, X.; Spencer, B.F. Detection and localization of rebar in concrete by deep learning using ground penetrating radar. Autom. Constr. 2020, 118, 103279. [Google Scholar] [CrossRef]
- Asadi, P.; Gindy, M.; Alvarez, M.; Asadi, A. A computer vision based rebar detection chain for automatic processing of concrete bridge deck GPR data. Autom. Constr. 2020, 112, 103106. [Google Scholar] [CrossRef]
- Ma, X.; Liu, H.; Wang, M.L.; Birken, R. Automatic detection of steel rebar in bridge decks from ground penetrating radar data. J. Appl. Geophys. 2018, 158, 93–102. [Google Scholar] [CrossRef]
- Shen, R.; Zhao, Y.; Hu, S.; Li, B.; Bi, W. Reverse-time migration imaging of ground-penetrating radar in NDT of reinforced concrete structures. Remote Sens. 2021, 13, 2020. [Google Scholar] [CrossRef]
- Dinh, K.; Gucunski, N.; Duong, T.H. Migration-based automated rebar picking for condition assessment of concrete bridge decks with ground penetrating radar. Ndt E Int. 2018, 98, 45–54. [Google Scholar] [CrossRef]
- Sudakova, M.; Sadurtdinov, M.; Tsarev, A.; Skvortsov, A.; Malkova, G. Ground-penetrating radar for studies of peatlands in permafrost. Russ. Geol. Geophys. 2019, 60, 793–800. [Google Scholar] [CrossRef]
- Yamaguchi, T.; Mizutani, T.; Tarumi, M.; Su, D. Sensitive damage detection of reinforced concrete bridge slab by “time-variant deconvolution” of SHF-band radar signal. IEEE Trans. Geosci. Remote Sens. 2018, 57, 1478–1488. [Google Scholar] [CrossRef]
- Arévalo-Lomas, L.; Biosca, B.; Paredes-Palacios, D.; Díaz-Curiel, J. Processing Radargrams to Obtain Resistivity Sections. Remote Sens. 2022, 14, 2639. [Google Scholar] [CrossRef]
- Li, C.; Li, M.J.; Zhao, Y.G.; Liu, H.; Wan, Z.; Xu, J.C.; Xu, X.P.; Chen, Y.; Wang, B. Layer recognition and thickness evaluation of tunnel lining based on ground penetrating radar measurements. J. Appl. Geophys. 2011, 73, 45–48. [Google Scholar] [CrossRef]
- Yan, Y.; Yan, Y.; Zhao, G. Estimation of sand water content using GPR combined time-frequency analysis in the Ordos Basin, China. Open Phys. 2019, 17, 999–1007. [Google Scholar]
- Mierczak, M.; Karczewski, J. Location of agate geodes in Permian deposits of Simota gully using the GPR. Acta Geophys. 2021, 69, 655–664. [Google Scholar] [CrossRef]
- Puntu, J.M.; Chang, P.Y.; Lin, D.J.; Amania, H.H.; Doyoro, Y.G. A Comprehensive Evaluation for the Tunnel Conditions with Ground Penetrating Radar Measurements. Remote Sens. 2021, 13, 4250. [Google Scholar] [CrossRef]
- Zhang, J.; Ye, L.; Yan, C.; Yan, B.; Wei, P.; Feng, J. Study on construction influence of shield tunnel of urban rail transit on large-section mining tunnel. Adv. Civ. Eng. 2020, 2020, 1–20. [Google Scholar] [CrossRef]

Disclaimer/Publisher’s Note: The statements, opinions and data contained in all publications are solely those of the individual author(s) and contributor(s) and not of MDPI and/or the editor(s). MDPI and/or the editor(s) disclaim responsibility for any injury to people or property resulting from any ideas, methods, instructions or products referred to in the content. |
© 2023 by the authors. Licensee MDPI, Basel, Switzerland. This article is an open access article distributed under the terms and conditions of the Creative Commons Attribution (CC BY) license (https://creativecommons.org/licenses/by/4.0/).