1. Introduction
The reliability of the machining process refers to the ability to continuously produce products that meet technical requirements under specified process conditions. The reliability of the machining process determines the quality of machined products. Improving the reliability of the machining process can reduce the defective rate of products and improve economic benefits. Therefore, related design theories and technologies with process reliability have become one of the key factors to enhancing the core competitiveness of enterprises [
1]. So far, many scholars have carried out related research on improving the reliability of the machining process and have made significant progress.
The reliability of critical processes has a significant impact on the overall reliability of the machining process. Therefore, when analyzing the reliability of the machining process, we should identify the critical processes first [
2]. Currently, methods combining qualitative and quantitative analysis are used to determine critical processes, such as the Analytic Hierarchy Process (AHP) [
3,
4], fuzzy comprehensive evaluation analysis [
5], Fuzzy AHP [
6], Failure Mode Effects and Criticality Analysis (FMECA) [
7], the cause and effect matrix [
8], etc. These methods have a wide range of applications in practical production.
The Analytic Hierarchy Process is a simple and systematic analysis method that is concise and practical, and fewer quantitative data are required in the analysis process. There are fewer quantitative data and more qualitative components in AHP, so it is not convincing [
9]. Compared with AHP, fuzzy AHP and fuzzy comprehensive evaluation analysis overcome the influence of subjective factors and uncertain factors on evaluation results to a certain extent. The FMECA method takes each process as the analysis subject and comprehensively evaluates the possible failure effects and failure causes of each failure mode. It also evaluates the risk level of each item, and then finds out the weak links of the machining process [
7]. However, the FMECA method still relies on the subjective consciousness of the evaluators when evaluating the grades. Overall, the above methods strongly depend on subjective factors and cannot quantitatively analyze each process well. Therefore, these methods have certain limitations.
At the same time, the transmission of machining error between processes (error transmission) will also affect the reliability of the machining process [
10]. Therefore, analyzing the error transmission is worthy of attention. Currently, the related research on error transmission is mainly based on error flow theory [
11], partial correlation coefficients [
12,
13] and weighted networks [
14,
15], and has established some error transfer models. In terms of mathematics, the state space model based on the error flow theory describes the influence of the previous process on the quality eigenvalue of the following process. This model has been widely used in auto body manufacturing [
16,
17]. The error transfer model based on the partial correlation coefficient calculates the correlation between two variables, after controlling the influence of other variables on the two variables analyzed [
12].
The state space model based on the error flow theory requires that the machining state of the current process is entirely determined by the machining state of the previous process [
18]. In the actual machining process, the machining quality of the current process is not only affected by the earlier process but also by the 5M1E (i.e., Man, Machine, Material, Method, Measurement, Environment) of the current process [
19] and other uncertainty factors. Therefore, this model has its own limitations. The error transfer model based on the partial correlation coefficient can quantitatively reflect the correlation of machining error between processes, but it cannot combine the error transmission with the inherent machining error of the process. When using the weighted network to analyze the transmission of machining error, the weight is directly related to the accuracy of analysis results, so the method of determining the weight is very critical.
In view of the limitations of the above methods, this paper introduces information entropy and mutual information [
20] into the analysis of machining process reliability. It establishes a reliability analysis model of the machining process based on information entropy. The proposed model can quantitatively analyze the inherent machining error of each process and the error transmission and combine the two for comprehensive consideration. The model proposed in this paper is not specifically designed for a certain machining process, but rather for analyzing data generated from various machining processes within actual process flow. In actual production, the collected machining quality data can be input into the model to evaluate the weak links with large fluctuations in processing quality and the processes that have a greater impact on the machining quality of mechanical parts. Using the model to evaluate the same machining process, the accuracy of the evaluation results depends on the completeness of the machining quality data used (including the inherent error data of equipment and the machining quality inspection data of processes). The more complete the machining quality data, the more accurate the evaluation result will be. Therefore, certain labor and time costs are required to obtain relevant machining quality data. The reliability analysis model of the machining process based on information entropy has strong adaptability to scenarios, which provides a new idea for research on the reliability of the machining process.
3. Graphical Representation of Machining Process
The machining process of mechanical parts is complicated, so it is essential to visualize the complex machining process. Graphs in Graph Theory can visually express the complex coupling relationship between different things, and it is very suitable to use the graph to present the complex machining process [
15]. A graph is composed of a set of vertices and edges, an edge connecting two vertices. A vertex is an abstraction of something, and an edge connecting two vertices is used to represent a certain relationship between two things [
23]. During the machining of mechanical parts, we can abstract the processes as the vertices in the graph and regard the relationship between the two processes as the edge between the two vertices [
24]. In
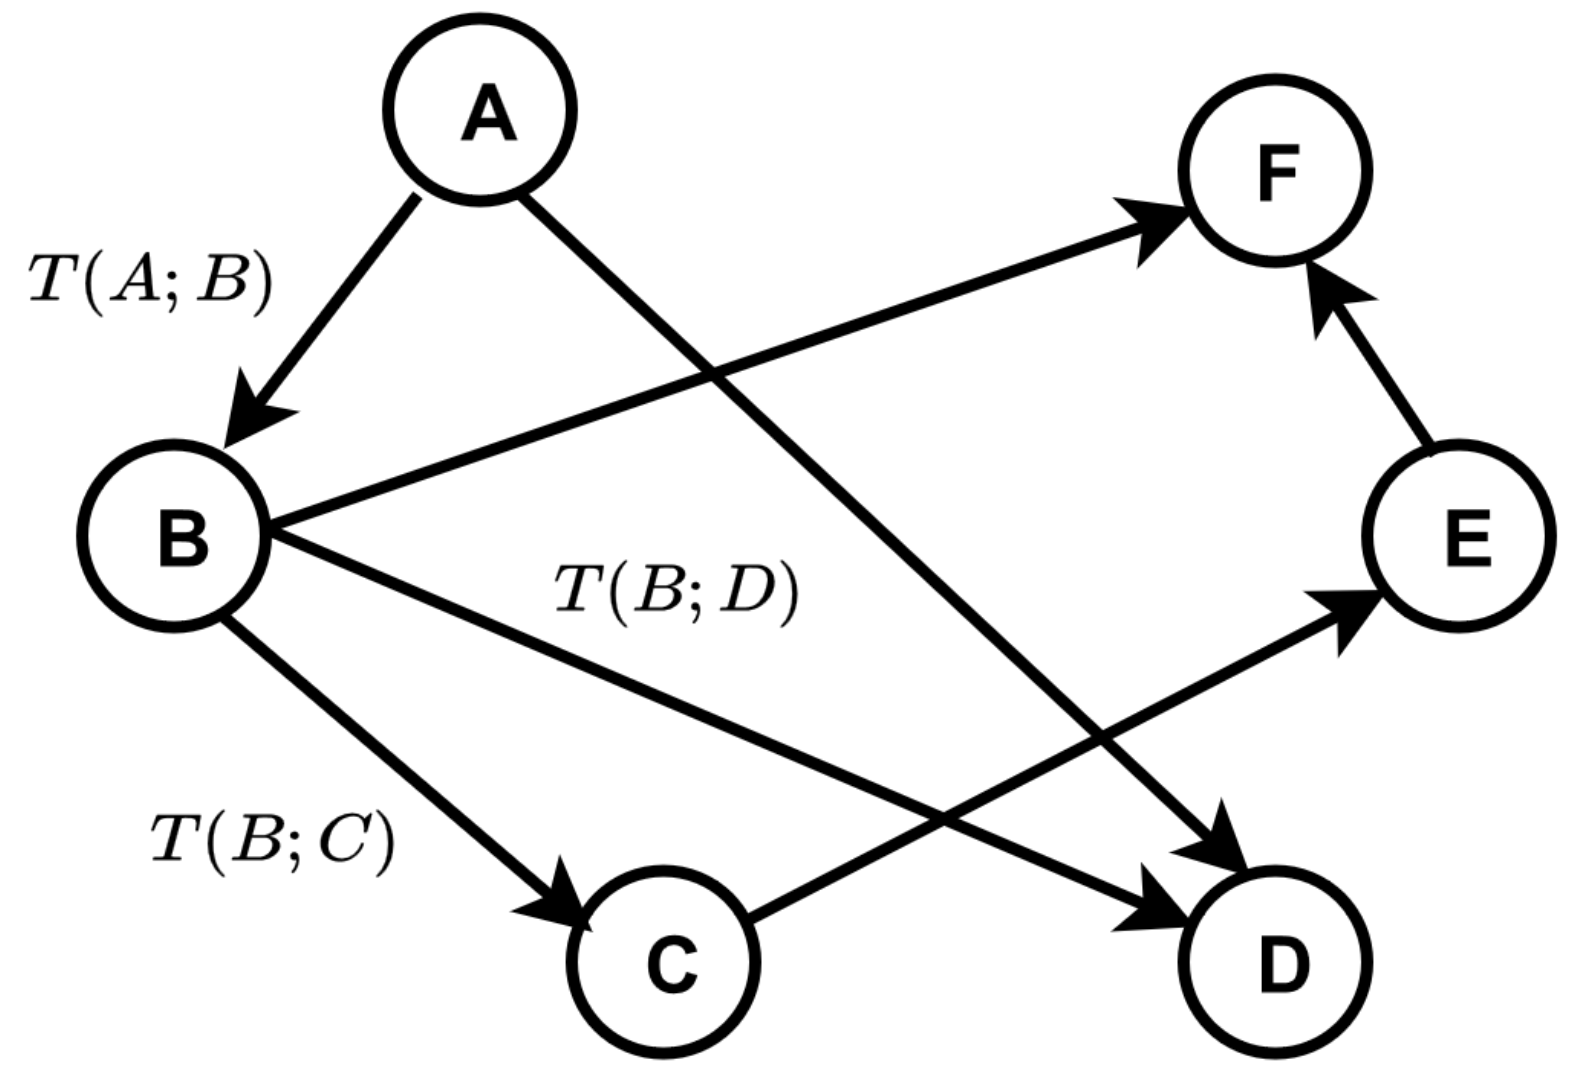
Figure 1, this type of graph representing the machining process is called a directed-weighted process graph (abbreviated as DWPG). The DWPG consists of vertices, edges and transfer coefficients, and has the following related definitions:
Vertex: Representing the process in the machining, i.e., a vertex is equivalent to the corresponding process. All the vertices constitute a set V.
Edge: Representing the connection between two vertices, and from the previous process to the following process. All the edges constitute a set E.
Transfer coefficient: Representing the transmission of machining error between two processes. All the transfer coefficients constitute a set T.
In-degree: The number of edges pointing to a vertex.
Out-degree: The number of edges that a vertex points to other vertices.
Weighted in-degree: The sum of the transfer coefficients on the edges pointing to a vertex, which measures the influence of the machining errors of the previous vertices on the current vertex.
Weighted out-degree: The sum of the transfer coefficients on the edges of a vertex pointing to other vertices, which measures the extrapolation of vertex uncertainty.
Process quality random variable: The vertex’s interval of process quality distribution is divided into multiple sub-intervals with width k. The values of the process quality that fall into the same sub-interval are regarded as one class. In this situation, the process quality of the vertex can be viewed as a discrete random variable, called the process quality random variable (abbreviated as PQRV). It is denoted by a capital letter.
Inherent process quality random variable: In the absence of interference from other vertices, the process quality distribution is determined by the intrinsic attributes of the vertex. At this time, the vertex’s interval of process quality distribution is divided into multiple sub-intervals with width k. The values of the process quality that fall into the same sub-interval are regarded as one class. In this situation, the inherent process quality of the vertex can be viewed as a discrete random variable, called the inherent process quality random variable (abbreviated as IPQRV). It is denoted by a capital letter with an “int” subscript. The IPQRV of a vertex is an intrinsic property of the vertex (not shown in the DWPG).
Vertex entropy: Measuring the uncertainty of the PQRV. The larger the value, the higher the uncertainty.
Vertex inherent entropy: Measuring the uncertainty of the IPQRV. The larger the value, the higher the uncertainty.
A DWPG contains multiple process subgraphs. A vertex with an out-degree but no in-degree represents the first process of machining a feature, i.e., machining directly on the blank. A vertex with an in-degree but no out-degree represents the last process of machining a feature, and other processes do not use the geometric elements of the feature as process benchmarks. This situation means that the feature does not affect other machining features.
The DWPG can be viewed as composed of single-chain process subgraphs (called single-chain subgraphs) and multi-chain process subgraphs (called multi-chain subgraphs). A typical single-chain subgraph is shown in
Figure 2. In a single-chain subgraph, there is a one-to-one correspondence between two vertices, with no scenario where one vertex impacts two subsequent vertices, or where one vertex is simultaneously impacted by two previous vertices.
A typical multi-chain subgraph is shown in
Figure 3. In a multi-chain subgraph, there are two or more previous vertices that affect the current vertex at the same time. Since there may be a situation where one vertex can simultaneously affect multiple following vertices, so the vertices
in
Figure 3 may be correlated with each other. Multi-chain vertices
are affected by multiple vertices simultaneously, so the PQRV
of
is a multivariate random variable, i.e.,
.
4. The Reliability Analysis of the Machining Process
Among all the processes of machining mechanical parts, the process that has a greater impact on the reliability of the machining process is called the critical process. By optimizing the parameters of the critical process (such as the feed rate of turning, the spindle speed, etc.), the reliability of the machining process can be improved [
25]. The vertices corresponding to the critical processes in the DWPG are called critical vertices, including the important vertex, strongly influencing vertex and strongly influenced vertex. They are defined as follows, and we can use these definitions to identify the corresponding vertices:
Important vertex: The vertex with the largest ratio of vertex entropy to the width of the tolerance zone in the DWPG.
Strongly influencing vertex: The vertex with the largest weighted out-degree in the DWPG.
Strongly influenced vertex: The vertex with the largest weighted in-degree in the DWPG.
It is necessary to identify the strongly influencing vertex and strongly influenced vertex in the DWPG for carrying out error transmission analysis on the DWPG. Also, optimizing the processes corresponding to the critical vertices can improve the reliability of the machining process. Therefore, it is necessary to analyze the composition of the uncertainty of the process quality.
4.1. Analysis of Error Transmission
The machining quality of mechanical parts is determined by multiple processes [
26]. The machining quality of each process is not constant and has certain fluctuations that often follow a normal distribution. The fluctuation of the machining quality of mechanical parts is also the result of each process’s combined action of the machining quality fluctuations. Therefore, it is necessary to analyze the error transmission.
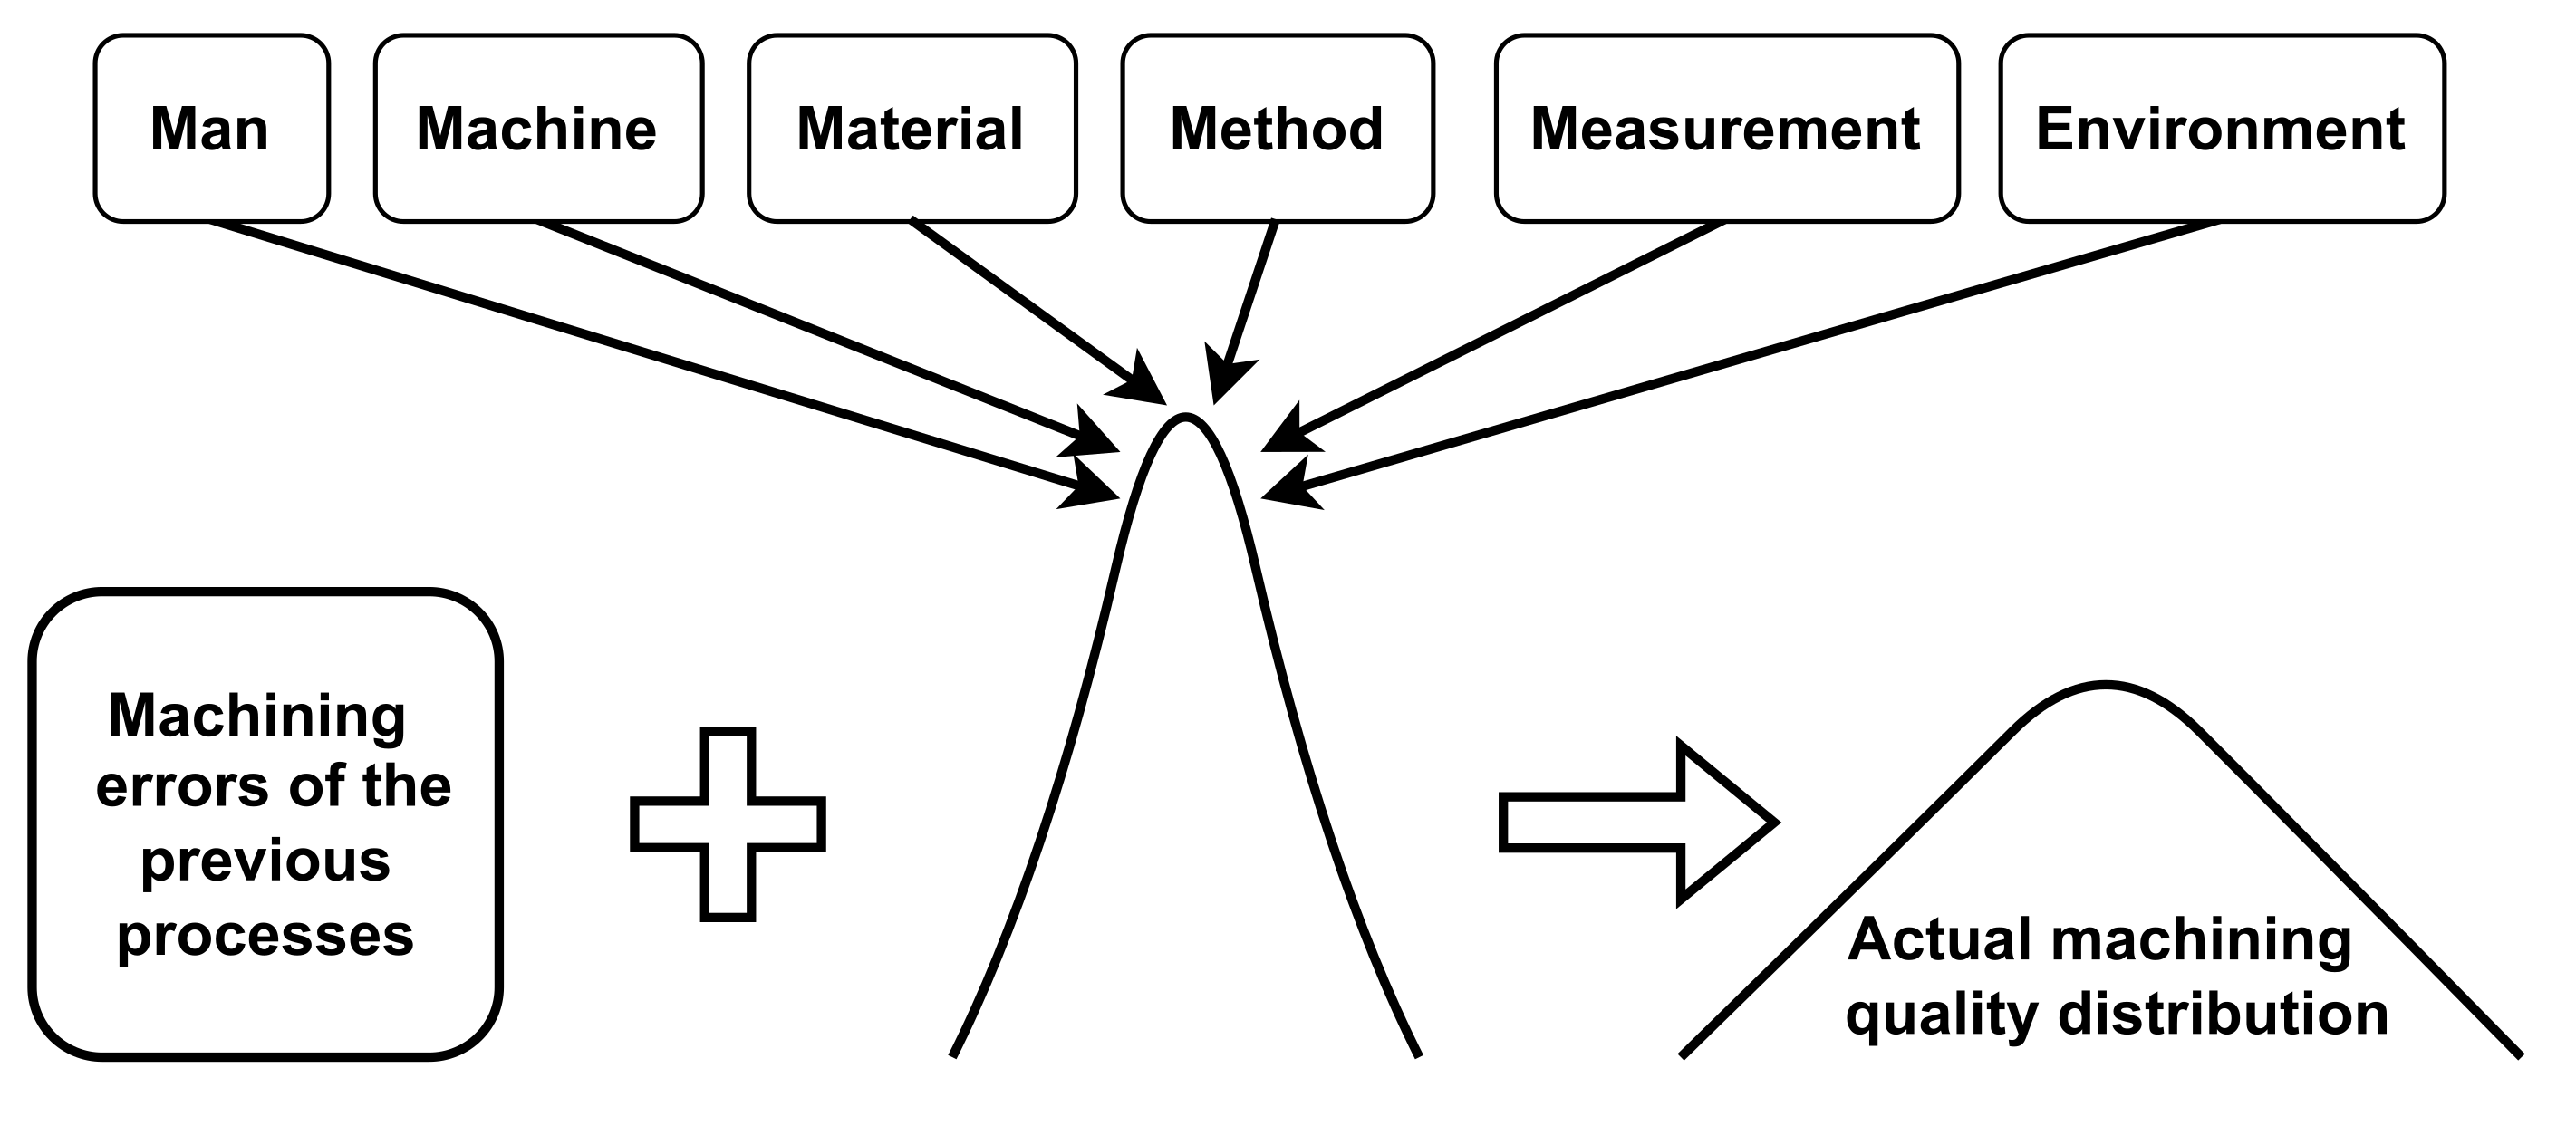
There is a complex coupling relationship between processes. The machining quality of each process is not only affected by the 5M1E of the current process but the machining error of the previous processes [
19]. It is specifically reflected in that the machining error of the previous processes will affect the machining quality distribution of the current process, as shown in
Figure 4. It is difficult to model so many variables simultaneously in the actual analysis, and even if a model is established, the accuracy of the model is not very satisfactory. In addition, many contingent factors affect each process’s machining quality [
27], but these factors cannot be predicted beforehand. Therefore, an error transmission analysis method based on process quality distribution is proposed in this paper. The main idea is to determine the influence of the previous vertex on the current vertex by calculating the mutual information between the PQRV of two vertices. This method enables the quantification of error transmission and quantitatively evaluates the degree of correlation between two processes.
In the single-chain case, the influence between two vertices is defined as the transfer coefficient
, where
is the PQRV of the previous vertex and
denotes the PQRV of the current vertex.
There are two necessary explanations for the error transmission analysis in the case of a single chain.
The PQRV of the vertices is usually regarded as a continuous distribution, but it is necessary to discretize the continuous distribution into a discrete probability distribution for introducing concepts such as information entropy and mutual information. The specific measure divides the continuous distribution into intervals and treats each interval as a discrete value.
In information theory, mutual information is bidirectional [
21], i.e.,
, but in the single-chain case, the transfer coefficient only represents the error transfer from the previous vertices to the current vertex, because the machining process is moving in one direction. Therefore, there is no
.
In the case of the multi-chain, the influence between vertices is defined as a transfer coefficient
, where
,
denotes the sum of the influence of vertex
on vertex
, and satisfies the following equation:
4.2. Vertex Entropy and Vertex Intrinsic Entropy
Introducing information entropy into the reliability analysis of the machining process and using information entropy to measure the uncertainty of vertex machining quality distribution [
28]. In actual mechanical manufacturing, each process has an ideal value for machining quality. The closer the machining quality of the process is distributed near the perfect value, the higher the process’s reliability. This relationship maps to the information entropy: The lower the uncertainty of PQRV, the lower the information entropy of the vertex. The information entropy of the PQRV is defined as the vertex entropy
. The vertex entropy measures the uncertainty of the vertex machining quality under the action of all disturbance and uncertainty factors.
Because the machining errors of the preceding vertices will be transmitted to the current vertex, the entropy of the current vertex contains the uncertainty of the machining quality caused by the preceding vertices. Assuming that the machining quality of the previous vertices is ideal, there are no machining errors of the previous vertices transmitted to the current vertex. The vertex entropy of the current vertex under this assumption is defined as the vertex intrinsic entropy . The vertex intrinsic entropy measures the uncertainty of the machining quality caused only by the inherent properties of the current vertex when the interference of other vertices is excluded.
4.3. Establishment and Simulation Verification of the Single-Chain Model
4.3.1. Establishment of Single-Chain Model
Take any vertex
,
in the single-chain subgraph; the PQRVs of the two vertices are
and
, and the IPQRV of the vertex
is
. Then, it can be deduced from information theory that:
Taking Equation (1) into Equation (3), then:
According to the characteristics of the machining process,
and
are independent of each other and satisfy the following formula:
Taking Equation (6) into Equation (4), one gets:
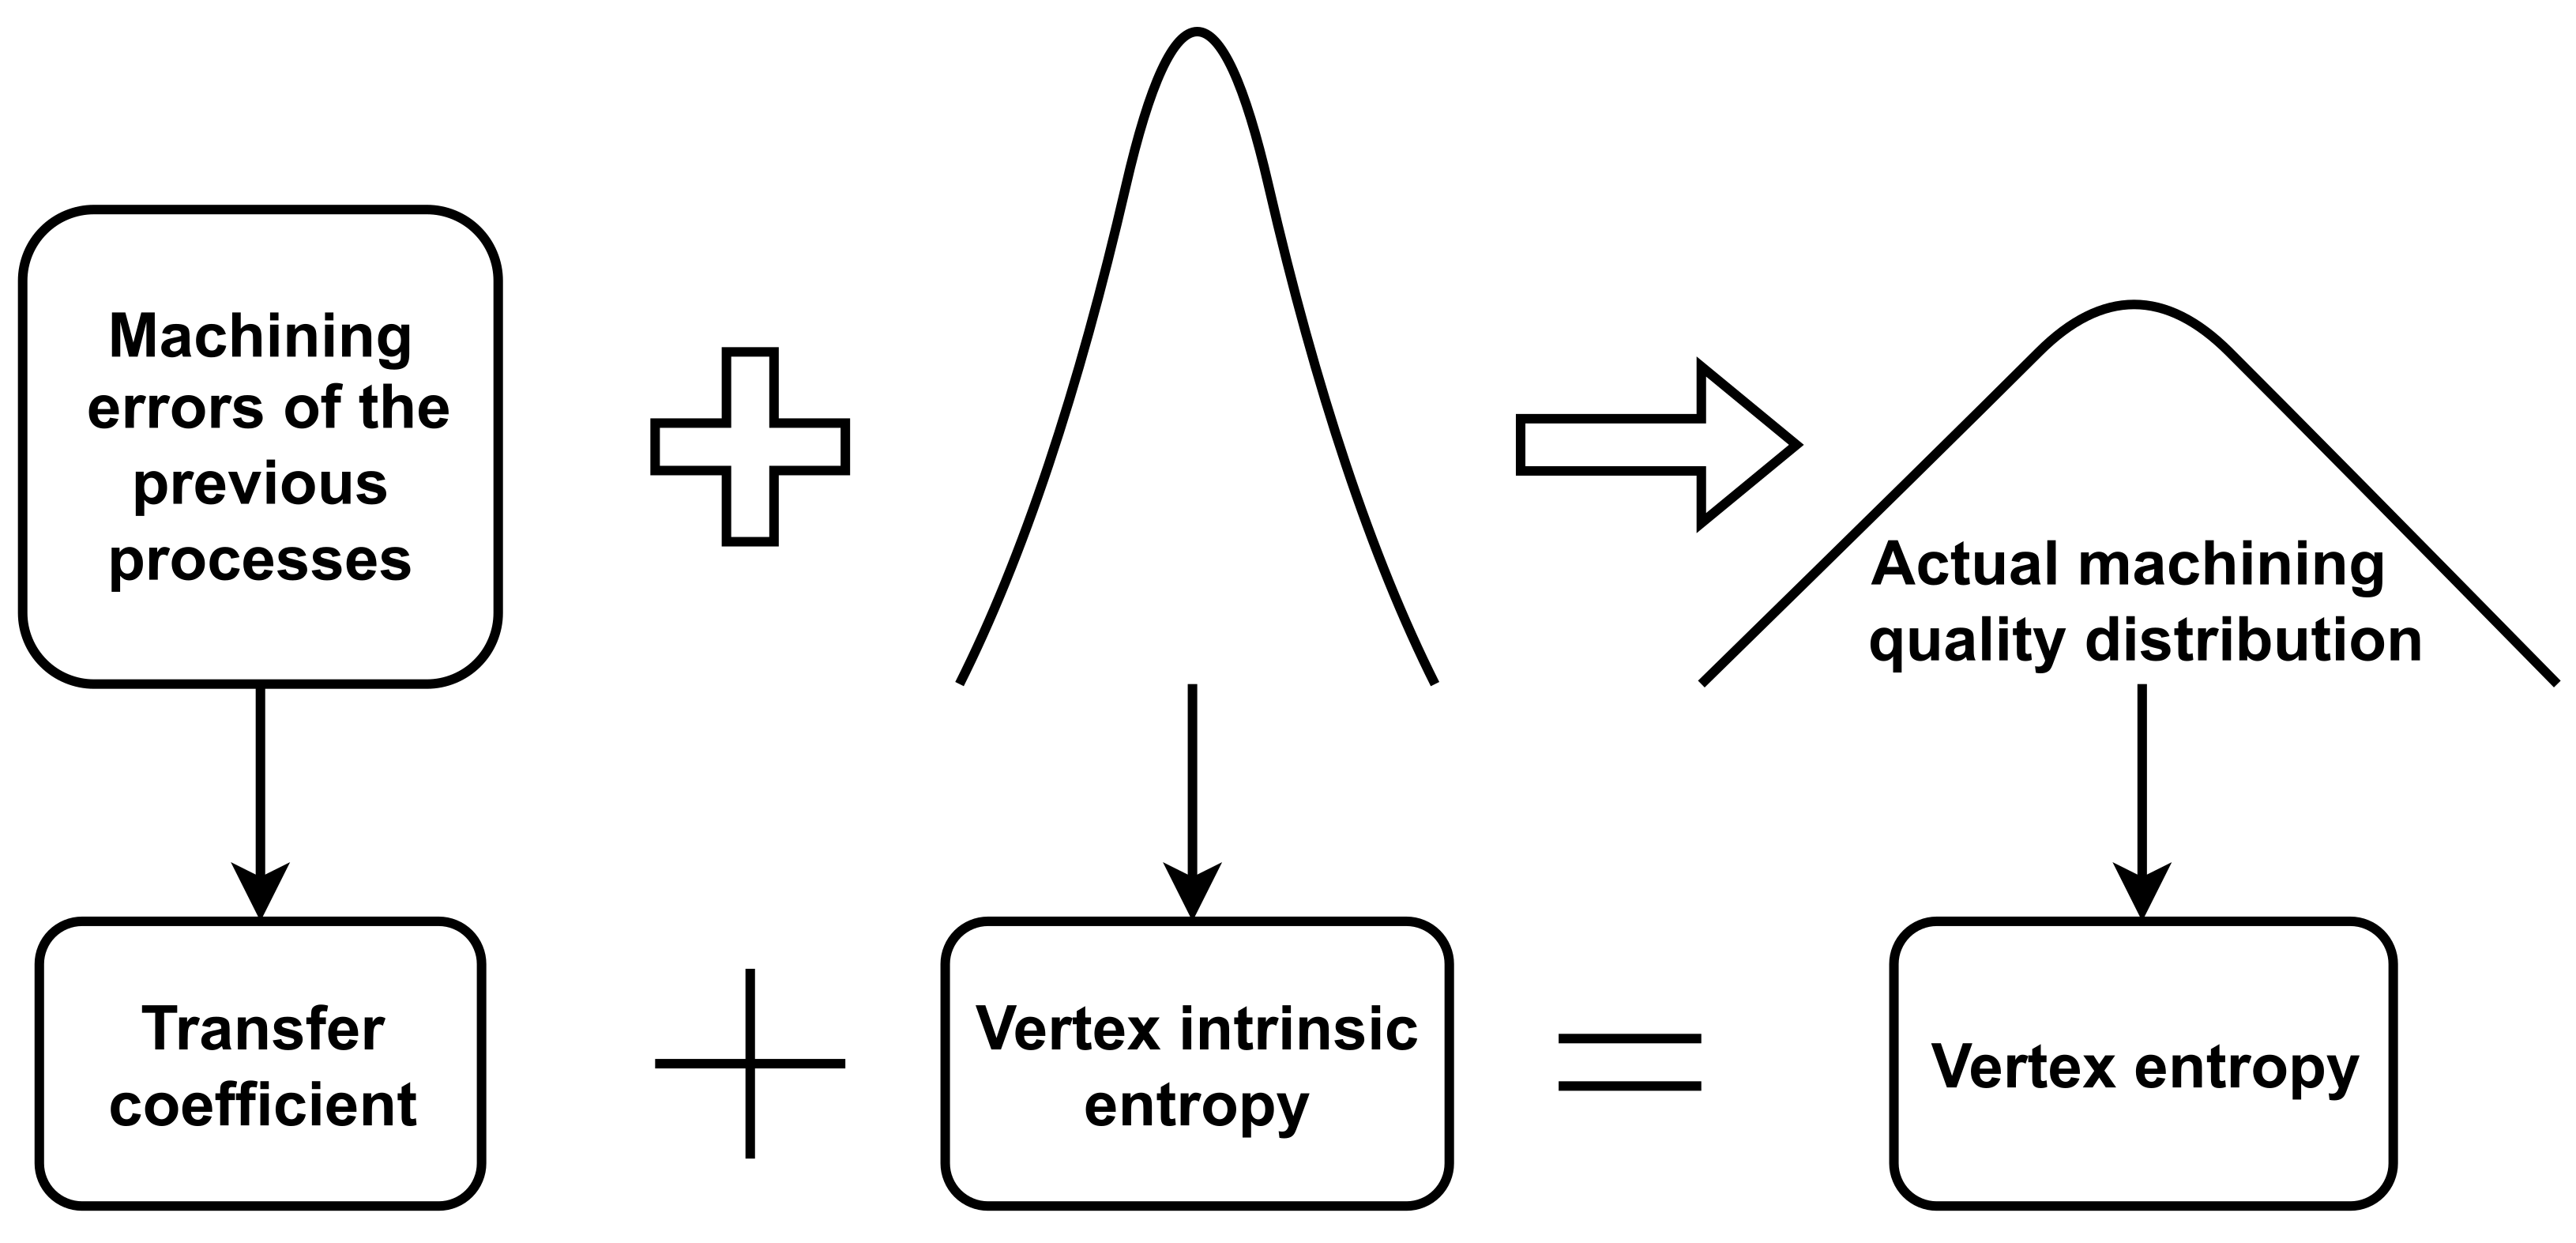
Equation (7) is called the single-chain model. The single-chain model shows that the vertex entropy of
consists of vertex intrinsic entropy and the transfer coefficient, as shown in
Figure 5.
4.3.2. Simulation Verification of the Single-Chain Model
The Monte Carlo simulation is based on probability theory and mathematical statistics and conducts reliability analysis through random simulation or statistical experiments [
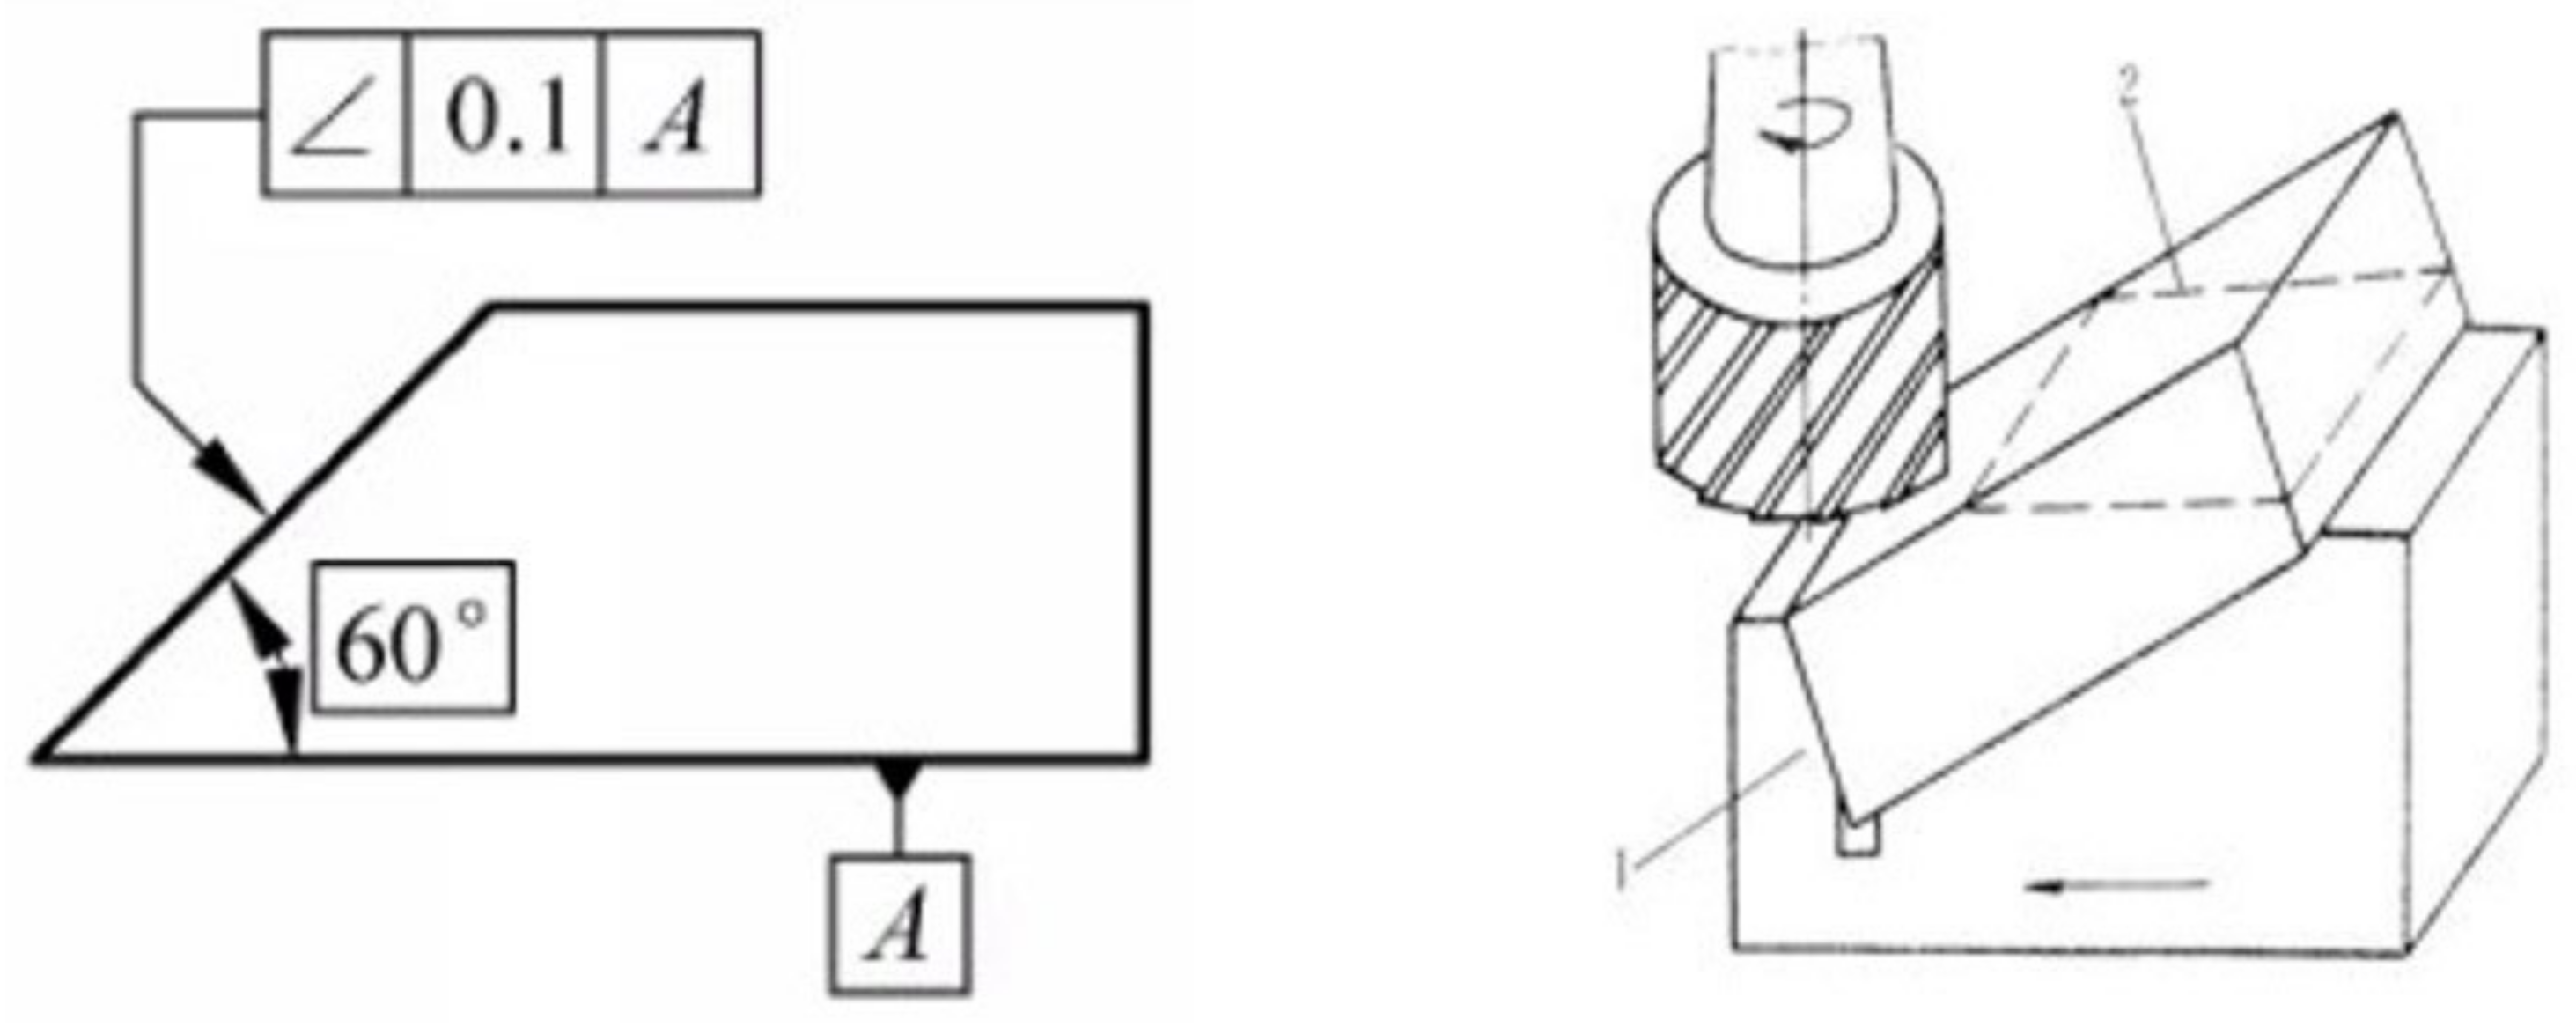
29]. We take the part shown in
Figure 6 as an example and use the Monte Carlo simulation analysis method to verify the correctness of the single-chain model. It can be seen from
Figure 6 that the angle between the left slope and the bottom surface of the part is 60°, and the bottom surface is the process benchmark for machining the bevel. Ideally, the bottom surface is absolutely horizontal, but due to the machining accuracy of the milling machine and other accidental factors, there is an inevitable machining error on the bottom surface where process benchmark A is located. Assume that the bottom surface corresponds to a vertex
and the corresponding vertex of the bevel is
. The PQRVs of
and
are
and
respectively, and the IPQRV of
is
. At the same time, according to the characteristics of the machining process:
[
2]. The specific parameters are shown in
Table 1. We use the Scipy library [
30] to randomly generate machining quality sample points that conform to the distributions of
and
. Then, calculate the sample points of
.
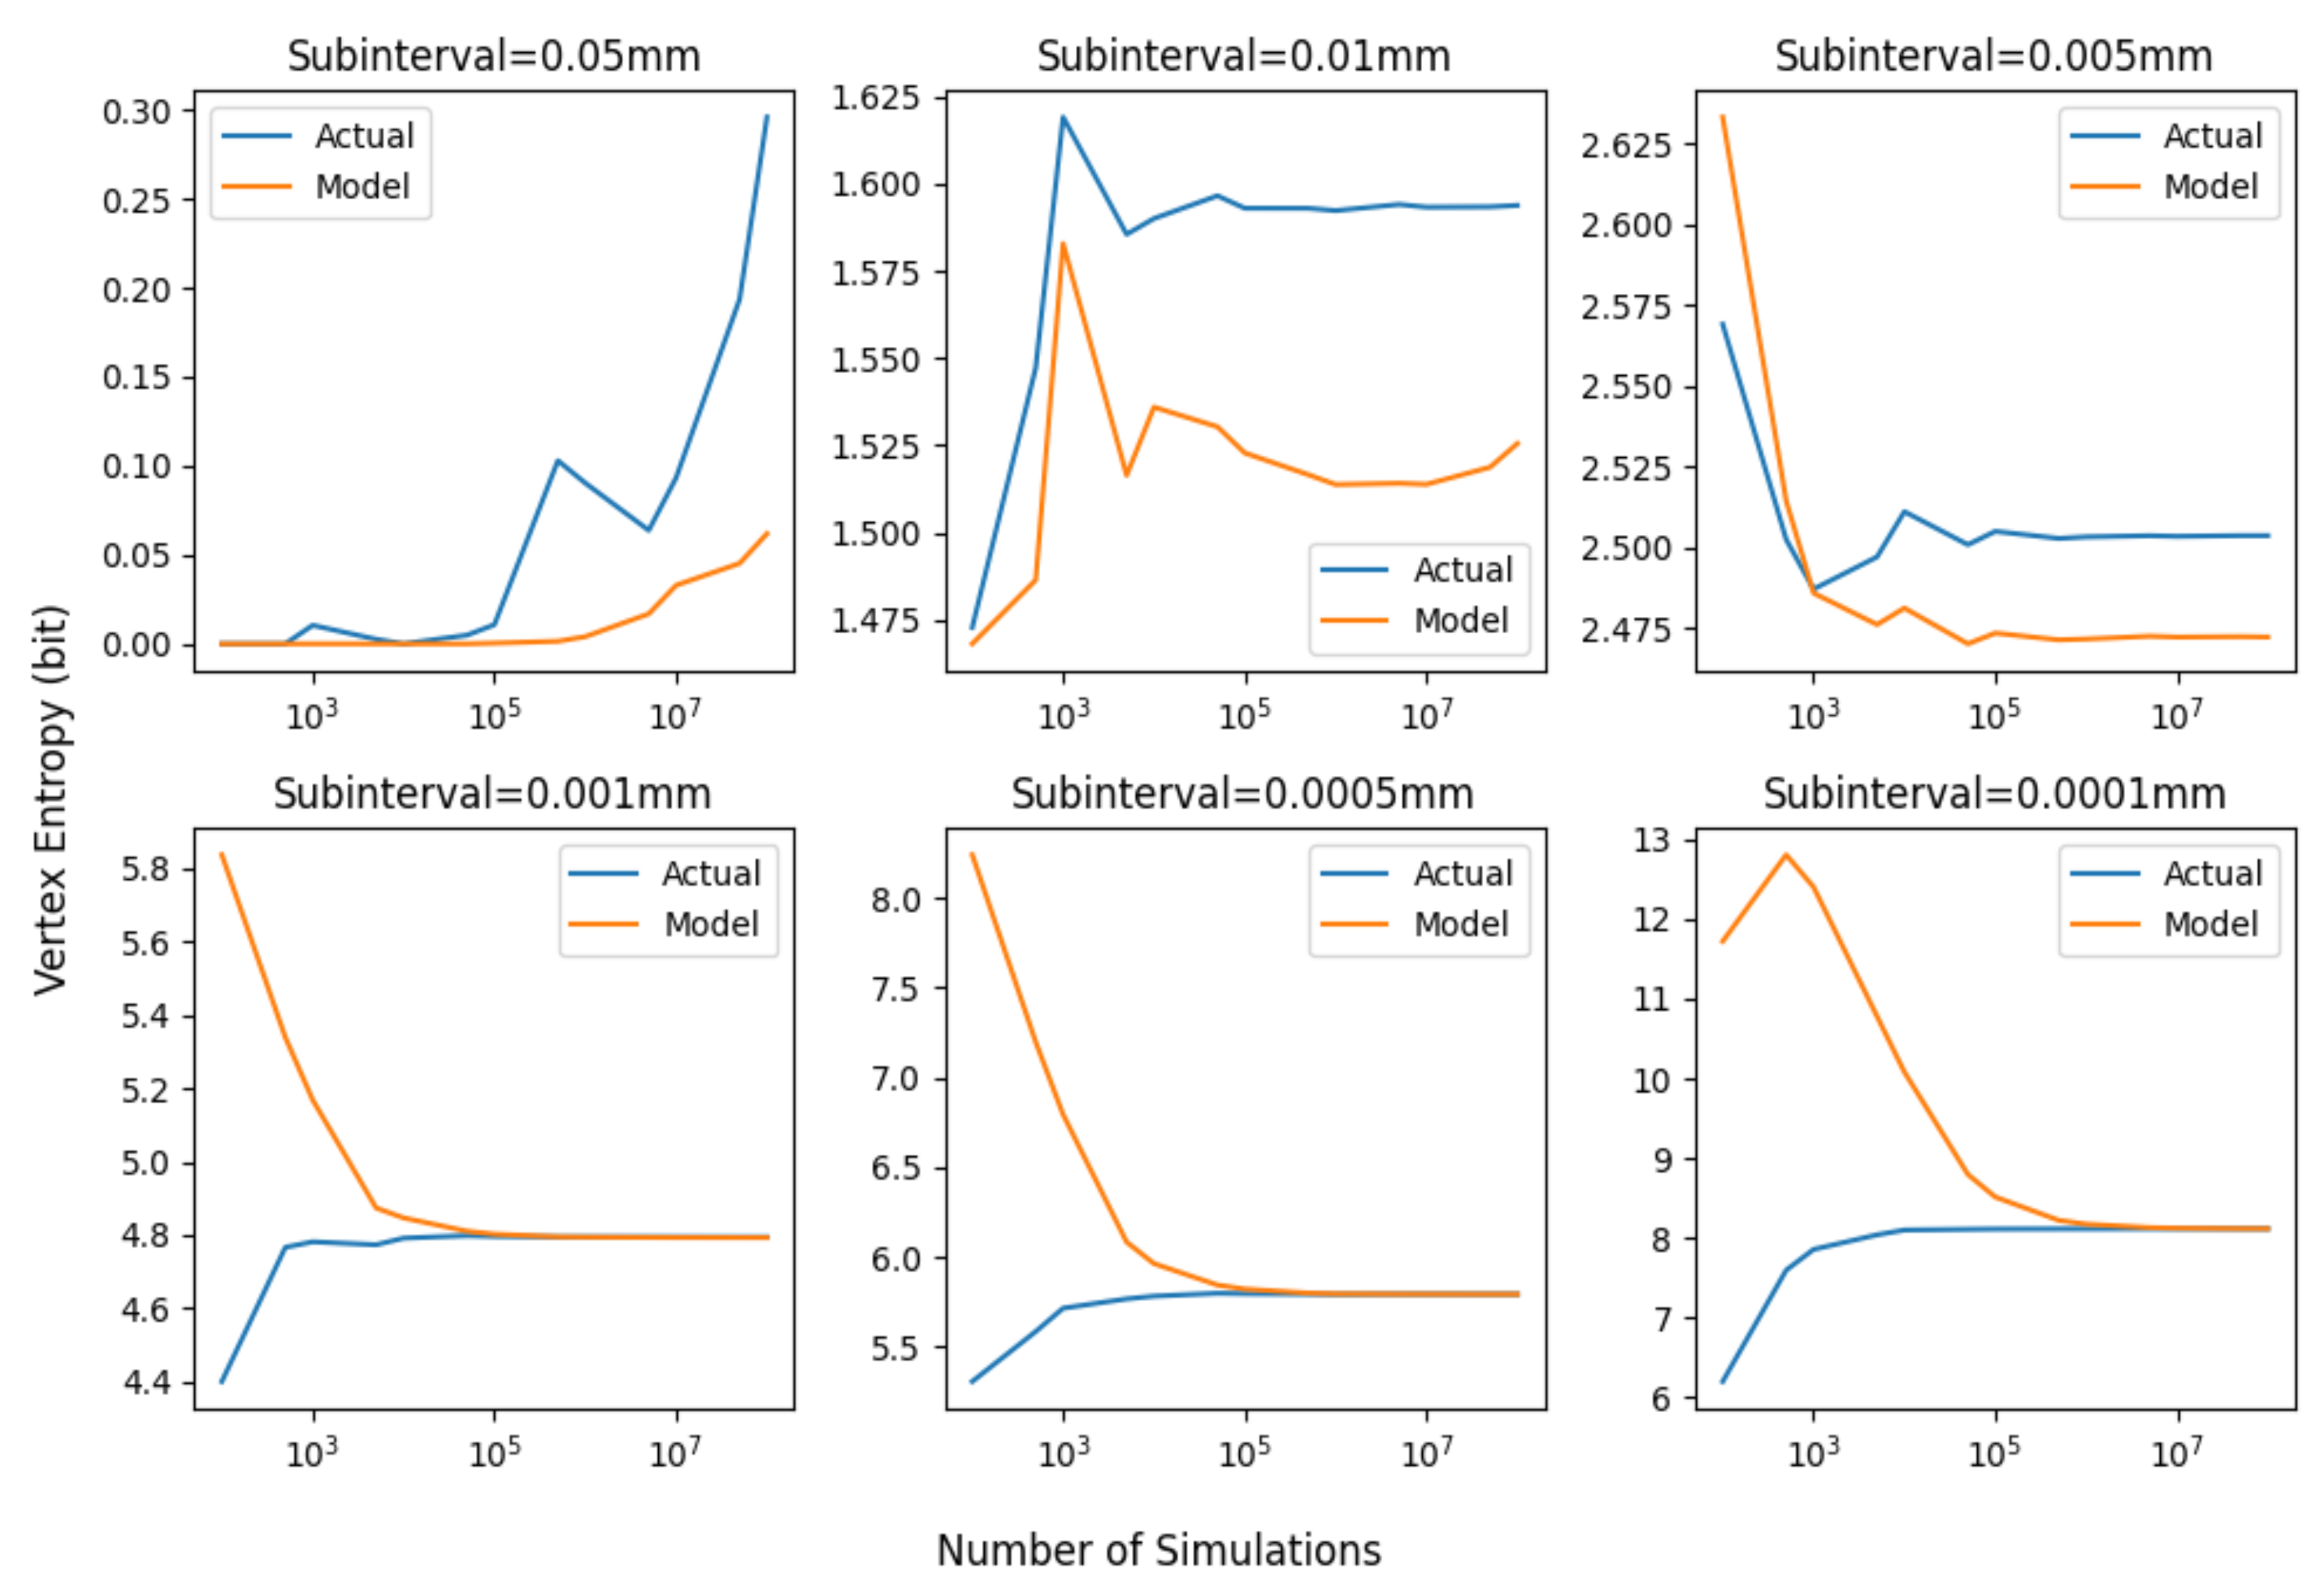
The simulation result is shown in
Figure 7, and the result shows the relationship between the actual vertex entropy of
and the vertex entropy calculated by the single chain model of
(under different subinterval lengths and different simulation times). It can be seen from
Figure 7 that when the length of the subinterval is comparatively large, there is an error between the actual vertex entropy and the vertex entropy calculated by the single-chain model, and it is approximately a constant. With the increase in the simulation time and the decrease in the subinterval length, the actual vertex entropy and the vertex entropy calculated by the single-chain model gradually converge, which verifies the correctness of the single-chain model. Reproducing
Figure 7 may produce slightly different simulation results, which is caused by the randomness of the sample points generated by the simulation program and does not affect the conclusion.
4.4. Establishment of Multi-Chain Model and Simulation Verification of Double-Chain Model
4.4.1. Establishment of Multi-Chain Model
In the multi-chain subgraph shown in
Figure 3, the vertices
may be correlated with each other. Therefore, the single-chain model cannot simply be generalized to the multi-chain subgraph. Based on Equation (8) and combined with the characteristics of the machining process, the multi-chain model is established as Equation (10).
Taking Equations (1) and (7) into Equation (8), then:
According to the characteristics of the machining process
are independent of each other [
31], so Equation (9) becomes:
The first term on the right side of Equation (10) is the vertex intrinsic entropy of the multi-chain vertex. To ensure consistency with the form of the single-chain model, the sum of the second and third terms on the right side of Equation (10) is taken as the sum of multiple transfer coefficients, i.e.,:
The transfer coefficients in the multi-chain model are defined as:
Then, the multi-chain model is obtained, i.e.:
4.4.2. Simulation Verification of the Double-Chain Model
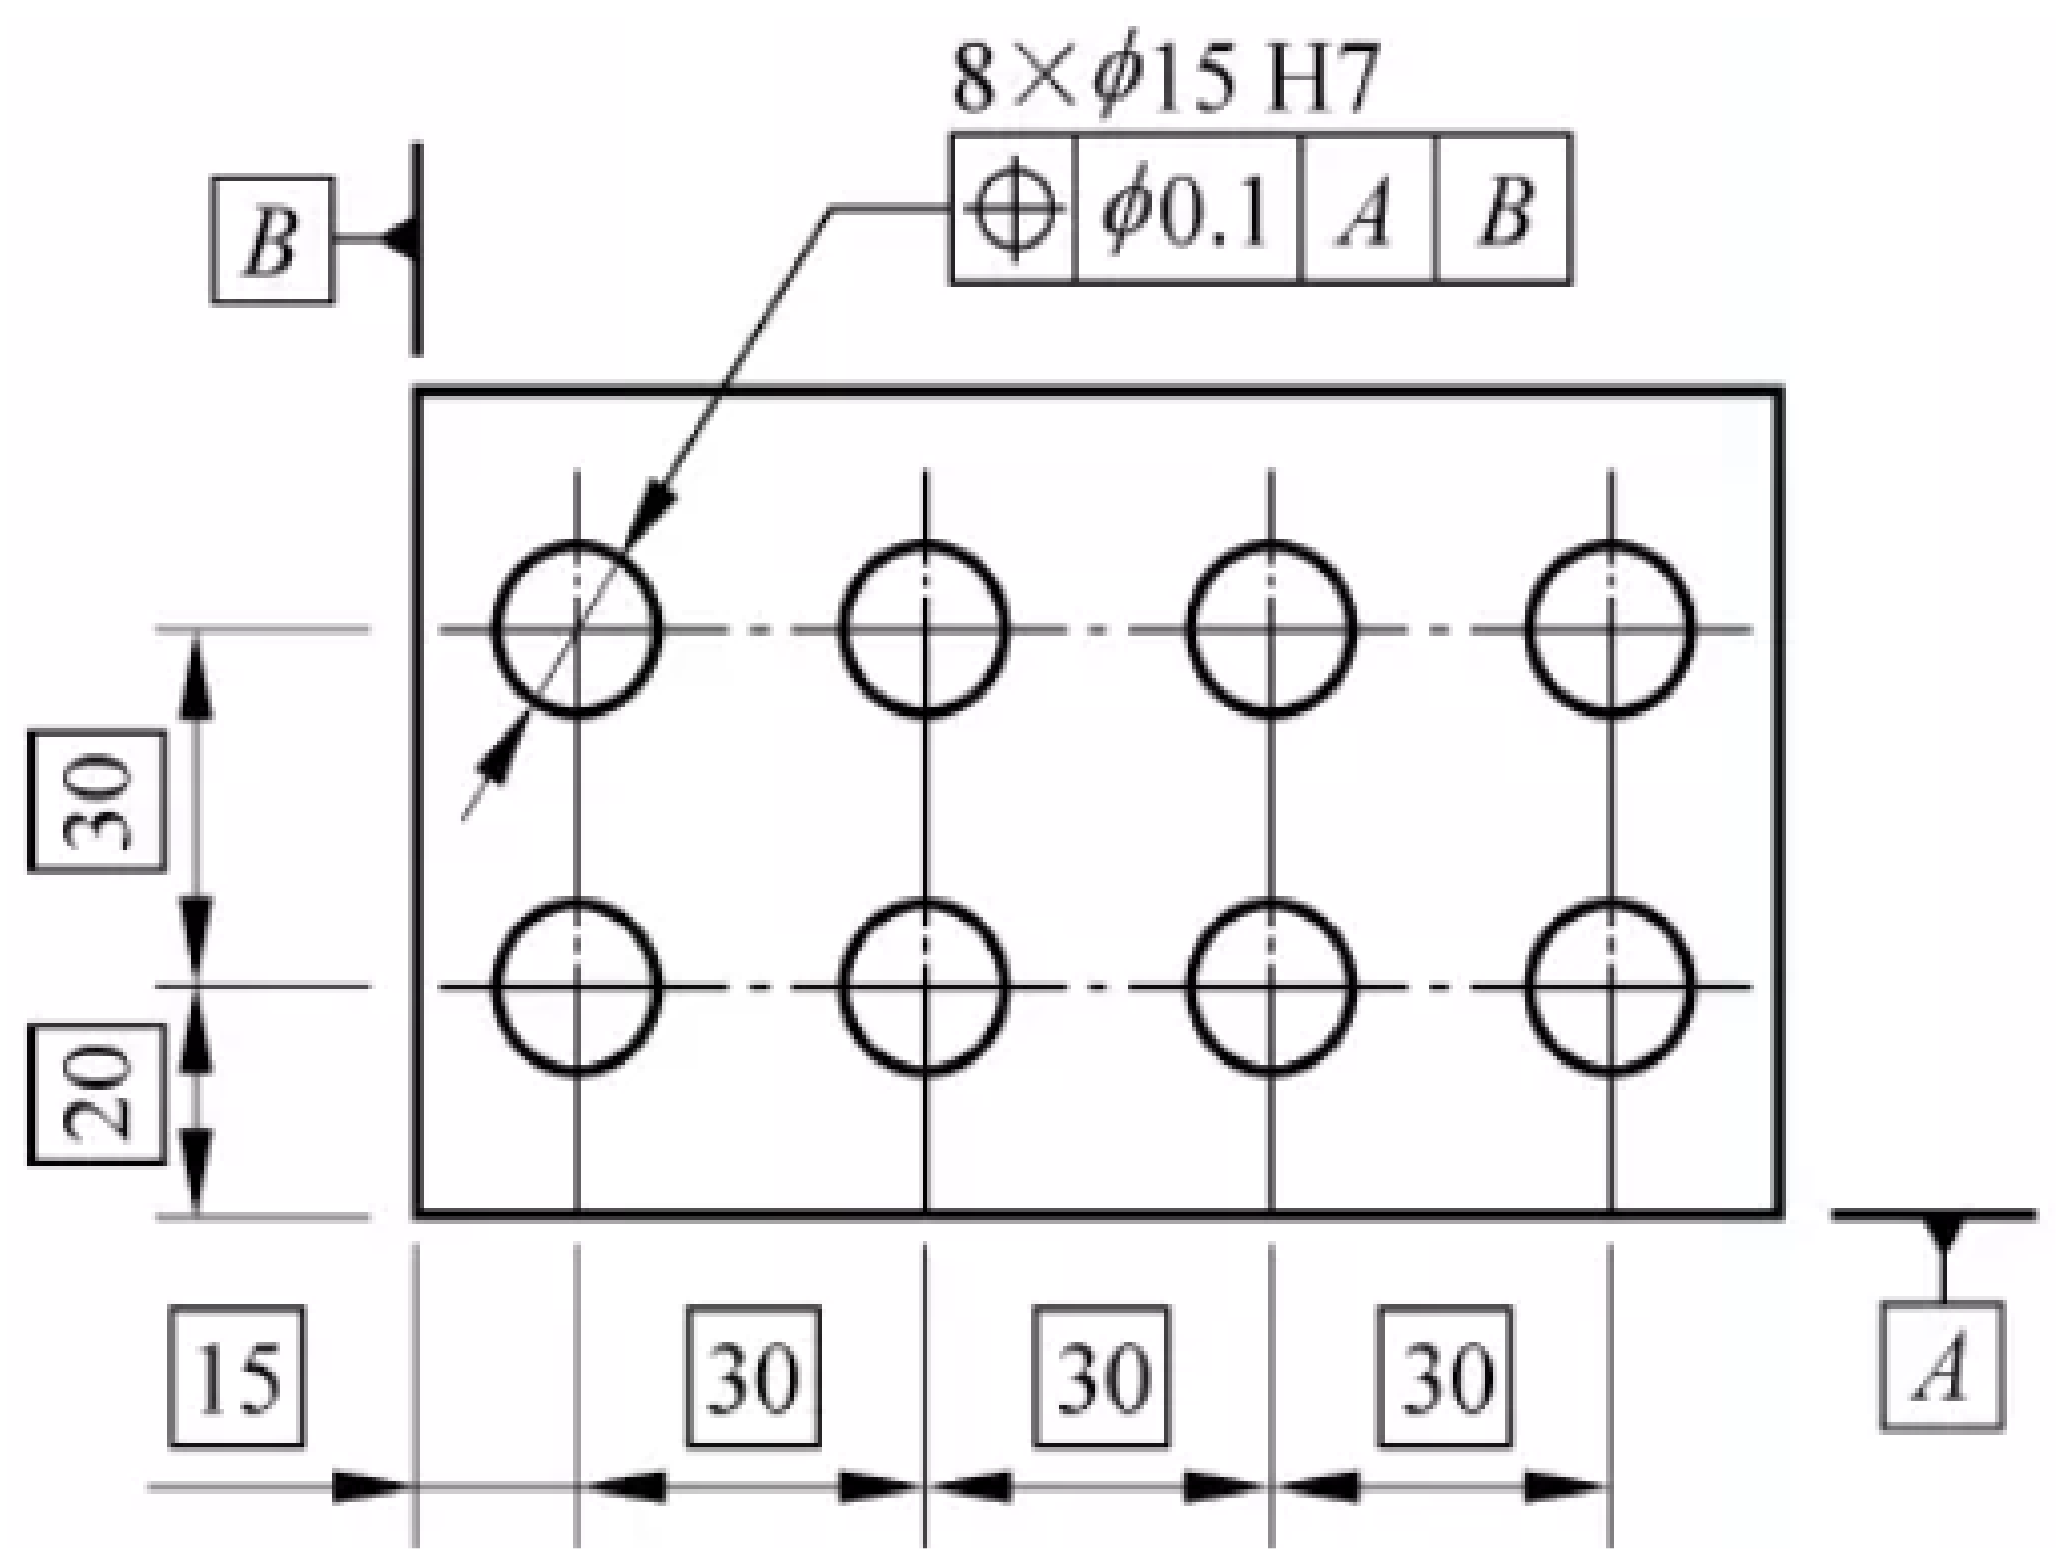
The multi-chain model is more complex, and there are many different situations. The following only takes the double-chain subgraph of Example 2 shown in
Figure 8 as an object to perform the Monte Carlo simulation. Drilling is required during machining the part shown in
Figure 9. The determination of the hole’s position depends on process benchmarks A and B, so the drilling process is a typical double-chain situation [
32]. We select the hole in the upper left corner of the part shown in
Figure 8 as the research object and conduct simulation analysis.
We suppose that vertex
corresponds to the process of machining the bottom plane where benchmark A is located, and vertex
corresponds to the process of machining the left plane where benchmark B is located, and vertex
corresponds to the process of drilling the hole. As shown in
Figure 9, the PQRVs of
and
are
and
respectively. The PQRV and IPQRV of
are
and
respectively, where
,
. According to the characteristics of the machining process:
,
. The specific parameters are shown in
Table 2. We use the Scipy library to randomly generate machining quality sample points that conform to the distributions of
,
,
and
. Then, calculate the sample points of
.
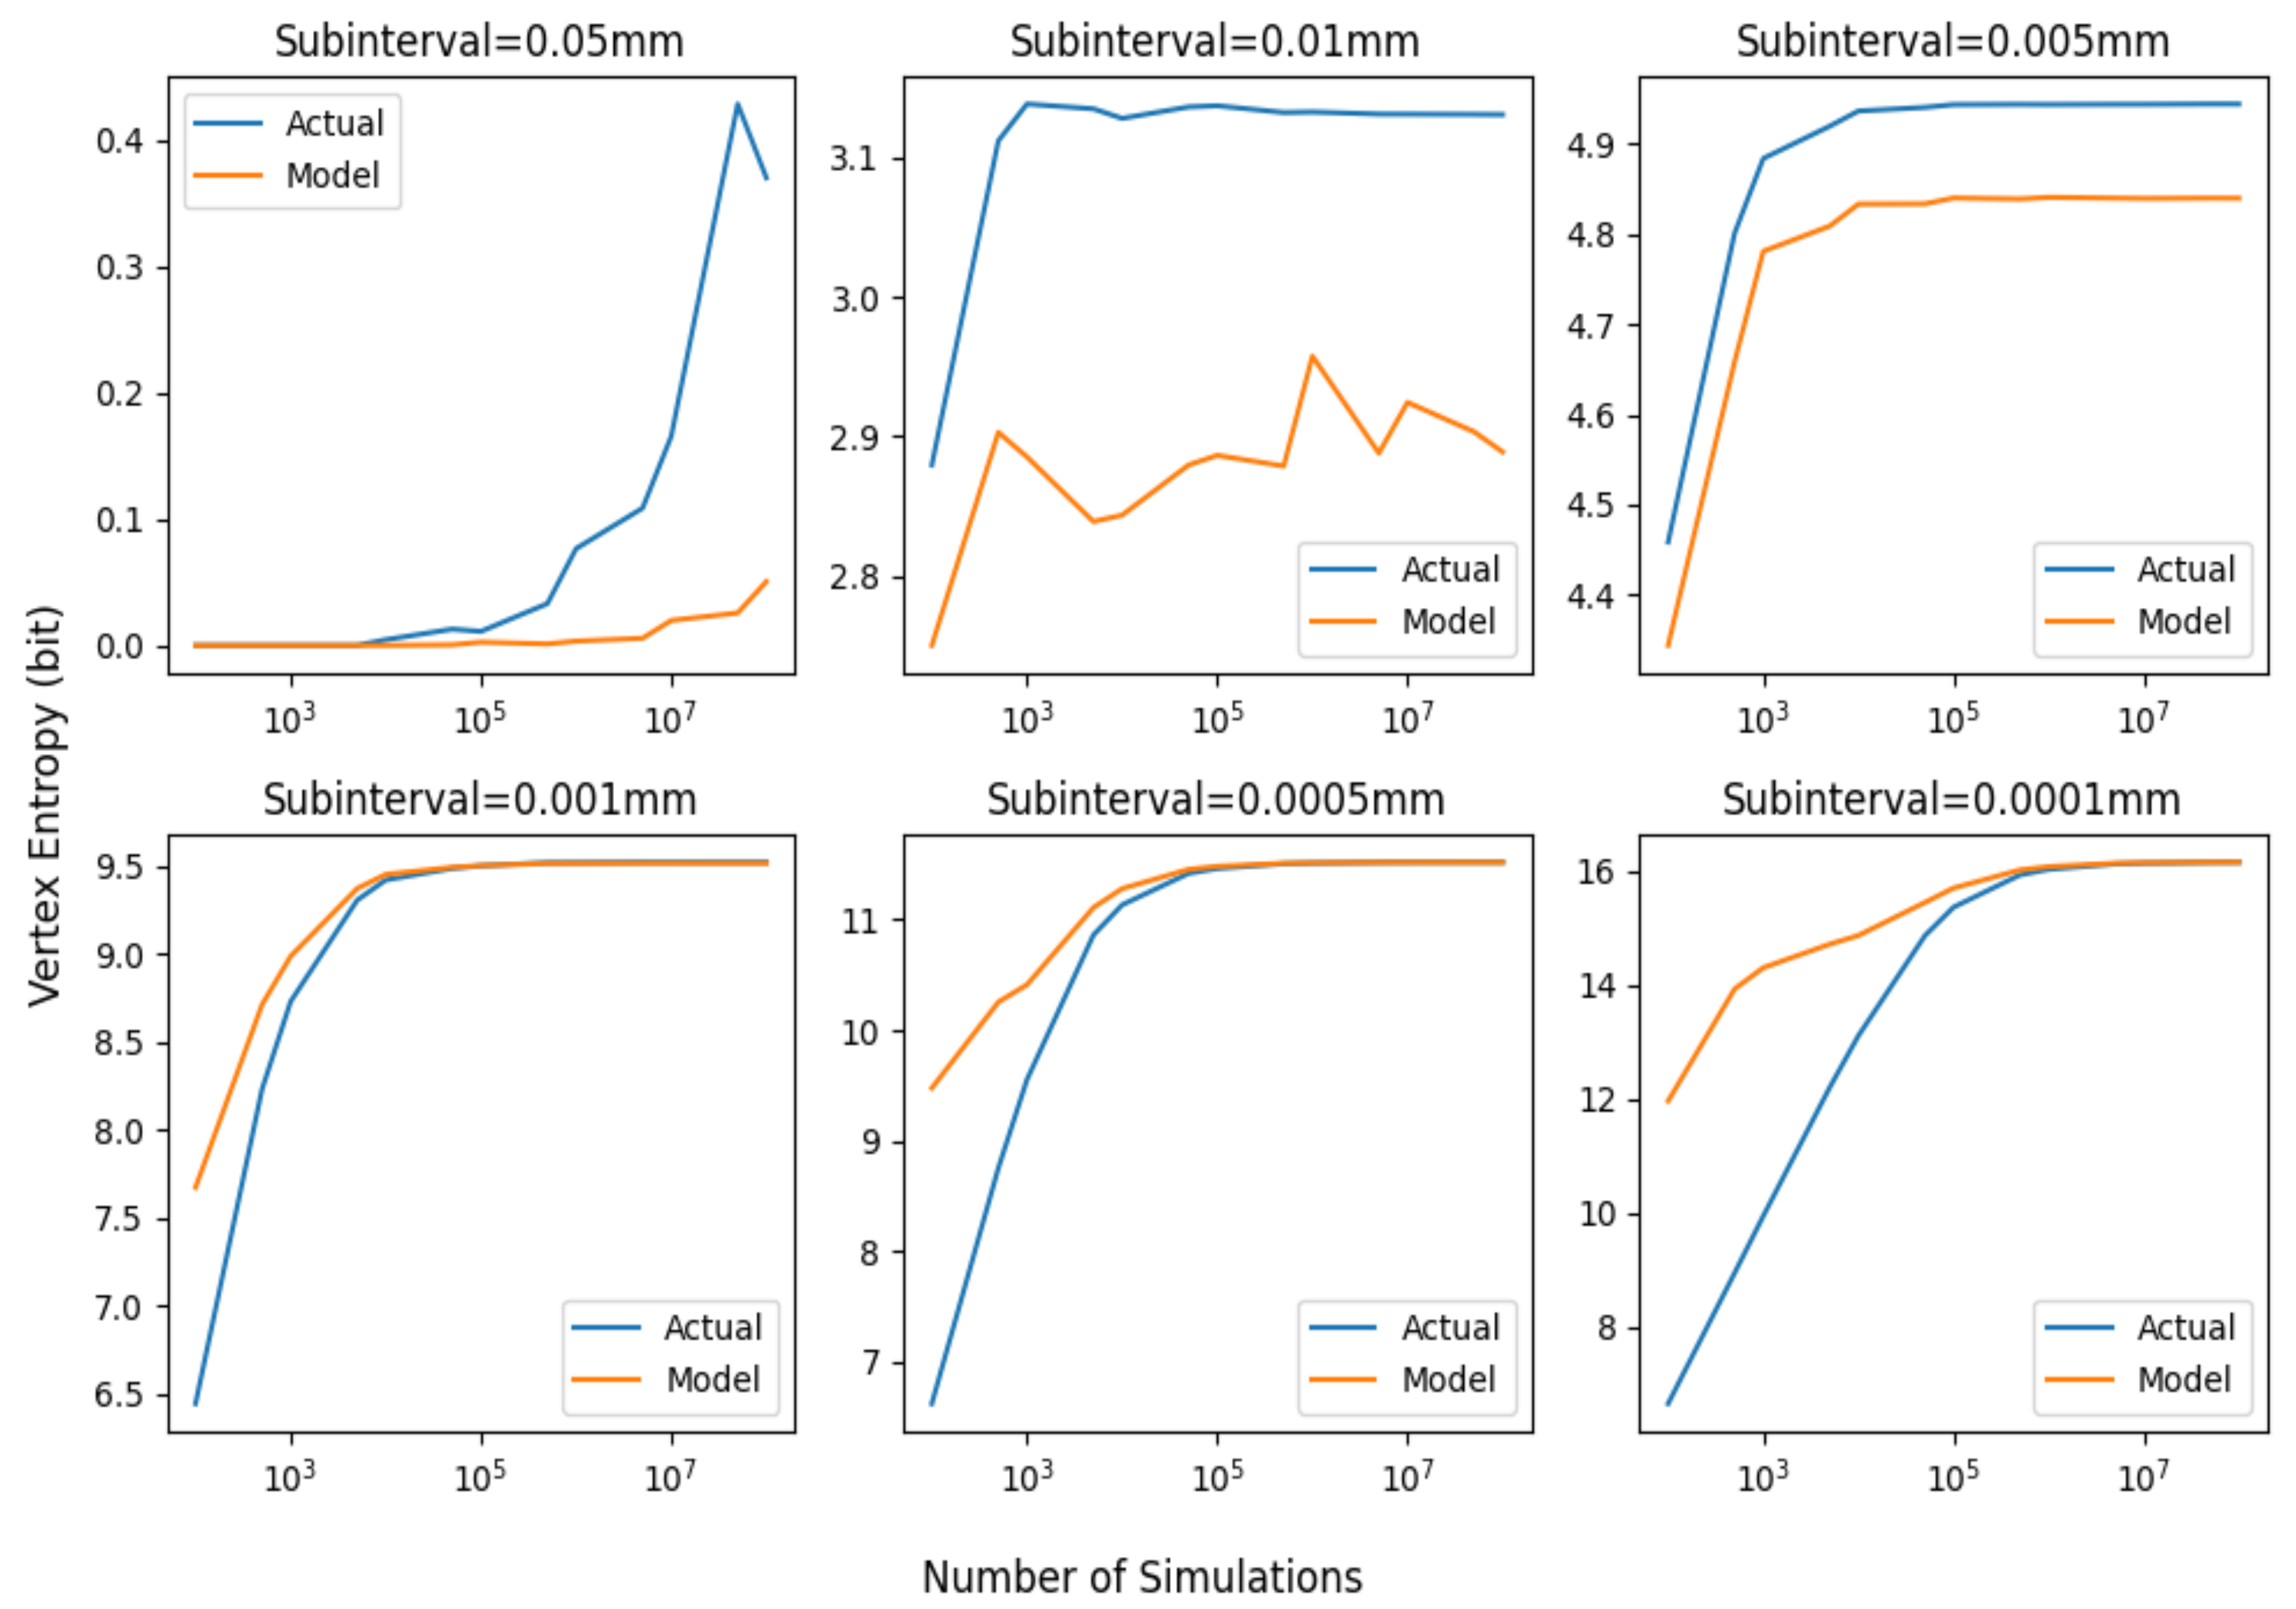
The simulation result is shown in
Figure 10. The result shows the relationship between the actual vertex entropy of
and the vertex entropy calculated by the double-chain model of
(under different subinterval lengths and different simulation times). It can be seen from
Figure 10 that when the length of the subinterval is comparatively large, there is an error between the actual vertex entropy and the vertex entropy calculated by the double-chain model, and it is approximately a constant. With the increase in simulation time and the decrease in subinterval length, the actual vertex entropy and the vertex entropy calculated by the double-chain model gradually converge, which verifies the correctness of the double-chain model and also verifies the correctness of the multi-chain model to a certain extent. Reproducing
Figure 10 may produce slightly different simulation results, which is caused by the randomness of the sample points generated by the simulation program and does not affect the conclusion.
5. Conclusions
This paper introduces the concepts of information entropy and mutual information into the analysis of machining process reliability, thereby achieving the integration of machining error and error transmission. By establishing mathematical models, this study addresses the issue that the subjective factors of researchers in other related studies have an impact on the analysis results and provides a method for quantitatively analyzing the reliability of the machining process. First, the paper defines the directed-weighted process graph to present the relationship between different processes visually. Then, the paper analyzes the reliability of the machining process, and based on the analysis of error transmission, the paper establishes single-chain and multi-chain models. Finally, the correctness of the single-chain and multi-chain models is verified through Monte Carlo simulations. The simulation results show that the single-chain and multi-chain models can correctly reflect the relationship between the machining error of the process and the error transmission. Based on this paper, the proposed models have the potential to be integrated with machine learning and other techniques to predict the quality of machining, avoiding significant economic losses due to unqualified machining quality.
