Article

The Effects of Daubechies Wavelet Basis Function (DWBF) and Decomposition Level on the Performance of Artificial Intelligence-Based Atrial Fibrillation (AF) Detection Based on Electrocardiogram (ECG) Signals

1
Human Centric Engineering & School of Computing, Telkom University, Jl. Telekomunikasi No. 1, Bandung 40257, West Java, Indonesia
2
Department of Computer and Information Sciences, Universiti Teknologi PETRONAS, Seri Iskandar 32610, Perak, Malaysia
3
Department of Cardiology and Vascular Medicine, Faculty of Medicine, Universitas Brawijaya, Jl Veteran, Malang 65145, East Java, Indonesia
*
Author to whom correspondence should be addressed.
Appl. Sci. 2023, 13(5), 3036; https://doi.org/10.3390/app13053036
Submission received: 20 October 2022 / Revised: 25 November 2022 / Accepted: 18 January 2023 / Published: 27 February 2023
(This article belongs to the Special Issue Hardware-Aware Deep Learning)

Abstract

:

Featured Application

A potential application developed from the results obtained by this study is a monitoring system of atrial fibrillation for stroke early warning in both healthy people and heart disease patients.

Abstract

This research studies the effects of both Daubechies wavelet basis function (DWBF) and decomposition level (DL) on the performance of detecting atrial fibrillation (AF) based on electrocardiograms (ECGs). ECG signals (consisting of 23 AF data and 18 normal data from MIT-BIH) were decomposed at various levels using several types of DWBF to obtain four wavelet coefficient features (WCFs), namely, minimum (min), maximum (max), mean, and standard deviation (stdev). These features were then classified to detect the presence of AF using a support vector machine (SVM) classifier. Distribution of training and testing data for the SVM uses the 5-fold cross-validation (CV) principle to produce optimum detection performance. In this study, AF detection performance is measured and analyzed based on accuracy, sensitivity, and specificity metrics. The results of the analysis show that accuracy tends to decrease with increases in the decomposition level. In addition, it becomes stable in various types of DWBF. For both sensitivity and specificity, the results of the analysis show that increasing the decomposition level also causes a decrease in both sensitivity and specificity. However, unlike the accuracy, changing the DWBF type causes both two metrics to fluctuate over a wider range. The statistical results also indicate that the highest AF accuracy detection (i.e., 94.17%) is obtained at the Daubechies 2 (DB2) function with a decomposition level of 4, whereas the highest sensitivity, 97.57%, occurs when the AF detection uses DB6 with a decomposition level of 2. Finally, DB2 with decomposition level 4 results in 96.750% for specificity. The finding of this study is that selecting the appropriate DL has a more significant effect than DWBF on AF detection using WCF.

1. Introduction

Atrial fibrillation (AF) occurs at any age, but the incidence of AF is far more common in older adults than in children [1,2,3]. In the European Union, the number of subjects with AF (those aged ≥ 55) is estimated to be doubled from 2010 to 2060, i.e., from 8.8 to 17.9 million [4]. Meanwhile, in the US, the number of subjects with AF will reach more than 5.6 million in 2050. Half of them will be over 80 years old.
AF is a heart rhythm disorder that is characterized by irregular heart contractions [5,6]. It is triggered by two conditions, i.e., the deceleration of conduction velocity in various atrial regions and an increase in the heterogeneity of atrial refractoriness. Other conditions, such as an overactive thyroid (thyroid gland) or the excessive use of alcohol, can also cause AF. Although there is an insignificant relationship, AF is also often associated with an increased risk of chronic kidney disease, ischemic heart disease, and sudden cardiac death [7,8]. AF is not classified as a severe disease; however, it may induce paralysis complications, such as heart failure and atrial thrombosis, with a risk of stroke [9]. One in three patients with AF will not have any symptoms. The early management of AF needs to be performed in the detection and screening of AF. In 2020, the European Society of Cardiology (ESC), through its guidelines, recommended that wearable devices be employed for the self-detection of AF in the general population [10].
Along with advances in telecommunications technology and mobile apps, several portable AF detectors have been proposed and developed [11]. Based on the type of signal used, AF detectors can be categorized into two groups, namely, photoplethysmogram (PPG)-based detectors and electrocardiogram (ECG)-based detectors. Fan, et al. [12] developed an Android app on Huawei smartphones to detect AF. The application utilizes the smartphone’s camera to detect blood volume changes in accordance with the principle of the PPG sensor. Then, the validation is carried out using the ECG-12 Leads Standard. The analysis results have shown that the Android application is able to work well; the accuracy in detecting AF was 94%. Tison, et al. [13] used a PPG-based commercial smartwatch to identify AF. Evaluation results showed that the accuracy of AF detection in patients undergoing cardioversion treatment was high. Unfortunately, it is not for outpatient use. Gropler, et al. [14] evaluated the accuracy of ECG-based off-the-shelf KardiaMobile products from AliveCor [15] for detecting arrhythmias (including AF) in the pediatric population. The results of the study showed that KardiaMobile could well distinguishing ECG signals in a population of healthy children and populations of children with heart disease. The false-positive rate in detecting AF was 13 percent (4/30). Using the same type of device as Gropler, et al. [14], HABERMAN, et al. [16] conducted research on different subjects. The subjects used in the research were elite athletes and cardiac clinic patients. The results of the study concluded that KardiaMobile was suitable for general conduction and arrhythmia screening.
There are several steps that must be performed to detect atrial fibrillation. These steps are shown in detail in Figure 1, consisting of signal preprocessing (denoising), segmentation, feature extraction/selection, and classification [17,18,19]. As shown in Figure 1, the first step of detecting AF is denoising, which is the process of removing noise using either analog or digital filters. It can be performed in both hardware and software [20]. The second step is signal segmentation for recognizing a complete cycle of the signal [21]. Feature extraction/selection is a further process after the signals can be identified. In ECG-based detectors, the interval of RR is frequently used as a feature for detecting AF [22,23,24,25]. Another feature that is often utilized for AF detection purposes is the QRS signal duration, as used by Aeschbacher, et al. [26]. Finally, classification is a technique used in grouping features according to the type of arrhythmia, such as: premature atrial contraction (PAC), premature ventricular contraction (PAC), AF, or ventricular tachycardia/ventricular fibrillation (VT/VF). Many studies have used artificial intelligence, such as machine learning algorithms, to classify the feature data of arrhythmia, such as in Yang, et al. [27], Rohr, et al. [28], Chickaramanna, et al. [29], Jahan, et al. [30], to achieve accurate detection results.
Feature extraction is the key to success in arrhythmia detection (including AF). There are several feature extraction techniques have been proposed for detecting AF features, such as in Kumar, et al. [18], Gokana, et al. [22], Kennedy, et al. [23], Asgari, et al. [31], Dalila, et al. [32], He, et al. [33], Saraswat, et al. [34], Gupta, et al. [35]. In general, ECG-based AF extraction techniques can be classified into two categories [36], i.e., feature extraction (FE) based on dynamic features of the signal [16,22,26,37,38,39,40,41] and FE based on the signal morphology [18,31,33,34,35].
In the dynamic feature category, there are several AF features that can be identified from ECG signals, such as RR interval, QT segments, and QRS duration. In 2014, RR intervals and the Shannon entropy of AF-confirmed ECG signals were used by Gokana, et al. [22] as features for detecting AF. Both features were then classified using a proposed classification algorithm. The experimental results showed that the AF detection accuracy reached 99.5%. In 2019, Nguyen, et al. [37] combined both RR intervals and the variability of QT segments as parameters of AF identification. The accuracy in detecting AF was 94%. Unfortunately, Nguyen, et al. [37] did not share information about sensitivity and specificity in their report. Aeschbacher, et al. [26] revealed the relationship between AF occurrence and QRS duration. They found that in a large population, QRS duration was an independent predictor of AF incidence in women but not men.
In the FE group based on signal morphology, researchers have attempted to eliminate the method for detecting P peaks, R peaks, or T peaks so that the performance of AF detection does not depend on the quality of beat detection. In 2015, Asgari, et al. [31] used stationary wavelet transform (SWT) as a method to extract AF features from ECG signals. They used the support vector machine (SVM) classifier to classify the AF features. Experiments showed that the sensitivity achieved was 97.0% and the specificity of detection was 97.1%. He, et al. [33] also proposed using a wavelet to obtain AF features. However, unlike Asgari, et al. [31], the features used were continuous wavelet transform (CWT), and the classifier chosen was the convolutional neural network (CNN). The experiments carried out resulted in a sensitivity of 99.41%, with a specificity of 98.91% and an accuracy of 99.23%. In 2018, Kumar, et al. [18] analyzed log energy entropy (LEE) and permutation entropy (PEn) features to identify AF. Both features were calculated from a sub-band signal generated by flexible analytic wavelet transform (FAWT). Experimental results showed that LEE was superior to PEn, with the accuracy, sensitivity, and specificity being 96.864%, 95.8%, and 97.8%, respectively. In the experiment, the classifier chosen was random forest (RF).
In general, morphological-based feature extraction studies, as explained in the previous paragraph, only focus on proposing new methods without an in-depth exploration of the effects of wavelet parameters, such as wavelet basis functions (WBFs) and decomposition levels, on overall system performance. As a consequence, the results are not optimal, and there is uncertainty about whether it is the best result or not. Kumar, et al. [18] only observed the effect of the number of features derived from LEE and PEn based on accuracy, sensitivity, and specificity. The features of the wavelet function were not explored. Almost similar to Kumar, et al. [18], Asgari, et al. [31] also only focused on log energy entropy (LEE) and permutation entropy (PEn). As He, et al. [33] relied on deep learning methods, they did not explore wavelet features. Parameter setting was only performed on the convolution neural network (CNN) method, such as the learning rate initial value, the moment coefficient, and several other parameters on CNN. On the other hand, Saraswat, et al. [34] only showed wavelet features without computing the accuracy, sensitivity, and specificity of these wavelet features. Recently, Gupta, et al. [35] proposed a fractional wavelet transform for use in the detection of AF. Instead of exploring the wavelet function for the features in detecting AF, the authors used the wavelet to remove ECG noise.
To overcome the problems above, this research proposes a study of the effect of WBF and decomposition level on the performance of artificial intelligence-based AF detection when the features used are wavelet coefficients. There are four wavelet coefficient features used in this research, i.e., maximum, minimum, average, and standard deviation of the wavelet coefficient. The artificial intelligence-based classifier chosen in this study is support vector machine (SVM). The next chapter discusses material and methods, results and discussion, and conclusions.

2. Materials and Methods

This section explains the material and methods used in this research. The material covers data and parameters for experiments, tools, and matrices, while the method is a procedure used in processing ECG signals in order that atrial fibrillation and normal data can be detected.

2.1. Material

2.1.1. Data Sources

In this study, the experimental data used are MIT-BIH data (AFDB and NSRDB), which are publicly available on Physionet [42,43]. AFDB is the result of long-term ECG recordings from 25 AF-indicated subjects (mostly paroxysmal). The duration of each recording is 10 h. It consists of two ECG signals taken at a frequency of 250 Hz and has a 12-bit resolution in the ±10 millivolt range. There are four distinct rhythms in each recording: AF (atrial fibrillation), AFL (atrial flutter), Jr (AV junctional rhythm), and N (all other rhythms). However, the rhythm used in this study is AF only. This research excludes 2 pieces of data, i.e., numbers 00735 and 03665. Both 0735 and 03665 have no AF samples. In addition, both pieces of data are also not audited [43]. The same scenario was also used in several previous studies [18,31,44,45,46]. For the normal data, this study uses the Normal Sinus Rythm Database (NSRDB). NSRDB provides 18 long-term ECG records from subjects referred to the Arrhythmia Laboratory at Beth Israel Hospital in Boston (now Beth Israel Deaconess Medical Center). The subjects chosen did not have significant arrhythmias and consisted of 5 men, aged 26 to 45, and 13 women, aged 20 to 50 years. The details of the data used in this study are showed in Table 1.

2.1.2. Parameter of Experiments

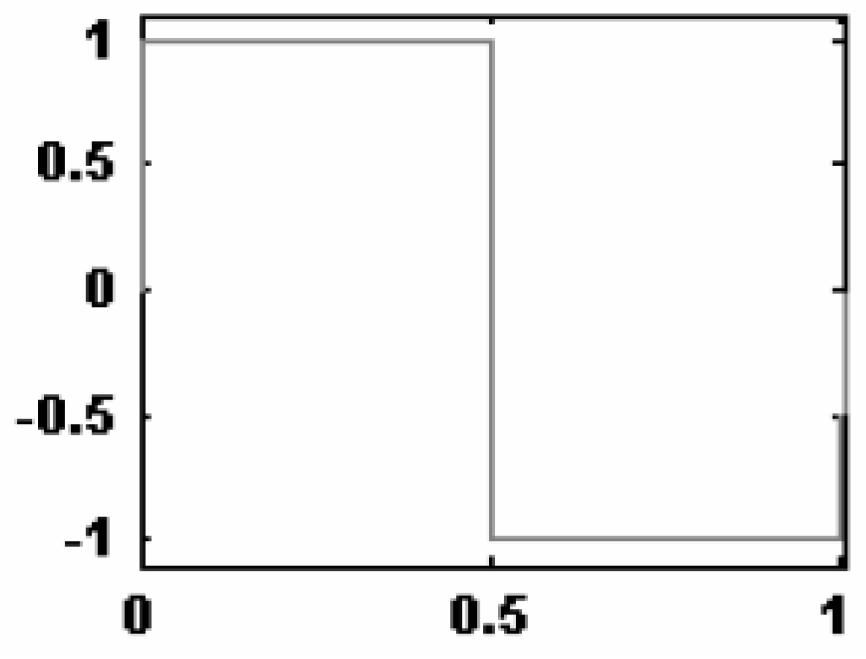
The parameters of experiments in this study are both wavelet basis function (WBF) and decomposition level (DL). Ten WBFs from the Daubechies wavelet family, DB1 to DB10, together with DL1 to DL10, have been selected. Daubechies are wavelets with a number of vanishing moments (N), and the minimum filter size is 2N [47,48]. The simplest and the oldest function in Daubechies is the Haar wavelet (DB1). It has a value of either 1 for 0 ≤ x ≤ 0.5 or −1 for 0.5 ≤ x ≤ 1; otherwise, it will be 0. This wavelet has a disjointed pattern, resembling a square shape [49], as shown in Figure 2.
DBN wavelets, except for Haar wavelets, with a length of 2N − 1 (orders 2 to 10) are presented in Figure 3 [49].
The wavelet decomposition level is a level or order of decomposition of a signal in the wavelet domain. In discrete wavelet transform (DWT), a signal form can be approximated (to be decomposed) by N orthogonal wavelet signals consisting of detailed and approximation signals. N is the order of decomposition or decomposition level (DL) [50]. The DL is very important in determining the accuracy of the wavelet function approach to a signal form. DWT decomposition can be defined in Equations (1) and (2) as follows:
s ( i ) ( l ) = x ( k ) φ i , l ( k ) ,
d ( i ) ( l ) = x ( k ) ψ i , l ( k ) ,
where s ( i ) ( l ) and d ( i ) ( l ) are the approximation coefficient and the detail coefficient at resolution i of scaling function φ i , l ( k ) and orthogonal wavelet function ψ i , l ( k ) . Wavelet scale basis functions φ i , l ( k ) and wavelet functions ψ i , l ( k ) are defined by Equations (3) and (4) as follows:
φ i , l ( k ) = 2 i 2 h i ( k 2 i l ) ,  
ψ i , l ( k ) = 2 i 2 g i ( k 2 i l ) ,  
where factor 2 i 2 is the normalized inner product, i and l are scale parameters and translational parameters, and k is a discrete time sample [51].

2.1.3. Environments

This study uses both software and hardware for experiments, as follows:
  • The hardware for experiments consists of a personal computer that is set up as a server. The server specifications are OMEN by HP Obelisk Desktop 875-0075d, 12GB RAM, and 1TB Hard disk.
  • The software used in this study is Windows 10 Home Single Edition, which has a Python program for running the experiments. In addition, Pychram 2018 is also installed for editing Python programs.

2.1.4. Metrics

Several metrics are used in this study to measure the performance of the AF detector, such as sensitivity, specificity, and accuracy. Sensitivity is the proportion of actual AF rhythm that is correctly identified as AF, and specificity is the proportion of normal rhythm that is correctly detected as normal. Finally, accuracy represents the overall accuracy of the method used [52]. In detail, the formulas of sensitivity, specificity, and accuracy can be seen in Equations (1)–(3), as follows:
S e n s i t i v i t y = TP TP + FN 100 % ,
S p e c i f i c i t y = TN TN + FP 100 % ,
A c c u r a c y = TP + TN TP + TN + FP + FN 100 % ,
where TP is true-positive, TN is true-negative. TP can be defined as the number of AF beats that is correctly detected as AF. Meanwhile, TN is the number of normal beats that is correctly identified as normal. In those formulas, FP (false-positive) is the number of normal beats that is incorrectly detected as AF, and FN (false-negative) is the number of AF beats that is identified incorrectly as normal. Furthermore, confusion test metrics are presented in Table 2.

2.2. Methods

2.2.1. Development of Training and Testing Data

To identify AF and normal rhythms, a support vector machine (SVM)-based classifier must be trained using training data. The training dataset is based on normal and AF features derived from the statistic of wavelet coefficients. Two steps must be taken in developing the training dataset, i.e., 1. Remove the raw data that is labeled other than AF. Perform the same process to delete the data that is not labeled as normal in the dataset from NSRDB. 2. Implement a DWT feature extraction algorithm to obtain the statistic of wavelet coefficients (maximum, mean, minimum, and standard deviation). The wavelet coefficients signal can be defined as in Equation (8).
S = A n + D n + D n 1 + + D 1  
where An and Dn are the approximation and detail at a decomposition level n, respectively. Figure 4 shows an example of raw data labeled as normal and AF from both NSRDB and AFDB. As shown in Figure 4, the peak-to-peak distance of the adjacent waves in a normal ECG signal is the same. On the other hand, in an ECG AF signal, the distance tends to fluctuate.

2.2.2. Feature Extraction

Algorithm 1 shows the feature extraction process of raw data (normal and AF data), as mentioned in Section 2.2.1. As can be seen from Algorithm 1, the DWT function extracts the ECG raw data by decomposing the ECG signal into several frequency sub-bands [51,53].
Algorithm 1. Feature Extraction Algorithm.
    function wavedec(data, wavelet, mode=‘symmetric’, level=None, label, axis = −1):
      a = data;
      coeffs_list = [];
      features = np.array([]);
      label = np.array ([label]);
       #set wavelet family
       wavelet = call_Wavelet(wavelet)
      #S = An + Dn + Dn−1 + ... + D1
      for ilevel:
         #extract a:approximate, d:detail
         a, d = DWT(a, wavelet, mode, axis)
       coeffs_list.append(d)
      coeffs_list.append(a)
      coeffs_list.reverse()
       #cal_stats return max, mean, min and std
       features = np.append(features, cal_stats(coeffs_list[0]))
      for 1ilen(coeffs_list):
       features = np.append(features, cal_stats(coeffs_list[i]))
      return np.append(features, label)
      end function
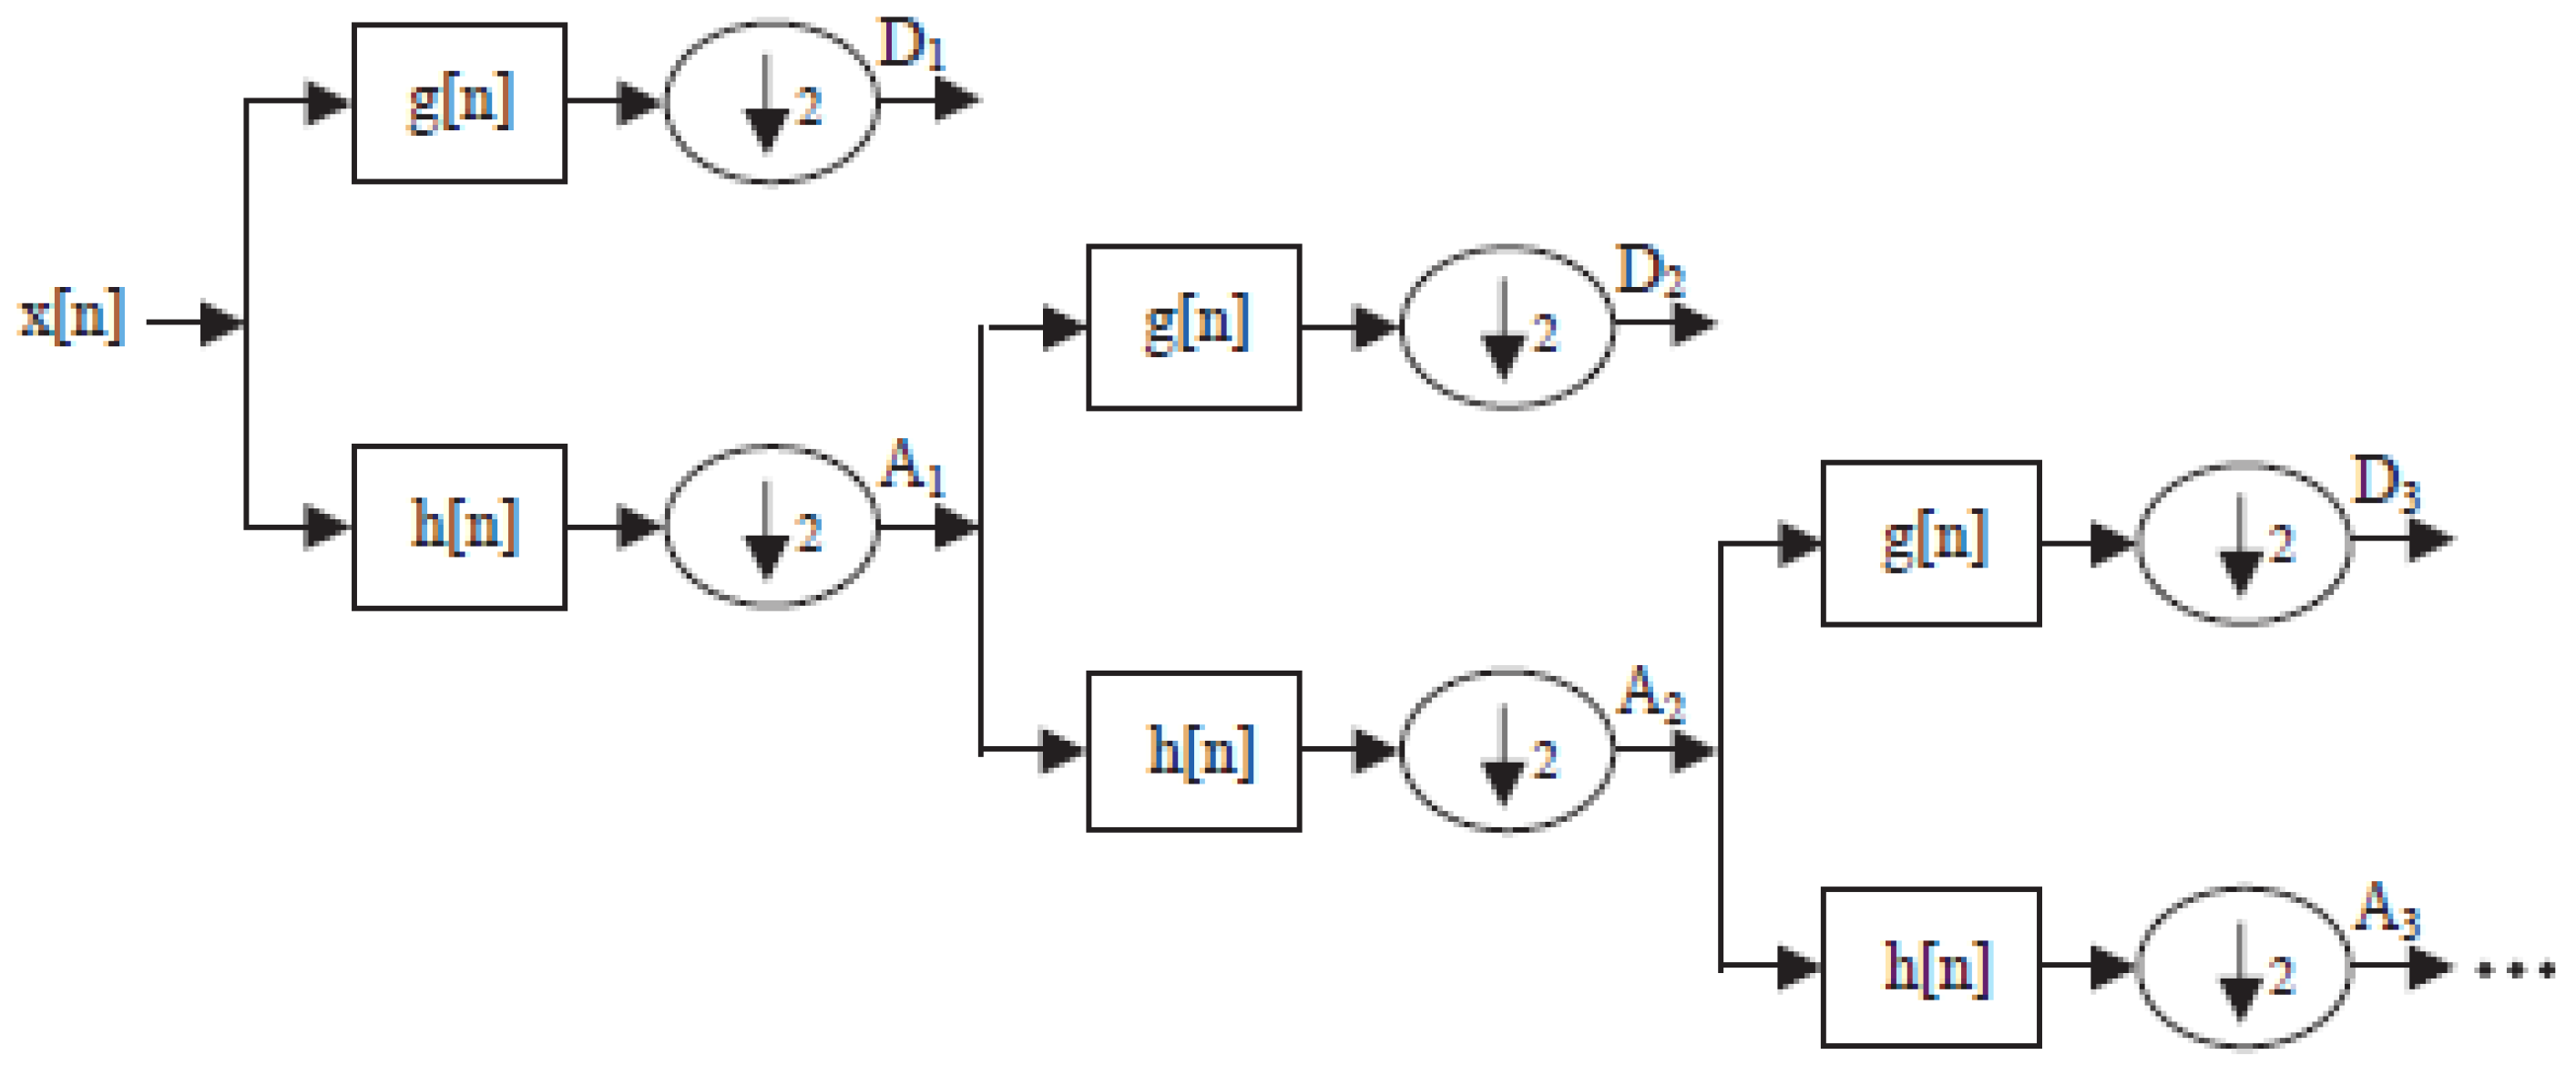
The procedure for the systematic decomposition of signal resolution x [n] is shown in Figure 5. As shown in Figure 5, three levels of decomposition have been implemented to signal x [n]. At each level, the signal is decomposed using two types of DWBF-based filters, namely, g [n] and h [n]. Note that g [n] is a DWBF high-pass filter, while h [n] is a DWBF low-pass filter. Each output of these filters is then downsampled by 2. The downsampler output of the first high-pass filter is detail–1 (D1), while the downsampler output of the first low-pass filter is approximation–1 (A1). Then, at the second level, the same decomposition process is carried out on approximation signal–1 (A1), and this is repeated until the last level (Level 3).
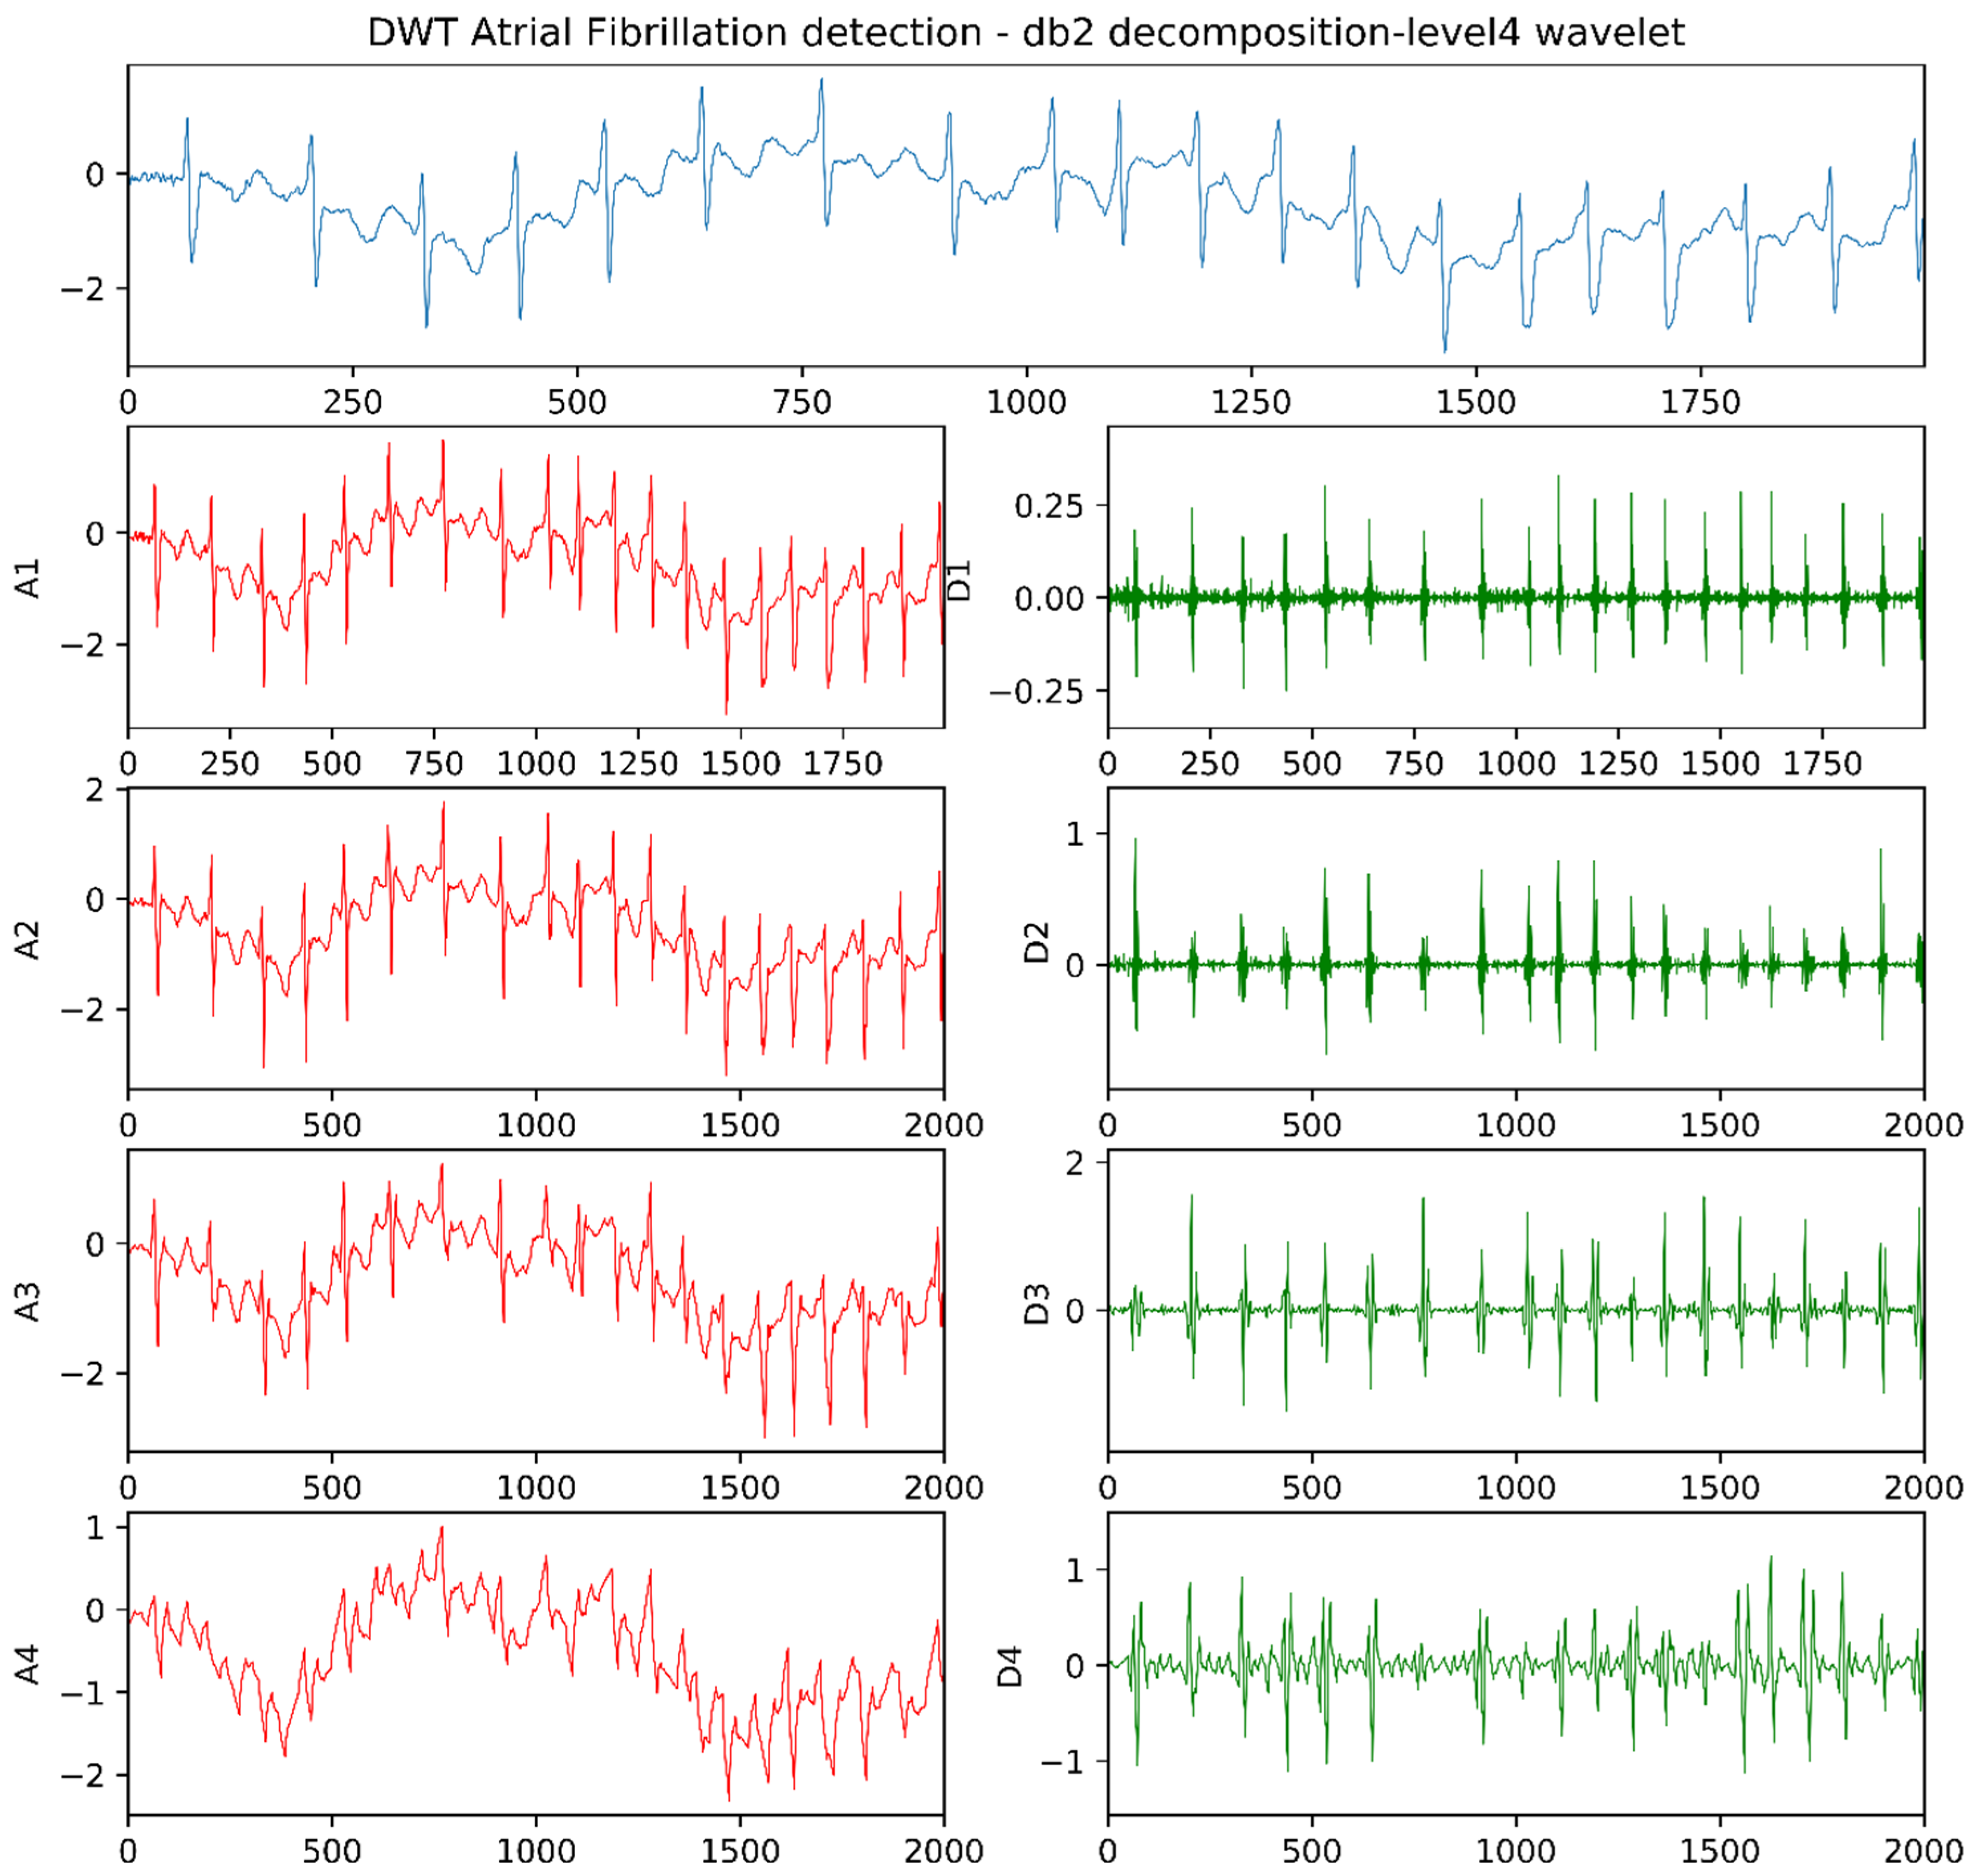
Figure 6 shows the results of Level 4 decomposition using DBWF (DB2) on ECG signal numbered 4015, AF signal. The signal at the top is the input signal, while all the signals below are the decomposition results, consisting of approximate signals and detailed signals.
Algorithm 1 processes the approximation signals and the detail signals into a feature for detecting atrial fibrillation. According to the algorithm, a feature set is the result of the first approximation signal, which is convoluted on all detailed signals at all levels (known as the wavelet coefficient index—WCI). Table 3 lists the maximum, average, minimum, and standard deviation values of each WCI of the signal numbered 4015 (AF signal); the signal numbered 16,265 (normal signal) has a WCI, as shown in Table 4.

2.2.3. Classification

This study used a support vector machine (SVM) classifier to identify AF rhythms and normal ECG signals. SVM works by recognizing the best separating hyperplane between two training sample classes. It focuses on the training case located at the corner of the class descriptors to provide the optimal hyperplane. The hyperplane is effective for training with small samples [54]. It can be represented in the feature space by using a radial base function (RBF) kernel (see Formula (9)) or a Gaussian formula, as in Equation (10) [55]:
K ( x , x ) = i ϕ i ( x ) ϕ i ( x )  
K ( x , x ) = e γ | | x x | | 2  
o r
K ( x , x ) = e | | x x | | 2 / 2 σ 2  
For x i input points mapped to the target y i   ( i = 1 , 2 , 3 , , p ) , the decision function formulated with respect to the kernel is defined in Equation (12):
f ( x ) = s i g n ( i = 1 p α i y i K ( x , x i ) + b )  
where b is the bias. The coefficient α i can be found using Formula (13) by maximizing the Lagrangian (L) as follows:
L = i = 1 p α i 1 2 i , j = 1 p α i α j y i y j K ( x i x j )  
In addition, α i and i = 1 p α i y must meet the following constraints:
α i 0   i = 1 p α i y i = 0  
Thus, only points closest to the hyperplane have α i > 0 (support vectors).

2.2.4. Experiment Scenario

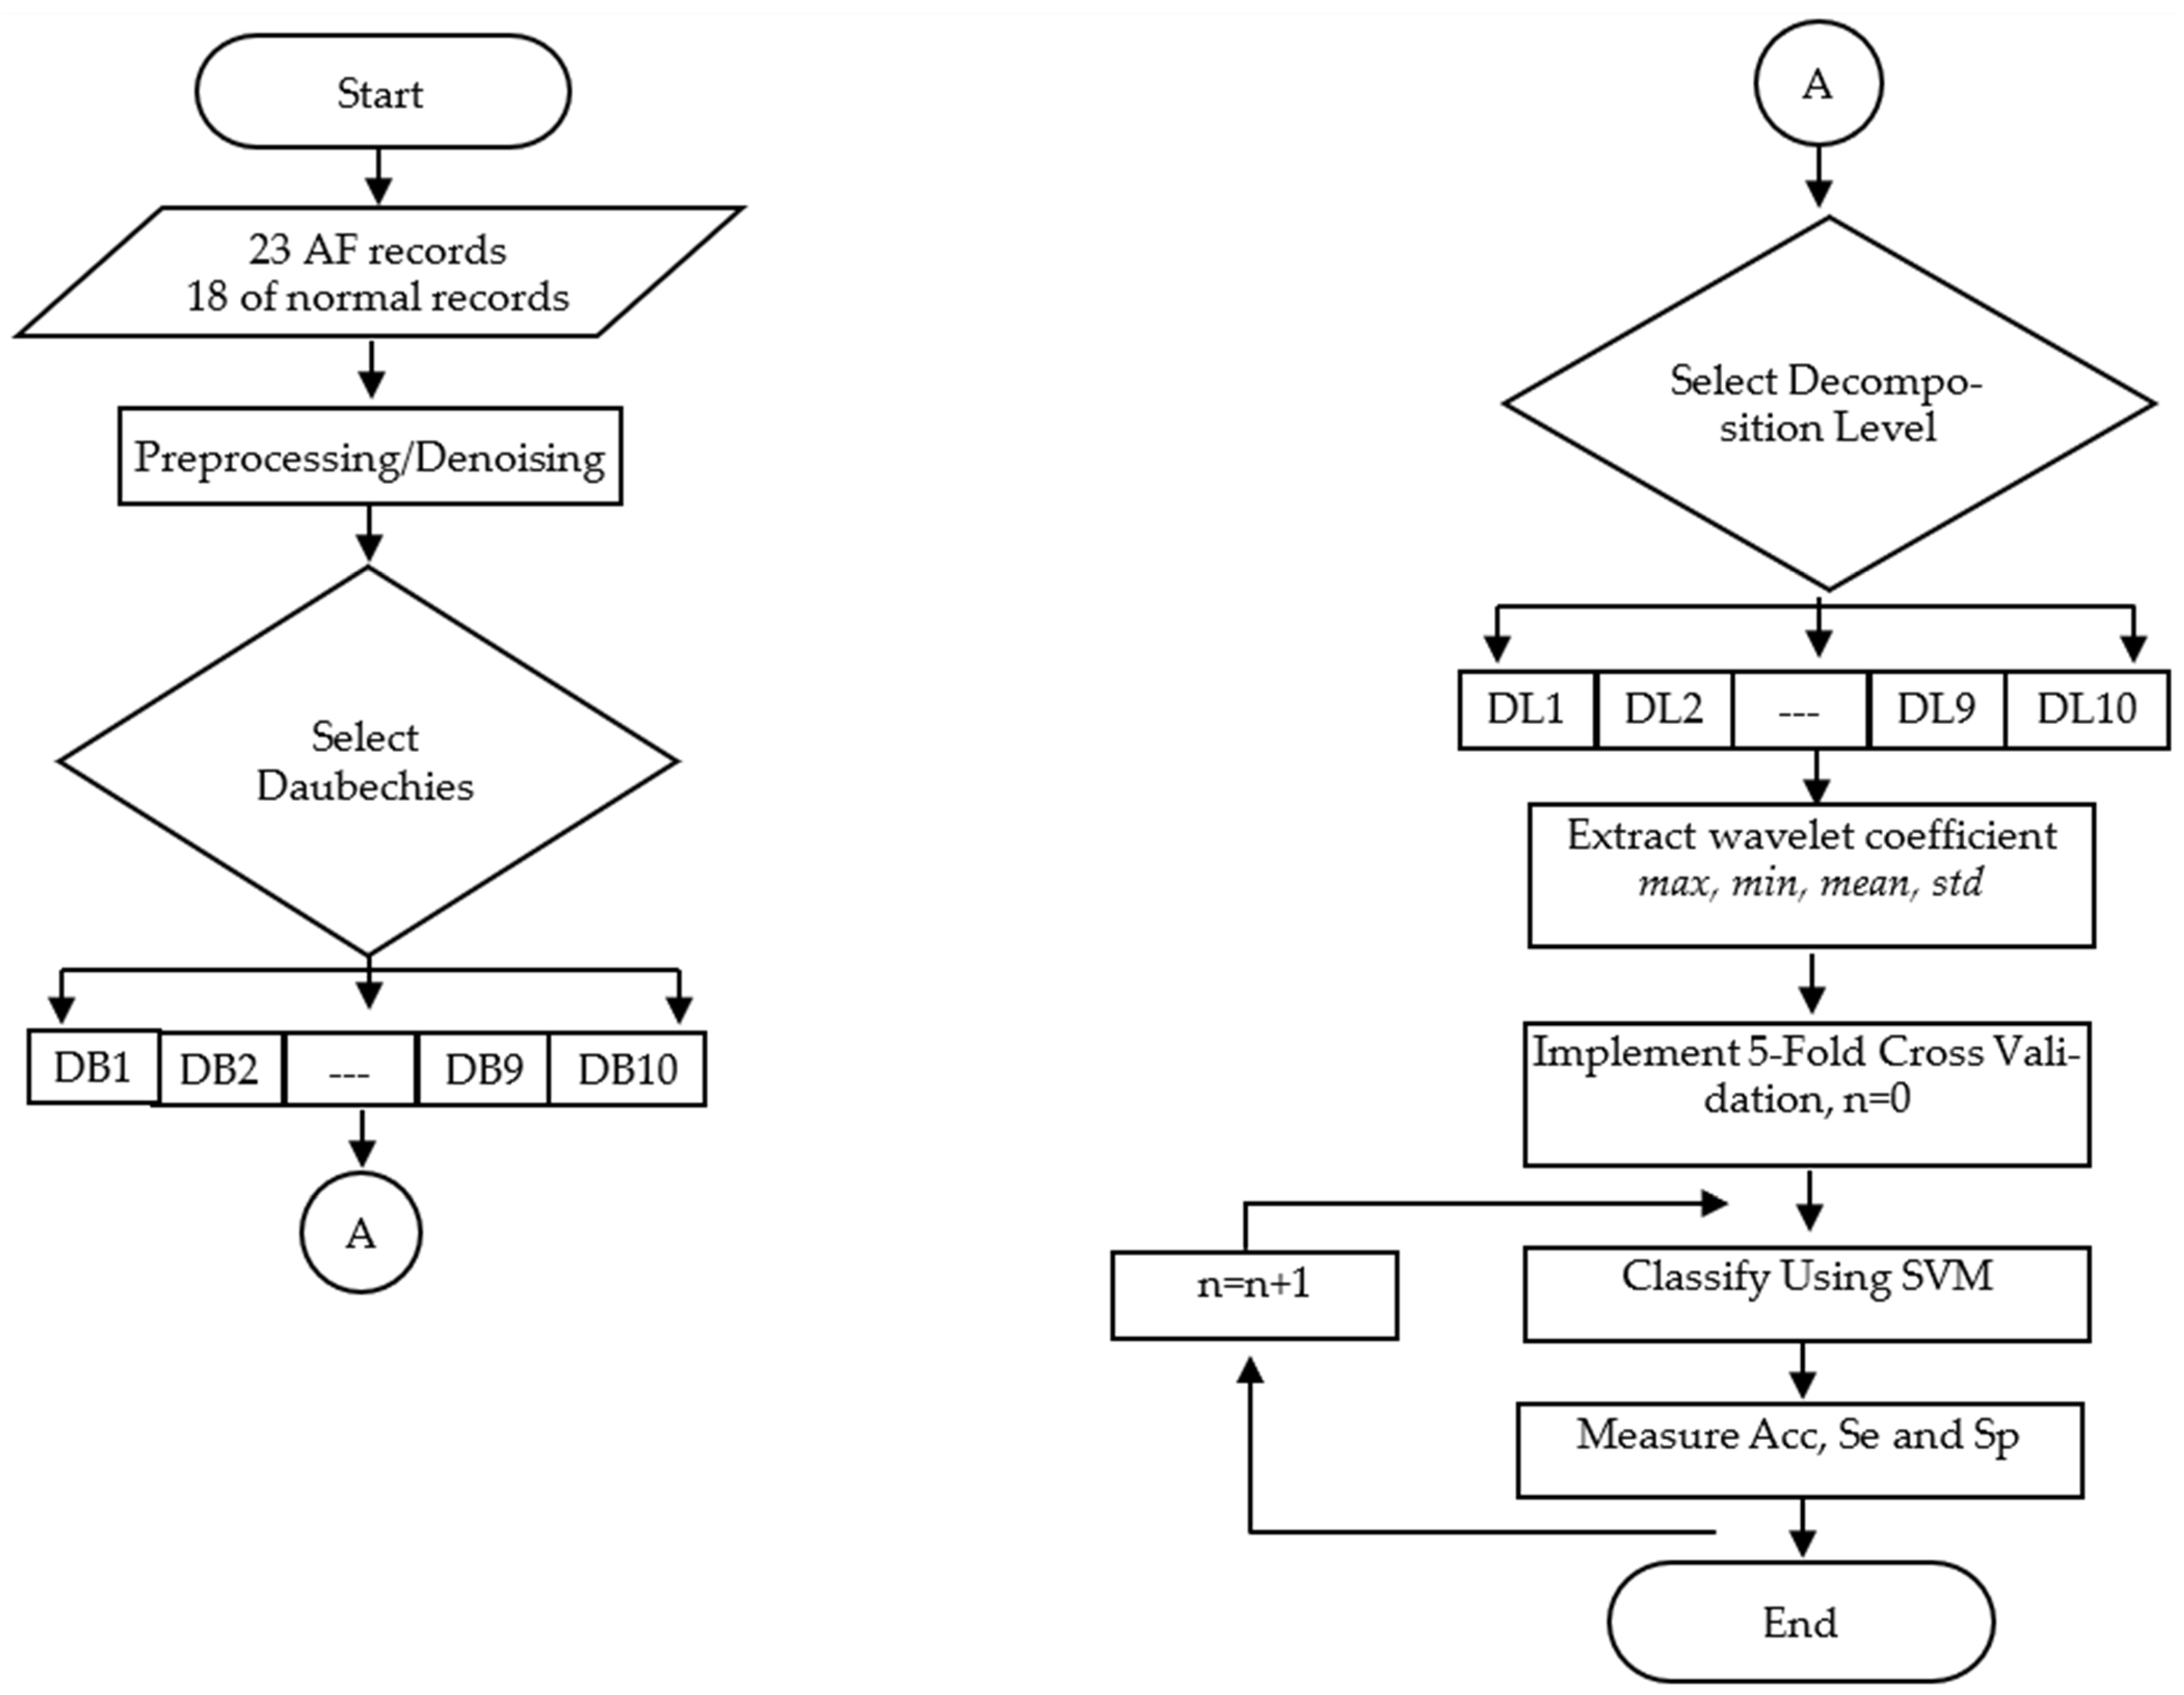
Figure 7 illustrates a method for evaluating the effect of both DWBF and DL on detecting AF. Both feature extraction and classification in the scenario implement WCI statistics and SVM, respectively. As shown in Figure 7, the first step in the method is the development of training and testing data, as described in Section 2.1.1. There are 41 ECG data records, consisting of 23 AF data records and 18 normal data records. For the 23 AF data records, there are 264 AF events. Meanwhile, the same normal number of events is obtained from the 18 NSRDB data records. The total ECG data for training and testing is 528 data records. Then, the noise of the ECG data is filtered using the hard-thresholding technique [20].
The next step is to choose a combination of both the Daubechies (DB) function and the decomposition level (DL)—DBiDLj; i and j refer to the order of the Daubechies function and the level of decomposition. The parameters DBiDLj are then applied for extracting both AF and normal features from 528 ECG data records. There are 528 × 4 or 2.112 feature datasets due to each ECG data record producing 4 features, i.e., max, min, mean, and stdev. The feature datasets are then classified using SVM to identify AF and normal data based on 5-fold cross-validation. The results of the classification are measured using three metrics, i.e., accuracy (acc), sensitivity (se), and specificity (sp).

3. Experiment Results

Table 5, Table 6 and Table 7 show the results of experiments with scenarios figured in Figure 7. Each value in the tables is an average of five tests according to the 5-fold cross-validation (CV) principle [56]. To reveal the effect of both DBWF and DL on the performance of AF detection, all data in the tables are averaged and plotted in Figure 8, Figure 9 and Figure 10.
Table 5 shows the 5-CV average accuracy due to DWBF and DL parameters. As shown in Table 5, the highest accuracy is obtained when the Daubechies wavelet basis function is DB2 and the decomposition level is DL4–DB2DL4, i.e., 94.17%. It is followed by DB1DL4 and DB3DL4, i.e., 93.33% and 92.5%, respectively. To obtain the effect of the Daubechies basis wavelet function and the decomposition level, data in Table 5 were then averaged and plotted in Figure 8. As shown in Figure 8, the accuracy due to DWBF tends to fluctuate constantly in a narrow range between 83% to 86% (Accuracy@DB). However, the trend of the accuracy tends to decrease significantly when the decomposition level changes from DL1 to DL10 (Accuracy@Level), i.e., from 90% to 76%.
Table 6 is the 5-CV average sensitivity due to DWBF and DL parameters. The best sensitivity is DB6DL2 (97.57%), and it is followed by DB6DL3 (96.21%) and DB2DL2 (96.07%), respectively. The effect of the Daubechies basis function and the decomposition level is illustrated in Figure 9. As shown in the figure, the sensitivity deteriorates when the decomposition level changes from DL1 to DL10 (Sensitivity@Level). However, the decrease in the sensitivity is not as great as the decrease in the accuracy in Figure 8. The lowest sensitivity is in DL10. The effect of DWBF can be seen in Sensitivity@DB in Figure 9. If it is compared to the accuracy due to DWBF in Figure 8, the sensitivity due to DWBF in Figure 9 fluctuates constantly in a wider range (between 80% to 91%).
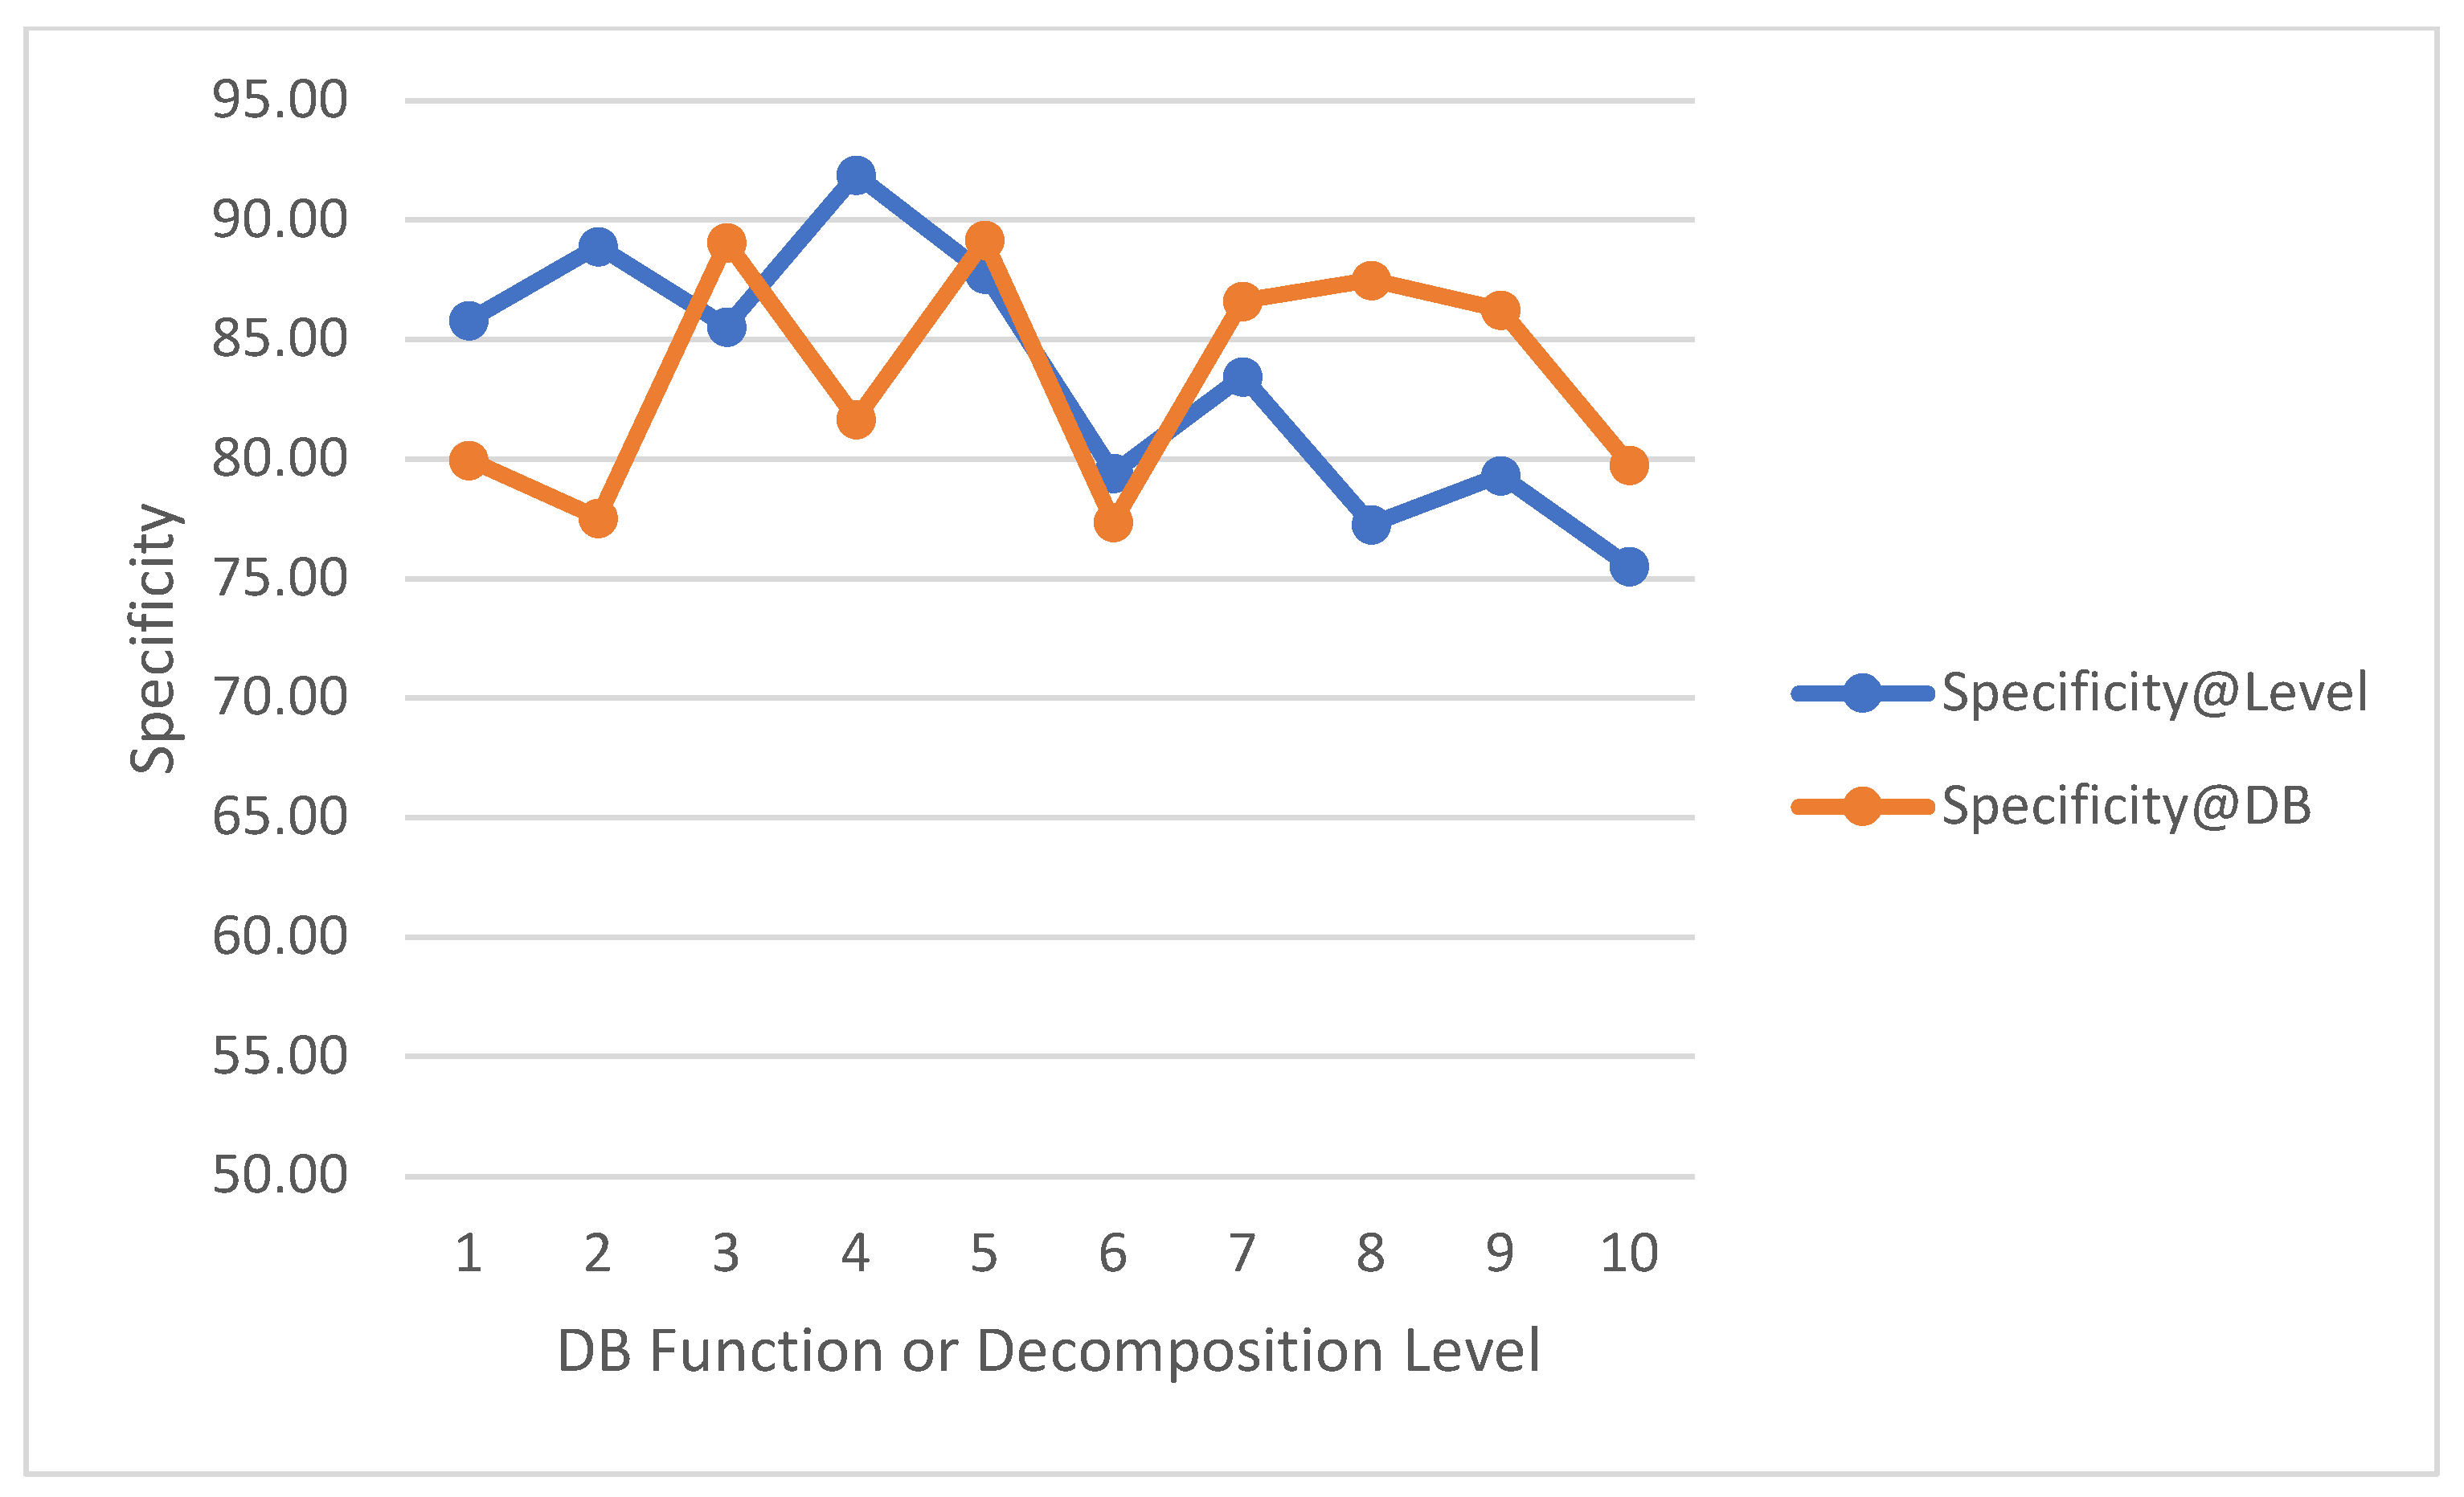
Table 7 is the 5-CV average specificity due to DWBF and DL parameters. As shown in Table 7, the highest specificity is achieved when DBWF is DB2 and DL is on Level 4, i.e., 96.75%. Then, it is followed by DB2DL5 and DB4DL2, which have specificity at 96.57% and 94.89%. The effect of DBWF and DL can be seen in Figure 10. Specificity@level in Figure 10 shows that the specificity decreases from 92% to 75%. However, the fluctuation of the decline looks unstable. Additionally, Specificity@DB in Figure 10 provides information that the DBWF fluctuates constantly in the range of 76% to 90%, which is wider than the fluctuation of sensitivity in Figure 9.

4. Performance Comparison to State-of-the-Art of Other Studies on Atrial Fibrillation Detection

Table 8 illustrates a comparison of existing research results that focus on the detection of atrial fibrillation using machine learning algorithms with our research. As shown in Table 8, all previous studies used as a comparison with this research have considered the morphological features of the ECG signal, i.e., DWT and energy entropy, such as in Kumar, et al. [18], Asgari, et al. [31], Arvanaghi, et al. [57], Kora, et al. [58], Abdelazez, et al. [59]. Table 8 also shows that the performance results are measured using either a single metric [57,58,59] or several metrics [18,31]. In general, our research has the best AF detection sensitivity compared to the existing studies. Sensitivity is the most important metric in health research that can compute the probability of getting a positive test result in subjects with AF [60]. For accuracy and specificity, our results only differ by about 2% and 1%, respectively, from Asgari and Kumar’s studies.

5. Discussion

Experiments on the effect of the Daubechies wavelet basis function (DWBF) and the decomposition level (DL) to detect atrial fibrillation have been performed, and the results of experiments have been discussed in Section 3. As shown in Figure 8, Figure 9 and Figure 10, the DWBF has an insignificant effect on detection performance (accuracy, sensitivity, and specificity), although the result of experiments on the three metrics show that each metric fluctuates in different ranges when the order of DBWF changes from DB1 to DB10; however, the pattern of the three metrics tends to be constant. This is due to the nature of discrete wavelet transform, which has an orthogonal transformation (shifting and scaling) of wavelet basis function [61]. In addition, the almost similar waveforms for DB1 to DB10 also contribute to the results. These two facts imply that false-positives and false-negatives in detecting atrial fibrillation fluctuate at nearly constant values.
The different condition occurs when the decomposition level changes from DL1 to DL10. All three metrics decrease with different rates. In general, this decrease is triggered by the fact that an increase in the decomposition level (from 1 to 10) causes the WCI signal to deviate from the original ECG signal. Furthermore, the sensitivity metric has a slower decrease than the other two metrics, which is due to higher false-positives found, compared to false-negatives, in the experiments. This finding is in line with the results of research by Chen, et al. [62], who explored the effect of WBF and the decomposition level in electroencephalography (EEG) signals. Chen, et al. [62] concluded that the decomposition level was sensitive to the performance of EEG signal detection, and wavelet basis functions have insignificant effects.
This research also compared the experimental results with other state-of-the-art research on the detection of AF. As described in Section 4, our study has the best sensitivity in detecting AF compared to other previous studies. In addition, the accuracy and specificity that we obtained were almost the same as the previous studies’ results. More importantly, our study shows the importance of both wavelet basis function and decomposition level to get the best results, which has not been explored before in other studies.

6. Conclusions

The research objective to reveal the effect of the Daubechies wavelet basis function (DWBF) and the decomposition level has been achieved. The details of the experiment results can be seen in Section 3. The results show that choosing the right decomposition level is very important in order to get the optimal performance of atrial fibrillation detection. On the other hand, the selection of the DWBF order has less impact on AF detection performance. Furthermore, the highest accuracy result is achieved in DB2DL4, which is 94.17%, while the highest sensitivity and specificity are obtained in DB6DL2 and DB2DL4, i.e., 97.57% and 96.75%, respectively.

7. Copyright

Copyright to the results of this study was granted by the Indonesian Ministry of Law and Human Rights (no. EC00201982827, 19 November 2019) on behalf of Satria Mandala and Annisa Rizki Pratiwi Wibowo.

Author Contributions

Conceptualization, S.M., A. and A.R.; methodology, S.M., A. and M.S.M.Z.; software, S.M., A., S., M.S.M.Z. and A.R.P.W.; formal analysis, S.M., A., M.S.M.Z., A.R. and A.R.P.W.; investigation, S.M., A., S., A.R. and A.R.P.W.; validation, S.M., A., S., M.S.M.Z., A.R. and A.R.P.W.; writing—original draft preparation, S.M., A., S., M.S.M.Z., A.R. and A.R.P.W.; writing—review and editing, S.M., A., M.S.M.Z., A.R. and A.R.P.W.; project administration, S., A.R. and A.R.P.W.; funding acquisition, S.M., S. and M.S.M.Z. All authors have read and agreed to the published version of the manuscript.

Funding

This research was funded by the Ministry of Education, Culture, Research, and Technology of Indonesia under Decree No. 362/PNLT3/PPM/2022 and Agreement/Contract Number 126/SP2H/RT-MONO/LL4/2022.

Institutional Review Board Statement

Not applicable.

Informed Consent Statement

Not applicable.

Data Availability Statement

The experimental data used in this research are MIT-BIH data (AFDB and NSRDB), which are publicly available on Physionet (https://archive.physionet.org/cgi-bin/atm/ATM).

Acknowledgments

We thank both DRPTM of the Ministry of Education, Culture, Research, and Technology of Indonesia and Research Management Center (DRPTM) of Telkom University for their helps in the research project administration.

Conflicts of Interest

The authors declare that there are no conflict of interest regarding the publication of this paper.

References

  1. Staerk, L.; Wang, B.; Preis, S.R.; Larson, M.G.; Lubitz, A.S.; Ellinor, P.T.; McManus, D.D.; Ko, D.; Weng, L.-C.; Lunetta, K.; et al. Lifetime risk of atrial fibrillation according to optimal, borderline, or elevated levels of risk factors: Cohort study based on longitudinal data from the Framingham Heart Study. BMJ 2018, 361, k1453. [Google Scholar] [CrossRef] [PubMed] [Green Version]
  2. Mitrousi, K.; Lip, G.Y.H.; Apostolakis, S. Age as a Risk Factor for Stroke in Atrial Fibrillation Patients: Implications in Thromboprophylaxis in the Era of Novel Oral Anticoagulants. J. Atr. Fibrillation 2013, 6, 783. [Google Scholar] [CrossRef] [PubMed]
  3. Salih, M.; Abdel-Hafez, O.; Ibrahim, R.; Nair, R. Atrial fibrillation in the elderly population: Challenges and management considerations. J. Arrhythmia 2021, 37, 912–921. [Google Scholar] [CrossRef] [PubMed]
  4. Wasmer, K.; Eckardt, L.; Breithardt, G. Predisposing factors for atrial fibrillation in the elderly. J. Geriatr. Cardiol. 2017, 14, 179–184. [Google Scholar] [CrossRef]
  5. Rizal, A.; Yuniadi, Y. Epigenetic implication in atrial fibrillation: A potential biomarker? J. Lab. Precis. Med. 2019, 4, 33. [Google Scholar] [CrossRef]
  6. Ahmed, N.; Zhu, Y. Early Detection of Atrial Fibrillation Based on ECG Signals. Bioengineering 2020, 7, 16. [Google Scholar] [CrossRef] [Green Version]
  7. Odutayo, A.; Wong, C.; Hsiao, A.J.; Hopewell, S.; Altman, D.G.; Emdin, A.C. Atrial fibrillation and risks of cardiovascular disease, renal disease, and death: Systematic review and meta-analysis. BMJ 2016, 354, i4482. [Google Scholar] [CrossRef] [Green Version]
  8. Mandala, S.; Di, T.C. ECG Parameters for Malignant Ventricular Arrhythmias: A Comprehensive Review. J. Med. Biol. Eng. 2017, 37, 441–453. [Google Scholar] [CrossRef] [Green Version]
  9. Boehme, A.K.; Esenwa, C.; Elkind, M.S.V. Stroke Risk Factors, Genetics, and Prevention. Circ. Res. 2017, 120, 472–495. [Google Scholar] [CrossRef]
  10. Corrigendum to: 2020 ESC Guidelines for the diagnosis and management of atrial fibrillation developed in collaboration with the European Association of Cardio-Thoracic Surgery (EACTS). Eur. Heart J. 2020, 42, 507. [CrossRef]
  11. Husain, K.; Mohd Zahid, M.S.; Ul Hassan, S.; Hasbullah, S.; Mandala, S. Advances of ECG Sensors from Hardware, Software and Format Interoperability Perspectives. Electronics 2021, 10, 105. [Google Scholar] [CrossRef]
  12. Fan, Y.-Y.; Li, Y.-G.; Li, J.; Cheng, W.-K.; Shan, Z.-L.; Wang, Y.-T.; Guo, Y.-T. Diagnostic Performance of a Smart Device With Photoplethysmography Technology for Atrial Fibrillation Detection: Pilot Study (Pre-mAFA II Registry). JMIR mHealth uHealth 2019, 7, e11437. [Google Scholar] [CrossRef]
  13. Tison, G.; Sanchez, J.M.; Ballinger, B.; Singh, A.; Olgin, J.E.; Pletcher, M.J.; Vittinghoff, E.; Lee, E.S.; Fan, S.M.; Gladstone, R.A.; et al. Passive Detection of Atrial Fibrillation Using a Commercially Available Smartwatch. JAMA Cardiol. 2018, 3, 409–416. [Google Scholar] [CrossRef] [Green Version]
  14. Gropler, M.R.F.; Dalal, A.S.; Van Hare, G.F.; Silva, J.N.A. Can smartphone wireless ECGs be used to accurately assess ECG intervals in pediatrics? A comparison of mobile health monitoring to standard 12-lead ECG. PLoS ONE 2018, 13, e0204403. [Google Scholar] [CrossRef] [PubMed]
  15. AliveCor. KardiaMobile. 2019. Available online: https://www.alivecor.com/kardiamobile/ (accessed on 12 April 2022).
  16. Haberman, Z.C.; Jahn, R.T.; Bose, R.; Tun, H.; Shinbane, J.S.; Doshi, R.N.; Chang, P.M.; Saxon, L.A.; Haberman, Z.C.; Jahn, R.T.; et al. Wireless Smartphone ECG Enables Large-Scale Screening in Diverse Populations. J. Cardiovasc. Electrophysiol. 2015, 26, 520–526. [Google Scholar] [CrossRef] [PubMed]
  17. Queiroz, J.A.; Azoubel, L.M.A.; Barros, A.K. Support system for classification of beat-to-beat arrhythmia based on variability and morphology of electrocardiogram. EURASIP J. Adv. Signal Process. 2019, 2019, 16. [Google Scholar] [CrossRef]
  18. Kumar, M.; Pachori, R.B.; Acharya, U.R. Automated diagnosis of atrial fibrillation ECG signals using entropy features extracted from flexible analytic wavelet transform. Biocybern. Biomed. Eng. 2018, 38, 564–573. [Google Scholar] [CrossRef]
  19. Murat, F.; Sadak, F.; Yildirim, O.; Talo, M.; Murat, E.; Karabatak, M.; Demir, Y.; Tan, R.-S.; Acharya, U.R. Review of Deep Learning-Based Atrial Fibrillation Detection Studies. Int. J. Environ. Res. Public Health 2021, 18, 11302. [Google Scholar] [CrossRef]
  20. Mandala, S.; Fuadah, Y.N.; Arzaki, M.; Pambudi, F.E. Performance analysis of wavelet-based denoising techniques for ECG signal. In Proceedings of the 2017 5th International Conference on Information and Communication Technology (ICoIC7), Tokyo Japan, 17–19 May 2017. [Google Scholar]
  21. Beraza, I.; Romero, I. Comparative study of algorithms for ECG segmentation. Biomed. Signal Process. Control. 2017, 34, 166–173. [Google Scholar] [CrossRef]
  22. Gokana, V.; Phua, C.T.; Lissorgues, G. Automatic Detection of Atrial Fibrillation Using RR Interval from ECG Signals; Springer: Cham, Switzerland, 2014. [Google Scholar]
  23. Kennedy, A.; Finlay, D.D.; Guldenring, D.; Bond, R.; Moran, K.; McLaughlin, J. Automated detection of atrial fibrillation using R-R intervals and multivariate-based classification. J. Electrocardiol. 2016, 49, 871–876. [Google Scholar] [CrossRef] [Green Version]
  24. Michel, P.; Ngo, N.; Pons, J.-F.; Delliaux, S.; Giorgi, R. A filter approach for feature selection in classification: Application to automatic atrial fibrillation detection in electrocardiogram recordings. BMC Med. Inform. Decis. Mak. 2021, 21, 1–17. [Google Scholar] [CrossRef] [PubMed]
  25. Mandala, S.; Di, T.C.; Sunar, M.S. Adiwijaya ECG-based prediction algorithm for imminent malignant ventricular arrhythmias using decision tree. PLoS ONE 2020, 15, e0231635. [Google Scholar] [CrossRef]
  26. Aeschbacher, S.; O’Neal, W.T.; Krisai, P.; Loehr, L.; Chen, L.Y.; Alonso, A.; Soliman, E.Z.; Conen, D. Relationship between QRS duration and incident atrial fibrillation. Int. J. Cardiol. 2018, 266, 84–88. [Google Scholar] [CrossRef] [PubMed]
  27. Yang, H.; Li, X.; Cao, H.; Cui, Y.; Luo, Y.; Liu, J.; Zhang, Y. Using machine learning methods to predict hepatic encephalopathy in cirrhotic patients with unbalanced data. Comput. Methods Programs Biomed. 2021, 211, 106420. [Google Scholar] [CrossRef] [PubMed]
  28. Rohr, M.; Reich, C.; Höhl, A.; Lilienthal, T.; Dege, T.; Plesinger, F.; Bulkova, V.; Clifford, G.; Reyna, M.; Antink, C.H. Exploring novel algorithms for atrial fibrillation detection by driving graduate level education in medical machine learning. Physiol. Meas. 2022, 43, 074001. [Google Scholar] [CrossRef]
  29. Chickaramanna, S.G.; Veerabhadrappa, S.T.; Shivakumaraswamy, P.M.; Sheela, S.N.; Keerthana, S.K.; Likith, U.; Swaroop, L.; Meghana, V. Classification of Arrhythmia Using Machine Learning Algorithm. Rev. D’intelligence Artif. 2022, 36, 529–534. [Google Scholar] [CrossRef]
  30. Jahan, M.S.; Mansourvar, M.; Puthusserypady, S.; Wiil, U.K.; Peimankar, A. Short-term atrial fibrillation detection using electrocardiograms: A comparison of machine learning approaches. Int. J. Med. Inform. 2022, 163, 104790. [Google Scholar] [CrossRef]
  31. Asgari, S.; Mehrnia, A.; Moussavi, M. Automatic detection of atrial fibrillation using stationary wavelet transform and support vector machine. Comput. Biol. Med. 2015, 60, 132–142. [Google Scholar] [CrossRef]
  32. Dalila, C.; Chaouki, A.; Billal, B.; Badreddine, Z.; Amine, N. ECG features extraction using AC/DCT for biometric. In Proceedings of the 2017 2nd International Conference on Bio-engineering for Smart Technologies (BioSMART), Singapore, 30 August–1 September 2017. [Google Scholar]
  33. He, R.; Wang, K.; Zhao, N.; Liu, Y.; Yuan, Y.; Li, Q.; Zhang, H. Automatic Detection of Atrial Fibrillation Based on Continuous Wavelet Transform and 2D Convolutional Neural Networks. Front. Physiol. 2018, 9, 1206. [Google Scholar] [CrossRef] [Green Version]
  34. Saraswat, S.; Srivastava, G.; Shukla, S.N. Wavelet Transform Based Feature Extraction and Classification of Atrial Fibrillation Arrhythmia. Biomed. Pharmacol. J. 2017, 10, 1715–1725. [Google Scholar] [CrossRef]
  35. Gupta, V.; Mittal, M.; Mittal, V. A Novel FrWT Based Arrhythmia Detection in ECG Signal Using YWARA and PCA. Wirel. Pers. Commun. 2021, 124, 1229–1246. [Google Scholar] [CrossRef]
  36. Ye, C.; Kumar, B.V.K.V.; Coimbra, M.T. Heartbeat Classification Using Morphological and Dynamic Features of ECG Signals. IEEE Trans. Biomed. Eng. 2012, 59, 2930–2941. [Google Scholar] [CrossRef] [PubMed]
  37. Nguyen, T.T.; Tran, T.H.; Nguyen, M.T.; Yuldashev, Z. Heart Rhythm Intelligent Monitoring Algorithm for the Atrial Fibrillation Episodes Detection in the Telemedicine System. Procedia Comput. Sci. 2019, 150, 352–360. [Google Scholar] [CrossRef]
  38. Chen, S.; Hua, W.; Li, Z.; Li, J.; Gao, X. Heartbeat classification using projected and dynamic features of ECG signal. Biomed. Signal Process. Control. 2017, 31, 165–173. [Google Scholar] [CrossRef]
  39. Sanders, P.; Pürerfellner, H.; Pokushalov, E.; Sarkar, S.; Di Bacco, M.; Maus, B.; Dekker, L.R. Performance of a new atrial fibrillation detection algorithm in a miniaturized insertable cardiac monitor: Results from the Reveal LINQ Usability Study. Hear. Rhythm. 2016, 13, 1425–1430. [Google Scholar] [CrossRef] [PubMed] [Green Version]
  40. Cheng, S.; Tamil, L.S.; Levine, B. A Mobile Health System to Identify the Onset of Paroxysmal Atrial Fibrillation. In Proceedings of the 2015 International Conference on Healthcare Informatics, Dallas, TX, USA, 21–23 October 2015. [Google Scholar]
  41. Pokaprakarn, T.; Kitzmiller, R.R.; Moorman, J.R.; Lake, D.E.; Krishnamurthy, A.K.; Kosorok, M.R. Sequence to Sequence ECG Cardiac Rhythm Classification Using Convolutional Recurrent Neural Networks. IEEE J. Biomed. Health Inform. 2021, 26, 572–580. [Google Scholar] [CrossRef]
  42. Goldberger, A.L.; Amaral, L.A.N.; Glass, L.; Hausdorff, J.M.; Ivanov, P.C.; Mark, R.G.; Stanley, H.E. Physiobank, physiotoolkit, and physionet: Components of a new research resource for complex physiologic signals. Circulation 2000, 101, E215–E220. [Google Scholar] [CrossRef] [Green Version]
  43. Moody, G.B.; Mark, R.G. MIT-BIH Atrial Fibrillation Database. 2000. Available online: https://doi.org/10.13026/c2mw2d (accessed on 5 October 2022).
  44. Kora, P.; Ayyem, V. ECG based Atrial Fibrillation Detection using Cuckoo Search Algorithm. Int. J. Comput. Appl. 2017, 162, 37–42. [Google Scholar] [CrossRef]
  45. Sinha, N.; Das, A. Automatic diagnosis of cardiac arrhythmias based on three stage feature fusion and classification model using DWT. Biomed. Signal Process. Control. 2020, 62, 102066. [Google Scholar] [CrossRef]
  46. Wang, J.; Wang, P.; Wang, S. Automated detection of atrial fibrillation in ECG signals based on wavelet packet transform and correlation function of random process. Biomed. Signal Process. Control 2020, 55, 101662. [Google Scholar] [CrossRef]
  47. Chun-Lin, L. A Tutorial of the Wavelet Transform. 2010. Available online: http://disp.ee.ntu.edu.tw/tutorial/WaveletTutorial.pdf (accessed on 22 August 2022).
  48. Pinto, R.; Shama, K. An Efficient Architecture for Modified Lifting-Based Discrete Wavelet Transform. Sens. Imaging 2020, 21, 1–22. [Google Scholar] [CrossRef]
  49. Misiti, M.; Misiti, Y.; Oppenheim, G.; Poggi, J.-M. Wavelets and Their Applications; ISTE USA: Newport Beach, CA, USA, 2007. [Google Scholar]
  50. Azmoudeh, B.; Cvetkovic, D. Wavelets in Biomedical Signal Processing and Analysis. In Encyclopedia of Biomedical Engineering; Narayan, R., Ed.; Elsevier: Amsterdam, The Netherlands, 2019; pp. 193–212. [Google Scholar] [CrossRef]
  51. Kara, S.; Okandan, M. Atrial fibrillation classification with artificial neural networks. Pattern Recognit. 2007, 40, 2967–2973. [Google Scholar] [CrossRef]
  52. Zhou, X.; Ding, H.; Ung, B.; Pickwell-MacPherson, E.; Zhang, Y. Automatic online detection of atrial fibrillation based on symbolic dynamics and Shannon entropy. Biomed. Eng. Online 2014, 13, 18. [Google Scholar] [CrossRef] [PubMed] [Green Version]
  53. Özbay, Y.; Ceylan, R.; Karlik, B. Integration of type-2 fuzzy clustering and wavelet transform in a neural network based ECG classifier. Expert Syst. Appl. 2011, 38, 1004–1010. [Google Scholar] [CrossRef]
  54. Mohebbi, M.; Ghassemian, H. Prediction of paroxysmal atrial fibrillation based on non-linear analysis and spectrum and bispectrum features of the heart rate variability signal. Comput. Methods Programs Biomed. 2012, 105, 40–49. [Google Scholar] [CrossRef]
  55. Veropoulos, K.; Campbell, C.; Cristianini, N. Controlling the Sensitivity of Support Vector Machines. In Proceedings of the International Joint Conference on AI, Stockholm, Sweden, 13–19 July 1999. [Google Scholar]
  56. Berrar, D. Cross-Validation. In Encyclopedia of Bioinformatics and Computational Biology; Ranganathan, S., Gribskov, M., Nakai, K., Schönbach, C., Eds.; Academic Press: New York, NY, USA, 2019; pp. 542–545. [Google Scholar]
  57. Arvanaghi, R.; Daneshvar, S.; Seyedarabi, H.; Goshvarpour, A. Classification of cardiac arrhythmias using arterial blood pressure based on discrete wavelet transform. Biomed. Eng. Appl. Basis Commun. 2017, 29, 1793–7132. [Google Scholar] [CrossRef]
  58. Kora, P.; Kumari, C.U.; Meenakshi, S.K. Atrial Fibrillation detection using Discrete Wavelet Transform. In Proceedings of the 2019 IEEE International Conference on Electrical, Computer and Communication Technologies (ICECCT), Southend, UK, 20–22 February 2019. [Google Scholar]
  59. Abdelazez, M.; Rajan, S.; Chan, A.D.C. Detection of Atrial Fibrillation in Compressively Sensed Electrocardiogram Measurements. IEEE Trans. Instrum. Meas. 2021, 70, 1–9. [Google Scholar] [CrossRef]
  60. Simundić, A.M. Measures of Diagnostic Accuracy: Basic Definitions. EJIFCC 2009, 19, 203–211. [Google Scholar]
  61. Alonso, G.A.; Gutiérrez, J.M.; Marty, J.-L.; Muñoz, R. Implementation of the Discrete Wavelet Transform Used in the Calibration of the Enzymatic Biosensors. In Discrete Wavelet Transforms—Biomedical Applications; Olkkonen, H., Ed.; IntechOpen: London, UK, 2011. [Google Scholar]
  62. Chen, D.; Wan, S.; Xiang, J.; Bao, F.S. A high-performance seizure detection algorithm based on Discrete Wavelet Transform (DWT) and EEG. PLoS ONE 2017, 12, e0173138. [Google Scholar] [CrossRef] [Green Version]
Figure 1. Four essential steps required to detect atrial fibrillation (AF).
Applsci 13 03036 g001
Figure 2. Haar wavelet (DB1), which has a square shape; it is the simplest wavelet in the Daubechies family.
Applsci 13 03036 g002
Figure 3. Daubechies wavelet order 2 until 10, which have an asymmetric shape and regularly increase with order.
Applsci 13 03036 g003
Figure 4. Raw data (normal and AF segments).
Applsci 13 03036 g004
Figure 5. DWT sub-band decomposition where g [n] is a high-pass filter and h [n] is a low-pass filter.
Applsci 13 03036 g005
Figure 6. Decomposition Level 4 using DB2 on the 04015 ECG signal. Red graphs and green graphs are approximate and detailed signals, respectively.
Applsci 13 03036 g006
Figure 7. Experiment scenario for evaluating the effect of both DWBF and DL on detecting AF.
Applsci 13 03036 g007
Figure 8. Accuracy due to DWBF and DL.
Applsci 13 03036 g008
Figure 9. Sensitivity due to DWBF and DL.
Applsci 13 03036 g009
Figure 10. Specificity due to DWBF and DL.
Applsci 13 03036 g010
Table 1. Experimental data for detecting AF.
NOAF Data Record Number (AFDB)Normal Data Record Number (NSRDB)
1401516,265
2404316,272
3404816,273
4412616,420
5474616,483
6490816,539
7493616,773
8509116,786
9512116,795
10526117,052
11642617,453
12645318,177
13699518,184
14716219,088
15785919,090
16787919,093
17791019,140
18821519,830
198219
208378
218405
228434
238455
Table 2. Confusion matrix TP, TN, FP, FN.
Actual AFActual Normal
Predicted AFTPFP
Predicted NormalFNTN
Table 3. Max, mean, min, and stdev features (normal).
CoefficientsMaxMeanMinStdev
A49.60−0.18−6.650.60
D41.910.00−1.410.40
D32.37−0.01−1.460.37
D22.260.00−1.380.27
D10.850.00−0.810.10
Table 4. Max, mean, min and stdev features (AF).
CoefficientsMaxMeanMinStdev
A47.330.27−11.723.10
D43.610.01−3.730.99
D32.070.00−1.940.39
D20.740.00−0.740.12
D10.180.00−0.220.03
Table 5. Average accuracy (%) due to DWBF and decomposition level (DL).
Daubechies Wavelet Basis Function (DWBF)
Decomposition Level (DL) DB1DB2DB3DB4DB5DB6DB7DB8DB9DB10
187.5086.6785.8390.0086.6786.6790.0085.8386.6789.17
290.8389.1790.8390.8388.3390.0087.5090.8390.8386.67
382.5085.0087.5086.6790.8388.3387.5089.1785.0085.83
493.3394.1792.5088.3382.5090.8390.0090.8390.0090.83
589.1790.8389.1786.6785.8380.7389.1790.8383.3383.33
683.3387.6784.6785.0085.8382.5075.2084.1780.0081.67
785.8380.0075.8381.6776.6785.8375.0080.8380.8380.83
868.3382.5081.6780.8372.5083.3380.8384.1777.5080.00
983.6777.5069.1775.0078.3386.6780.0084.1779.1783.33
1080.8375.0073.3372.5073.3377.5072.5073.3376.6777.50
Table 6. Average sensitivity (%) due to DWBF and decomposition level (DL).
Daubechies Wavelet Basis Function (DWBF)
Decomposition Level (DL) DB1DB2DB3DB4DB5DB6DB7DB8DB9DB10
192.4494.4686.3991.3982.2392.8688.1083.5784.3992.10
295.1496.0793.2990.3683.8297.5784.6690.7489.9681.25
391.2494.5882.8983.3390.7096.2185.1688.3081.3995.24
490.2993.6685.2886.4277.2693.2492.1489.7689.8390.10
590.0087.2384.7589.1388.3889.7290.6992.6289.5890.82
680.7289.7482.5395.2489.5088.0476.7689.5480.2689.64
786.9882.9870.8191.3972.4789.3973.8791.2787.3084.81
878.7580.7878.9893.3975.0083.3979.1079.2489.8385.99
975.5677.1477.5885.9575.5488.5780.7880.4480.5680.12
1078.0077.1176.5080.0075.1487.1380.2084.8582.1980.48
Table 7. Average specificity (%) due to DWBF and decomposition level (DL).
Daubechies Wavelet Basis Function (DWBF)
Decomposition Level (DL) DB1DB2DB3DB4DB5DB6DB7DB8DB9DB10
179.5777.9589.0589.0592.5071.5892.7486.7991.5087.24
288.5480.9990.9894.8992.4179.7592.0791.5793.4884.50
376.2475.0294.4189.6791.4878.7391.8389.0892.5076.48
492.1796.7589.9193.8392.6789.2988.7491.3391.0793.33
590.8096.5794.0789.0987.5876.0591.3189.8182.6179.75
674.7276.1283.8176.6386.5080.0576.2180.9982.7576.36
788.1470.2692.8672.9592.0888.2187.8179.4382.1780.62
861.7470.5489.0065.1476.1976.0488.0089.7182.9273.38
975.2358.8282.5886.7990.5066.7180.6788.5082.5081.00
1072.3372.3884.0558.7589.7967.2576.8887.7881.0064.88
Table 8. Performance of atrial fibrillation detection based on morphological feature extraction algorithm of ECG signal using machine learning.
NoAuthorsTitle of ArticleFeatures Extraction AlgorithmClassifier AlgorithmPerformance Results
1Asgari, et al. [31]Automatic detection of atrial fibrillation using stationary wavelet transform and support vector machineStationary wavelets transform (SWT) DL6SVMSen: 97%, Spe: 97.1%, Acc: 96.4%,
2Arvanaghi, et al. [57]Classification of cardiac arrhythmias using arterial blood pressure based on discrete wavelet transformDiscrete wavelet transform (DWT) DB6 DL10Least-Squares Support Vector Machines (LS-SVM)Acc: 95.75%
3Kumar, et al. [18]automated diagnosis of atrial fibrillation ECG signals using entropy features extracted from flexible analytic wavelet transformFlexible analytics wavelet transform (FAWT): log energy entropy (LEE))Random ForestSen: 95.8%, Spe: 97.6%, Acc: 96.84%
4Kora, et al. [58]Atrial fibrillation detection using discrete wavelet transformDWT (DB2 DL2)SVM Acc: 94.07%
5Abdelazez, et al. [59]Detection of atrial fibrillation in compressively sensed electrocardiogram measurementsMix among statistical methods, empirical mode decomposition (EMD), DWT (discrete Meyer LD4), SWT (DB5 LD6), and discrete cosine transform (DCT)Random ForestF1 Score: 85%
6Our ResearchThe effects of Daubechies wavelet basis function (DWBF) and decomposition level on the performance of artificial intelligence-based atrial fibrillation (AF) detection on electrocardiogram (ECG) signalDWT (DWBF and DL)SVMSen: 97.57% (DB6DL2), Spe: 96.75% (DB2DL4), Acc: 94.17% (DB2DL4)
Disclaimer/Publisher’s Note: The statements, opinions and data contained in all publications are solely those of the individual author(s) and contributor(s) and not of MDPI and/or the editor(s). MDPI and/or the editor(s) disclaim responsibility for any injury to people or property resulting from any ideas, methods, instructions or products referred to in the content.