Abstract
The purpose of this study was to determine tissue concentration of toxic metals, namely Mn, Cr, Ni, Cu, Fe, Cd, Pb, and Zn, in the removed third molars in patients from the Legnica-Głogów copper district. A group of 69 patients with an average age of 27.3 ± 6.9 years was enrolled into the study. There were 16 (23.2%) men and 53 (76.8%) women. Patients were divided into two groups according to the place of residence—residents of the Legnica-Głogów Copper Area (n = 49) and the control group, residents of Wrocław (n = 20). Determination of the Pb, Cd, Cr, Ni, Fe, Mn, Cu, Zn content was performed by atomic absorption spectrometry in an air–acetylene flame using the SpectraAA atomic absorption spectrometer with a V2 AA240FS flame attachment. The content of Fe and Pb in the third molars was higher among residents of the Legnica-Głogów Copper Area (p = 0.016 and p = 0.002, respectively). The significant risk factors that may contribute to the accumulation of toxic metals in teeth were identified. We showed a significant correlation between the level of Cr, Cu, and Zn and age, and between chromium and vitamin D3 concentration in the blood (p < 0.05 for all).
1. Introduction
Biomonitoring, as part of environmental dentistry, is defined as a set of activities to assess the state of the environment using biomonitors. The study of the toxic metal content forms the basis of environmental policy making, which affects the health of the human population living in a specific area. Biomonitors of toxic metal exposure in humans are so-called non-invasive matrices, which include teeth, saliva, hair, nails, or urine [1,2]. Because of the ease of obtaining biological material in the form of deciduous teeth, there are many studies and research available that assess the toxic metal content of their structure [3,4,5,6]. Teeth are a permanent record of an individual’s lifestyle in a specific environment, reflecting the impact of environmental contaminants [7,8]. In the process of teeth mineralization, toxic metal cations are incorporated into the xystalline structure of hydroxyapatites. They enter the tooth tissues via the bloodstream.
Vitamin D3 is an offshoot of cholesterol and constitutes a part of secosteroid compounds. Humans may obtain vitamin D3 from a wholesome diet; however, the greatest part is produced by organisms (~90%). In addition, vitamin D may reduce bone absorption by increasing gut Ca absorption and its reabsorption in the distal renal tubule. It can also affect the secretion of calcitonin (acceleration) and it reduces the proliferation of parathyroid cells, and then inhibits the synthesis and activity of PTH [9]. Vitamin D3 stimulates the co-absorption of toxic metals [10], which disrupt calcium–phosphate metabolism (Figure 1).
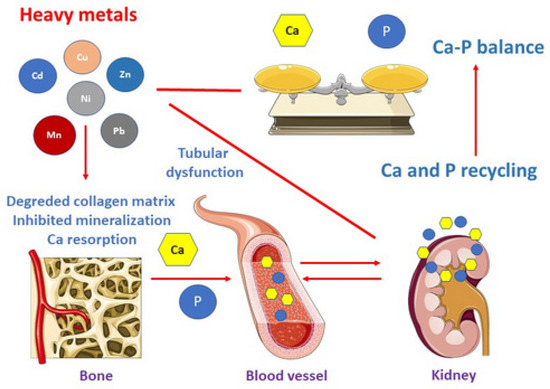
Figure 1.
The effects of toxic metals.
On the other hand, it plays a key role in the development and mineralization of tooth germs and also participates in the formation and maturation of enamel and dentine [11].
Extracting teeth for biomonitoring purposes is ethically unacceptable. However, the relatively high frequency of extraction procedures of completely retained third molars due to orthodontic or surgical reasons creates opportunities for their use for this purpose [12].
The Legnica-Głogów Copper District is an urban–industrial area and a copper ore basin in the northern part of the lower Silesia Province (Poland), with an area of approximately 2200 km2, inhabited by about half a million inhabitants. It is one of the largest in the world, and its development dates back to the 1960s, when deep copper deposits were first discovered there. Currently, the copper ore mining sector comprises three mines—“Lubin”, “Rudna”, and “Polkowice-Sieroszowice”, supported by the “Ore Enrichment Plant” and the “Hydrotechnical Plant”. In turn, the processing sector includes three steelworks—“Legnica”, “Głogów”, and “Cedynia”. Copper ore tailings are stored in a huge engineering facility “Żelazny Most”, covering an area of approximately 1400 ha [13].
The exploitation of deposits is associated with the emission of sulfur, nitrogen, and carbon compounds into the environment, as well as dust and waste containing toxic metals [14]. The Legnica-Głogów Copper Area in Poland is a district where the risk of heavy metal contamination is increased due to the industrial profile and structure.
There are many sources of toxic metals: polluted soil and atmosphere, contaminated food or drinking water, and cigarettes (Figure 2). Heavy metals may cause various diseases including the stomatognathic system disorders [15,16]. To the best of our knowledge, our study is the first to assess the accumulation of toxic metals: Pb, Cd, Cr, Ni, Fe, Mn, Cu, and Zn in third molars from residents of the Legnica-Głogów Copper Area. The relationship between toxic metals and demographics, clinical data, diet, vitamin supplementation, and the concentration of vitamin D3 in the blood of patients was studied.
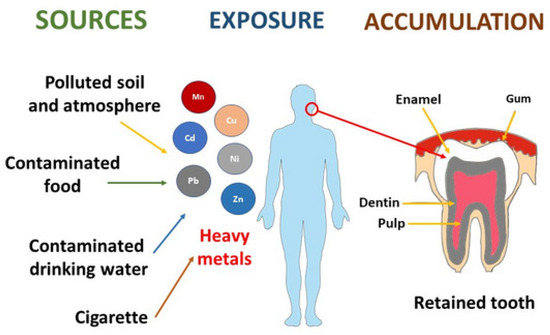
Figure 2.
The sources of toxic metals.
2. Materials and Methods
2.1. Material
The study was conducted in full compliance with the Declaration of Helsinki, in a group of 69 patients in whom the third molars were extracted as the main study material after giving informed consent for the study and medical procedure. In addition to the extracted teeth, blood was drawn from the patients and responses were elicited in a proprietary questionnaire.
The authors obtained the consent of the Bioethics Committee of the Wroclaw Medical University (consent number: KB-246/2019) prior to the study.
Patients were divided into two subgroups—the research group of 49 patients who were residents of the Legnica-Głogów Copper Area, and the control group of 20 patients who were residents of the city of Wrocław. The research material was collected in the period from June 2020 to June 2021, during the COVID-19 epidemic; therefore, the number of patients in the control group, which was matched according age and gender to the study group, was small.
The authors collected lower completely retained molars from the patients of both groups, namely the control and study. Data on gender, age, permanent residency, and absence of dietary supplements were gathered as part of the study. The most important criterion for inclusion and exclusion was that the surveyed patients had lived since birth in the Legnica-Głogów Copper Area or in Wrocław. In addition, patients needed to be healthy and not take any dietary supplements or medications.
The sample consisted of the whole extracted tooth. To avoid chemical treatment of the material prior to analytical testing, the material was stored at −20 °C in sterile boxes and then evaluated for the content of Mn, Cr, Ni, Cu, Fe, Cd, Pb, and Zn.
2.2. Determination of Toxic Metals in the Study Material
Atomic absorption spectrometry was used for the multi-element analysis of the dental material. The information collected by means of the author’s questionnaire included: gender, age, place of residence, occupational exposure, smoking habits, incidence of allergies, general diseases, and nutritional supplementation used.
The content of selected minerals and toxic trace elements in the bone tissue was determined at the certified AAS laboratory of the Department of Human Nutrition, Wrocław University of Environmental and Life Sciences.
The data obtained from the author’s questionnaires were cross-referenced with the specific toxic metal content of the individual tooth samples, the vitamin D concentration in capillary blood, and the results of the clinical assessment of the post-extraction wound healing, and were then statistically analyzed.
2.3. Mineralization of Examined Material
Sample mineralization was performed wet in a closed-loop microwave system. First, 5 cm3 of concentrated nitric acid (V) ACS and 1 cm3 of concentrated hydrogen peroxide ACS were added to the sample weight of homogeneous samples (from 0.1 g to 0.5 g). After that, the samples were mineralized in a MARS 5 microwave sample preparation system. According to the Polish Standard PN-EN 13805: 2003 Food products, for the determination of trace elements, using pressure mineralization [17], we quantitatively transferred the minerals to a 10 cm3 measuring container filled with distilled water.
2.4. Examination of Toxic Metals in the Samples
The concentration of Pb, Cd, Cr, Ni, Fe, Mn, Cu, and Zn was accomplished with a use of atomic absorption spectrometry in an air–acetylene flame using the SpectraAA atomic absorption spectrometer with a V2 AA240FS flame attachment under a special hollow cathode lamp (Table 1). The accuracy of the method was confirmed using certified reference material ERM-BD151 skim milk powder (Sigma-Aldrich, Saint Louis, MO, USA), with an estimated uncertainty of 5% [8]. The content of toxic metals was established in accordance with the following criteria:

Table 1.
Measurement parameters applied according to the authors’ previous study [8].
- Determination of trace elements—Determination of lead, cadmium, zinc, copper, iron, and chromium by atomic absorption spectrometry (AAS) after dry mineralization [18]—Pb, Cd, Zn, Cu, Fe, and Cr—PN-EN 14082: 2004 Food products.
- Determination of heavy metal content by atomic emission spectrometry—Determination of nickel content [19]—Ni—PN-A-86939-6: 1998 Vegetable and animal oils and fats.
- Determination of calcium, copper, iron, magnesium, manganese, potassium, sodium, and zinc content—Atomic absorption spectrometry method [20]—Mn—PN-EN ISO 6869: 2002 Feed
2.5. Methodology of Blood Collection and Determination of Vitamin D3
Vitamin D levels were measured from a capillary blood sample using the capillary method in the Vitality Health Check (VHC) Vitamind-D TEST system.
After thoroughly washing, disinfecting, and drying the blood collection site and obtaining the blood circulation, a sterile disposable lancet was used to puncture the fingertip, after which 10 µL of blood was collected using heparinized capillary tubes (BloodCollector—UniSampler device).
The blood was then placed in the CollectionTube, which had previously been used to obtain the buffer. After thorough mixing, the sample was placed using a micropipette on the Test Divice. After 15 min, the vitamin D value was read using the VHC Reader.
2.6. Statistical Analysis
Analysis of data was performed using Statistica 13.3 software (Tibco Software Inc., Palo Alto, CA, USA). Testing of the data distribution was performed with the Shapiro–Wilk normality test. Descriptive data were shown as number of observation (percent) or as median (quartile 1–quartile 3, Q1–Q3) and 95% CI (95% confidence interval). Qualitative data were analyzed using the chi-square test or Fisher exact test. As the distribution of the quantitative variable in one of the compared groups was significantly different from the normal distribution in all cases, non-parametric tests were used to analyze the data. The Mann–Whitney test was used to compare two independent study groups, and Kruskal–Wallis analysis was performed for the comparison of more than two groups. Dunn’s test was used as a post hoc test for intragroup comparisons. The Spearman test and correlation coefficient (rho) were calculated to evaluate the associations between pairs of variables. Values p < 0.05 were assumed as statistically significant, and 0.05 < p < 0.1 signified a tendency to statistical significance.
3. Results
3.1. Basic Characteristic of Patients
As demonstrated in Table 2, the largest proportion of study group were young non-smokers in the 16–26 age range, generally healthy people with a female predominance. There were insignificant differences in gender distribution, age, smoking, occupation, diseases, dietary supplementation, and vitamin D3 level between study and control group (p > 0.05 for all parameters). The reason for performing dental extractions for surgical reasons proved to be significantly statistical (p = 0.020).
Table 2.
Demographical, clinical, and laboratory characteristic of total study group and two subgroups of patients, divided according to place of residence. Descriptive data were presented as number of observation (percent) or median (Q1–Q3) and [95% CI]. Chi-square test, Fisher exact test, or Mann–Whitney test were used for the analysis of differences between two subgroups of patients.
3.2. The Content of Toxic Metals in the Removed Teeth in Patients from the LG Copper Area and in Control Group
As shown in Table 2, the concentrations of Fe and Pb were significantly higher in the teeth removed from patients from the LG Copper Area than in patients from the control group (p = 0.016 and p = 0.002, respectively).
3.3. Risk Factors Determining the Accumulation of Toxic Metals in the Teeth of Patients Residing in the LG District
The significant risk factors determining the accumulation of toxic metals, such as Mn, Cr, Ni, and Cu, in the teeth of patients residing in the LG Cooper Area are presented in Table 3.
Table 3.
Tissue concentrations of toxic metals in the removed teeth in the total study group and two subgroups of patients, divided according to place of residence. Descriptive data are presented as median (Q1–Q3) and [95% CI]. Mann–Whitney test was used for analysis of differences between two subgroups of patients.
The manganese content significantly depended on the occupation of the patients (p = 0.043). In the group of students, the median was 0.14 µg/g, while among the white-collar workers, the median was 0.25 µg/g—both of the results were statistically significant in the pair of subgroups (post hoc test).
The high manganese content was determined as statistically significant in relation to increase of vitamin D3 concentration in capillary blood (p = 0.012). In the group of patients with 20–29 ng/mL of vitamin D3 concentration, the median of manganese content in the third molars was 0.13 µg/g, in the group of patients with 30–50 ng/mL of vitamin D3 concentration the median of manganese content in the third molars was 0.28 µg/g—both results were classified as statistically significant in the pair of subgroups (post hoc test).
In the case of chromium and nickel concentration in the removed third molars, the occupation showed a tendency to statistical significance (p = 0.085 and p = 0.072, respectively).
A statistically significant relationship between vitamin D3 concentration in the capillary blood and chromium content was shown (p = 0.034).
The content of copper in the examined samples increased with the age of patients—values showed a tendency to statistical significance (p = 0.061).
3.4. Content of Manganese
No statistically significant effect of patients’ sex on the tooth manganese content was observed (p-value = 0.633).
In the 27–37 age group, the manganese content in the tooth was higher than in the other age groups; however, the differences were not considered to be statistically significant (p-value = 0.328).
No statistically significant difference was observed between smoking and non-smoking patients (p-value = 0.436).
The manganese content in the tested samples significantly depended on the occupation of the patients (p-value = 0.043). In the group of students, the median was 0.14 (µg/g), and among the white-collar workers, the median was 0.25 (µg/g)—both of the results were statistically significant in the pairs of subgroups (post hoc test).
In the group of patients that lived for 21–30 years in the L-G Copper Area, the median content of the manganese was the highest (0.26 (µg/g)); however, it was not determined as statistically significant.
Among the patients with thyroid and parathyroid gland diseases, a slightly higher concentration of manganese was observed (0.28 (µg/g), p-value = 0.381).
Dietary supplements and the reason for extraction were also considered as not statistically significant (p-value = 0.182, p-value = 0.563).
The vitamin D3 concentration in the capillary blood was determined as statistically significant (p-value = 0.012). In the group of patients with 20–29 (ng/mL) vitamin D3 concentration, the median manganese content in the third molars was 0.13 (µg/g), in the group of patients with 30–50 (ng/mL) vitamin D3 concentration, the median of manganese content in the third molars was 0.28 (µg/g)—both of the results were classified as statistically significant in the pairs of subgroups (post hoc test).
This section may be divided by subheadings. It should provide a concise and precise description of the experimental results and their interpretation, as well as the experimental conclusions that can be drawn.
3.5. Content of Chromium and Nickel
In the case of chromium and nickel concentration in the removed third molars, the occupation showed a tendency to statistical significance (p-value = 0.085, p-value = 0.072).
The vitamin D3 concentration (ng/mL) in the capillary blood and chromium content in the samples were classified as statistically significant (p-value = 0.034).
3.6. Content of Copper
No statistically significant effect for patients’ sex on the tooth copper content was observed (p-value = 0.463).
The content of copper in the examined samples increased with the age of the patients—the values showed a tendency to statistical significance (p-value = 0.061).
Smoking was not classified as statistically significant (p-value = 0.778).
In the group of white-collar workers, the level of copper was slightly higher than among the other occupations (0.15 (µg/g)); however, it was not considered to be statistically significant (p-value = 0.569).
The highest value of copper was noticed in the patients who have lived in the L-G copper district for over 31 years (0.22 (µg/g)—p-value = 0.389).
In Table 4B, we demonstrate associations between content of Fe, Cd, Pb, Zn and risk factors which have an influence on accumulation of these toxic metals.
Table 4.
A. Risk factors determining the accumulation of Mn, Cr, Ni, Cu in the teeth of patients residing in the LG Copper Area (n = 49). B. Risk factors determining the accumulation of Fe, Cd, Pb, Zn in the teeth of patients residing in the LG district (n = 49). Descriptive data are presented as median (Q1–Q3). Mann–Whitney test or Kruskal–Wallis analyses are used for analysis of differences between two or more than two categories of patients.
No statistically significant effect for all of the tested parameters on the content of iron in the removed teeth was observed (p > 0.05 for all).
A statistically significant effect of patient sex on the cadmium content was observed (p = 0.037), in the female group the cadmium concentration was 0.08 µg/g and in the male group it was 0.05 µg/g.
The concentration of lead in the removed teeth significantly increased with the age of patients (p = 0.032). In the 38–45 age group, the lead content was significantly higher than in the 16–26 age group (post hoc test).
The content of zinc in the examined samples increased with the age of the patients, the results showed a tendency to statistical significance (p = 0.088). The occupation of the patients showed a tendency to statistical significance (p = 0.100). The highest concentration of zinc was detected in the group of workers (132.22 µg/g).
The content of zinc in the studied teeth increased with the years of residence in the L-G copper district, and the results showed a tendency to statistical significance (p = 0.088).
Significant differences in zinc content depending on vitamin D3 concentration ranges were observed (p = 0.008). The greatest value for zinc (158.62 µg/g) was noted in a group of patients with <20 ng/mL vitamin D3 in the capillary blood.
3.7. Content of Iron
No statistically significant effect of patients’ sex on the content of iron in removed teeth was observed (p-value = 0.311); however, in the male group, the iron content was 1.81 times higher than in the female group.
The content of iron in the third molars increased with the age of the patients (p-value = 0.497).
The iron content did not depend on the smoking habits (p-value = 0.888).
The highest value of Fe concentration in the samples was found in the worker group (4.90 (µg/g), p-value = 0.504).
The iron content did not depend on the years of residence in the L-G Copper Area district (p-value = 0.956).
The concentration of iron in the samples from patients with thyroid and parathyroid gland diseases was comparable to the samples from patients without these diseases (p-value = 0.346).
Dietary supplements did not affect the iron concentration in the samples (p-value = 0.580).
The highest concentration of iron was observed in the teeth removed for surgical reason and it was 1.85 times higher than for those from orthodontic and inflammation reasons, but it was not statistically significant (p-value = 0.152).
The highest content of iron was noticed in patients with the concentration of vitamin D3 of 20–29 (ng/mL), but it was not statistically significant (p-value = 0.693).
3.8. Content of Cadmium
A statistically significant effect of patient sex on the cadmium content in the samples was observed (p-value = 0.037), where in the female group, the cadmium concentration was 0.08 (µg/g) and in the male group it was 0.05 (µg/g).
The cadmium content did not depend on the age of patients (p-value = 0.736).
The smoking habit did not affect the accumulation of cadmium in the samples (p-value = 0.714).
The concentration of cadmium was slightly higher in a worker group (p-value = 0.09 (µg/g), p-value = 0.116).
The highest level of cadmium was noticed in patients who lived in L-G cooper district ≤20 years (0.09 (µg/g), p-value = 0.719).
Thyroid and parathyroid glands diseases, intake of dietary supplements, and reasons for extraction were considered to not statistically significant (p-values in order: 0.631; 0.196; 0.984).
3.9. Content of Lead
In both the male and female groups, the lead content was comparable, it was considered not statistically significant (p-value = 0.843).
In the 38–45 age group, the lead content in the removed tooth was significantly higher than in the other age groups (0.77 (µg/g)). In the age groups of 16–26 and 38–45, the results were statistically significant in the pairs of subgroups (post hoc test).
Smoking habits and the occupation of the patients did not affect the concentration of lead in the samples (p-value= 0.453, 0.203).
The concentration of lead in the removed teeth did not depend on the years of residence in the L-G Copper Area (p-value = 0.740).
Thyroid and parathyroid gland diseases, intake of dietary supplements, and reasons for extraction were considered not statistically significant (p-values in order: 0.457; 0.273; 0.899).
The highest content of lead (0.63(µg/g)) was noted in a group of patients with 30–50 (ng/mL) vitamin D3 in the capillary blood, but it was not statistically significant (p-value = 0.722).
3.10. Content of Zinc
No statistically significant effect of patients’ sex on zinc content was noted (p-value = 0.492).
The content of zinc in the examined samples increased with the age of patients, and the results showed a tendency to statistical significance (p-value = 0.088).
The occupation of patients showed a tendency to statistical significance (p-value = 0.100). The highest concentration of zinc was detected in the group of workers (132.22 (µg/g)).
The content of zinc in the studied teeth increased with the years of residence in the L-G Copper Area district, and the results showed a tendency to statistical significance (p-value = 0.088).
The highest concentration of zinc was identified in the samples extracted as a result of inflammation processes, but it was not statistically significant (p-value = 0.455).
The content of zinc in patients with <20 (ng/mL) and 20–29 (ng/mL) vitamin D3 was considered statistically significant in the pairs of subgroups (post hoc test). The greatest value for zinc was noted in a group of patients with <20 (ng/mL) vitamin D3 in the capillary blood (p-value = 0.008).
We observed a statistically significant positive correlation between Cr, Cu, and Zn content and the age of patients residing in the L-G Copper Area (p < 0.05 for all) (Table 5). The positive correlation between manganese and age showed a tendency to statistical significance (p = 0.097).
Table 5.
Correlations between levels of toxic metals and continuous variables such as age and vitamin D3 concentration in patients residing in the LG Cooper Area (n = 49). Spearman correlation analysis was used for testing the data.
Correlations between vitamin D3 concentration in the capillary blood and toxic metals were both positive and negative. A statistically significant negative correlation between the level of vitamin D3 and chromium was shown (rho = −0.29; p = 0.038). A negative correlation between nickel content and vitamin D3 concentration demonstrated a tendency towards statistical significance (p = 0.071).
4. Discussion
Biomonitoring studies within the Legnica-Głogów Copper Area in south-western Poland (impact of the “Głogów” and “Legnica” smelters and the “Żelazny Most” tailings pond) have focused, so far, on determining the level of toxic metals in the blood [21]. In contrast with blood, the use of extracted third molars for orthodontic or surgical indications does not raise ethical concerns.
Completely impacted teeth are a useful biomonitor of environmental exposure to many toxic metals [12]. They basically exclude exposure to toxic metals contained in cigarette smoke or contaminated food.
In the conducted research, the content of manganese, chromium, nickel, copper, cadmium, and zinc did not depend on the place of residence. The results from L-G Copper Area patients were comparable to our control group. However, the concentration of iron and lead was significantly higher in the removed teeth from the L-G Copper Area patients (3.86 vs. 1.81 and 0.53 vs. 0.31). This may indicate environmental pollution of lead and zinc in the L-G Copper Area. Human exposure to lead can cause numerous adverse effects [22], such as hypertension, slow nerve conduction, mood swings, fatigue, and impaired concentration. In addition, it contributes to fertility disorders and decreased sex drive [23,24].
Rzymski et al. [25] described the effects of cadmium, lead, and mercury on the female reproductive system. A high concentration of toxic metals may contribute to endometrial dysfunctions, implantation failure, premature delivery, subfertility, spontaneous abortions, and preeclampsia.
In our study, a positive Spearman’s correlation was observed between the content of all toxic metals and the age of patients. The correlation between the concentration of vitamin D3 in the capillary blood and toxic metals was mainly negative, apart from copper, cadmium, and lead (rho 0.02; 0.16; 0.04). These results may be related to the stimulation of co-absorption by vitamin D [10].
Biomonitoring studies using teeth in industrialized areas have also been conducted in other parts of Poland [5,8,12,26,27,28].
Bryła et al. [8] examined the content of toxic metals in impacted third molars and adjacent bone tissue in patients from the Wrocław district and residents of the city of Wrocław. They observed that the cadmium contents in both the tooth and bone tissue were statistically significantly higher in patients living in Wroclaw (p < 0.05). In our study, the level of cadmium was comparable in patients from the L-G Copper Area and from Wrocław (0.07 vs. 0.06).
According to Maciejewska et al. [26], the concentration of zinc in the bone of rats decreased with age. In the research of Bryła et al. [8], the concentration of zinc did not depend on the patient age. The results obtained from our own study showed a positive correlation between age and the content of zinc in the removed teeth (p-value < 0.001).
Wychowański and Małkiewicz [27] evaluated trace elements in the hard dental tissues of third retained molars in patients from urban and rural areas of Mazovia. The concentration of lead, cadmium, manganese, and chromium was higher in the patients from the city.
In turn, Malara et al. [12] proved that the cadmium and lead concentrations in the impacted third molars were significantly higher for habitants of the polluted Ruda Slaska region than those living in the unindustrialized Bielsko-Biala region.
In our study, we compared the results obtained from patients living in the L-G Copper Area to the patients from Wrocław city, which is the third largest city in terms of agglomeration size in Poland, and it is relatively polluted. The authors’ research showed that working in the copper mining industry is associated with a higher accumulation of manganese, chromium, and nickel. It has also been confirmed by other researchers [12].
It has been shown that Pb accumulates in the body with age and the mineralized tissues constitute a reservoir of approximately 90% of the lead reserve [28]. We indicated that the female gender may also have an effect on teeth levels of copper, as in the case of blood and brain tissue [29].
Impacted third molars of the Legnica-Głogów Copper Area inhabitants seem to be a useful biomonitor of environmental exposure to toxic metals. However, this requires confirmation in further research.
5. Conclusions
Based on the obtained results, it can be concluded that the concentration of all of the tested toxic metals increased with the age of the patients; however only chromium, copper, and zinc were considered statistically significant. The content of iron and lead was statistically significantly higher in patients living in the L-G Copper Area than in residents of Wrocław, which may indicate greater environmental pollution in the L-G Cooper Area during the mineralization process. Further studies concerning the affect of the environment on the content of toxic metals in the human body should be conducted.
6. The Limitations of the Study
The material was collected in the period from June 2020 to June 2021, during the COVID-19 pandemic, thus the number of patients in the control group, which was matched according age and gender to the study group, was small. We performed analyses of test power for both groups and used statistical tests. Based on the calculations, we concluded that the number of people in the study group was correct, while the size of the control group was slightly lower than required. The authors of the study are aware that the volume of the study was small; however, we will perform further examinations.
Author Contributions
Conceptualization, S.R., M.D. (Maciej Dobrzyński) and M.D. (Marzena Dominiak); methodology, S.R. and M.S.; software, S.R. and A.K.; validation, S.R. and M.S.; formal analysis, D.D.; investigation, S.R. and M.S.; resources, S.R. and A.K.; data curation, S.R. and M.S.; writing—original draft preparation, S.R., S.K., D.D. and A.K.; writing—review and editing, M.D. (Maciej Dobrzyński), M.D. (Marzena Dominiak), T.G. (Tomasz Gębarowski), T.G. (Tomasz Gedrange) and D.D.; visualization, S.R. and A.K.; supervision, M.D. (Maciej Dobrzyński) and M.D. (Marzena Dominiak); project administration, M.D. (Maciej Dobrzyński), M.D. (Marzena Dominiak) and T.G. (Tomasz Gedrange); funding acquisition, M.D. (Maciej Dobrzyński)., M.D. (Marzena Dominiak), T.G. (Tomasz Gedrange) and T.G. (Tomasz Gębarowski). All authors have read and agreed to the published version of the manuscript.
Funding
This article was co-financed by a subsidy from Wroclaw Medical University, number SUBZ.B180.23.054, SUBZ.B040.23.048 and SUBZ.B020.23.051. The APC costs were also supported by statutory research and development activity funds assigned to the Faculty of Veterinary Medicine and the Faculty of Biotechnology and Food Science, Wrocław University of Environmental and Life Sciences.
Institutional Review Board Statement
Institutional Review Board Statement: Consent of the Bioethics Committee of the Wroclaw Medical University: KB-246/2019.
Informed Consent Statement
Informed consent was obtained from all of the subjects involved in the study.
Data Availability Statement
Not applicable.
Acknowledgments
The figures were partly generated using Servier Medical Art, provided by Servier, licensed under a Creative Commons Attribution 3.0 unported license.
Conflicts of Interest
The authors declare no conflict of interest.
References
- Tsz-Shan Lum, J.; Chan, Y.-N.; Sze-Yin Leung, K. Current applications and future perspectives on elemental analysis of non-invasive samples for human biomonitoring. Talanta 2021, 234, 122683. [Google Scholar] [CrossRef]
- Esteban, M.; Castaño, A. Non-invasive matrices in human biomonitoring: A review. Environ. Int. 2009, 35, 438–449. [Google Scholar] [CrossRef] [PubMed]
- Barton, H.J. Advantages of the use of deciduous teeth, hair, and blood analysis for lead and cadmium bio-monitoring in children. A study of 6-year-old children from Krakow (Poland). Biol. Trace Elem. Res. 2011, 143, 637–658. [Google Scholar] [CrossRef]
- Alomary, A.; Al-Momani, I.F.; Obeidat, S.M.; Massadeh, A.M. Levels of lead, cadmium, copper, iron, and zinc in deciduous teeth of children living in Irbid, Jordan by ICP-OES: Some factors affecting their concentrations. Environ. Monit. Assess. 2013, 185, 3283–3295. [Google Scholar] [CrossRef] [PubMed]
- Fischer, A.; Wiechuła, D.; Przybyła-Misztela, C. Changes of concentrations of elements in deciduous teeth with age. Biol. Trace Elem. Res. 2013, 154, 427–432. [Google Scholar] [CrossRef]
- Tvinnereim, H.M.; Eide, R.; Riise, T. Heavy metals in human primary teeth: Some factors influencing the metal concentration. Sci. Total Environ. 2000, 255, 21–27. [Google Scholar] [CrossRef]
- Leventouri, T.; Antonakos, A.; Kyriacou, A.; Venturelli, R.; Liarokapis, E.; Perdikatsis, V. Crystal structure studies of human dental apatite as a function of age. Int. J. Biol. Mater. 2009, 2009, 1–17. [Google Scholar] [CrossRef]
- Bryła, E.; Dobrzyński, M.; Konkol, D.; Kuropka, P.; Styczyńska, M.; Korczyński, M. Toxic Metals Content in Impacted Third Molars and Adjacent Bone Tissue in Different Groups of Patients. Materials 2021, 14, 793. [Google Scholar] [CrossRef]
- Krawiec, M.; Dominiak, M. Prospective evaluation of vitamin D levels in dental treated patients: A screening study. Dent. Med. Probl. 2021, 58, 321–326. [Google Scholar] [CrossRef]
- Moon, J. The role of vitamin D in toxic metal absorption: A review. J. Am. CollNutr. 1994, 13, 559–564. [Google Scholar] [CrossRef]
- Ślebioda, Z.; Szponar, E.; Dorocka-Bobkowska, B. Vitamin D and its relevance in the etiopathogenesis of oral cavity diseases. Arch. Immunol. Ther. Exp. (Warsz) 2016, 64, 385–397. [Google Scholar] [CrossRef] [PubMed]
- Malara, P.; Fischer, A.; Malara, B. Selected toxic and essential heavy metals in impacted teeth and the surrounding mandibular bones of people exposed to heavy metals in the environment. J. Occup. Med. Toxicol. 2016, 11, 56. [Google Scholar] [CrossRef]
- Kołacz, R.; Dobrzański, Z.; Kupczyński, R.; Cwynar, P.; Opaliński, S.; Pogoda-Sewerniak, K. Impact of the copper industry on the content of selected heavy metals and biochemical indicators in the blood of dairy cows. Med. Weter 2017, 73, 171–175. [Google Scholar] [CrossRef]
- Strzelec, Ł.; Niedźwiecka, W. Natural environment in the area of copper smelter plants. Trend Chang. Med. Sr. Environ. Med. 2012, 15, 21–31. [Google Scholar]
- Tsushima, F.; Sakurai, J.; Shimizu, R.; Kayamori, K.; Harada, H. Oral lichenoid contact lesions related to dental metal allergy may resolve after allergen removal. J. Dent. Sci. 2022, 17, 1300–1306. [Google Scholar] [CrossRef] [PubMed]
- Lucchese, A.; Dolci, A.; Minervini, G.; Salerno, C.; DIStasio, D.; Minervini, G.; Laino, L.; Silvestre, F.; Serpico, R. Vulvovaginal gingival lichen planus: Report of two cases and review of literature. Oral. Implantol. 2016, 9, 54–60. [Google Scholar] [CrossRef]
- PN-EN 13805:2003; Food Products-Determination of Trace Elements-Pressure Mineralization. European Commission: Brussels, Belgium, 2003.
- PN-EN 14082:2004; Food Products-Determination of Trace Elements-Determination of Lead, Cadmium, Zinc, Copper, Iron and Chromium by Atomic Absorption Spectrometry (AAS) after Dry Mineralization. European Commission: Brussels, Belgium, 2004.
- PN-A-86939-6:1998; Vegetable and Animal Oils and Fats-Determination of Heavy Metal Content by Atomic Emission Spectrometry-Determination of Nickel Content. European Commission: Brussels, Belgium, 1998.
- PN-EN-ISO 6869:2002; Determination of Calcium, Copper, Iron, Magnesium, Manganese, Potassium, Sodium and Zinc Content-Atomic Absorption Spectrometry Method. European Commission: Brussels, Belgium, 2002.
- Sławińska-Ochla, T.; Ignasiak, Z.; Fugiel, J.; Pokrywka, J. Lead concentration in blood of school children from copper mining area and the level of somatic development at birth. Med. Environ. Med. 2011, 14, 42–48. [Google Scholar]
- Dembicka, D.; Pastuszek, B.; Strugała-Stawik, H.; Zaręba, A. Monitoring biologiczny stopnia narażenia na ołów i skutków zdrowotnych u dzieci z byłego województwa legnickiego (1996–1999). [W:] Z. Rudkowski (red.) Materiały Konferencji Naukowej nt. Dziecko w środowisku zagrożonym ekologicznie- profilaktyka i problemy zdrowotne. Legnica 1999, 42–44. [Google Scholar]
- Charkiewicz, A.E.; Backstrand, J.R. Lead toxicity and pollution in Poland. Int. J. Environ. Res. Public Health 2020, 17, 4385. [Google Scholar] [CrossRef]
- Krzywy, I.; Krzywy, E.; Pastuszak-Gabinowska, M.; Brodkiewicz, A. Lead—Is there something to be afraid of? Ann. Acad. Med. Stetin. 2010, 56, 118–128. [Google Scholar]
- Rzymski, P.; Tomczyk, K.; Rzymski, P.; Poniedziałek, B.; Opala, T.; Wilczak, M. Impact of heavy metals on the female reproductive system. Ann. Agric. Environ. Med. 2015, 22, 259–264. [Google Scholar] [CrossRef] [PubMed]
- Maciejewska, K.; Drzazga, Z.; Kaszuba, M. Role of trace elements (Zn, Sr, Fe) in bone development: Energy dispersive X-ray fluorescence study of rat bone and tooth tissue. Biofactors 2014, 40, 425–435. [Google Scholar] [CrossRef] [PubMed]
- Wychowański, P.; Małkiewicz, K. Evaluation of metal ion concentration in hard tissues of teeth in residents of central Poland. BioMed. Res. Int. 2017, 2017, 6419709. [Google Scholar] [CrossRef] [PubMed]
- Fischer, A.; DanutaWiechuła, D. Age-Dependent Changes in Pb Concentration in Human Teeth. Biol. Trace Elem. Res. 2016, 173, 47–54. [Google Scholar] [CrossRef] [PubMed]
- Quinn, J.F.; Harris, C.; Kaye, J.A.; Lind, B.; Carter, R.; Anekonda, T.; Ralle, M. Gender effects on plasma and brain copper. Int. J. Alzheimers Dis. 2011, 2011, 150916. [Google Scholar] [CrossRef] [PubMed]


Disclaimer/Publisher’s Note: The statements, opinions and data contained in all publications are solely those of the individual author(s) and contributor(s) and not of MDPI and/or the editor(s). MDPI and/or the editor(s) disclaim responsibility for any injury to people or property resulting from any ideas, methods, instructions or products referred to in the content. |
© 2023 by the authors. Licensee MDPI, Basel, Switzerland. This article is an open access article distributed under the terms and conditions of the Creative Commons Attribution (CC BY) license (https://creativecommons.org/licenses/by/4.0/).