Article

Research on Improved Retinex-Based Image Enhancement Method for Mine Monitoring

1
College of Communication and Information Technology, Xi’an University of Science and Technology, Xi’an 710054, China
2
Xi’an Key Laboratory of Network Convergence Communication, Xi’an 710054, China
3
College of Computer Science and Technology, Xi’an University of Science and Technology, Xi’an 710054, China
*
Author to whom correspondence should be addressed.
Appl. Sci. 2023, 13(4), 2672; https://doi.org/10.3390/app13042672
Submission received: 30 January 2023 / Revised: 17 February 2023 / Accepted: 17 February 2023 / Published: 19 February 2023
(This article belongs to the Special Issue Artificial Intelligence Applications in Mining and Mineral Processing)

Abstract

:
An improved Retinex fusion image enhancement algorithm is proposed for the traditional image denoising methods and problems of halo enlargement and image overexposure after image enhancement caused by the existing Retinex algorithm. First, a homomorphic filtering algorithm is used to enhance each RGB component of the underground coal mine surveillance image and convert the image from RGB space to HSV space. Second, bilateral filtering and multi-scale retinex with color restoration (MSRCR) fusion algorithms are used to enhance the luminance V component while keeping the hue H component unchanged. Third, adaptive nonlinear stretching transform is used for the saturation S-component. Last, the three elements are combined and converted back to RGB space. MATLAB simulation experiments verify the superiority of the improved algorithm. Based on the same dataset and experimental environment, the improved algorithm has a more uniform histogram distribution than the multi-scale Retinex (msr) algorithm and MSRCR algorithm through comparative experiments. At the same time, the peak signal-to-noise ratio (PSNR), structural similarity (SSIM), standard deviation, average gradient, mean value, and colour picture information entropy of the images were improved by 8.28, 0.15, 4.39, 7.38, 52.92 and 2.04, respectively, compared to the MSR algorithm, and 3.97, 0.02, 34.33, 60.46, 26.21, and 1.33, respectively, compared to the MSRCR algorithm. The experimental results show that the image quality, brightness and contrast of the images enhanced by the improved Retinex algorithm are significantly enhanced, and the amount of information in the photos increases, the halo and overexposure in the images are considerably reduced, and the anti-distortion performance is also improved.

1. Introduction

Coal mine video monitoring systems are the primary means of monitoring coal mine safety production, and the timely and accurate identification of abnormal behaviour in the video is of great importance in coal mine safety production. Due to the poor lighting conditions and dusty underground production, lack of clarity in underground monitoring videos is an important issue at present, and the process of enhancing subsurface images can easily cause halo expansion and image overexposure. Therefore, eliminating halo artefacts is essential for image enhancement and further analysis.
Traditional image-denoising methods are generally based on spatial-domain- and transform-domain-based image denoising. The Retinex model, based on Retinex theory, also has many improved versions, including the single-layer Retinex model [1], a multi-scale Retinex model [2], fusion-based enhancement methods [3], illumination map estimation [4], etc. There are also algorithms based on the variational Retinex model, such as the variational Retinex model as a quadratic optimisation problem [5], the Retinex variational framework for the introduction of bright channels [6], the variational Retinex model based on the L2 paradigm [7], a hybrid L2-LP variational model with a brilliant track prior [8], and the maximum entropy-based Retinex model. Based on the computational complexity of the variational approach, the disadvantage of the method is that it is time consuming to process the images.
In addition, Zhuang et al. [9] proposed a new edge-preserving filtering Retinex algorithm that embeds gradient-domain-guided image filtering (GGF), prior information on reflections and illumination into a Retinex-based variational framework to improve image structure and reduce artefacts or noise. Oh and Hong [10] proposed an adaptive image mapping method based on the Retinex model with a parametric non-linear mapping function. Only one luminance channel is used to estimate the reflectance component of the observed shimmering image. Li [11] proposed a mining image enhancement method based on the cuckoo search (CS) algorithm, which is based on the HSV colour space and uses the cuckoo search (CS) algorithm in combination with a proposed new conversion function that exploits the advantages of the bilateral gamma adjustment (BIGA) function and the dual platform histogram equalisation (DPHE) function. By finding the optimal parameter values, the image contrast and brightness are globally enhanced, and the details of the images are enhanced.
In addition, Si [12] proposed a hybrid algorithm (SSR-BF) based on the combination of single-scale Retinex (SSR) and bilateral filtering (BF) to improve the image quality of surveillance videos. Combining BF with SSR reduces noise and improves edge information in the image. The schematic diagram and pseudo-code of SSR-BF are designed, and through simulation, the parameters are set reasonably to ensure the enhancement effect. Xu et al. [13] proposed a hierarchical feature mining network (HFMNET), which extracts illumination and edge features in different network layers, constructs a feature mining attention (FMA) module, and combines hierarchical supervised loss to mine key features in the appropriate network layers. Yang [14] proposed an enhancement algorithm based on an optimised homomorphic filter and RGB colour correction and developed an optimised homomorphic filter to reduce the interference of impurities on the image. The interference of impurity particles on the picture is reduced, and a preliminary optimised image can be obtained. A multi-scale image enhancement algorithm is designed to enhance the image with colour, and an RGB correction algorithm is proposed to colour correct the vision to further improve the image quality considering the colour deviation of the image. Li [15] proposed a multi-scale fusion framework for image enhancement combining Retinex and transmittance optimisation. The R, G and B channel greyscales are quantized to enhance image contrast, the colour constancy of Retinex is used to eliminate the adverse effects of scene illumination, and colour distortion, background light, backscatter and direct component transmittance are estimated. The defogged image is obtained by inverse resolution. Finally, the three input images and the corresponding weight maps are fused in a multi-scale framework to provide high-quality, sharpened results. Gao [16] proposed a new RetinexDIP image enhancement method in which noise is considered a factor in image decomposition using deep learning generation strategies. The noise intervention makes the image more realistic, weakens the coupling between the three components, avoids overfitting and improves generalisation. However, these methods still need to be addressed and optimised for the problems of halos and overexposure during image enhancement.
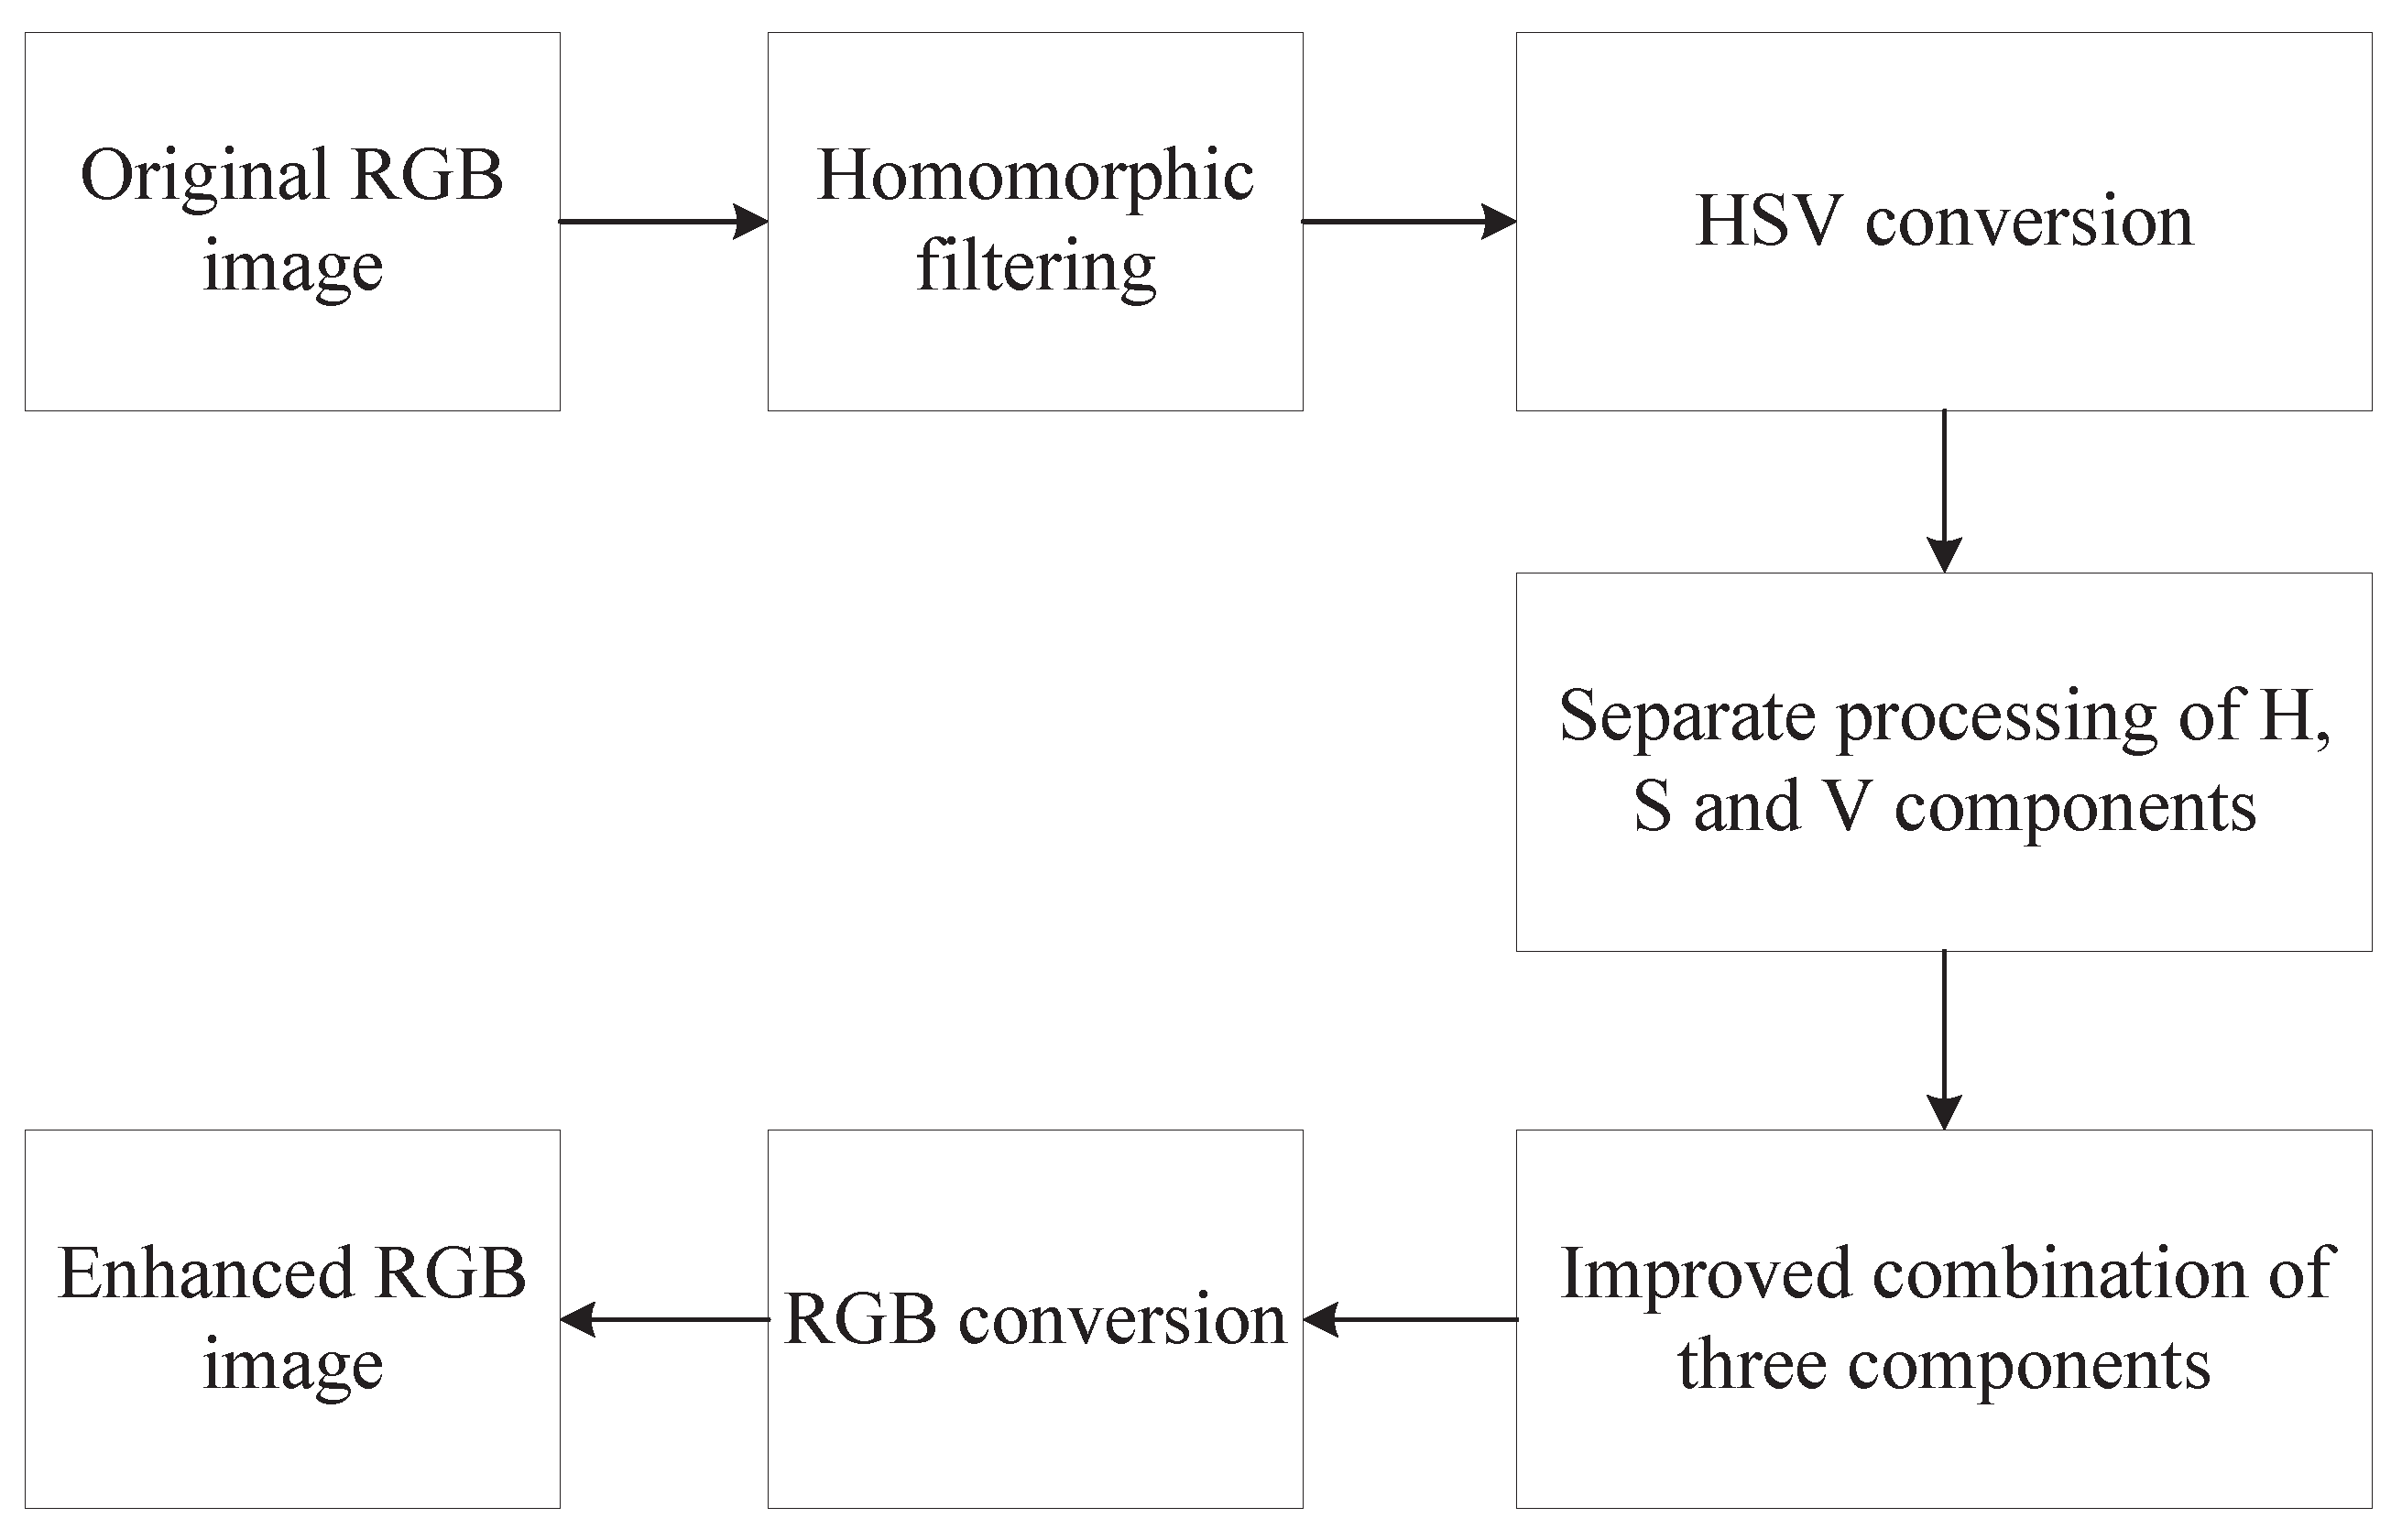
In response to the above research, an improved algorithm based on Retinex is proposed, based on homomorphic filtering, fusing bilateral filtering and Retinex, with the addition of luminance processing to achieve image enhancement, which is expected to essentially reduce the effects of haloing in images and can result in more precise details and better processing results.
The improved algorithm (BF-MSRCR algorithm) consists mainly of the enhancement of the luminance component V and the adaptive stretching of the saturation component S so that the details of the image are better preserved during the enhancement process, without blurring the edges and without problems, such as overexposure and haloing. Compared with the previously proposed algorithm, this uses multiple scale operators for synthesis in the processing, and does not perform simple mean processing, which takes less time and is not very demanding for the enhancement equipment, and is not prone to the halo phenomenon in the strong shadow transition area, which can solve the problem of uneven illumination of the image under the mine. The common algorithm makes the image overexposed to halos.

2. Theoretical Foundations of Algorithms

2.1. HSV Model Analysis

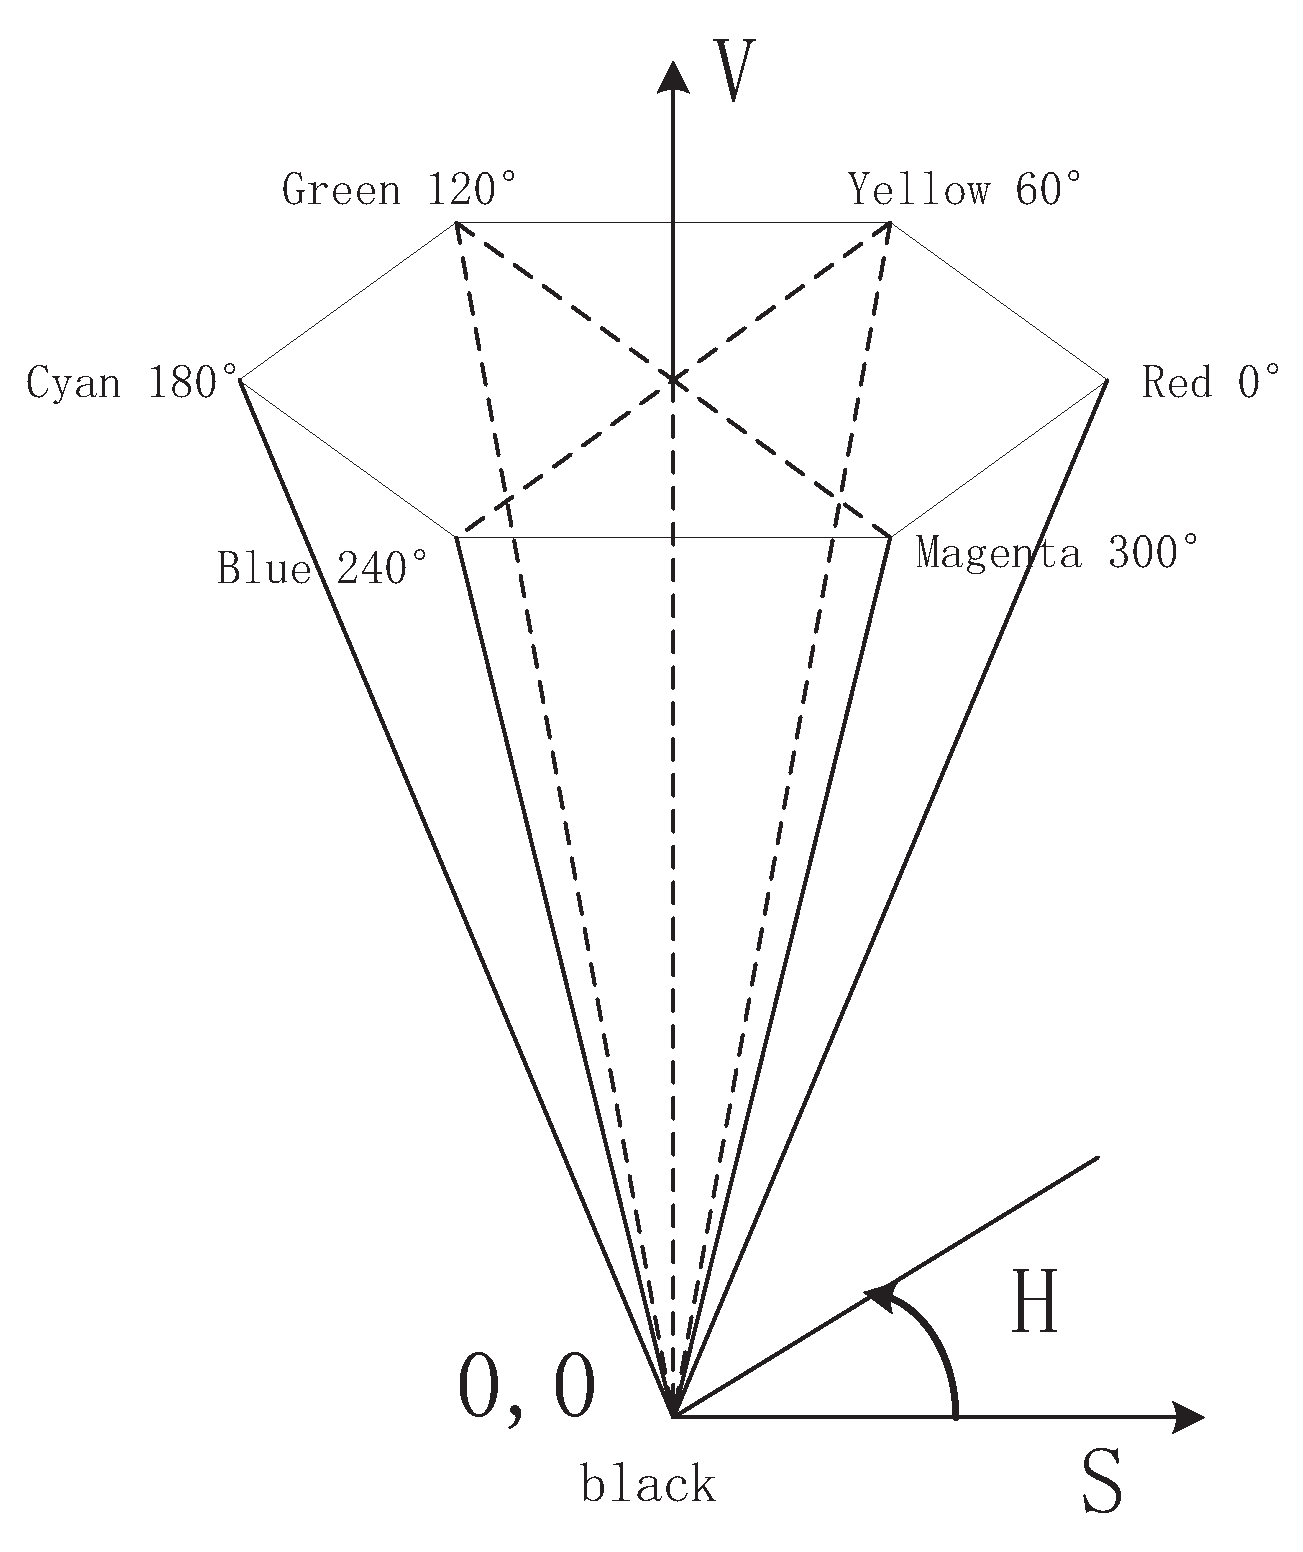
HSV (hue, saturation, value) [17] is created from the intuitive properties of a colour, which is also commonly referred to as the hexagonal cone model, as shown in Figure 1. Each colour is represented using the three characteristics of hue, saturation and colour luminosity.
The hue, H, parameter indicates the image’s colour information, i.e., the position of the spectral colour in which it is located; the saturation, S, indicates the shade of the paint; and the value, V, indicates the brightness of the colour. This time, instead of using the traditional RGB mode for image processing, the image is converted in HSV space for enhancement, where specific attributes of the image are enhanced or diminished, which is more conducive to the processing of underground monitoring images.
The formula for converting from RGB space to HSV space is shown in Equations (1) and (2):
R = R / 255 G = G / 255 B = B / 255
H = 60 × ( G B ) V min ( R , G , B ) , i f V = R 60 × ( B R ) V min ( R , G , B ) + 120 , i f V = G 60 × ( R G ) V min ( R , G , B ) + 240 , i f V = B S = V min ( R , G , B ) V , i f V 0 0 , e l s e V = max ( R , G , B )
In the above equation, max and min represent the maximum and minimum values in RGB space.
The formula for converting from HSV space to RGB space is shown in Equations (3) and (4):
H = H × 2 ; S = S / 255 ; V = V / 255 h i = f l o o r ( H 60 ) ; f = H 60 h i p = V × ( 1 S ) ; q = V × ( 1 f × ( S ) ) t = V × ( 1 ( 1 f ) × ( S )
( R , G , B ) = ( V , t , p ) , i f h i = 0 ( q , V , p ) , i f h i = 1 ( p , V , t ) , i f h i = 2 ( p , q , V ) , i f h i = 3 ( t , p , V ) , i f h i = 4 ( V , p , q ) , i f h i = 5
where floor means rounding down.

2.2. Retinex Model Analysis

Retinex [10] is an image enhancement algorithm, which is often used on an experimental and analytical basis. The principle is that the colour of an object is determined by the reflectance of the object for long-, medium-, and short-wave light, so the algorithm can achieve good results in three aspects—edge enhancement, dynamic compression, and colour constancy—and can perform adaptive enhancement for different types of images. The primary expression for the Retinex model is shown in Equation (5):
S ( x , y ) = L ( x , y ) R ( x , y )
where S ( x , y ) represents the original image, which is decomposed into an illuminance component and a reflection component; the L ( x , y ) component expresses the smoothed information of the input image; and the R ( x , y ) component expresses the original properties of the original image. Therefore, the key to using the Retinex model is to evaluate the illuminance component and calculate the reflection component R from L.
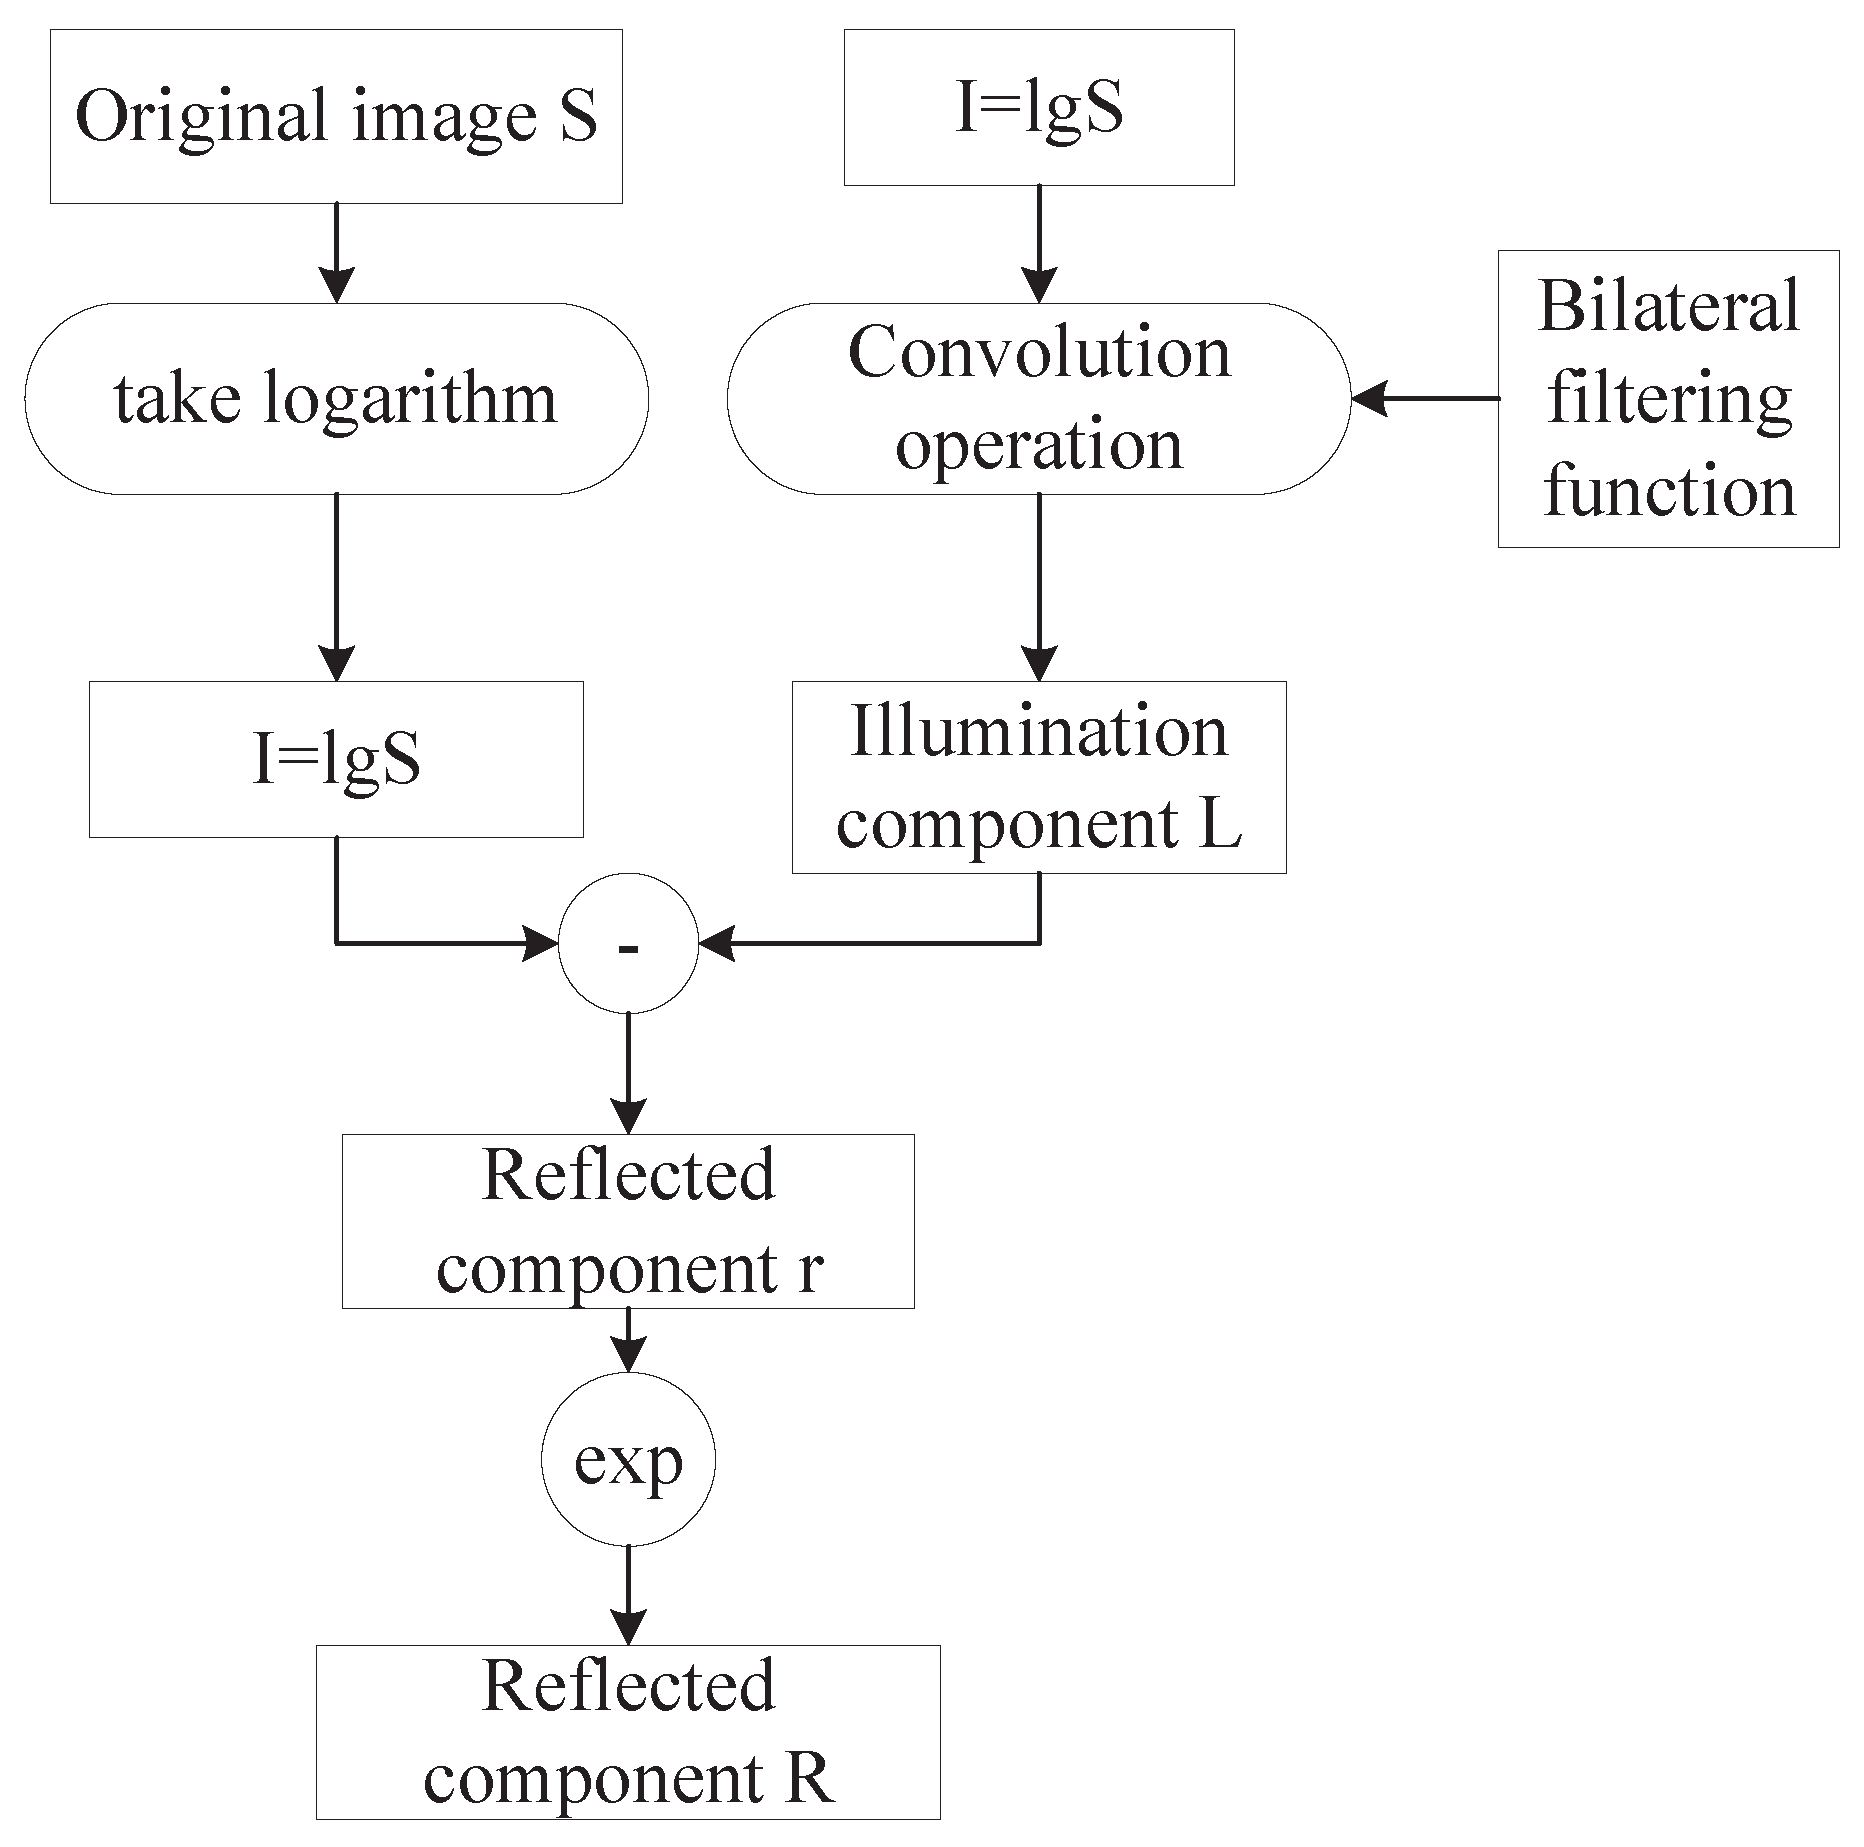
The single-scale Retinex algorithm (SSR) uses a logarithmic model when evaluating the reflectance component. The image is filtered using a centre surround function to approximate the illumination component, with the best centre surround function being a Gaussian kernel function [18].
The single-scale Retinex algorithm better maintains the image’s brightness, reducing the loss of image detail caused by noise while improving information capture in dark areas. If the image being processed contains a large number of similar grey scale areas, the halo’s edges will blur.
The multi-scale Retinex algorithm (MSR) adds multiple scales to the SSR, which is universally divided into three scales, with the scale features still represented by σ . Its calculation is shown in Equations (6)–(8):
L i ( x , y ) = S i ( x , y ) G i ( x , y )
G i ( x , y ) = 1 2 π σ i 2 e x 2 + y 2 2 σ i 2
R M S R ( x , y ) = i = 1 n ω i R S S R i = i = 1 n ω i [ log S i ( x , y ) log L i ( x , y ) ]
The value of i can be taken as 1, 2 or 3, with i = 1 for low scale, i = 2 for medium scale, and i = 3 for large scale; ω i is the weighting factor of the i-th scale when weighting is performed.
During the enhancement process of the MSR algorithm, the image may be distorted by the addition of noise, which distorts the colour of local details of the image and does not reveal the object’s true colour, making the overall visual effect worse.
To address this deficiency, the multi-scale Retinex algorithm with colour recovery factor (MSRCR) [19] adds a colour recovery factor C to MSR to adjust the defects of colour distortion due to enhanced contrast in local areas of the image. The MSRCR algorithm uses the colour recovery factor C to adjust the proportional relationship between the three colour channels in the original image, thus bringing out the information in relatively darker areas and eliminating the defects of colour distortion in the image.
To date, MSR and MSRCR algorithms have commonly been used to solve filter-dependent problems, and they can effectively improve image contrast without relying on many filters, but they also increase the number of halo artefacts in the image, which is a significant drawback.

3. Improvement of the Retinex Algorithm

3.1. Algorithm Principle Improvement

When processing images, because of the complex background environment, it is necessary to consider the uneven illumination, weak contrast, strong influence of dust and complex background, etc. Homomorphic filtering is used for this [14,20]. The algorithm enhances each RGB component of the underground coal mine monitoring image, converts the image from RGB space to HSV space, processes each of the three components, then converts the image back to RGB space. The overall flow chart of the algorithm is shown in Figure 2.
The BF-MSRCR algorithm, as well as the gamma correction and histogram equalisation and Laplace operator, is used to process the luminance V component while keeping the hue H constant, and the saturation S is corrected for adaptive non-linear stretching for the specific processing of the different components with the network structure shown in Figure 3.

3.2. Improvement of the Luminance Component V

3.2.1. Fusion Algorithm

The centre surround function used by the MSR algorithm and MSRCR algorithm is a Gaussian filter function [21] that considers that the spatial distance of pixels affects the points of the target pixel (the expression is shown in Equation (7)). The closer the points are to the central pixel, the stronger the connection; the further away the points are, the weaker the connection. σ is the scale function of the centre surround function and is equivalent to the standard deviation of the Gaussian function. σ remains constant throughout the Retinex image enhancement algorithm, and the value of σ strongly influences the final image enhancement. If the standard deviation σ is taken to be significant, the image contrast is poor, and if σ is taken to be minor, the image will show halos, leading to blurring and distortion, where σ is shown in Equation (7).
This paper proposes replacing Gaussian filtering with bilateral filtering to solve the above problem. The illuminance component of the luminance component V is enhanced using the multi-scale Retinex algorithm with the colour recovery factor based on bilateral filtering with gamma correction for the incident component [22], and the reflection component of the luminance component V is enhanced using the histogram equalisation function for contrast pull-up as well as the image enhancement using the Laplace operator.
The MSRCR algorithm is an excellent solution to the problem of the small dynamic range and rich colour of the MSR algorithm, and also has a considerable degree of recovery of image details. The related equations are shown in Equations (9)–(11):
R M S R C R i ( x , y ) = C i ( x , y ) R M S R i ( x , y )
C i ( x , y ) = β log a α I i ( x , y ) log a i = 1 N I i ( x , y )
R M S R ( x , y ) = n = 1 m λ n log a I ( x , y ) log a I ( x , y ) G n ( x , y )
The parameters are described below: R M S R ( x , y ) denotes the recovered image of the i-th channel after using this algorithm; C i ( x , y ) denotes the colour recovery factor of the i-th channel, which is used to adjust the scale of the three-channel colours; R M S R ( x , y ) denotes the recovered image after multi-scale filtering for the colours of the i-th channel; β is the gain constant; α is the controlled non-linear intensity, λ n denotes the weight coefficient under the n-th scale, and n and m are different scales, nm, that is, the range of values of the scale.
The bilateral filter function [23] was used as the central surround function instead of the Gaussian kernel function. The advantage of the bilateral filter function compared to the Gaussian kernel function is that the edge information is preserved and kept intact, and the distortion in the image enhancement process can be removed with better effect. The formula used for calculating the bilateral filter weight coefficients is shown in Equation (12):
G ( x , y ) = exp ( x x c ) 2 + ( y y c ) 2 2 σ s 2 × exp ( f ( x , y ) f ( x c , y c ) ) 2 2 σ r 2
where ( x c , y c ) is the centroid position of the image; f ( x c , y c ) is the grey value of the pixel at the centroid of the image; σ s is the standard deviation of the null Gaussian function, and σ r is the standard deviation of the value Gaussian function.
The formula for the Retinex algorithm based on bilateral filtering is shown in Equations (13) and (14):
r ( x , y ) = log 2 R ( x , y ) = log 2 S ( x , y ) log 2 L ( x , y )
r ( x , y ) = i = 0 K ω i log 2 S ( x , y ) log 2 G i ( x , y ) S ( x , y )
where K denotes the number of weights, the weight of the i-th scale; and G i ( x , y ) denotes the centre surround function and the inverse logarithmic transformation of Equation (14). An inverse logarithmic transformation was performed to obtain the reflection image R ( x , y ) .
The specific algorithm is shown in Figure 4.

3.2.2. Gamma Correction

To further enhance the detailed information of the image, gamma correction was chosen for the incident component. Gamma correction is mainly a non-linear processing technique, and the parameter γ determines the effect on the image. When γ = 1, the image signal remains unchanged; when γ < 1, the original image signal is amplified, and the overall brightness of the image is enhanced; and when γ > 1, the original image signal is reduced, the overall brightness of the image is reduced, and the gamma curve is shown in Figure 5.

3.2.3. Detail Enhancement

After the Retinex transform is applied to the underground mine image, there may still be some halo artefacts in the image, and some areas are overexposed, resulting in loss of image detail; therefore, subsequent detail enhancement of the image is required to help achieve effective image enhancement.
The reflective component of the image contains the high-frequency details of the image, also known as the detail layer of the image, and can be seen as the difference between the output and input image. Adding detail enhancement can be an excellent way to improve the halo phenomenon in the image while adding more detail to the resulting image.
A modified Retinex algorithm was used to process the luminance component V and gamma-correct the incident component, followed by a histogram equalisation correction for its reflected component [24]. The histogram equalisation function increases the global contrast of the image when contrast stretching is applied to the reflectance image, especially when the user data in the image are of similar contrast. The method allows for a better distribution of luminance across the histogram and an increase in local contrast.
The Laplace operator was used for image detail enhancement [25]. The Laplace enhancement operator can preserve the greyscale differences between pixels while preserving the background of the image, enhance the contrast at abrupt greyscale changes and highlight the edge detail information contained in the image. Therefore, the Laplace enhancement operator was used to enhance the edge details in the image. The Laplace enhancement operator is the most straightforward isotropic differential operator with rotational invariance. Its enhancement principle is shown in Equation (15):
g ( x , y ) = f ( x , y ) + c [ 2 f ( x , y ) ]
where g ( x , y ) is the output image, f ( x , y ) is the original image, and c is the transform enhancement factor.
The continuous Laplace operator cannot be used directly for image enhancement and requires a template for implementation. The principle of image edge enhancement is to convolve the Laplace enhancement operator template with the original luminance image. The result of the convolution operation is the edge image obtained by subtracting the result of the convolution operation from the original luminance image. There are various Laplacian templates, with the most common being the 4-neighbourhood Laplacian template [26] and the 8-neighbourhood Laplacian template [27]. The essential requirement is that the coefficients of the central pixel are positive, while the coefficients of the pixels surrounding the central pixel are harmful, and all coefficients sum to zero.
A schematic diagram of the structure for processing the luminance component V is shown in Figure 6.

3.3. Improvement in the Saturation Component S

After the image’s brightness is enhanced, the image’s saturation will be low; therefore, to make the image more saturated in colour, the saturation component S of the image needs to be stretched. Due to the significant variation in the image under the mine, the degree of processing for the saturation is different, and an adaptive non-linear stretching algorithm is used for the saturation component, calculated as shown in Equation (16)
S o u t = 1 + x y + z + 1 S i n x = m e a n ( R , G , B ) y = m a x ( R , G , B ) z = m i n ( R , G , B )
where S o u t represents the output image, S i n represents the input image, x is the mean value of RGB, y is the maximum value, and z is the minimum value.
In summary, the BF-MSRCR algorithm consists mainly of the enhancement of the luminance component V and the adaptive stretching of the saturation component S so that the details of the image are preserved more fully during the enhancement process, without blurring the edges and without problems such as overexposure and haloing.

4. Experimental Verification

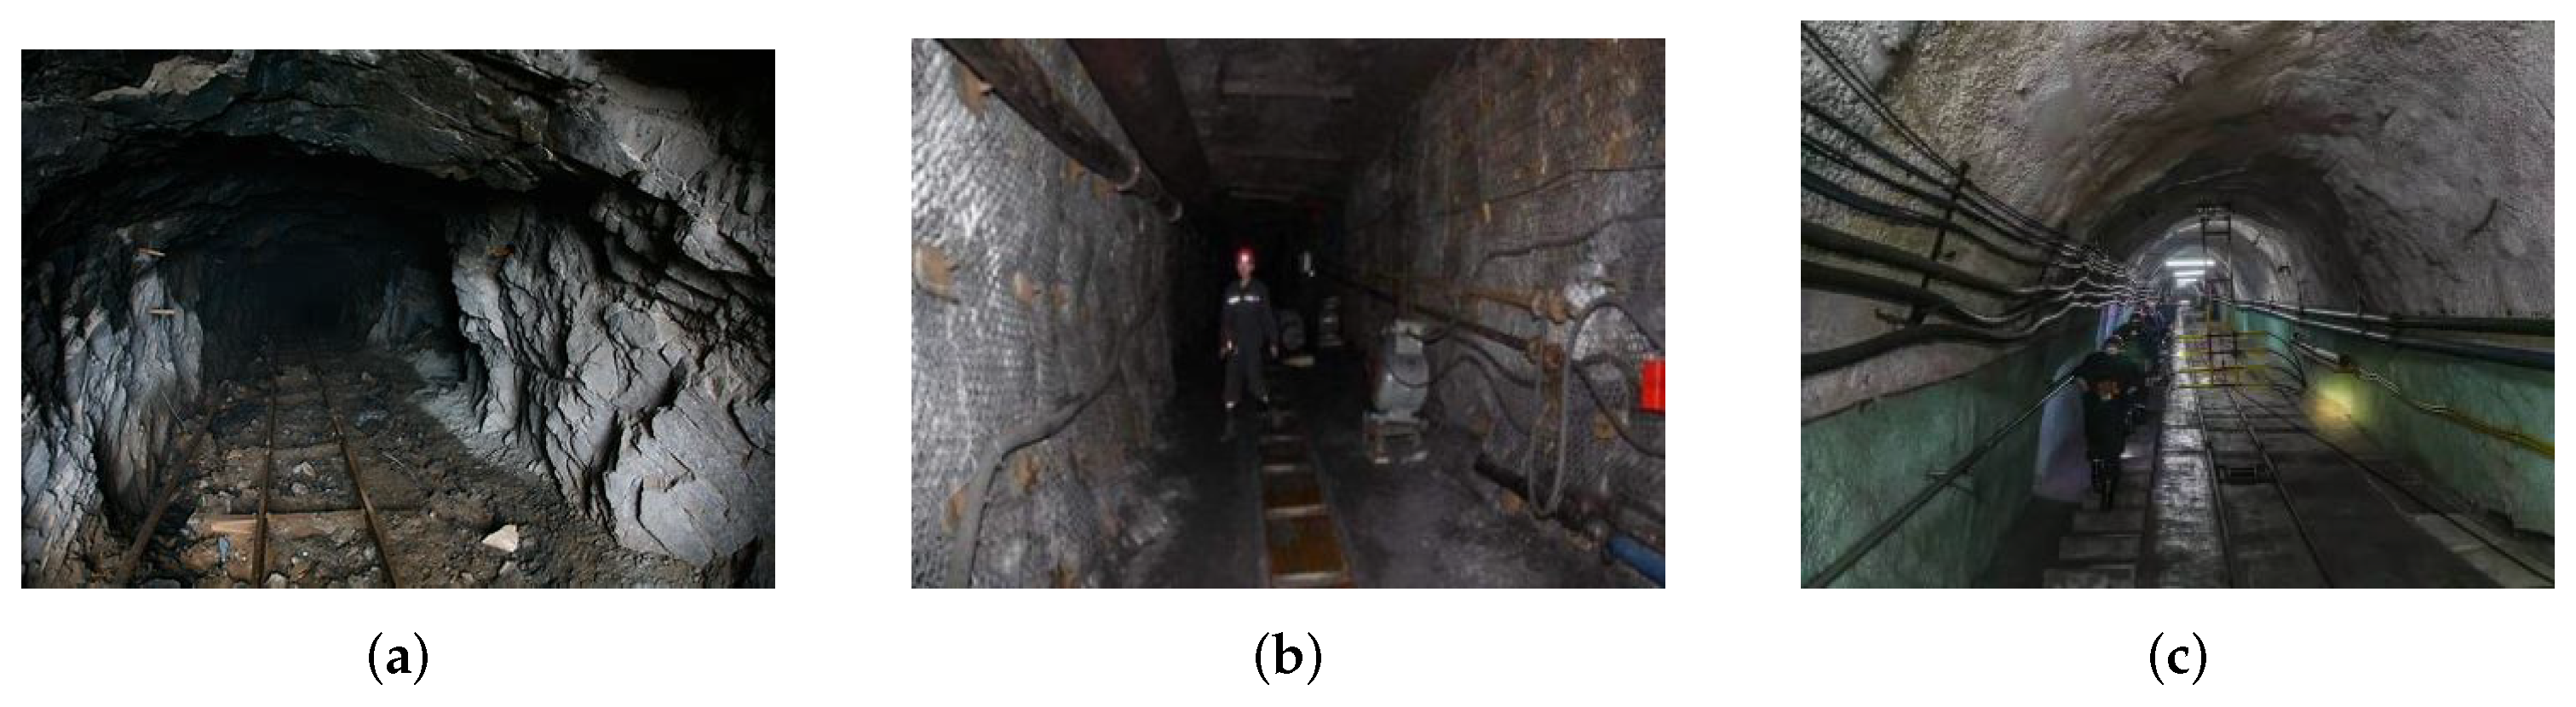
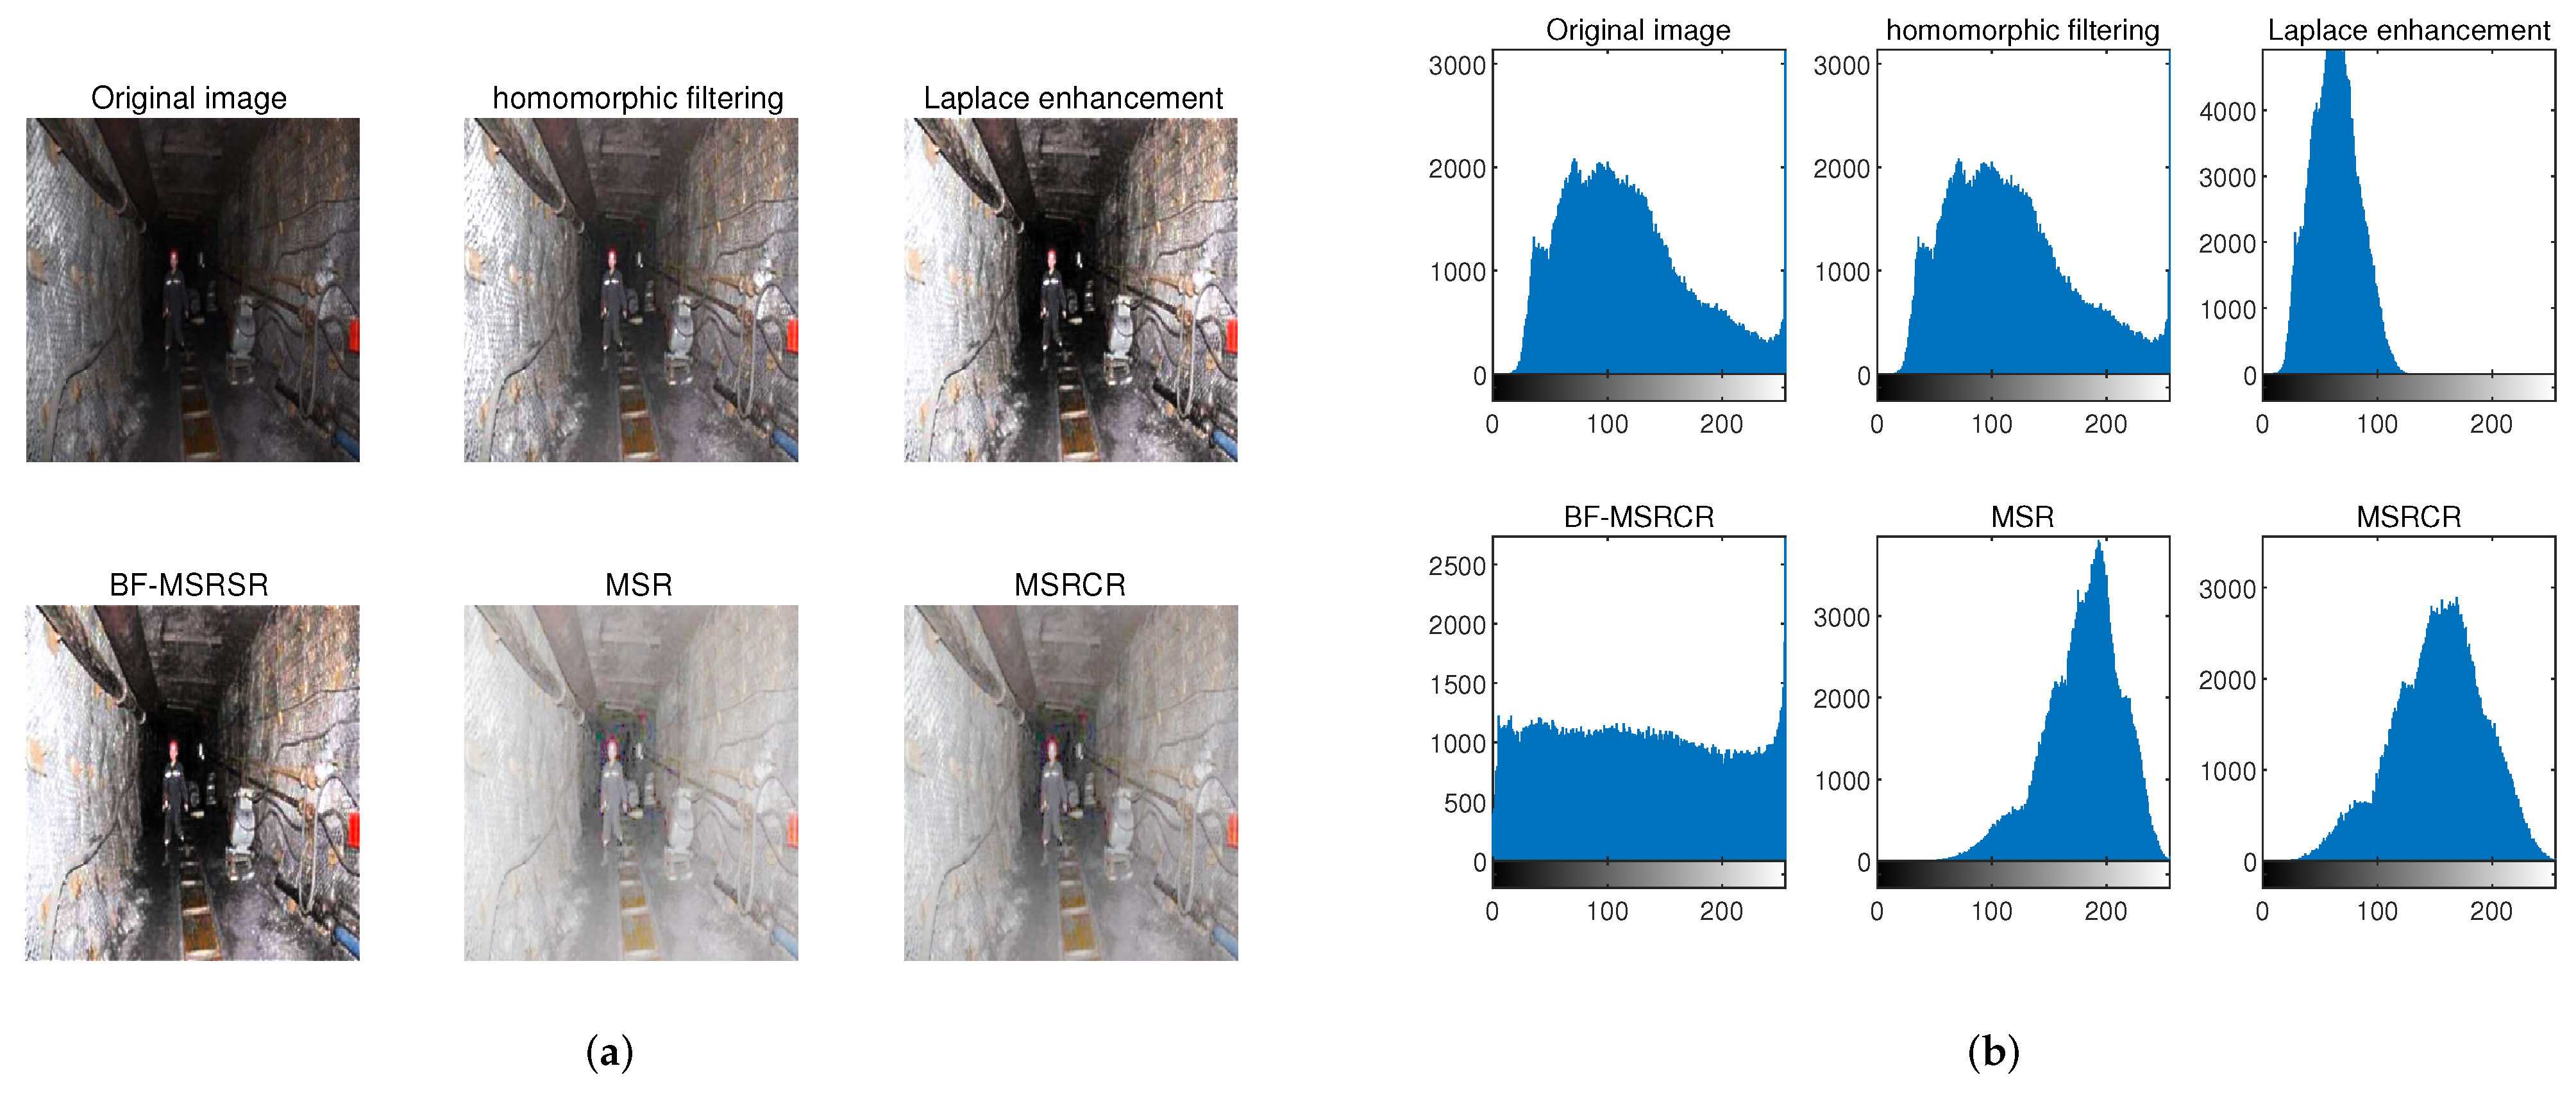
In order to verify the effectiveness of the improved Retinex algorithm (BF-MSRCR) for underground coal mine surveillance image enhancement, simulation experiments were carried out using Matlab programming for the same data set in the AMD R7, 16 G hardware environment, Windows 11 operating system. The images used in this paper are partly from publicly available underground coal mine images on the internet and partly from a real underground coal mine surveillance video. We extracted the video in frames, generated hundreds of coal mine surveillance images, and enhanced some of them. We selected a coal mine underground video and some underground images for training when testing the algorithm, and tested about 600 images in total.The specific images of the experiments are shown in Figure 7, using the MSR algorithm and MSRCR algorithm for comparison experiments.
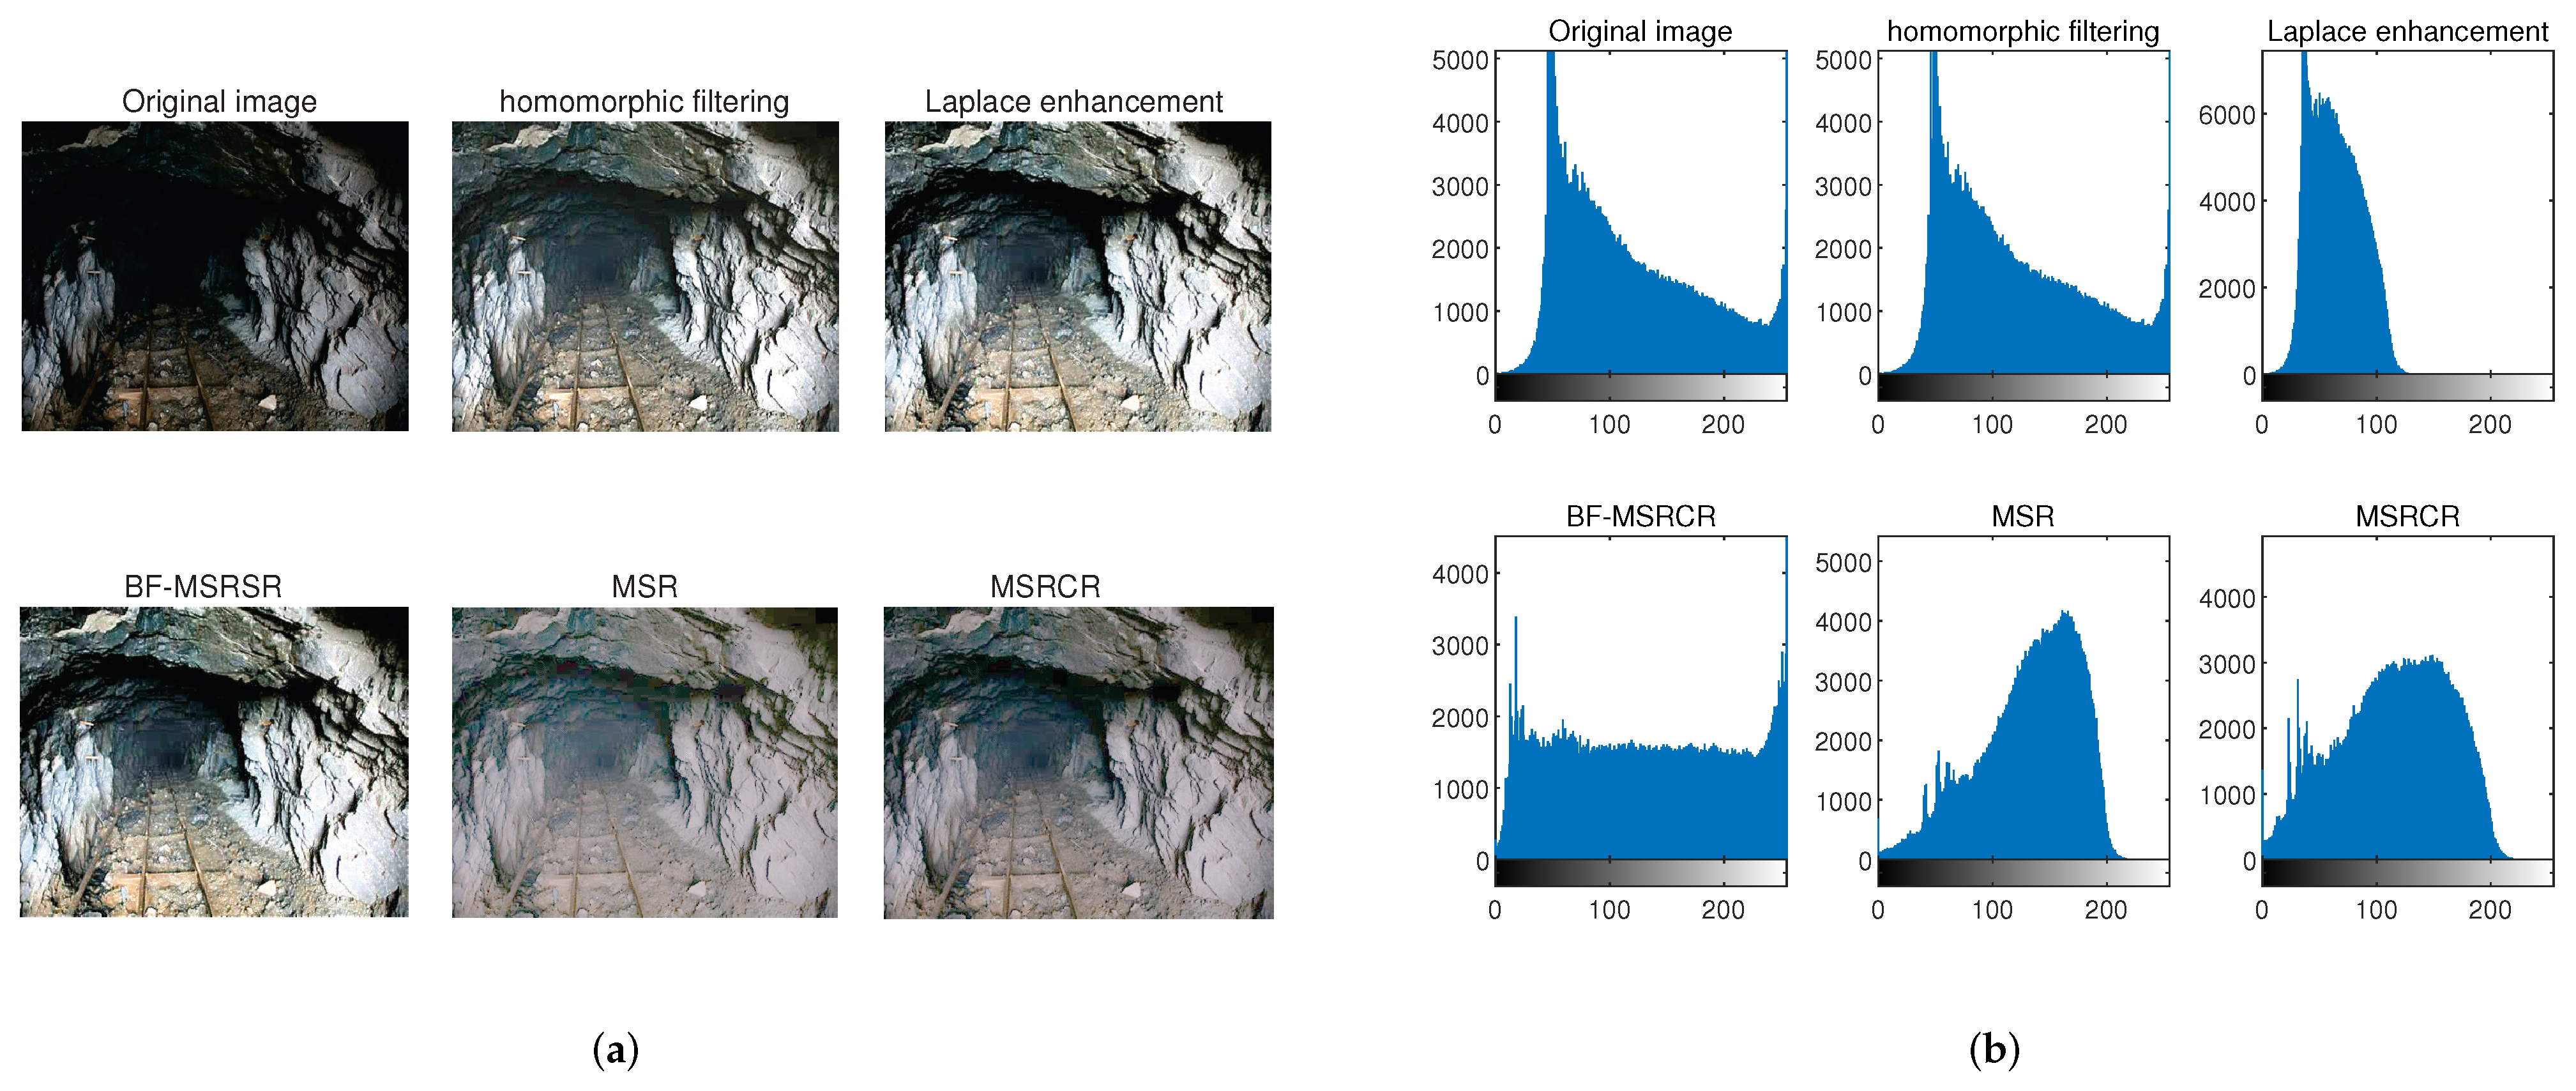
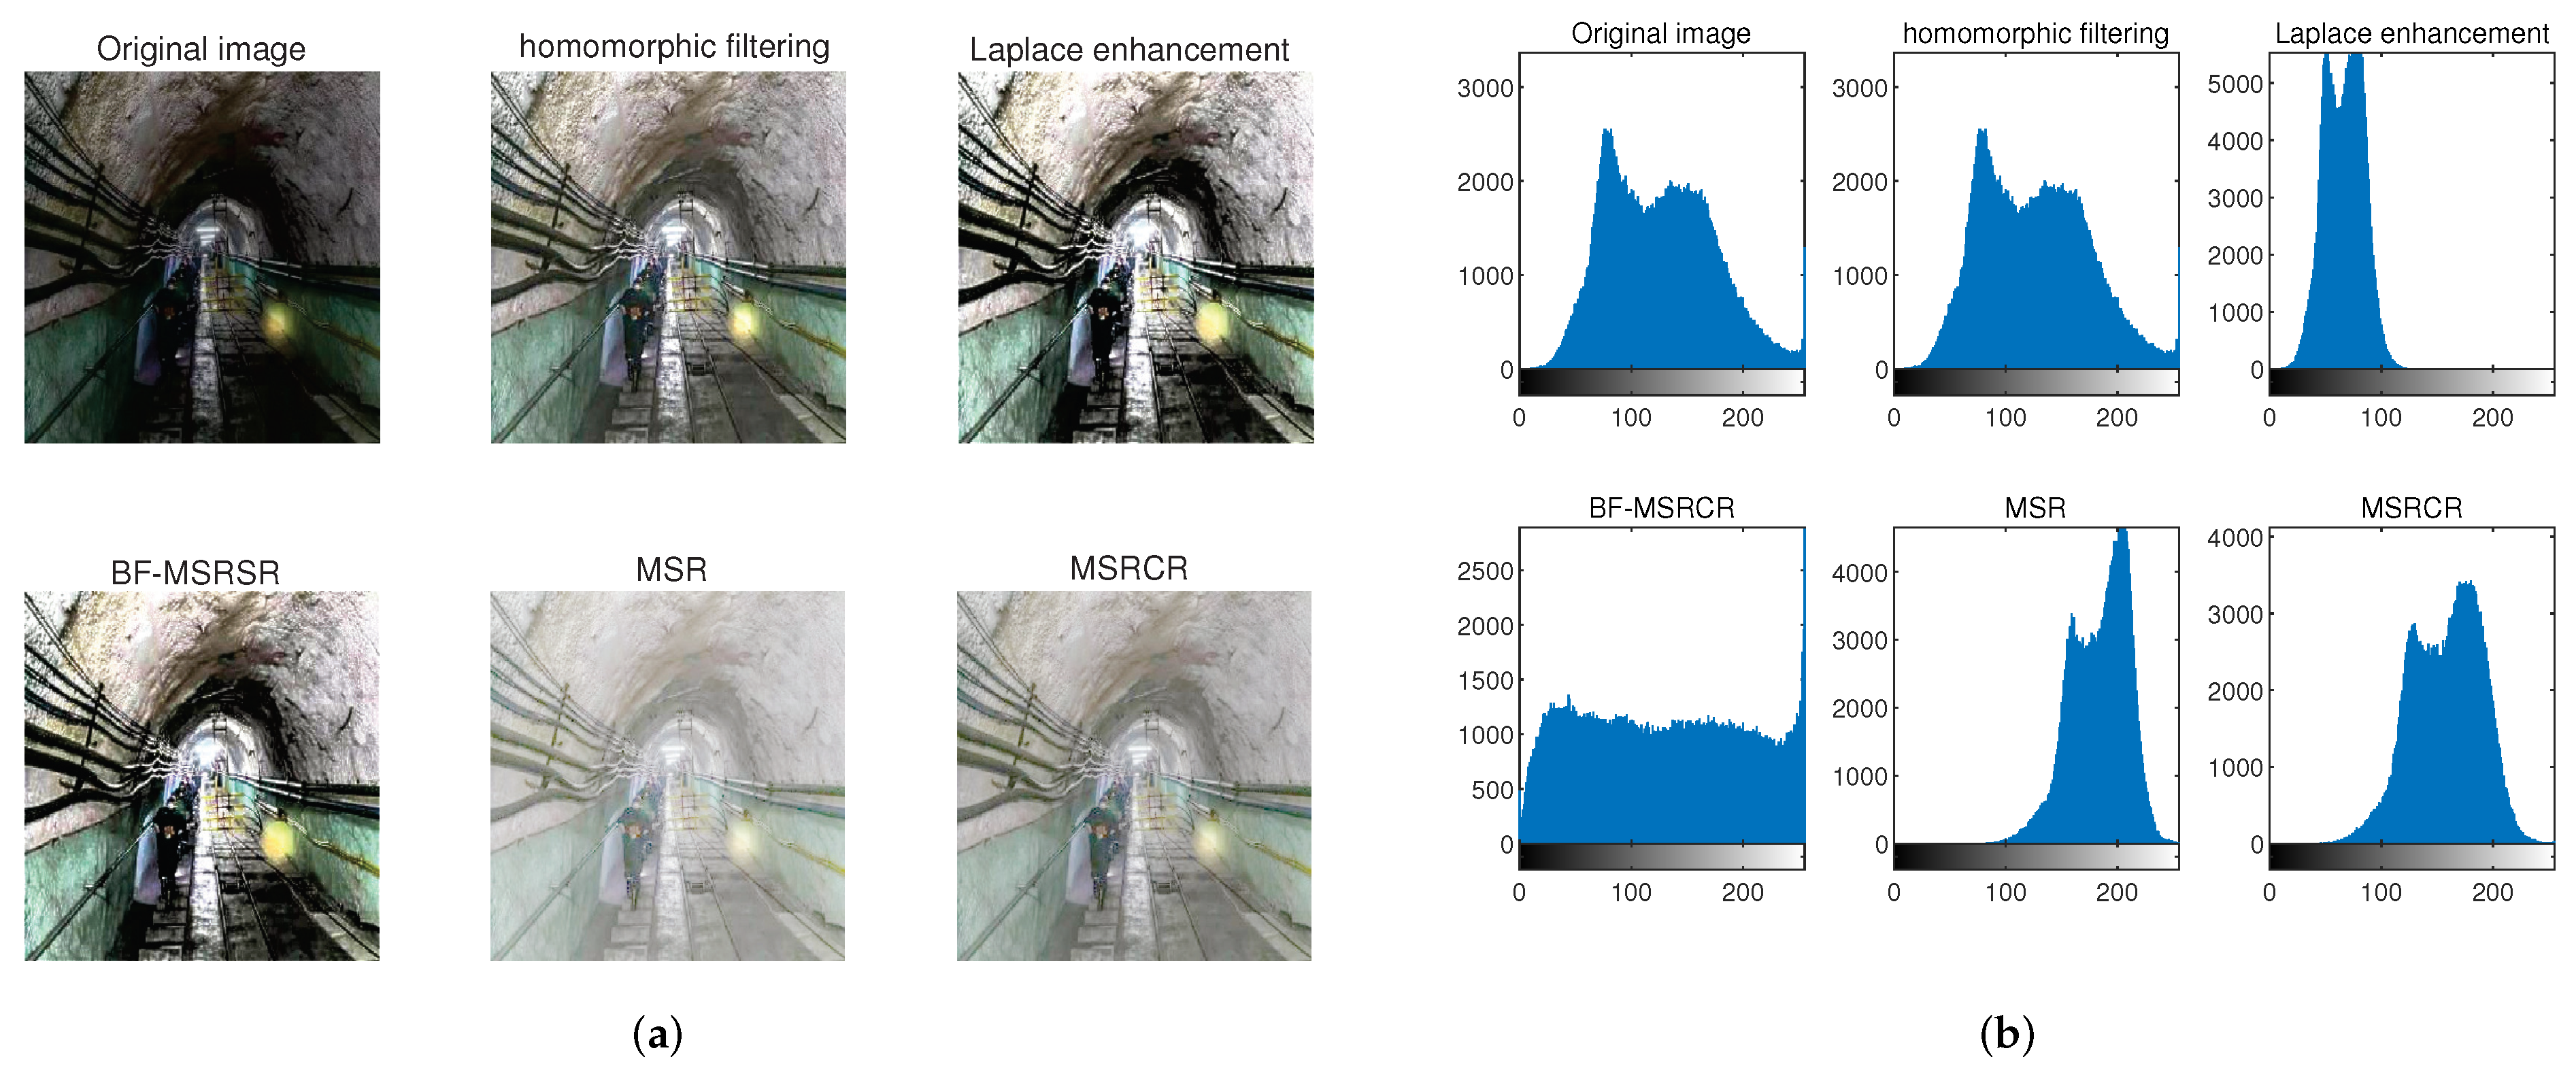
To make the image contrast enhancement effect more intuitive to represent, the method of grey level distribution is used in the verification, using the grey level histogram to verify that when the image contrast is high, its grey level distribution has a uniform and wide distribution.
The validation process uses the MSR algorithm, MSRCR algorithm and BF-MSRCR algorithm for comparison and validation of the image enhancement effect based on the generated greyscale histogram, and the validation results are shown in Figure 8, Figure 9 and Figure 10.
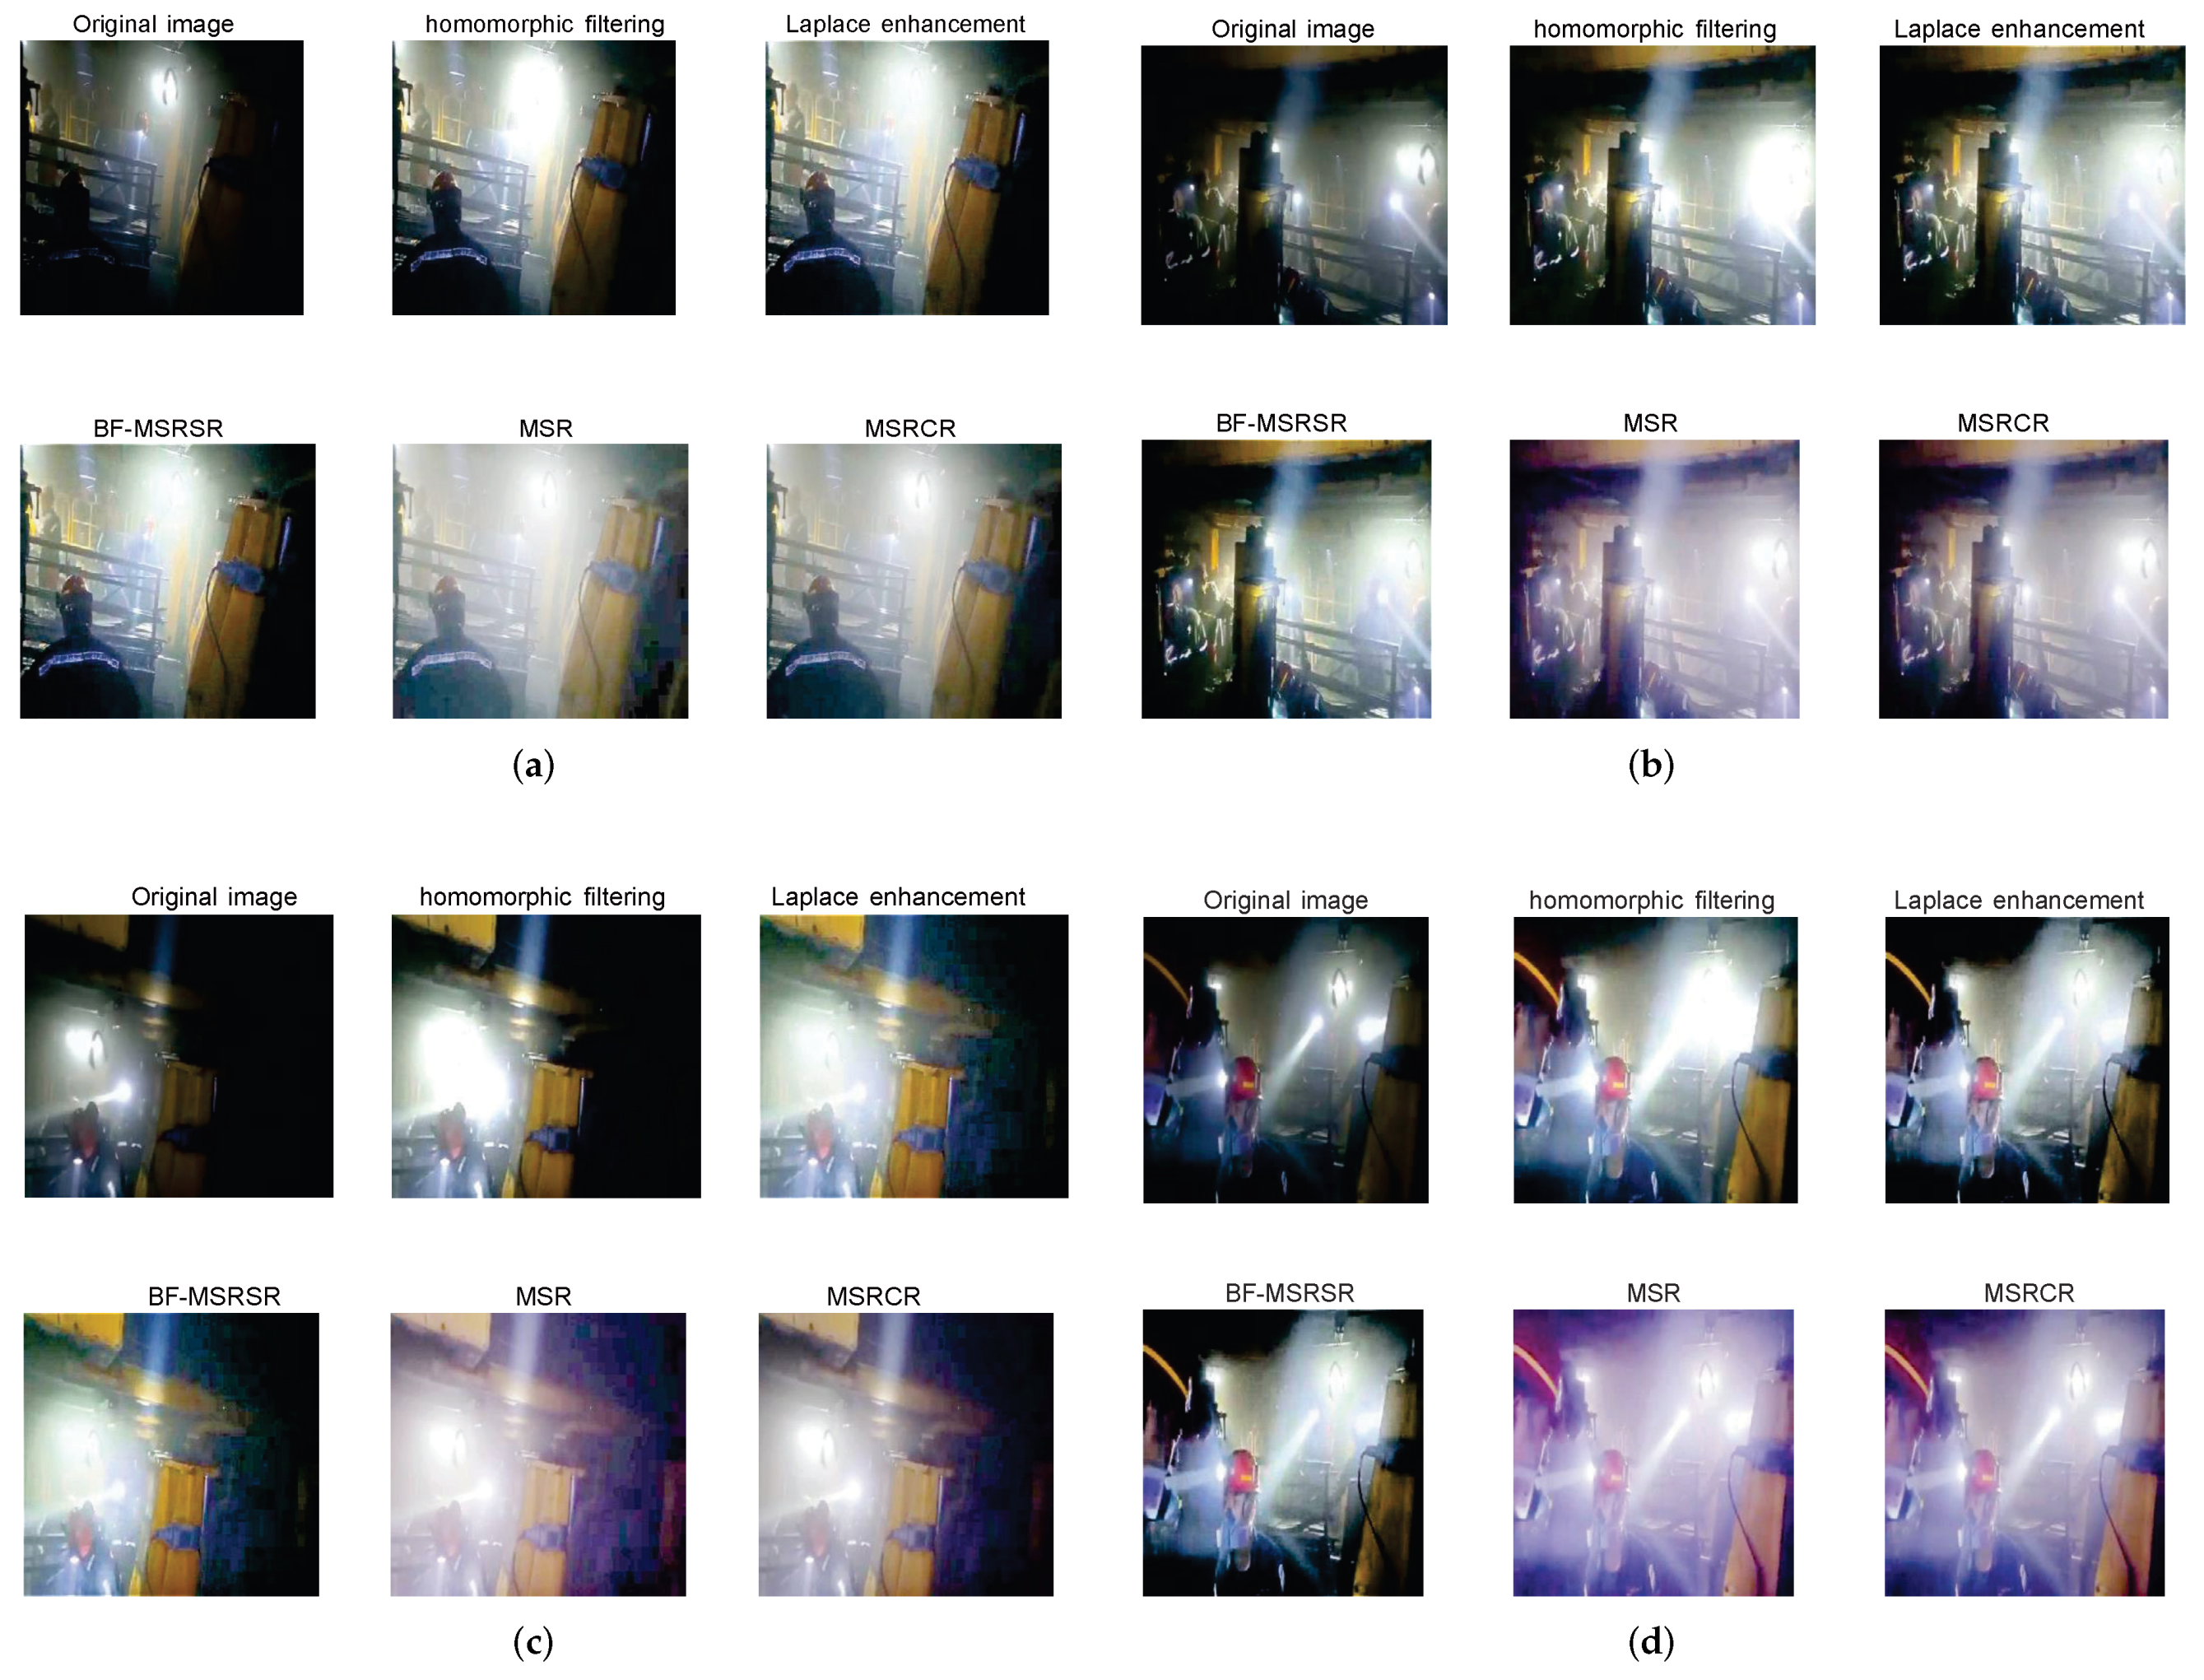
To show more experimental results, we selected some more frame-separated intercepted images from the coal mine video for enhancement to verify the effectiveness of the algorithm. The experimental results are shown in Figure 11.
According to the visual verification of the greyscale histogram, the MSR algorithm enhances the image, the blurred edges and significant light points are more apparent, and the MSRCR algorithm shows some improvement. However, the colour distortion of the image is still more severe, and the histogram distribution of the above two algorithms is more concentrated. However, the BF-MSRCR algorithm proposed in this paper has a specific improvement in the image’s edge sharpness and colour saturation, and the grey level distribution is wide and uniform. Therefore, the algorithm in this study has better contrast enhancement than the MSR algorithm and the MSRCR algorithm.
A series of existing image quality evaluation criteria were subsequently chosen to measure the image enhancement effect of different algorithms. There are three general types of objective evaluation of image quality: the complete reference, partial reference and no reference. In this study, the peak signal-to-noise ratio (PSNR) [28], structural similarity (SSIM) [29], standard deviation, mean gradient, mean value, and colour image information entropy [30,31] were used to measure the quality of the image, thus providing a more intuitive perception of the enhancement effect of the algorithm.
PSNR is used to measure the pixel quality of an image, and the larger the value, the better the quality of the image, as represented by the calculation formula shown in Equation (17):
P S N R = 10 log M × N × 255 2 i = 1 M j = 1 N [ W ( i , j ) W ( i , j ) ] 2
where M × N denotes the image size, and W ( i , j ) and W ( i , j ) denote the greyscale values of the image before and after enhancement.
SSIM was used to measure the similarity of an image, and its value is in the range of 0–1. The higher the value, the lower the distortion; standard deviation is used to measure the contrast of an image. The higher the value, the higher the contrast; the mean gradient is used to measure an image’s sharpness and texture variation. The higher the value, the more precise the image; the mean value is used to measure the brightness of an image. The higher the value, the higher the brightness, and the information entropy of an image contains the amount of information contained in the entropy of an image. The higher the entropy value, the more informative the image. It is calculated as shown in Equation (18):
S S I M ( x , y ) = ( 2 μ x μ y + c 1 ) ( 2 σ x y + c 2 ) ( μ x 2 + μ y 2 + c 1 ) ( σ x 2 + σ y 2 + c 2 )
where x and y are images of the same size, μ x is the mean of x, σ x is the variance of x, σ x y is the covariance of x and y, and c 1 and c 2 are constants.
Each calculation takes an N × N window from the image, and then keeps sliding the window for calculation, and finally takes the average value as the global SSIM.
The validation process used the MSR algorithm, the MSRCR algorithm and the BF-MSRCR algorithm for comparative validation. It measures the effectiveness of the enhanced images according to the evaluation criteria mentioned above, and the validation results are shown in the following Table 1 and Table 2 (using downhole image 2 as an example).
As can be seen in Table 1, the BF-MSRCR algorithm improves the peak signal-to-noise ratio, structural similarity and image information entropy by 8.28, 0.15 and 2.04, respectively, compared to the MSR algorithm; by 3.97, 0.02 and 1.33, respectively, compared to the MSRCR algorithm; by 6.45, 0.06, 0.93, respectively, compared to the homomorphic filtering algorithm; and by 4.92, 0.1, 1.65, respectively, compared to the Laplace enhancement algorithm.
As can be seen in Table 2, the BF-MSRCR algorithm improved the standard deviation, mean gradient and mean value by 40.39, 7.38 and 52.92, respectively, compared to the MSR algorithm; by 34.33, 6.46 and 26.21, respectively, compared to the MSRCR algorithm; by 24.76, 4.72 and 42.34, respectively, compared to the homomorphic filtering algorithm; and by 22.18, 7.0 and 33.56, respectively, compared to the Laplace enhancement algorithm.
All evaluation criteria of the enhanced images improved, indicating that the quality of the images enhanced by the BF-MSRCR algorithm was optimised in all aspects.
Through objective verification of the indicators in Table 1 and Table 2, the image quality, brightness and contrast are shown to be enhanced by the BF-MSRCR algorithm are significantly improved. The amount of information in the image also increased, while the anti-distortion performance of the image improved in the presence of disturbing factors, such as low contrast, low brightness, uneven light distribution and high dust influence in the underground mine image.

5. Conclusions

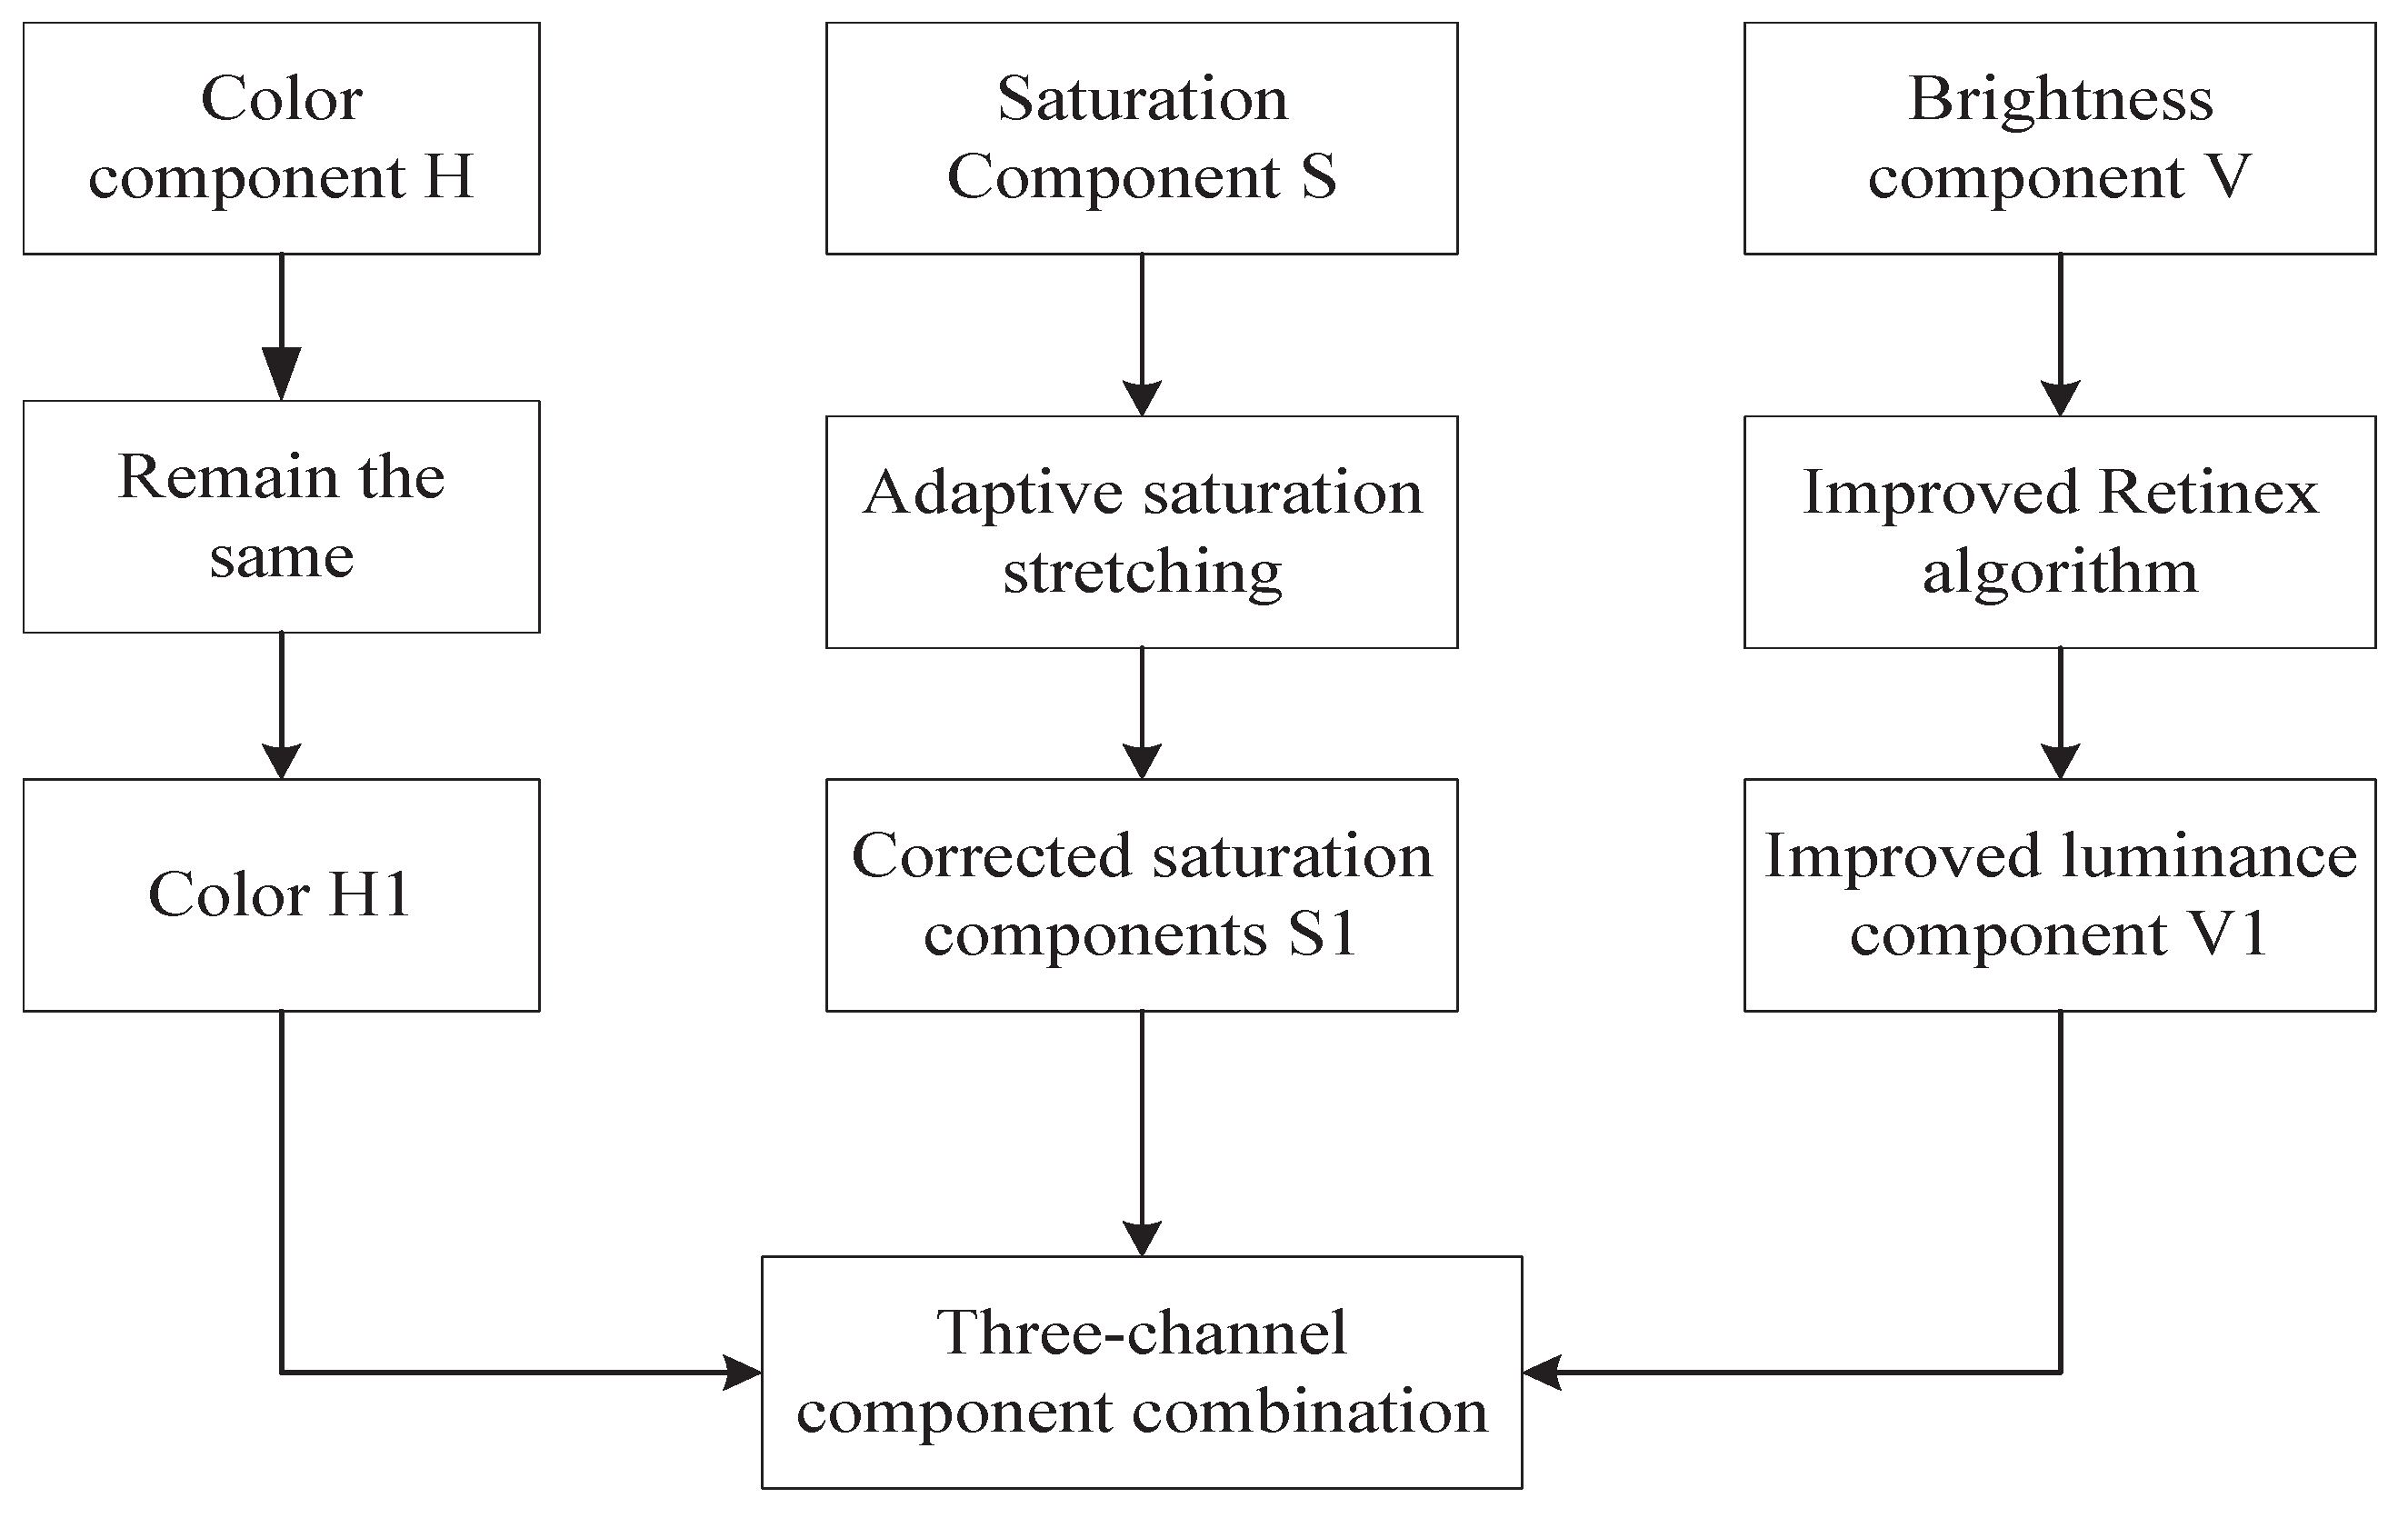
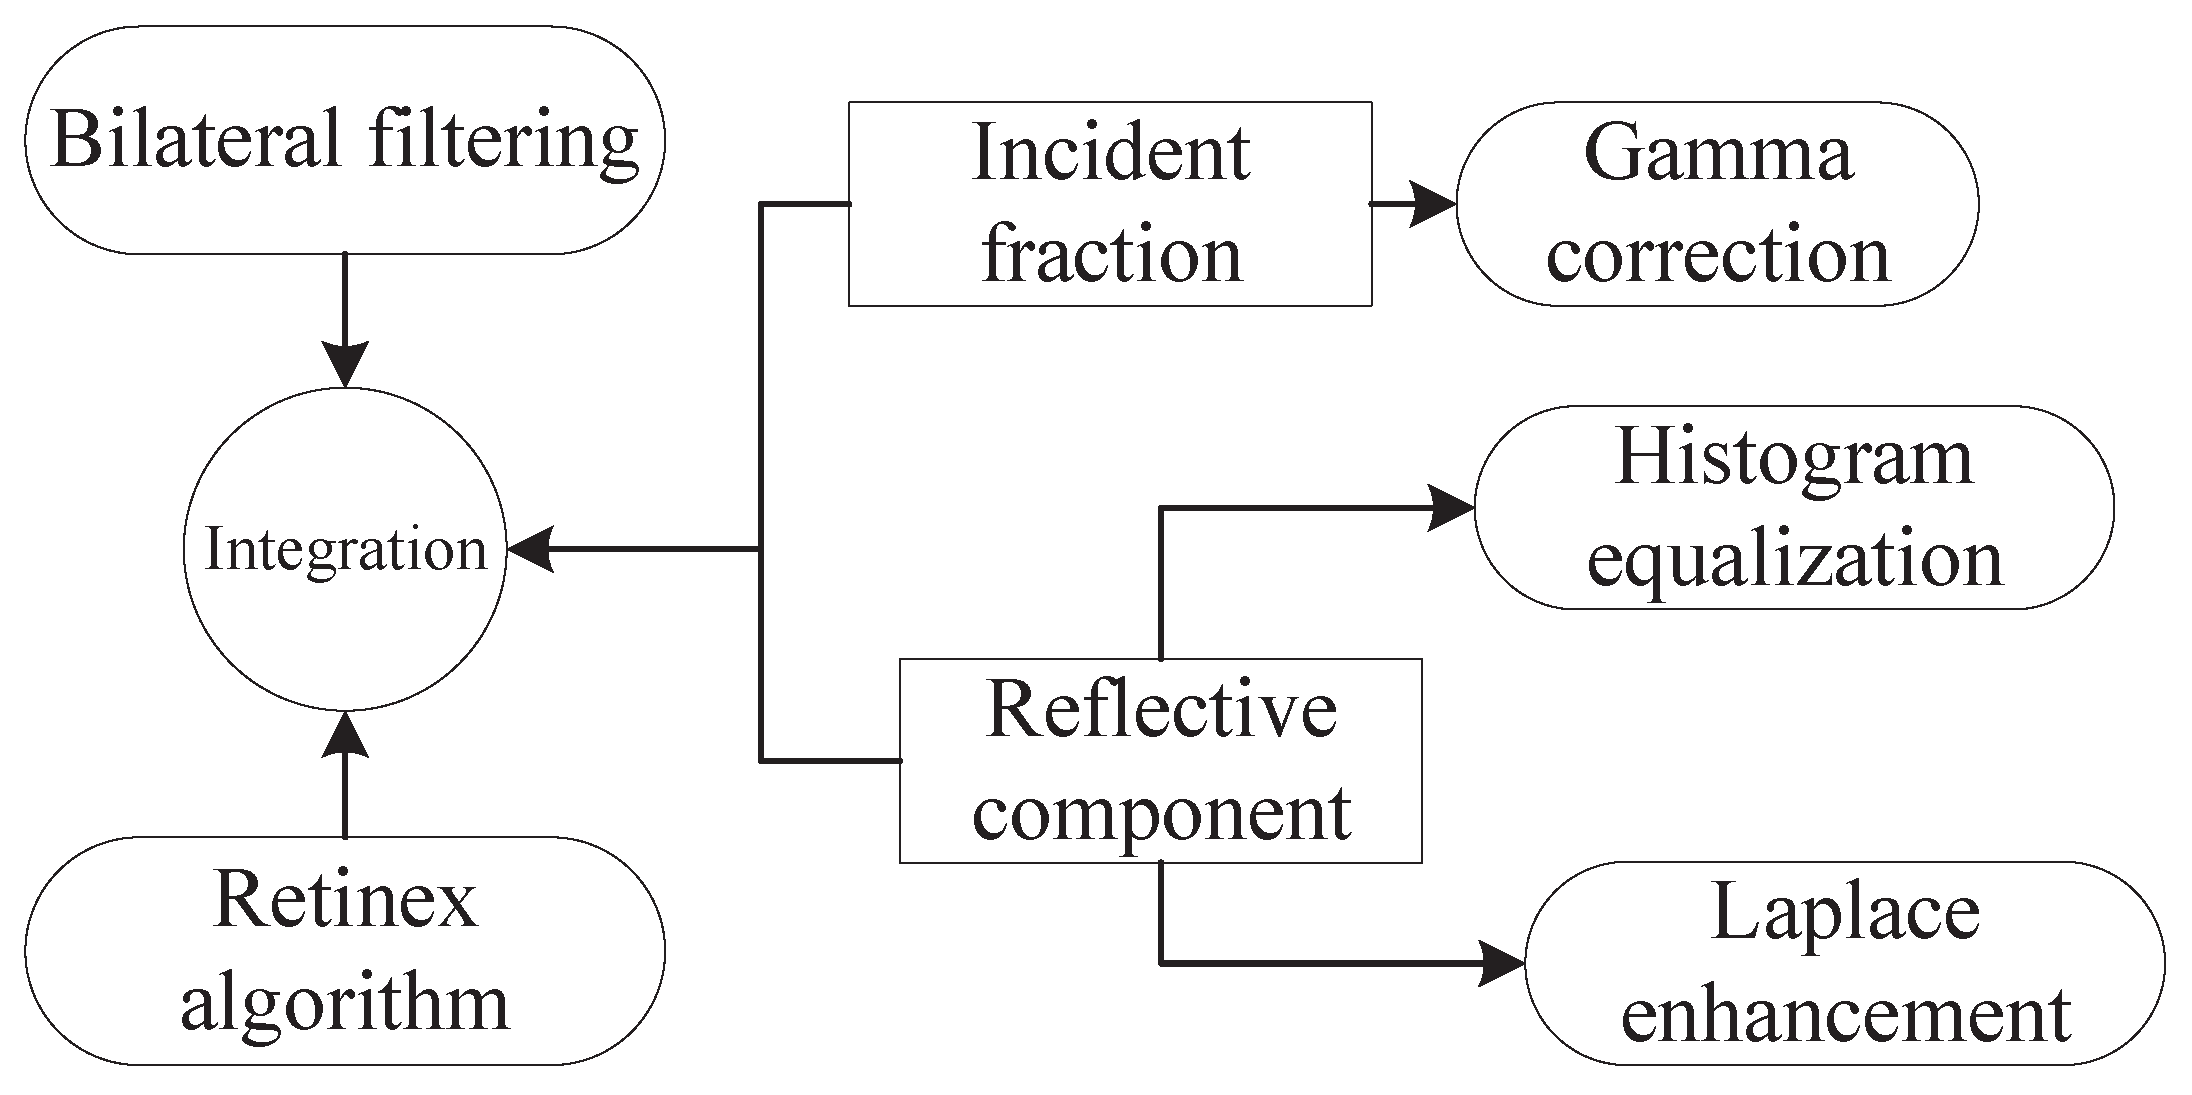
In the presence of multiple disturbing factors in underground coal mines and facing the problem of a complex environment, an improved algorithm is proposed to transform different components by combining a bilateral filtering algorithm based on HSV space with a multiscale Retinex algorithm with colour recovery factors after homomorphic filtering, and the conclusions are shown below.
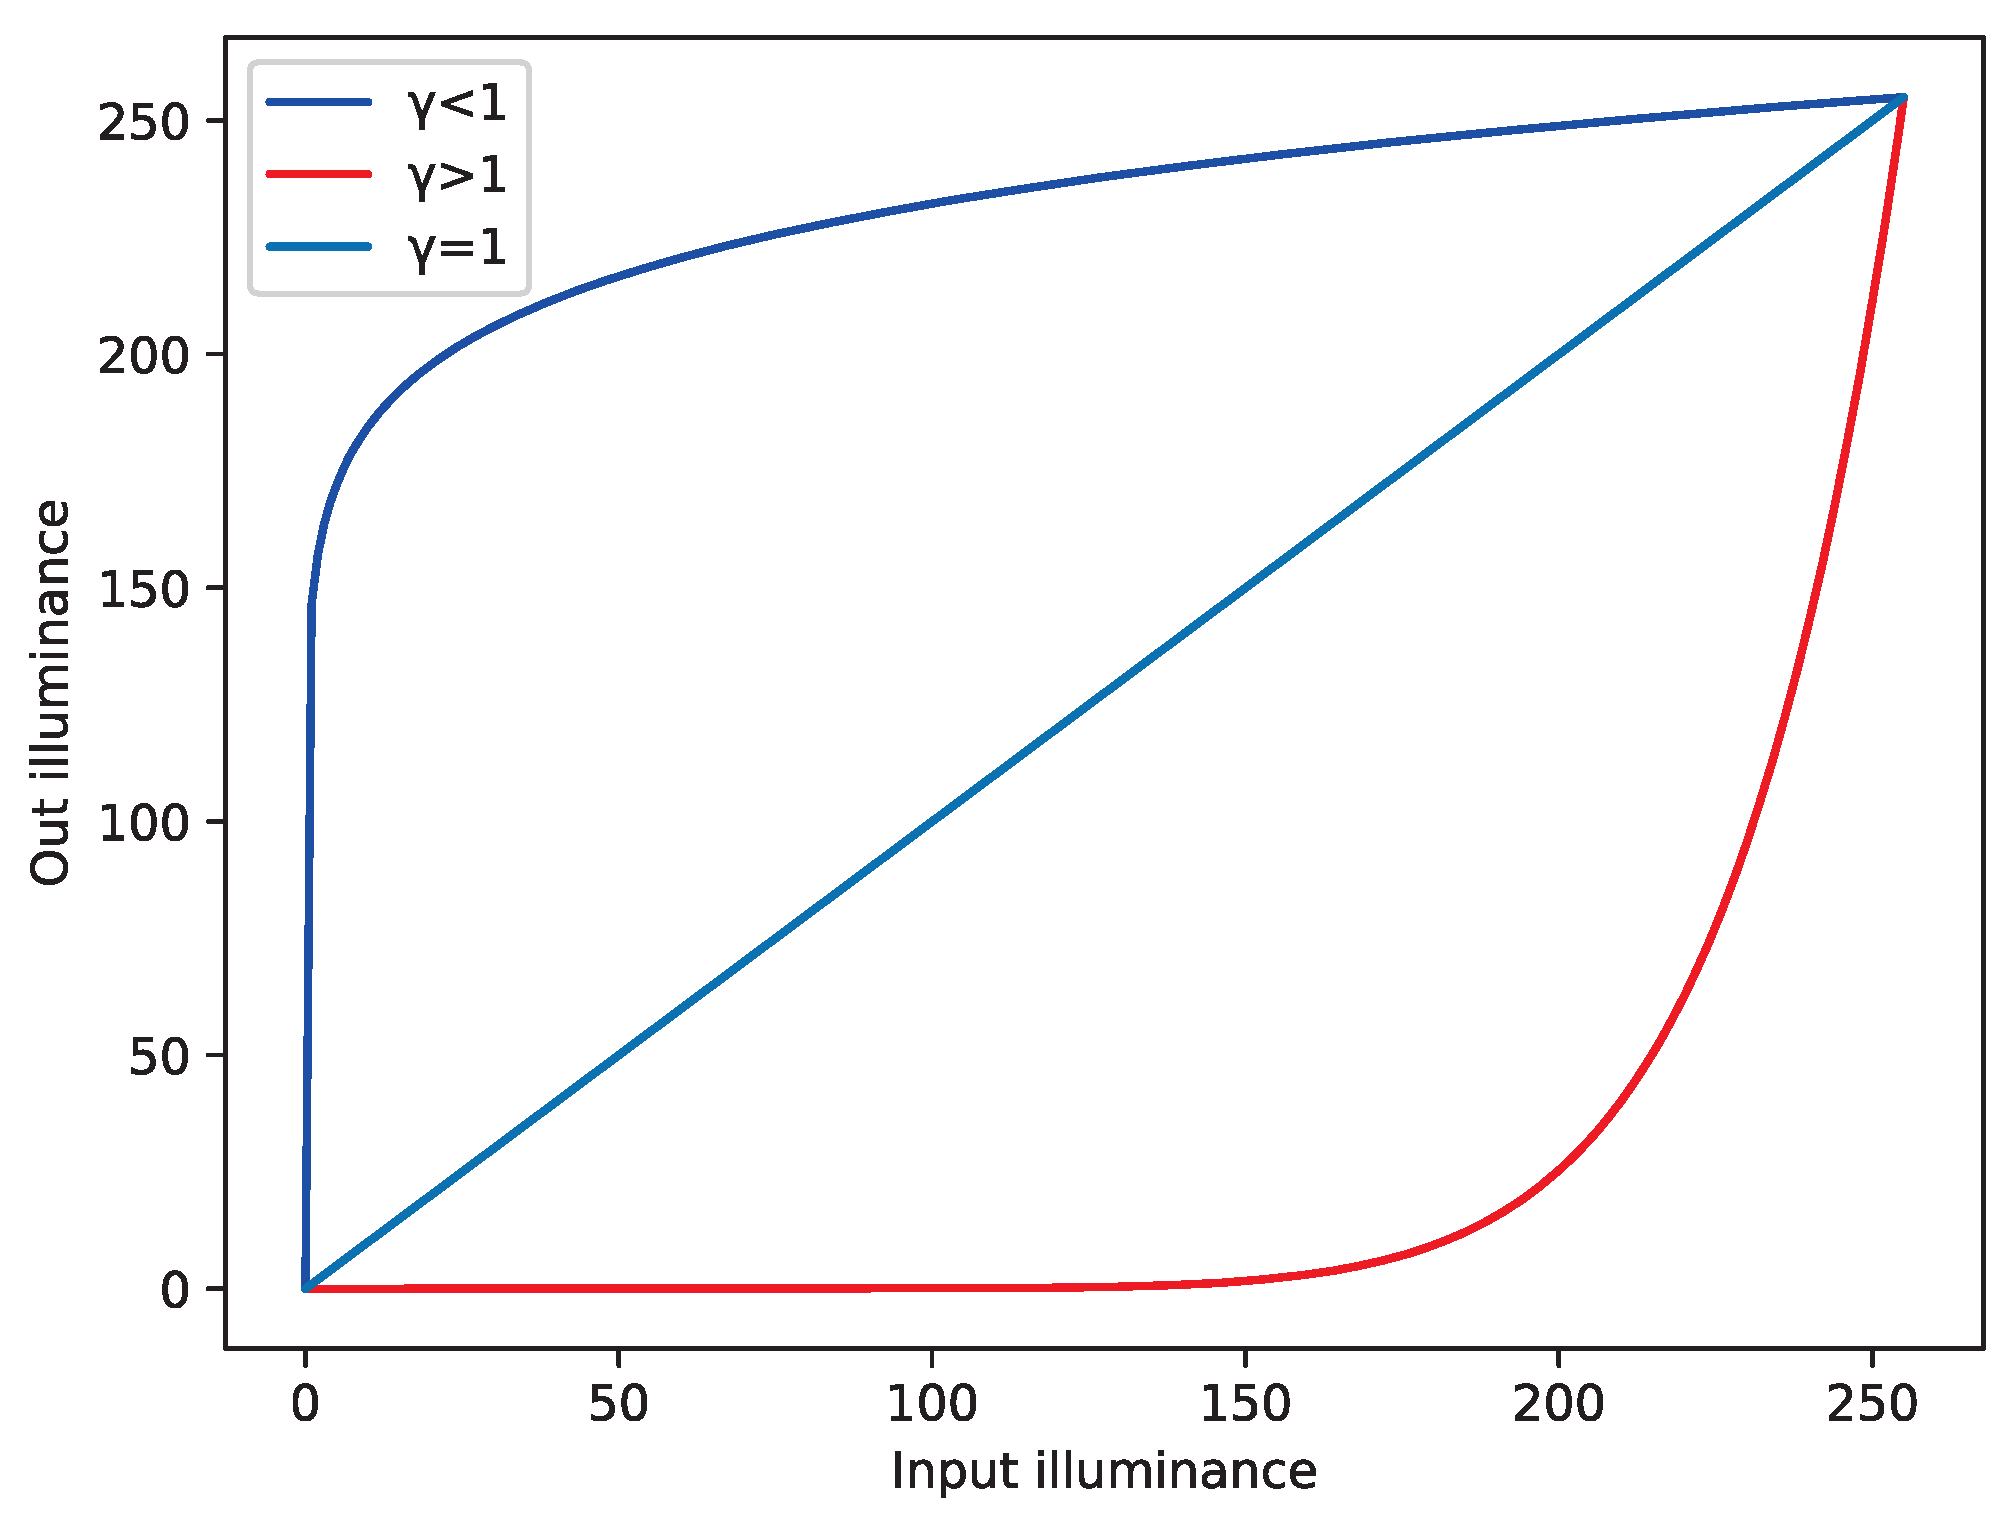
(1) The method uses homomorphic filtering to enhance each RGB component of the image, converts the image from RGB space to HSV space, keeps the hue H component unchanged, uses an algorithm of bilateral filtering and multi-scale Retinex fusion to enhance the luminance V component, gamma corrects its incident component, and performs histogram equalisation correction and Laplace operator enhancement for the reflection component. An adaptive nonlinear stretching process is performed for the saturation S.
(2) As verified by MATLAB simulation, the improved algorithm (BF-MSRCR) can effectively remove various noises in the image, significantly improve the brightness and contrast of the image. In addition, it does not cause a lot of haloes and edge distortion in the image, and the colour retention of the image is also more complete and high-definition.
This algorithm dramatically improved the enhancement of underground coal mine surveillance video images, supporting subsequent mine facility detection, personnel detection, and safety production. However, the algorithm used in this study is still a universal image enhancement method. In subsequent research work, we can consider using deep learning algorithms to train the surveillance graphics of underground mines and build a more adaptable image enhancement model for underground mines.

Author Contributions

Conceptualisation, F.T.; methodology, T.C.; software, T.C.; validation, F.T., T.C. and J.Z.; investigation, F.T.; data curation, T.C.; writing—original draft preparation, T.C.; writing—review and editing, F.T. and J.Z.; Supervision, F.T. All authors have read and agreed to the published version of the manuscript.

Funding

This work was financially supported by the Project of Science and Technology of Shaanxi (No. 2020GY-029).

Data Availability Statement

No new data is created in this paper.

Conflicts of Interest

The authors declare no conflict of interest.

Abbreviations

The following abbreviations are used in this manuscript:
MSRMulti-Scale Retinex
MSRCRMulti-Scale Retinex with Colour Restoration
PSNRPeak Signal-to-Noise Ratio
SSIMStructural Similarity

References

  1. Kim, D. Retinex-based Logarithm Transformation Method for Color Image Enhancement. J. Korea Acad.-Ind. Coop. Soc. 2018, 19, 9–16. [Google Scholar]
  2. Yao, L.; Lin, Y.; Muhammad, S. An Improved Multi-Scale Image Enhancement Method Based on Retinex Theory. J. Med. Imaging Health Inform. 2018, 8, 122–126. [Google Scholar] [CrossRef]
  3. Fu, X.Y.; Zeng, D.L.; Huang, Y.; Liao, Y.H.; Ding, X.H.; Paisley, J. A fusion-based enhancing method for weakly illuminated images. Signal Process. 2016, 129, 82–96. [Google Scholar] [CrossRef]
  4. Guo, X.; Li, Y.; Ling, H. LIME: Low-Light Image Enhancement via Illumination Map Estimation. IEEE Trans. Image Process. 2017, 26, 982–993. [Google Scholar] [CrossRef]
  5. Pu, Y.F.; Siarry, P.; Chatterjee, A.; Wang, Z.N.; Yi, Z.; Liu, Y.G.; Zhou, J.L.; Wang, Y. A Fractional-Order Variational Framework for Retinex: Fractional-Order Partial Differential Equation-Based Formulation for Multi-Scale Nonlocal Contrast Enhancement with Texture Preserving. IEEE Trans. Image Process. 2018, 27, 1214–1229. [Google Scholar] [CrossRef]
  6. Lan, X.; Zuo, Z.Y.; Shen, H.F.; Zhang, L.P.; Hu, J. Framelet-based sparse regularization for uneven intensity correction of remote sensing images in a retinex variational framework. Optik 2016, 127, 1184–1189. [Google Scholar] [CrossRef]
  7. Park, S.; Yu, S.; Moon, B.; Ko, S.; Paik, J. Low-Light Image Enhancement Using Variational Optimization-based Retinex Model. IEEE Trans. Consum. Electron. 2017, 63, 178–184. [Google Scholar] [CrossRef]
  8. Fu, G.; Duan, L.; Xiao, C. A Hybrid L2-LP Variational Model For Single Low-Light Image Enhancement with Bright Channel Prior. In Proceedings of the 2019 IEEE International Conference on Image Processing (ICIP), Taipei, Taiwan, 22–25 September 2019; p. 1929. [Google Scholar]
  9. Zhuang, P.; Ding, X. Underwater image enhancement using an edge-preserving filtering Retinex algorithm. Multimed. Tools Appl. 2020, 79, 17257–17277. [Google Scholar] [CrossRef]
  10. Oh, J.; Hong, M.C. Adaptive Image Rendering Using a Nonlinear Mapping-Function-Based Retinex Model. Sensors 2019, 19, 969. [Google Scholar] [CrossRef] [Green Version]
  11. Li, C.; Liu, J.; Zhu, J.; Zhang, W.; Bi, L. Mine image enhancement using adaptive bilateral gamma adjustment and double plateaus histogram equalization. Multimed. Tools Appl. 2022, 81, 12643–12660. [Google Scholar] [CrossRef]
  12. Si, L.; Wang, Z.; Xu, R.; Tan, C.; Liu, X.; Xu, J. Image Enhancement for Surveillance Video of Coal Mining Face Based on Single-Scale Retinex Algorithm Combined with Bilateral Filtering. Symmetry 2017, 9, 93. [Google Scholar] [CrossRef] [Green Version]
  13. Xu, K.; Chen, H.; Tan, X.; Chen, Y.; Jin, Y.; Kan, Y.; Zhu, C. HFMNet: Hierarchical Feature Mining Network for Low-Light Image Enhancement. IEEE Trans. Instrum. Meas. 2022, 71, 5014014. [Google Scholar] [CrossRef]
  14. Yang, P.; Wu, H.; Wang, T.; Cheng, L.; Zhao, G. Multi-scale underwater image enhancement with optimized homomorphic filter and RGB color correction. Opt. Rev. 2022, 29, 457–468. [Google Scholar] [CrossRef]
  15. Li, T.; Zhou, T. Multi-scale fusion framework via retinex and transmittance optimization for underwater image enhancement. PLoS ONE 2022, 17, e0275107. [Google Scholar] [CrossRef]
  16. Gao, X.J.; Zhang, M.L.; Luo, J.M. Low-Light Image Enhancement via Retinex-Style Decomposition of Denoised Deep Image Prior. Sensors 2022, 22, 5593. [Google Scholar] [CrossRef]
  17. Giuliani, D. Metaheuristic Algorithms Applied to Color Image Segmentation on HSV Space. J. Imaging 2022, 8, 6. [Google Scholar] [CrossRef]
  18. Liu, Y.Q.; Du, X.; Shen, H.L.; Chen, S.J. Estimating Generalized Gaussian Blur Kernels for Out-of-Focus Image Deblurring. IEEE Trans. Circuits Syst. Video Technol. 2021, 31, 829–843. [Google Scholar] [CrossRef]
  19. Zhang, W.D.; Dong, L.L.; Pan, X.P.; Zhou, J.C.; Qin, L.; Xu, W.H. Single Image Defogging Based on Multi-Channel Convolution MSRCR. IEEE Access 2019, 7, 72492–72504. [Google Scholar] [CrossRef]
  20. Liu, J.J.; Shi, Q.H.; Zhao, J.; Lai, Z.H.; Li, L.L. Noisy Low-Illumination Image Enhancement Based on Parallel Duffing Oscillator and IMOGOA. Math. Probl. Eng. 2022, 2022, 3903453. [Google Scholar] [CrossRef]
  21. Albahar, M.A. Contrast and Synthetic Multiexposure Fusion for Image Enhancement. Comput. Intell. Neurosci. 2021, 2021, 2030142. [Google Scholar] [CrossRef]
  22. Wang, W.; Wang, A.; Wang, X.; Sun, H.; Ai, Q. Rapid nighttime haze removal with color-gray layer decomposition. Signal Process. 2022, 200, 108658. [Google Scholar] [CrossRef]
  23. Rajasekar, M.; Kavida, C.A.; Bennet, A.M. A pattern analysis based underwater video segmentation system for target object detection. Multidimens. Syst. Signal Process. 2020, 31, 1579–1602. [Google Scholar] [CrossRef]
  24. Rahman, H.; Paul, G.C. Tripartite sub-image histogram equalization for slightly low contrast gray-tone image enhancement. Pattern Recognit. 2023, 134, 109043. [Google Scholar] [CrossRef]
  25. Chaudhry, A.M.; Riaz, M.M.; Ghafoor, A. Underwater visibility restoration using dehazing, contrast enhancement and filtering. Multimed. Tools Appl. 2019, 78, 28179–28187. [Google Scholar] [CrossRef]
  26. Shahvandi, M.K. A new optimal image smoothing method based on generalized discrete iterated Laplacian minimization and its application in the analysis of earth’s surface using satellite remote sensing imagery. Earth Sci. Inform. 2021, 14, 81–97. [Google Scholar] [CrossRef]
  27. Mahata, S.; Saha, S.K.; Kar, R.; Mandal, D. A metaheuristic optimization approach to discretize the fractional order Laplacian operator without employing a discretization operator. Swarm Evol. Comput. 2019, 44, 534–545. [Google Scholar] [CrossRef]
  28. Shao, W.T.; Mou, X.Q. No-Reference Image Quality Assessment Based on Edge Pattern Feature in the Spatial Domain. IEEE Access 2021, 9, 133170–133184. [Google Scholar] [CrossRef]
  29. Lin, L.L.; Chen, H.; Kuruoglu, E.E.; Zhou, W.H. Robust structural similarity index measure for images with non-Gaussian distortions. Pattern Recognit. Lett. 2022, 163, 10–16. [Google Scholar] [CrossRef]
  30. Lu, Q. Local Defogging Algorithm for Improving Visual Impact in Image Based on Multiobjective Optimization. Math. Probl. Eng. 2022, 2022, 7200657. [Google Scholar] [CrossRef]
  31. Li, C.; Guan, T.; Zheng, Y.; Zhong, X.; Wu, X.; Bovik, A. Blind image quality assessment in the contourlet domain. Signal Process.-Image Commun. 2021, 91, 116064. [Google Scholar] [CrossRef]
Figure 1. HSV model.
Applsci 13 02672 g001
Figure 2. Overall flow chart.
Applsci 13 02672 g002
Figure 3. Network structure diagram.
Applsci 13 02672 g003
Figure 4. Improved Retinex algorithm.
Applsci 13 02672 g004
Figure 5. Gamma curves with different parameters.
Applsci 13 02672 g005
Figure 6. Structure diagram for processing the luminance component V.
Applsci 13 02672 g006
Figure 7. Images used in the experiment. (a) downhole image 1; (b) downhole image 2; (c) downhole image 3.
Applsci 13 02672 g007
Figure 8. Image 1 algorithm and greyscale histogram comparison. (a) Image 1 algorithm comparison; (b) Image 1 algorithm and greyscale histogram comparison.
Applsci 13 02672 g008
Figure 9. Image 2 algorithm and greyscale histogram comparison. (a) Image 2 algorithm comparison; (b) Image 2 algorithm and greyscale histogram comparison.
Applsci 13 02672 g009
Figure 10. Image 3 algorithm and greyscale histogram comparison. (a) Image 3 algorithm comparison; (b) Image 3 algorithm and greyscale histogram comparison.
Applsci 13 02672 g010
Figure 11. Comparison of video interception image algorithms. (a) Video interception image 1 algorithm comparison; (b) video interception image 2 algorithm comparison; (c) video interception image 3 algorithm comparison; (d) video interception image 4 algorithm comparison.
Applsci 13 02672 g011
Table 1. Evaluation criteria for downhole image enhancement effect.
Algorithm CategoriesPSNRSSIMInformation Entropy
homomorphic filtering13.450.7512.44
Laplace enhancement14.980.7112.05
MSR11.620.6611.66
MSRCR15.930.7912.37
BF-MSRCR19.900.8113.70
Table 2. Downhole image enhancement quality evaluation.
Algorithm CategoriesStandard DeviationAverage GradientMean Value
homomorphic filtering49.766.98136.43
Laplace enhancement51.984.70145.21
MSR33.774.32125.85
MSRCR39.835.24152.56
BF-MSRCR74.1611.7178.77
Disclaimer/Publisher’s Note: The statements, opinions and data contained in all publications are solely those of the individual author(s) and contributor(s) and not of MDPI and/or the editor(s). MDPI and/or the editor(s) disclaim responsibility for any injury to people or property resulting from any ideas, methods, instructions or products referred to in the content.

