Abstract
The carbonation action in concrete, in which carbonation reactions transform calcium hydroxide into calcium carbonate, is considered as a multi-phase physico-chemical process. Generally, carbonation in the cementitious composites has negative effects on the protection of reinforced bars due to the accelerated corrosion problem. The investigation of the carbonation degree is, therefore, necessary to evaluate the carbonation influence on the reinforced cementitious composites. In the present paper, experimental techniques to measure the carbonation degree in concrete are reviewed, including both qualitative and quantitative methods. It should be noted that, while qualitative technique focuses on the alterations in the concrete pore solution alkalinity which reflects the carbonation depth through the pH indicator, most quantitative methods could provide accurate determination of the CO2 penetration capacity during the carbonation process. The method used, for the practical phase, depends on the purpose of the carbonation degree measurement.
1. Introduction
Carbonation in concrete is a well-known reaction of CO2 in the natural environment with hydrated calcium compounds, such as calcium hydroxide Ca(OH)2 and calcium silicate hydrate C-S-H, leading to the creation of calcium carbonate CaCO3, as the consequence of CO2 attack, resulting in change in the alkalinity level of cementitious composites [1,2]. The carbonation reaction process in concrete is performed as a series of chemical equations as follows [3]:
CO2 + H2O → H2CO3
Ca(OH)2 + H2CO3 → CaCO3 + 2H2O
C3S2H3 + 3H2CO3 → 3CaCO3 + 2SiO2 + 6H2O
Nowadays, the carbonation process in the cementitious matrix has been accelerating because the amount of CO2 from the atmosphere has increased significantly (from 0.278 to 0.43‰ during the industrial period [4]). It is an indisputable fact that the long-term durability of the cementitious matrix structure is in grave danger from this increase in the CO2 concentration [5]. With the aim of evaluating the effects of different possible carbonation reactions on the characteristics of reinforced concrete and preventing the potential harmful of the carbonation process, the carbonation degree must be quantified and predicted. So, what is the carbonation degree and how is this parameter measured? In general, the carbonation degree is ruled by the level of inward diffusion of CO2 molecules from the surface to the inner parts of specimen, influencing the bonding between matrix and reinforcement.
In cement-based concrete, the amount of calcium hydroxide Ca(OH)2 (portlandite) mainly controls pH value. The portlandite dissolution and CO2 outside diffusion result in the accumulation of calcium carbonate and pH reduction. The reduction of the pH value of concrete is a result of a wide range of processes, including penetration of CO2, alkalis leaching, sulfate attacks and carbonation of portlandite in the concrete pore solution.
In this context, the influence of carbonation on the performance of concrete has been extensively investigated in an attempt to limit the detrimental effects of weathering carbonation on outer constructions in concrete engineering [3,6,7,8,9]. It should be noted that the level of alkalinity of cementitious matrix relates strongly to the deterioration behavior of reinforced composite structures, which is one of the most challenging issues in the field of construction material. Steel reinforced concrete often faces severe durability problems in which its structure deteriorates heavily with increase in the age. The corrosion process was initiated by carbonating the concrete cover or by admixing chloride. From the perspective of reinforcement corrosion, this process could be divided in two separate stages, corrosion initiation and corrosion propagation stages [10]. The first step is CO2 penetration towards reinforcement while the corrosion process starts in the second stage.
Generally, the impact of environmental conditions on the carbonated area is multi-faceted, depending on different factors, such as content of CO2, temperature, relative humidity, and so on. Therefore, various methods could be used simultaneously to limit their weaknesses.
Additionally, the decrease of hydroxide concentration in the intervals between cement paste and embedded reinforcing steel during the carbonation process has negative effects on the protection of the coating surrounding the reinforcement. At the reduced alkalinity level, the decomposition of the passive oxide layer protecting the rebar appears, leading to high sensitivity towards corrosion. Carbonation-induced reinforcing bar corrosion of concrete has been dominated mainly by the carbonation rate [11,12]. Embedded reinforcement could be corroded in the low pH environment of carbonated concrete. Carbonation of concrete is, thus, one of the main causes of the deterioration of reinforcement in the cement paste [13,14,15,16,17,18,19]. The significant effect of carbonation on concrete durability is varied, depending on the carbonation reaction during the carbonation process.
Several methods for carbonation measurement are proposed based on different techniques. However, the two main methods identified are qualitative and quantitative methods. This paper aims to summarize both qualitative and quantitative methods to measure the carbonation degree of cementitious matrix, which is attracting attention currently for the enhancement of durability of concrete under the effects of carbonation weathering. The pH indicator, image and phase analysis, and CO2 uptake techniques were evaluated. Several innovative measurements such as fiber optic systems, XRD, TGA-DSC, FTIR, SEM and ultrasonic phase were reviewed to investigate the diffusion of CO2 inside the compositions and microstructure of composite.
2. Qualitative Methods
In these methods, the carbonation degree is investigated based on carbonation depth, including non-carbonation, partial carbonation and completed carbonation. According to these methods, the carbonation degree is not easy to measure and show in numbers (or quantify) and the outcome partly depends on the experience and skill of the examining staff. A few qualitative methods used to determine carbonation depth are based on pH value, image analysis and phase analysis.
2.1. Estimation of the Carbonation Degree Based on pH Indicator
Determination of the carbonation degree based on pH indicator is considered as a simple and effective method. The main effect of carbonation is to diminish in the pore solution’s pH values, which causes the destruction of the thin passive film of iron oxides or hydroxide on the façade of the steel bars in concrete. The evaluation the change in pH level of concrete is, hence, a simple approach to determine the degree of carbonation. Among qualitative methods, the suitable indicator was used as the conventional and most popular method in the assessment of pH value. The utilization of portlandite during the carbonation reaction leads to a decrease in pH level, resulting in the formation of different zones in concrete, such as completed, partial and non-carbonation areas. The most popularly used indicator to observe the depth of carbonation, for many years, has been phenolphthalein [20,21], followed by thymolphthalein, alizarin yellow R, aqueous ethanol and tropaeolin O. The clean freshly broken surface specimen is sprayed by indicator solution. A solution consisting of 1% phenolphthalein in 70% ethyl alcohol is highly recommended, according to RILEM recommendation [22]. Previous studies have given different opinions on the specific correlation between the degree of carbonation and pH value, depending on the production of the specimen and existing indicator. In fresh concrete, the pH value is normally more than 12; in carbonated concrete, however, this value could decrease to 7, depending on the carbonation degree. The change of pH value reflects the carbonation degree according to indicators, as shown in Table 1.

Table 1.
Summary of the experimental investigations on different pH scale range and carbonation degree depending on type of indicator.
As can be seen in Table 1, most studies used phenolphthalein as the main indicator to control the boundary causing the carbonation front in which concrete is carbonated, resulting in the evaluation of carbonation rate and degree [29,30,31]. Phenolphthalein is chosen as the most popular indicator because it can change color in a pH range between 8.3–10 and is more accessible in comparison with other indicators. It will appear pink in non-carbonated concrete and clear in carbonated. Additionally, the intensity of the color on the surface of the sample, which can be seen with the naked eyes, also reflects the different levels of carbonation. The increase in the intensity of the hue of reddish-purple illustrates the decrease in the carbonation degree [27]. Besides, based on the color reaction, Bao et al. [32,33] took advantage of the value of boundary length of the non-carbonated zone in the middle sample to numerically model the irregularity of carbonation depth. This potential method could help in the numerically calibrated results of several statistical parameters required by a numerical carbonation model through comparison with that predicted by experimental data results. On the other hand, the main obstacle in using phenolphthalein as an indicator is the difficulty in detecting the partial carbonated area where the pH is more than 10, according to Martin et al. [34]. Therefore, they proposed two new reactants, which show color change at the higher pH scale, to prevent the disadvantages of phenolphthalein: (i) alizarine yellow R, which consists of 0.5% of this solution in acetone and ethanol mixture and shifts from yellow to deep reddish-violet at pH interval between 10.1 and 12.0, and (ii) indigo carmine, which consists of 0.5 % of this solution in acetone and water mixture and transfers from blue to yellow at a pH interval of 10.0 to 11.4. It was believed that these new indicators could give higher accuracy and dependability in alkalinity measurement of the partial carbonated zone, since they could detect carbonated hazards which the traditional indicator could not distinguish, thanks to a higher degree of reliability.
Generally, using pH indicators leads to several drawbacks. The boundary of fully carbonated zones could be easy to detect while that of partial and non-carbonated zones could hardly be observed by the visual observation of the color change [16,24]. Furthermore, this technique addresses the change in pH value instead of that in the amount of real CO2 uptake during the process of carbonation. In fact, attention only to the alterations in the pore solution pH of the carbonated concrete to detect carbonation is also considered as a limitation of this conventional method [30]. Therefore, using pH indicators, associated with other approaches, to reduce restriction is necessary. In order to observe the change in the surface of the specimen, it is necessary to divide the surface into four concentric zones identified from the outer to inner zones of the sample [35,36], following the decrease in carbonation degree: (1) the carbonated zone in which calcium carbonate is dominant, (2) the carbonation front could be a low-porosity tenuous layer due to the complete precipitation of CaCO3, (3) the dissolution reaction front is a region of relatively high porosity owing to the fact that the cement hydration products constantly dissolve to create calcium carbonate, and (4) the non-carbonated zone is unmodified cement and not totally affected by carbonation curing, resulting in its retaining of initial hydration products. It is clear that the use of pH indicators could not detect these different zones. Therefore, the result from reagent solutions is always less credible than the result obtained from other methods [20,37]. For example, Bui et al. [3] pinpointed that carbonation depth observed from the phenolphthalein indicator is three time less than that acquired from the TGA technique in the reinforced mortar specimens. Nevertheless, it should be noted that this conventional method is still effectively used to determine the changes in the alkalinity of the sample.
Another method of pH measurement for concrete is based on the ASTM D4972 standard. In this technique, a solution with a ratio of 1:1 of air-dried powder sample and distilled water is employed to determine pH value using a pH meter. However, this technique is rarely applied in the evaluation of the carbonation degree due to the negligible mass of sample and the time-consuming process needed for mixing. It is more suitable for investigating the alkalinity level of samples under different aggressive environments [38,39,40].
To limit the inconvenience of the weak accuracy of the pH indicator method, fiber optic systems were introduced, developed and installed for pH monitoring of reinforced concrete due to the carbonation of on-site concrete. Most recently, to control the corrosion of the internal chemistry of reinforcement structures under different conditions, a wide range of new fiber optic sensors has been proposed. These minimized the disadvantages of previous methods and demonstrated many advantages with extremely high accuracy monitoring, repeatability, stability, recovery test, and non-destructive samples. Several kinds of sensors were investigated, including temperature, chemical, pressure and strain sensors. Among them, fiber optic chemical sensors have presented considerable advantages in terms of size and electromagnetic immunity interference in comparison with common sensors. Optical fiber, which acts as the light wave transmission and sense part of the sensor, is used to manufacture fiber optic sensors. The pH sensor is the most important among chemical sensors [41]. This sensor could be inserted in a concrete block in both fresh [42,43] and hardened states [44,45] of the sample. Several kinds of sensors have been used to detect the sensitive change in pH scale although they presented some disadvantages such as response time, sensibility and durability when embedding in the harsh and corrosive environment of concrete. For example, recently, a new opt ode, which is developed on a fluorescent probe, was successfully designed to determine pH value in concrete in the study of Tariq et al. [46]. This probe, prepared by very thin sensing films made from polyvinyl alcohol-glutaraldehyde matrix and synthesis of efficient fluorophores [47], has presented changeable and reliable reflection of the changes of pH. It is believed that this pH optode has a fast response time and is sensitive in the early hydration phase of low-pH cementitious matrix, and is manufactured by mixing silica fume and cement with the ratio of 1:1. The fluorescence intensity is lower at higher pH values due to the fluorescent protonated form and lower deprotonated form [48].
Furthermore, Basheer et al. [42], who used a pH sensor made from sol-gel probe, indicated that the pH value determined by means of chemical sensor is insignificantly different to those observed by the use of pH indicator when they carried out this experiment in a cement mortar sample, immersed in 5% CO2 concentration over two weeks. Nevertheless, the drawback of this sensor is a slow response time of at least five minutes based on the dimension of the probe matrix, while the time for the sensor membrane and fluorescent probe is only about 50 and 100 seconds, respectively [41,46]. On the contrary, the sol-gel probe has shown a sensibility and significantly greater durability in comparison with the other probes. It could serve for more than one year, while the disc type probe lasts for a maximum of only one month in the high-pH environment of concrete. Several drawbacks of using a fiber optic system are, however, the requirement of a complicated set up scheme with the sensor and a wide range of accessory devices [49], along with a short service lifespan caused by the chemical insubstantiality of the chromophore in the high alkalinity environment of cementitious composite. Therefore, further examination and investigation should be carried out for better assessments to open promising applications in this field.
2.2. Image Analysis
The degree of carbonation of the cementitious materials is normally estimated by the measurement of carbonation depth [50]. Depth of carbonation is a significant parameter related to durability performance and microstructure stability of the composite. The distribution or repartition of carbonation depth in concrete is generally variable accompanied by the distinctive minimum and maximum depth along the border of carbonated areas under both weathering and accelerated carbonation conditions due to the effects of coarse aggregates [51]. Characterization of carbonation depth is carried out by means of image analysis after detecting carbonation areas by using pH indicators. Chang et al. [25] investigated the correlation between depth and degree of carbonation in cementitious composite over periods of six- and eight-week accelerated carbonation. They pinpointed that at the depth of colorless phenolphthalein, the carbonation degree is always more than 75%, while this value is almost zero when phenolphthalein turns red.
The biggest advantage of the image analysis technique is that it is uncomplicated to determine the carbonation front width, and it is relatively economical and time-saving. The use of this technique is, hence, highly recommended [52,53]. Belda Revert et al. [15] employed a color threshold principle to measure carbonation depth distribution in mortar without and with reinforcement in different exposure periods. The observation from the carbonation detection images of samples tested, as shown in Figure 1, illustrated that corrosion has only occurred once the partially carbonated zone appears in the reinforcement–cementitious matrix interface. In addition, the increase in corrosion of the reinforcement has been observed due to the deeper carbonation depth in the sample. This is in accordance with the conclusions of Ghantous et al. [14], although the corrosion propagation process differs due to the difference in the CO2 penetration inside the cementitious matrix.
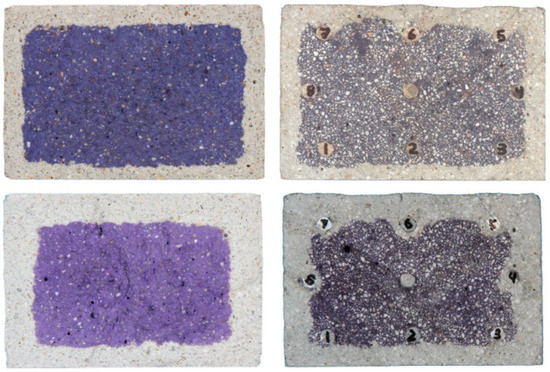
Figure 1.
Image series of observed carbonation front detection in sample without (left) and with reinforcement (right) after application of thymolphthalein solution for ten-week (top) and twenty two-week (bottom) exposure periods [15].
Another method has been applied in [54]. In this method, the carbonation area was determined by means of ImageJ software, corresponding to the average width of progressive carbonation in the middle of the specimen. After the carbonated area is confirmed in the cylindrical specimen, carbonation depth is calculated with respect to the radius of the specimen and carbonated area. This simple method is also affected by the difficulty of differentiating between partial and non-carbonated zones.
Otherwise, Wang et al. [55] compared the change in microstructure of sample using the observation of SEM photomicrographs before and after carbonation curing. It was observed that the microstructure becomes denser, as shown in Figure 2, due to the creation of high crystalline CaCO3 and silica gel that are capable of filling the gaps of the spatial structure made by the hydrated cement products when increasing the solid volume fraction [56,57,58,59], even if the calcium carbonate product is not easy to be detected in the images. More details can be found in [35,60]. It was indicated that denser structures of hydrates and high porosity of C-S-H have been observed when CO2 diffuses and converts into calcium carbonate in the position of the carbonation front. To compare the change in microstructure due to accelerated carbonation curing, a SEM image has been shown in Figure 3, indicating a border of the carbonated specimen. Due to the high pore rate in calcium silicate hydrate C-S-H structure, carbon dioxide could easily diffuse deeply into the microstructure, leading to the formation of calcium carbonate, which induces the formation of two different areas in the specimen: the outer layer is noted as a carbonated zone and the inner layer is noted as non-carbonated. Based on the edge of the two zones, carbonation depth is estimated quantitatively.
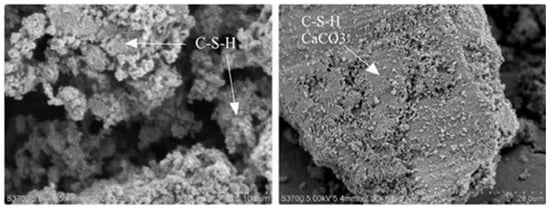
Figure 2.
SEM observation of cement paste before (left) and after (right) carbonation [55].
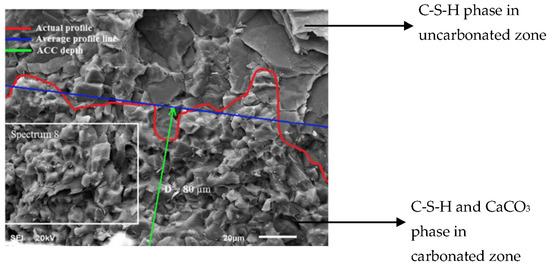
Figure 3.
SEM observation of carbonated specimen with the red line showing the edge of non-carbonated and carbonated areas [60].
The X-ray tomography image has also been used to detect indicated carbonated, calcium depleted layers and unreacted cement, as shown in Figure 4.
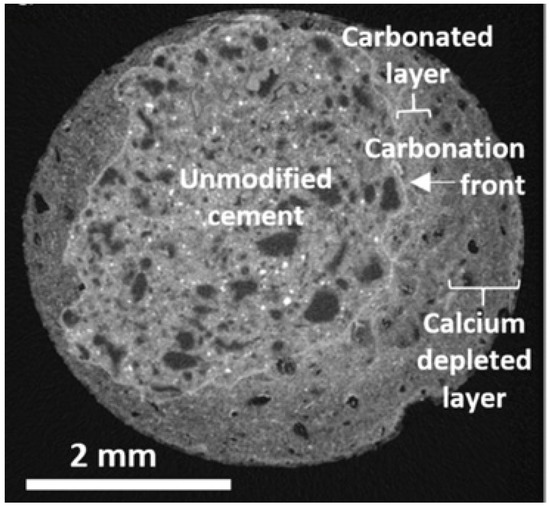
Figure 4.
X-ray tomography observation of sample cross-section after 136 day-period of exposure to CO2 saturated solution [36].
Image analysis allows study of chemical properties and it is useful to delve deeply into the newly transformed phases (forms of calcium carbonate polymorphs) and physical or quality characteristics (density, morphology, particle size, crystal habit) of the carbonated sample. However, restrictions on a more in-depth exploration of the interior of structure and high cost are considered as drawbacks and limit the widespread usage of this technique.
2.3. Phase Analysis
Phase analysis is also a common method used to evaluate the carbonation degree of composite. The principle of these methods is based on the change in phase of concrete. Another logical way to determine the carbonation degree is to study the carbonation depth based on the changes in microstructure on the pore solution of the powder sample. Carbonation could result in the modification of the microstructure owing to the variation of the molar volume of the solid compound in the hydrates and carbonated phases [13]. In detail, calcium hydroxide, calcium silicates and calcium silicate hydrate were carbonated in turn, respectively, to generate calcium carbonates. The formation of this greater proportion of solids is strongly evidenced through the observation of the quantity of carbon uptake, the strength improvement, and calcite and endothermal peaks in TGA, XRD and DTG graphs, respectively [3,7,60,61,62].
2.3.1. Thermogravimetric Analysis (TGA)
After the conventional method mentioned above, the TGA technique is also now commonly used in a wide range of studies concerning carbonation of concrete [25,26,27,28,29]. These studies investigated using profile ground powder from the outer to the center parts of carbonated concrete and reported that the carbonation reaction induces the varying amount of calcium carbonate (CC) and portlandite (CH) during the carbonation process. Theoretically, the quantifications of CH and CC are evaluated based on the mass loss of sample at temperature ranges from 450 °C to 550 °C and from 550 °C to 850 °C, respectively [63,64]. At the depth at which both C-H and CC exist, this part is considered as the carbonated area. The content of CC changes remarkably along with the grinding depth owing to the decrease in the penetration of carbon dioxide [65]. When CH remains and does not convert into CC, a negligible amount of CC has been found at the higher depth of the specimen, from which carbonation reactions hardly occur. For instance, De Weerdt et al. [26] investigated the modifications in the pore solution composition of carbonated and non-carbonated concrete (as a reference) based on TGA data and concluded that, contrary to all reference samples, the CH and CC content in the carbonated sample showed a significant variation along with the depth of concrete, as presented in Figure 5. Additionally, the data result from the mass loss also clearly reflects the rate of carbonation. At the first steps of the carbonation process, the CH consumption occurred quickly. Further reaction, however, slowed down significantly owing to the creation of a continuous and protective layer of CC surrounding CH [66,67].
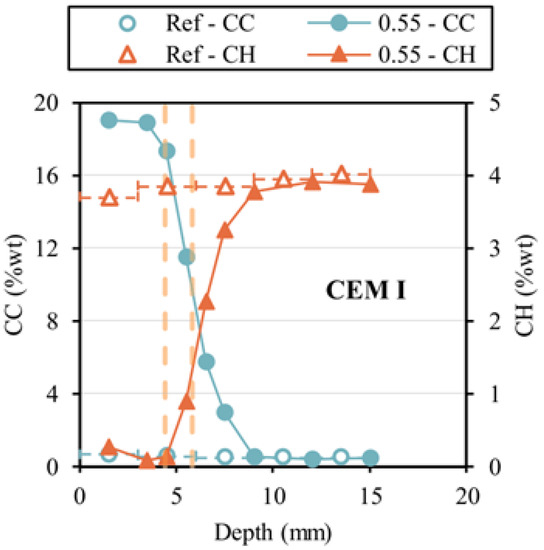
Figure 5.
The variation of CH and CC content in non-carbonated (Ref) and carbonated (0.55) concretes. The dashed lines show the carbonation depth measured by indicator [26].
The TGA technique would show more accurate values compared with the conventional methods owing to the high-sensitivity detector (the thermal scale of this method almost has 0.001 μg accuracy) [68]. Nevertheless, it should be noted that the results from the TGA are restricted because of problems associated with the sampling. TGA technique requires a typical small range mass (only from 5 μg to 10 mg, depending on the type of sample). All the sampling was performed on small positions for the powder samples to be representative of small regions in the sample, not of the complete sample.
2.3.2. X-ray Diffraction (XRD)
The alterations in the microstructure of the sample, comprehensively due to carbonation reaction and the position of the carbonation front, were also assessed using X-ray diffraction. Several studies have investigated the mineralogical identification and quantification of the carbonated sample using X-ray diffraction analysis [28,54,69,70,71]. In detail, XRD technique could determine the carbonation area through the observation of phase peaks of formation CaCO3 at all investigated depths [71] and be manifested by the intensity, the disappearance (such as portlandite C-H, ettringite AFt, calcium silicate hydrate C-S-H and calcium aluminate hydrate C-A-H) and generation (including calcite, vaterite and aragonite) of the diffraction peaks created by the carbonation reaction, as shown in Figure 6 [72].
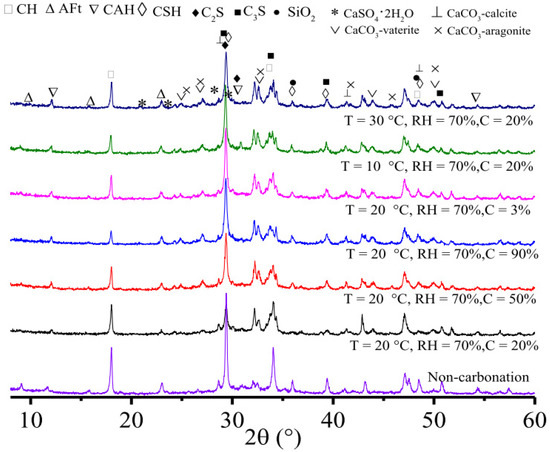
Figure 6.
XRD data results of the phase composition at different curing conditions [73].
Due to XRD data results at different temperature conditions and carbon dioxide concentration, the variations in the phase composition and products of concrete have been clearly observed. For example, at the same temperature and relative humidity, the diffraction peak intensity of calcium carbonate increased with the increase in carbon dioxide concentration. In addition, XRD data results also reflected that the phase composition and diffraction peaks of the sample varied more significantly with the rise of temperature at the same carbon dioxide concentration and relative humidity conditions due to faster decomposition of the sample under higher temperature. Meanwhile, mineralogical changes, such as calcium carbonate polymorphs and physicochemical properties, have been observed other reports [54,69,73]. At the higher level of carbonation duration, CH percentages decreased (from 75% to 55%) with the increase of CaCO3 percentages (from 3% to 10%) in the accelerated carbonation condition. This decrease is more significant at higher CO2 concentration, temperature, and relative humidity [74]. This influence is characteristic of the carbonation of CH and CSH, which are consumed to create calcium carbonate. This behavior is totally in agreement with that shown in thermo-gravimetric analysis. Although the X-ray diffraction technique was reported to have a standard plus or minus 5% margin of error [75], this acceptable percentage margin of error could be of less importance when comparing XRD results with data on different methods, interpreted under comparable conditions. Drouet et al. [61] compared the values of carbonation depth obtained by means of phenolphthalein and XRD and indicated that all the received results were aligned along the line of equality, despite the fact that the carbonation depth measured through phenolphthalein was usually significantly lower than that observed by means of XRD technique. This phenomenon was indicated due to the limited carbonation period, i.e., one-week duration, that supported the elimination of the large difference between the two approaches. Like the TGA technique, although the X-ray diffraction method could give a potential determination of mineralogical components at various profiles of sample sections, investigating carbonation-induced differences concerning chemical compositions, the powdered sample is based on very small areas that have representing difficulty in representing the population in the entire specimen.
2.3.3. Fourier Transform Infrared Spectroscopy (FTIR)
Another method, FTIR, has been harnessed to identify the main phases of carbonation products due to the relative intensity of the absorption bandwidths associated with the creation of chemical compositions during the carbonation process. FTIR spectra could be utilized as a useful tool to acquire information concerning the carbonation reaction and hydrated cement products, including C-S-H and calcite, based on absorption peaks at different wavelengths caused by mineralogical components [76]. For example, the effects of types of binder, mineral addition, quartz and limestone on the carbonation process of concrete have been studied by Lin et al. [77]. They indicated that the FTIR spectra fluctuated significantly after carbonation curing. The absorption peak of CH at 3642 cm−1 totally vanished due to the complete carbonation of CH to form calcium carbonate, as shown in Figure 7.
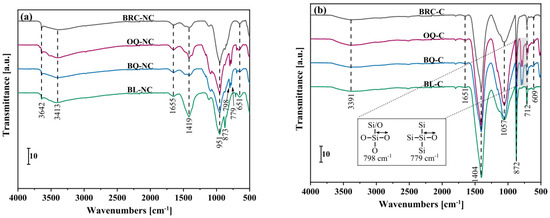
Figure 7.
The variation of CH and CC content in non-carbonated (Ref, figure (a)) and carbonated (0.55, figure (b)) concretes. The dashed lines show the carbonation depth measured by indicator [26]. Note: BRC: Belite-rich cement paste; OQ: ordinary Portland cement and quartz paste, BQ: Belite-rich cement and quartz; BL: Belite-rich cement and limestone.
In addition, the absorption peaks of CSH which normally appeared at 3413 cm−1 and 1655 cm−1 became weaker than the peaks belonging to the non-carbonated samples due to the fact that the C-S-H was dehydrated. The FTIR results are matched with the outcome of TGA and XRD methods. These methods could help to detect the main phases concerning carbonation of concrete such as AFt, CH, CC, dolomite and CSH [54], which are the typical carbonation reaction products.
2.3.4. Ultrasonic Phase Velocity Technique
The ability to use ultrasonic wave transmission velocity to predict the microstructure and properties of materials was investigated in several previous studies [78,79]. To assess characteristics of concrete, such as porosity, density and pore structure, the surface wave-based technique is highly recommended due to the fact that the wave’s energy is intensified significantly on the surface of material obviously affected by carbonation [80]. This technique could monitor, automatically and continuously, the effect of the carbonation process without any destruction based on the transmission ultrasound. Acoustic phase velocity analysis was conducted on numerous acquired signals mainly obtained from the controlled carbonation process of cementitious composites. In detail, typical ultrasonic signals obtained from reference (non-carbonated) and carbonated specimens at different ratios of water and cement are indicated in Figure 8, according to Villarreal et al. [81]. As can be seen from this figure, after carbonation, scattering effect was observed with larger pulse width because of the decrease in the granular noise and the group velocities. The diffusion of the ultrasonic energy based on phase velocity measurement could give information on variation of the microstructure in cement paste. The effect of carbonation during the carbonation period is determined based on the experimental pulse parameters and group velocity data. In addition, the increment of wave dispersion reflects the change in the porosity and increase in microscopic phases due to non-constant diffusion of CO2 in concrete. It is a fact that increased density and decreased pore spaces in the concrete structure could be achieved after carbonation [82]. Modification of the microstructure with exposure duration could be obtained by increasing the pulse width and the appearance of structural noise, in which the frequency capacity of the wave becomes more expansive, due to the diffusion effects of CO2. The result obtained from this technique is well in agreement with the FTIR result, according to Villarreal et al. [81].
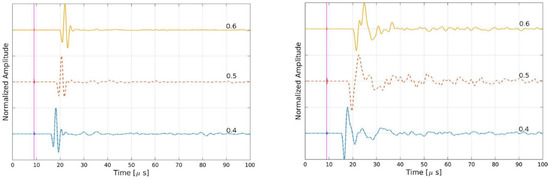
Figure 8.
Signals from non-carbonated and carbonated cement paste [81]. The number in the graphs presents the ratio of water and cement.
3. Quantitative Methods
A wide range of researchers has used different methods and techniques to study the carbonation of concrete, as reviewed above. However, most of the research is only restricted to the qualitative investigation on the effects of carbonation reaction on the concrete structure, properties and durability. Discussion of the quantitative approach and combination of CO2 diffusion content with the carbonation degree of composite is limited. From the first decades of twentieth century, the calculation of CO2 uptake in concrete has been made in different regions in the world. This article reviews two ways to measure the carbonation degree quantitatively: using phenolphthalein, and based on the amount of CO2 uptake.
3.1. Phenolphthalein Indicator
Most researchers used the phenolphthalein indicator as a qualitative method to determine carbonated and un-carbonated areas [22,24,27,83,84], except for references [77,85]. In their study, after phenolphthalein application, the degree of carbonation was evaluated by calculating the rate of the carbonated areas (in which pH indicator remains colorless) divided by the total fresh broken area of the sample analyzed. In these respects, the carbonation degree could be in the range of 33% to 92% depending on the amount of C2S in cement mortar and exposure duration. Mi et al. [86] also recommended the usage of carbonation zone width, which is decided by the amount of CaCO3, for evaluation of the carbonation degree instead of determining carbonation depth by pH indicator. However, the phenolphthalein-based technique still retains some drawbacks of the indicator method as discussed above. Therefore, the usage of these methods is always to be encouraged in simultaneous transition with other methods for enhancing the accuracy of measurement [3].
3.2. CO2 Uptake
Different views on the relationship between the depth and degree of carbonation exist in the literature. Andrade [84] believed that the carbonation degree is entirely independent from carbonation depth through study or the carbonation degree of concrete over a four-year exposure duration. The evidence for this is that, at the position where the carbonation depth reaches maximum, the amount of CO2 is not at maximum. This means that carbonation degree is not influenced by carbonation depth. The carbonation degree is mainly governed by the amount of CO2 uptake once the concrete is in touch with a CO2-rich environment. Therefore, accurate estimation of CO2 absorption content from accelerated carbonation conditions is vital to accurately predict and quantify carbonation stages in actual concrete structures. However, CO2 uptake measurement in cement-based materials is a very complicated task due to the absence of a definite calculation method. The theoretical, semi-empirical and empirical models could constitute calculation bases.
The CO2 uptake method relates to an amount of CO2 absorbed in the sample that could be calculated in multiple ways. Some studies [69,87,88,89] reported that the carbonation degree could be governed by the uptake of CO2 within the carbonation process. This mass was calculated based on the content of CO2 in the sample at different durations of the exposure process. The usage of this method could give a relatively accurate evaluation of the carbonation degree in accordance with the carbonation time. However, this method seems to suit the pure CO2 environment (CO2 concentration in the storage chamber ~100%) with a short carbonation duration. For example, Rostami et al. [90] investigated the carbonation degree in the first two hours of the carbonation of concrete and assessed that a degree of carbonation of 16% was obtained through the measurement CO2 uptake of 8%.
As can be seen, in quantitative measurement, the calculation of the carbonation degree is varied and relies on the view of the CO2 diffusion mechanism in concrete. Quantitative assessment of the carbonation degree of the cementitious composite has been calculated based on CO2 uptake content and was identified differently, as shown in Table 2. Several researchers have calculated the carbonation degree of concrete based on the CO2 uptake content calculated in TGA analysis. Besides, some other methods were also employed for the measurement of CO2 amount such as XRD [91,92], nuclear magnetic resonance NMR [17,58,93], mercury intrusion porosimetry MIP [94,95], or estimation using the mass gain method in early-age carbonation [96].
Table 2.
Several mathematical models for carbonation degree calculation by means of CO2 content.
In addition, Andrade [84] believed that the carbonation degree calculation is with respect only to the clinker proportion. Therefore, the carbonation degree of concrete manufactured using cement containing low clinker content could exceed 100%, even above 400% for cement samples with ground granulated blast furnace slag GGBS after a 3.7 year-exposure-period in the natural environment. This means that the carbonation degree was governed mainly by the relatively low amount of clinker and carbonation capacity of hydrated components from ground granulated blast furnace slag with conventional cement. Consideration must be given that this method is employed only within the area which has been considered carbonated by the confirmation of a pH indicator test. Meanwhile, Zhu et al. [87] calculated the carbonation degree with regard to the change in CO2 content during the carbonation process. This content was estimated by corresponding mass loss of sample at the temperature range between 500 °C and 900 °C, which is responsible for the mass of CO2 released during the decarbonation processes. With this estimation, the carbonation degree is, of course, always under 100%.
The method of calculating the carbonation degree based on the amount of CO2 in the carbonated, non-carbonated samples and the theoretical amount of CO2 required to react with the whole CaO in the specimen to create CaCO3, respectively, regardless of content of CO2 released, is considered as the most precise method to investigate carbonation of autoclaved aerated concrete [92].
Another non-destructive method, which is based on the amount of CO2 penetrating in the porous structure of concrete is to use gamma radiation. In this method, the mass loss of water during the carbonation process was assumed to have not occurred. With these assumptions, CO2 penetration is the only reason to create the rise in concrete density. A radioactive source of Cesium Cs137 is used to emit a gamma ray, which is in accordance with Lambert’s law [103]. Gamma-densimetry could allow control of the enlargement of density along the depth and in real-time, inducing the evolution of the carbonation transformation as a function of duration during the laboratory test. Due to the carbonation profile obtained by the differences in density of carbonated and un-carbonated concrete samples at different times, gamma-densimetry could give a very accurate measurement of the entire penetrated CO2 quantity and monitor the carbonation process over time. However, it is not easy to measure the amount the CO2 penetrating to the middle part of concrete structure because of the requirement of a reference non-carbonated auscultation state before the deterioration process [104].
4. Conclusions
The present study reviews and evaluates the applicability of different methods for carbonation degree measurement in concrete in both qualitative and quantitative ways, summarized in Table 3. Most approaches studied have shown comparable findings when a careful selection of the techniques of analysis and investigation criteria has been made. However, quantitative determination of the degree of carbonation seems to be critical for the accurate calculation of the CO2 penetration capacity of a sample by accelerated carbonation, while all qualitative methods could provide modifications in the alkalinity of the pore solution of the specimen.
Table 3.
Experimental methods for determination the carbonation degree: Content, pros and drawbacks.
Phase analysis methods are used instead of pH indicator for carbonation level determination as a way of limiting the drawbacks of conventional methods in detecting different zones from the external to central parts of the sample, while the phenolphthalein test does not seem appropriate because the quantity of real CO2 uptake all along the carbonation process has been overlooked.
Based on the review, the following recommendations are given:
- -
- Using suitable indicators is highly recommended as a straightforward and simple approach. Even if quantitative methods have been applied, pH indicators were also used to detect the carbonated zones. All the pH measurement methods gave similar findings; thus, the authors suggest the easiest and cheapest pH measurement method: phenolphthalein. However, its applicability in evaluating CO2 diffusion capacity is problematic in the case of partial carbonation owing to its potentially limited detection of phase change.
- -
- pH indicator could be used widely, but the combination with other techniques needs to be performed. Non-destructive methods by means of embedded fiber optic sensors could offer an adequate and accurate estimation of long-term pH monitoring of reinforced concrete structures in different conditions.
- -
- If the problem of high cost could be overlooked, image analysis presented a significant advantage in exploring crystal habit, morphology and size of the core of the sample, with high accuracy in the qualitative carbonation measurement.
- -
- Phase analysis seems to be an accurate method when phase measurements are performed by using XRD, TGA, FTIR and ultrasonic phase velocity technique. The margin of error of these measurements has very limited impact on the result and does not need to be familiar for carbonation determination (less than ±5%).
- -
- A new method, the fiber optic system, has been developed recently to control the change in internal chemistry of a concrete structure. All phase analysis techniques such as XRD, TGA, FTIR and gamma-0densimetry are carried out in the laboratory with very small-scale specimens and require little destruction to the structure in order to obtain samplings. However, fiber optic systems overcome most these drawbacks and obtain non-destructive, continuous and real-time data in actual time conditions for concrete structures. This method could be considered as a promising application in the field of controlling deterioration in concrete structures.
- -
- For the determination of the uptake of CO2, it is sufficient to measure weight loss at a temperature between 500 and 1000 °C with regard to TGA method. The CaO content should be considered because it relates to the carbonation of hydrates. The use of CO2 uptake content to determine the carbonation degree of concrete requires that the carbonation zones are defined in advance.
- -
- The gamma-densimetry method should be considered for use at laboratory scale due to the high accuracy in measurement of the CO2 penetrated.
In conclusion, the authors suggest that the spectra data, such as fluorescence, X-ray, FTIR and ultrasonic signals, could be used to measure the carbonation degree quantitatively based on the diffraction intensity, which reflects the amount of CO2 diffusion. However, further investigation of spectra data treatment should be performed to reveal greater detail in the spectra field.
Author Contributions
Conceptualization, H.B., D.L. and F.D.; methodology, H.B. and F.D.; investigation, H.B.; writing—original draft preparation, H.B.; writing—review and editing, H.B., D.L. and F.D.; supervision, F.D. and D.L.; project administration, F.D.; funding acquisition, F.D. All authors have read and agreed to the published version of the manuscript.
Funding
This research received no external funding.
Institutional Review Board Statement
Not applicable.
Informed Consent Statement
Informed consent was obtained from all subjects involved in the study.
Data Availability Statement
The data presented in this study are available on request from the corresponding author.
Acknowledgments
The authors thank UECIV of Littoral Côte d’Opale University for their support.
Conflicts of Interest
The authors declare no conflict of interest.
References
- Possan, E.; Thomaz, W.A.; Aleandri, G.A.; Felix, E.F.; dos Santos, A.C.P. CO2 uptake potential due to concrete carbonation: A case study. Case Stud. Constr. Mater. 2017, 6, 147–161. [Google Scholar] [CrossRef]
- Li, L.; Xuan, D.; Sojobi, A.O.; Liu, S.; Sun, C. Efficiencies of carbonation and nano silica treatment methods in enhancing the performance of recycled aggregate concrete. Constr. Build. Mater. 2021, 308, 125080. [Google Scholar] [CrossRef]
- Bui, H.; Boutouil, M.; Levacher, D.; Sebaibi, N. Evaluation of the influence of accelerated carbonation on the microstructure and mechanical characteristics of coconut fibre-reinforced cementitious matrix. J. Build. Eng. 2021, 39, 102269. [Google Scholar] [CrossRef]
- Gattuso, J.P.; Magnan, A.; Billé, R.; Cheung, W.W.L.; Howes, E.L.; Joos, F.; Allemand, D.; Bopp, L.; Cooley, S.R.; Eakin, C.M.; et al. Contrasting futures for ocean and society from different anthropogenic CO2 emissions scenarios. Science 2015, 349, 6243. [Google Scholar] [CrossRef]
- Yoon, I.S.; Çopuroǧlu, O.; Park, K.B. Effect of global climatic change on carbonation progress of concrete. Atmos. Environ. 2007, 41, 7274–7285. [Google Scholar] [CrossRef]
- De Weerdt, K.; Ben Haha, M.; Le Saout, G.; Kjellsen, K.O.; Justnes, H.; Lothenbach, B. Hydration mechanisms of ternary Portland cements containing limestone powder and fly ash. Cem. Concr. Res. 2011, 41, 279–291. [Google Scholar] [CrossRef]
- Rostami, V.; Shao, Y.; Boyd, A.J. Carbonation curing versus steam curing for precast concrete production. J. Mater. Civ. Eng. 2012, 24, 1221–1229. [Google Scholar] [CrossRef]
- Tang, J.; Wu, J.; Zou, Z.; Yue, A.; Mueller, A. Influence of axial loading and carbonation age on the carbonation resistance of recycled aggregate concrete. Constr. Build. Mater. 2018, 173, 707–717. [Google Scholar] [CrossRef]
- Wang, J.; Xu, H.; Xu, D.; Du, P.; Zhou, Z.; Yuan, L.; Cheng, X. Accelerated carbonation of hardened cement pastes: Influence of porosity. Constr. Build. Mater. 2019, 225, 159–169. [Google Scholar] [CrossRef]
- Tuutti, K. Corrosion of steel in concrete, Swedish Cement and Concrete. Stockholm ISB 1977, 655–661. [Google Scholar] [CrossRef]
- Shi, X.; Yao, Y.; Wang, L.; Zhang, C.; Ahmad, I. A modified numerical model for predicting carbonation depth of concrete with stress damage. Constr. Build. Mater. 2021, 304, 124389. [Google Scholar] [CrossRef]
- Zhang, K.; Xiao, J. Prediction model of carbonation depth for recycled aggregate concrete. Cem. Concr. Compos. 2018, 88, 86–99. [Google Scholar] [CrossRef]
- Shah, V.; Scrivener, K.; Bhattacharjee, B.; Bishnoi, S. Changes in microstructure characteristics of cement paste on carbonation. Cem. Concr. Res. 2018, 109, 184–197. [Google Scholar] [CrossRef]
- Ghantous, R.M.; Poyet, S.; L’Hostis, V.; Tran, N.C.; François, R. Effect of crack openings on carbonation-induced corrosion. Cem. Concr. Res. 2017, 95, 257–269. [Google Scholar] [CrossRef]
- Belda Revert, A.; De Weerdt, K.; Hornbostel, K.; Geiker, M.R. Carbonation-induced corrosion: Investigation of the corrosion onset. Constr. Build. Mater. 2018, 162, 847–856. [Google Scholar] [CrossRef]
- Zhang, D.; Ghouleh, Z.; Shao, Y. Review on carbonation curing of cement-based materials. J. CO2 Util. 2017, 21, 119–131. [Google Scholar] [CrossRef]
- Shen, Q.; Pan, G.; Bao, B. A method for calculating the carbonation degree of calcium–silicate–hydrate. Adv. Cem. Res. 2018, 30, 427–436. [Google Scholar] [CrossRef]
- Shah, V.; Bishnoi, S. Carbonation resistance of cements containing supplementary cementitious materials and its relation to various parameters of concrete. Constr. Build. Mater. 2018, 178, 219–232. [Google Scholar] [CrossRef]
- Seo, J.; Kim, S.; Park, S.; Bae, S.J.; Lee, H.K. Microstructural evolution and carbonation behavior of lime-slag binary binders. Cem. Concr. Compos. 2021, 119, 104000. [Google Scholar] [CrossRef]
- Qiu, Q. A state-of-the-art review on the carbonation process in cementitious materials: Fundamentals and characterization techniques. Constr. Build. Mater. 2020, 247, 118503. [Google Scholar] [CrossRef]
- Hargis, C.W.; Lothenbach, B.; Müller, C.J.; Winnefeld, F. Carbonation of calcium sulfoaluminate mortars. Cem. Concr. Compos. 2017, 80, 123–134. [Google Scholar] [CrossRef]
- RILEM Committee CPC-18. Measurement of hardened concrete carbonation depth. Mater. Struct. 1988, 18, 453–455. [Google Scholar]
- Lee, H.J.; Kim, D.G.; Lee, J.H.; Cho, M.S. A study for carbonation degree on concrete using a phenolphthalein indicator and Fourier-Transform Infrared Spectroscopy. Int. J. Civ. Environ. Struct. Constr. Archit. Eng. 2012, 6, 95–101. [Google Scholar] [CrossRef]
- Li, Z.; Li, S. Effects of wetting and drying on alkalinity and strength of fly ash/slag-activated materials. Constr. Build. Mater. 2020, 254, 119069. [Google Scholar] [CrossRef]
- Chang, C.F.; Chen, J.W. The experimental investigation of concrete carbonation depth. Cem. Concr. Res. 2006, 36, 1760–1767. [Google Scholar] [CrossRef]
- De Weerdt, K.; Plusquellec, G.; Revert, A.B.; Geiker, M.R.; Lothenbach, B. Effect of carbonation on the pore solution of mortar. Cem. Concr. Res. 2019, 118, 38–56. [Google Scholar] [CrossRef]
- Steiner, S.; Lothenbach, B.; Proske, T.; Borgschulte, A.; Winnefeld, F. Effect of relative humidity on the carbonation rate of portlandite, calcium silicate hydrates and ettringite. Cem. Concr. Res. 2020, 135, 106116. [Google Scholar] [CrossRef]
- Silva, B.A.; Ferreira Pinto, A.P.; Gomes, A.; Candeias, A. Effects of natural and accelerated carbonation on the properties of lime-based materials. J. CO2 Util. 2021, 49, 101552. [Google Scholar] [CrossRef]
- Wang, J.; Su, H.; Du, J. Influence of coupled effects between flexural tensile stress and carbonation time on the carbonation depth of concrete. Constr. Build. Mater. 2018, 190, 439–451. [Google Scholar] [CrossRef]
- Bernal, S.A.; Provis, J.L.; Mejía de Gutiérrez, R.; van Deventer, J.S.J. Accelerated carbonation testing of alkali-activated slag/metakaolin blended concretes: Effect of exposure conditions. Mater. Struct. Constr. 2014, 48, 653–669. [Google Scholar] [CrossRef]
- Seo, J.; Kim, S.; Park, S.; Yoon, H.N.; Lee, H.K. Carbonation of calcium sulfoaluminate cement blended with blast furnace slag. Cem. Concr. Compos. 2021, 118, 103918. [Google Scholar] [CrossRef]
- Bao, H.; Yu, M.; Chi, Y.; Liu, Y.; Ye, J. Performance evaluation of steel-polypropylene hybrid fiber reinforced concrete under supercritical carbonation. J. Build. Eng. 2021, 43, 103159. [Google Scholar] [CrossRef]
- Bao, H.; Yu, M.; Liu, Y.; Ye, J. Experimental and statistical study on the irregularity of carbonation depth of cement mortar under supercritical condition. Constr. Build. Mater. 2018, 174, 47–59. [Google Scholar] [CrossRef]
- Martín-Del-Río, J.J.; Alejandre, F.J.; Márquez, G.; Blasco, F.J. An argument for using alizarine yellow R and indigo carmine to determine in situ the degree of alkalinity in reinforced concrete. Constr. Build. Mater. 2013, 40, 426–429. [Google Scholar] [CrossRef]
- Rimmelé, G.; Barlet-Gouédard, V.; Porcherie, O.; Goffé, B.; Brunet, F. Heterogeneous porosity distribution in Portland cement exposed to CO2-rich fluids. Cem. Concr. Res. 2008, 38, 1038–1048. [Google Scholar] [CrossRef]
- Gawel, K.; Wenner, S.; Edvardsen, L. Effect of carbonation on bulk resistivity of cement/carbon nanofiber composites. Constr. Build. Mater. 2021, 305, 124794. [Google Scholar] [CrossRef]
- Herrera, R.; Kinrade, S.D.; Catalan, L.J.J. A comparison of methods for determining carbonation depth in fly ash-blended cement mortars. ACI Mater. J. 2015, 112, 287–294. [Google Scholar] [CrossRef]
- Bui, N.K.; Satomi, T.; Takahashi, H. Influence of industrial by-products and waste paper sludge ash on properties of recycled aggregate concrete. J. Clean. Prod. 2019, 214, 403–418. [Google Scholar] [CrossRef]
- Li, L.; Nam, J.; Hartt, W.H. Ex situ leaching measurement of concrete alkalinity. Cem. Concr. Res. 2005, 35, 277–283. [Google Scholar] [CrossRef]
- Plusquellec, G.; Geiker, M.R.; Lindgård, J.; Duchesne, J.; Fournier, B.; De Weerdt, K. Determination of the pH and the free alkali metal content in the pore solution of concrete: Review and experimental comparison. Cem. Concr. Res. 2017, 96, 13–26. [Google Scholar] [CrossRef]
- Safavi, A.; Bagheri, M. Novel optical pH sensor for high and low pH values. Sens. Actuators B Chem. 2003, 90, 143–150. [Google Scholar] [CrossRef]
- Basheer, M.P.A.; Grattan, K.T.V.; Sun, T.; Long, A.E.; McPolin, D.; Xie, W. Fiber optic chemical sensor systems for monitoring pH changes in concrete. In Advanced Environmental, Chemical, and Biological Sensing Technologies II; SPIE: Bellingham, WA, USA; Volume 5586. [CrossRef]
- Fan, L.; Bao, Y. Review of fiber optic sensors for corrosion monitoring in reinforced concrete. Cem. Concr. Compos. 2021, 120, 104029. [Google Scholar] [CrossRef]
- McPolin, D.O.; Basheer, P.A.M.; Grattan, K.T.V.; Long, A.E.; Sun, T.; Xie, W. Preliminary development and evaluation of fibre optic chemical sensor. J. Mater. Civ. Eng. 2011, 23, 1200–1210. [Google Scholar] [CrossRef]
- Blumentritt, M.; Melhorn, K.; Flachsbarth, J.; Kroener, M.; Kowalsky, W.; Johannes, H.H. A novel fabrication method of fiber-optical planar transmission sensors for monitoring pH in concrete structures. Sens. Actuators B Chem. 2008, 131, 504–508. [Google Scholar] [CrossRef]
- Tariq, A.; Baydoun, J.; Remy, C.; Ghasemi, R.; Lefevre, J.P.; Mongin, C.; Dauzères, A.; Leray, I. Fluorescent molecular probe based optical fiber sensor dedicated to pH measurement of concrete. Sens. Actuators B Chem. 2021, 327, 128906. [Google Scholar] [CrossRef]
- Rémy, C.; Allain, C.; Leray, I. Synthesis and photophysical properties of extended π conjugated naphthalimides. Photochem. Photobiol. Sci. 2017, 16, 539–546. [Google Scholar] [CrossRef]
- Nguyen, T.H.; Venugopala, T.; Chen, S.; Sun, T.; Grattan, K.T.V.; Taylor, S.E.; Basheer, P.A.M.; Long, A.E. Fluorescence based fibre optic pH sensor for the pH 10-13 range suitable for corrosion monitoring in concrete structures. Sens. Actuators B Chem. 2014, 191, 498–507. [Google Scholar] [CrossRef]
- Behnood, A.; Van Tittelboom, K.; De Belie, N. Methods for measuring pH in concrete: A review. Constr. Build. Mater. 2016, 105, 176–188. [Google Scholar] [CrossRef]
- Haněa, K.; Koronthályová, O.; Matiašovský, P. The carbonation of autoclaved aerated concrete. Cem. Concr. Res. 1997, 27, 589–599. [Google Scholar] [CrossRef]
- Bao, H.; Yu, M.; Xu, L.; Saafi, M.; Ye, J. Experimental study and multi-physics modelling of concrete under supercritical carbonation. Constr. Build. Mater. 2019, 227, 116680. [Google Scholar] [CrossRef]
- Hubler, M.H.; Wendner, R.; Bažant, Z.P. Comprehensive database for concrete creep and shrinkage: Analysis and recommendations for testing and recording. ACI Mater. J. 2015, 112, 547–558. [Google Scholar] [CrossRef]
- Il Choi, J.; Lee, Y.; Kim, Y.Y.; Lee, B.Y. Image-processing technique to detect carbonation regions of concrete sprayed with a phenolphthalein solution. Constr. Build. Mater. 2017, 154, 451–461. [Google Scholar] [CrossRef]
- Damasceno Costa, A.R.; Pereira Gonçalves, J. Accelerated carbonation of ternary cements containing waste materials. Constr. Build. Mater. 2021, 302, 124159. [Google Scholar] [CrossRef]
- Wang, T.; Huang, H.; Hu, X.; Fang, M.; Luo, Z.; Guo, R. Accelerated mineral carbonation curing of cement paste for CO2 sequestration and enhanced properties of blended calcium silicate. Chem. Eng. J. 2017, 323, 320–329. [Google Scholar] [CrossRef]
- Lu, B.; Shi, C.; Cao, Z.; Guo, M.; Zheng, J. Effect of carbonated coarse recycled concrete aggregate on the properties and microstructure of recycled concrete. J. Clean. Prod. 2019, 233, 421–428. [Google Scholar] [CrossRef]
- Morandeau, A.; Thiéry, M.; Dangla, P. Investigation of the carbonation mechanism of CH and C-S-H in terms of kinetics, microstructure changes and moisture properties. Cem. Concr. Res. 2014, 56, 153–170. [Google Scholar] [CrossRef]
- Sevelsted, T.F.; Skibsted, J. Carbonation of C-S-H and C-A-S-H samples studied by 13C, 27Al and 29Si MAS NMR spectroscopy. Cem. Concr. Res. 2015, 71, 56–65. [Google Scholar] [CrossRef]
- Monkman, S.; Kenward, P.A.; Dipple, G.; MacDonald, M.; Raudsepp, M. Activation of cement hydration with carbon dioxide. J. Sustain. Cem. Mater. 2018, 7, 160–181. [Google Scholar] [CrossRef]
- Ahmad, S.; Assaggaf, R.A.; Maslehuddin, M.; Al-Amoudi, O.S.B.; Adekunle, S.K.; Ali, S.I. Effects of carbonation pressure and duration on strength evolution of concrete subjected to accelerated carbonation curing. Constr. Build. Mater. 2017, 136, 565–573. [Google Scholar] [CrossRef]
- Drouet, E.; Poyet, S.; Le Bescop, P.; Torrenti, M.J.; Bourbon, X. Carbonation of hardened cement pastes: Influence of temperature. Cem. Concr. Res. 2019, 115, 445–459. [Google Scholar] [CrossRef]
- Sáez del Bosque, I.F.; Van den Heede, P.; De Belie, N.; Sánchez de Rojas, M.I.; Medina, C. Carbonation of concrete with construction and demolition waste based recycled aggregates and cement with recycled content. Constr. Build. Mater. 2020, 234, 117336. [Google Scholar] [CrossRef]
- Santos, S.F.; Schmidt, R.; Almeida, A.E.F.S.; Tonoli, G.H.D.; Savastano, H. Supercritical carbonation treatment on extruded fibre—Cement reinforced with vegetable fibres. Cem. Concr. Compos. 2015, 56, 84–94. [Google Scholar] [CrossRef]
- Zhan, B.J.; Xuan, D.X.; Zeng, W.; Poon, C.S. Carbonation treatment of recycled concrete aggregate: Effect on transport properties and steel corrosion of recycled aggregate concrete. Cem. Concr. Compos. 2019, 104, 103360. [Google Scholar] [CrossRef]
- Yahui, Y.; Xu, G.; Bin, T. Carbonation characteristics of cement-based materials under the uniform distribution of pore water. Constr. Build. Mater. 2020, 275, 121450. [Google Scholar] [CrossRef]
- Dheilly, R.M.; Tudo, J.; Sebaibi, Y.; Quéneudec, M. Influence of storage conditions on the carbonation of powdered Ca(OH)2. Constr. Build. Mater. 2002, 16, 155–161. [Google Scholar] [CrossRef]
- Galan, I.; Glasser, F.P.; Baza, D.; Andrade, C. Assessment of the protective effect of carbonation on portlandite crystals. Cem. Concr. Res. 2015, 74, 68–77. [Google Scholar] [CrossRef]
- Bui, H.; Sebaibi, N.; Boutouil, M.; Levacher, D. Determination and review of physical and mechanical properties of raw and treated coconut fibers for their recycling in construction materials. Fibers 2020, 8, 37–55. [Google Scholar] [CrossRef]
- Fang, Y.; Chang, J. Microstructure changes of waste hydrated cement paste induced by accelerated carbonation. Constr. Build. Mater. 2015, 76, 360–365. [Google Scholar] [CrossRef]
- Chen, T.; Bai, M.; Gao, X. Carbonation curing of cement mortars incorporating carbonated fly ash for performance improvement and CO2 sequestration. J. CO2 Util. 2021, 51, 101633. [Google Scholar] [CrossRef]
- Malheiro, R.; Camões, A.; Meira, G.; Amorim, M.T. Influence of chloride contamination on carbonation of cement-based materials. Constr. Build. Mater. 2021, 296, 123756. [Google Scholar] [CrossRef]
- Chen, Y.; Liu, P.; Yu, Z. Effects of environmental factors on concrete carbonation depth and compressive strength. Materials 2018, 11, 2167. [Google Scholar] [CrossRef] [PubMed]
- Justnes, H.; Skocek, J.; Østnor, T.A.; Engelsen, C.J.; Skjølsvold, O. Microstructural changes of hydrated cement blended with fly ash upon carbonation. Cem. Concr. Res. 2020, 137, 106192. [Google Scholar] [CrossRef]
- von Greve-Dierfeld, S.; Lothenbach, B.; Vollpracht, A.; Wu, B.; Huet, B.; Andrade, C.; Medina, C.; Thiel, C.; Gruyaert, E.; Vanoutrive, H.; et al. Understanding the carbonation of concrete with supplementary cementitious materials: A critical review by RILEM TC 281-CCC. Mater. Struct. 2020, 53, 136. [Google Scholar] [CrossRef]
- Cultrone, G.; Sebastián, E.; Huertas, M.O. Forced and natural carbonation of lime-based mortars with and without additives: Mineralogical and textural changes. Cem. Concr. Res. 2005, 35, 2278–2289. [Google Scholar] [CrossRef]
- Zhang, X.; Chang, J. Effect of different hydration time on carbonation degree and strength of steel slag specimens containing zeolite. Materials 2020, 13, 3898. [Google Scholar] [CrossRef]
- Lin, R.-S.; Wang, X.-Y.; Yi-Han. Effects of cement types and addition of quartz and limestone on the normal and carbonation curing of cement paste. Constr. Build. Mater. 2021, 305, 124799. [Google Scholar] [CrossRef]
- Trtnik, G.; Turk, G.; Kavčič, F.; Bosiljkov, V.B. Possibilities of using the ultrasonic wave transmission method to estimate initial setting time of cement paste. Cem. Concr. Res. 2008, 38, 1336–1342. [Google Scholar] [CrossRef]
- Ye, G.; Lura, P.; Van Breugel, K.; Fraaij, A.L.A. Study on the development of the microstructure in cement-based materials by means of numerical simulation and ultrasonic pulse velocity measurement. Cem. Concr. Compos. 2004, 26, 491–497. [Google Scholar] [CrossRef]
- Kim, G.; Kim, J.Y.; Kurtis, K.E.; Jacobs, L.J.; Le Pape, Y.; Guimaraes, M. Quantitative evaluation of carbonation in concrete using nonlinear ultrasound. Mater. Struct. Constr. 2016, 49, 399–409. [Google Scholar] [CrossRef]
- Villarreal, A.; Cosmes-López, M.; León-Martínez, F.M.; Castellanos, F.; Solis-Najera, S.E.; Medina, L. Ultrasonic phase velocity of carbonated cement paste probes. Appl. Acoust. 2019, 154, 129–134. [Google Scholar] [CrossRef]
- Liu, S.; Shen, P.; Xuan, D.; Li, L.; Sojobi, A.; Zhan, B.; Poon, C.S. A comparison of liquid-solid and gas-solid accelerated carbonation for enhancement of recycled concrete aggregate. Cem. Concr. Compos. 2021, 118, 103988. [Google Scholar] [CrossRef]
- Chi, J.M.; Huang, R.; Yang, C.C. Effects of carbonation on mechanical properties and durability of concrete using accelerated testing method. J. Mar. Sci. Technol. 2002, 10, 14–20. [Google Scholar] [CrossRef]
- Andrade, C. Evaluation of the degree of carbonation of concretes in three environments. Constr. Build. Mater. 2020, 230, 116804. [Google Scholar] [CrossRef]
- Jang, J.G.; Lee, H.K. Microstructural densification and CO2 uptake promoted by the carbonation curing of belite-rich Portland cement. Cem. Concr. Res. 2016, 82, 50–57. [Google Scholar] [CrossRef]
- Mi, R.; Pan, G.; Li, Y.; Kuang, T. Carbonation degree evaluation of recycled aggregate concrete using carbonation zone widths. J. CO2 Util. 2021, 43, 101366. [Google Scholar] [CrossRef]
- Zhu, C.; Fang, Y.; Wei, H. Carbonation-cementation of recycled hardened cement paste powder. Constr. Build. Mater. 2018, 192, 224–232. [Google Scholar] [CrossRef]
- Andersson, R.; Stripple, H.; Gustafsson, T.; Ljungkrantz, C. Carbonation as a method to improve climate performance for cement-based material. Cem. Concr. Res. 2019, 124, 105819. [Google Scholar] [CrossRef]
- Henrique, G.; Tonoli, D.; Fernando, G.; Alexandre, C.; Savastano, H. Influence of the initial moisture content on the carbonation degree and performance of fiber-cement composites. Constr. Build. Mater. 2019, 215, 22–29. [Google Scholar] [CrossRef]
- Rostami, V.; Shao, Y.; Boyd, A.J.; He, Z. Microstructure of cement paste subject to early carbonation curing. Cem. Concr. Res. 2012, 42, 186–193. [Google Scholar] [CrossRef]
- Asano, S.; Kamatani, Y.; Inoue, Y. On the carbonation of calcium silicate compounds. J. Ceram. Assoc. Jpn. 1971, 79, 303–311. [Google Scholar] [CrossRef]
- Matsushita, F.; Aono, Y.; Shibata, S. Carbonation degree of autoclaved aerated concrete. Cem. Concr. Res. 2000, 30, 1741–1745. [Google Scholar] [CrossRef]
- Li, J.; Yu, Q.; Huang, H.; Yin, S. Effects of Ca/Si ratio, aluminum and magnesium on the carbonation behavior of calcium silicate hydrate. Materials 2019, 12, 1268. [Google Scholar] [CrossRef] [PubMed]
- Qin, L.; Gao, X.; Chen, T. Influence of mineral admixtures on carbonation curing of cement paste. Constr. Build. Mater. 2019, 212, 653–662. [Google Scholar] [CrossRef]
- Phung, Q.T.; Maes, N.; Jacques, D.; Bruneel, E.; Van Driessche, I.; Ye, G.; De Schutter, G. Effect of limestone fillers on microstructure and permeability due to carbonation of cement pastes under controlled CO2 pressure conditions. Constr. Build. Mater. 2015, 82, 376–390. [Google Scholar] [CrossRef]
- Xian, X.; Shao, Y. Microstructure of cement paste subject to ambient pressure carbonation curing. Constr. Build. Mater. 2021, 296, 123652. [Google Scholar] [CrossRef]
- Villain, G.; Thiery, M.; Platret, G. Measurement methods of carbonation profiles in concrete: Thermogravimetry, chemical analysis and gammadensimetry. Cem. Concr. Res. 2007, 37, 1182–1192. [Google Scholar] [CrossRef]
- Villain, G.; Thiery, M. Gammadensimetry: A method to determine drying and carbonation profiles in concrete. NDT E Int. 2006, 39, 328–337. [Google Scholar] [CrossRef]
- Huntzinger, D.N.; Gierke, J.S.; Komar Kawatra, S.; Eisele, T.C.; Sutter, L.L. Carbon dioxide sequestration in cement kiln dust through mineral carbonation. Environ. Sci. Technol. 2009, 43, 1986–1992. [Google Scholar] [CrossRef]
- Dapkus, G.; Stankevicius, V. Cellular concrete carbonation: Effect on moisture absorption of building envelopes. Batim. Int. Build. Res. Pract. 1985, 13, 184–187. [Google Scholar] [CrossRef]
- Iwasaki, M.; Tada, S. Carbonation of aerated concrete. In Proceedings of the 1985 Beijing International Symposium on Cement and Concrete, Beijing, China, 14–17 May 1985; Volume 3, pp. 414–423. [Google Scholar]
- Andrade, C.; Sanjuán, M.Á. Updating carbon storage capacity of Spanish cements. Sustainability 2018, 10, 4806. [Google Scholar] [CrossRef]
- Song, B.; Shi, C.; Hu, X.; Ouyang, K.; Ding, Y.; Ke, G. Effect of early CO2 curing on the chloride transport and binding behaviors of fly ash-blended Portland cement. Constr. Build. Mater. 2021, 288, 123113. [Google Scholar] [CrossRef]
- Tu, Z.; Shi, C.; Farzadnia, N. Effect of limestone powder content on the early-age properties of CO2-cured concrete. J. Mater. Civ. Eng. 2018, 30, 04018164. [Google Scholar] [CrossRef]


Disclaimer/Publisher’s Note: The statements, opinions and data contained in all publications are solely those of the individual author(s) and contributor(s) and not of MDPI and/or the editor(s). MDPI and/or the editor(s) disclaim responsibility for any injury to people or property resulting from any ideas, methods, instructions or products referred to in the content. |
© 2023 by the authors. Licensee MDPI, Basel, Switzerland. This article is an open access article distributed under the terms and conditions of the Creative Commons Attribution (CC BY) license (https://creativecommons.org/licenses/by/4.0/).