1. Introduction
Automated network systems have globally adopted the idea of modern technologies in various fields to ease their operations and for the collection of large amounts of big data. The Internet of Things (IoT) is the next level of information technology (IT) development that can be used to connect the world, ranging from a straightforward to a unique application to an IoT-based system. IoT is a collection of integrated devices that are cloud-connected and are used by customers to receive IT services by fusing internet protocol with electronics-related properties [
1]. The protocols used in IoT systems may include cybersecurity issues [
2] that could affect the entire system. The devices connected to the Internet Industrial of Things (IIoT) are open to assault by cybercriminals because they do not have the most basic security measures. That suggests they are vulnerable to hacking and botnet attacks, which are used to launch DDoS attacks against industries [
3].
However, it is crucial to identify and effectively categorize cyberattacks that cross these security gaps. Therefore, utilizing an ensemble of ML models, this study attempts to develop an accurate and effective Intrusion Detection system (IDSs) to recognize and categorize cyberattacks on an IoT/IIoT network. The learning-based methodology adopted will use tree-based ensemble classifiers, such as eXtreme gradient boosting (XGBoost), Bagging, extra trees (ET), random forest (RF), and AdaBoost, learned on the seven Telemetry data of TON IoT datasets: Fridge, Thermostat, GPS Tracker, Modbus, Motion Light, Garage Door, and Weather devices datasets. For supervised learning issues, tree-based ensemble models are frequently used [
2]. The power of ensemble classifiers depends on their capacity to combine many models’ predictions to develop an improved model over a single model. When the foundational learners are distinct from one another, tree-based ensemble approaches operate at their best, which can be accomplished through randomization [
4] or by employing significantly distinct training procedures for each decision tree.
Greater tree diversity results from randomization in tree growth, which also lowers correlation, i.e., increasing the independence of the decision trees. However, because each classifier in an ensemble technique must be trained, it can be computationally expensive. If there is a huge dataset involved, this cost may increase significantly. As a result, we concentrate on the widely used ensemble of ML models in the literature, particularly XGBoost, due to its efficiency and scalability. There are many different traffic aspects in the IoTs’ noisy collected network traffic. Building models for ML-based models takes more time, and because IoT network traffic contains a multitude of features, they have an impact on IDS functionality and performance [
5]. Feature selection is required to effectively develop cost-efficient and time-safe models for intrusion detection in IoT [
6,
7]. The study used criteria, including accuracy, recall, precision, F1-score, and confusion matrix, to evaluate how well the models performed.
Researchers have created and used various machine learning (ML)-based models, frequently combining them with feature selection methods to perhaps enhance their functionality and performance. Promising outcomes for the identification capabilities of ML have been produced using a set of performance metrics, but, for actual industrial IoT networks, these models are not yet trustworthy. This study strategy is to outperform cutting-edge outcomes for a particular dataset instead of learning more about a ML-based IDS application [
8]. As a result, there has been far more academic study done than there has been done in other fields where deployments took place. This may result from high errors generated when compared to other fields [
8]. Hence, these are unreliable for use in a real-world setting. Furthermore, using a single dataset with various features could be difficult to collect or store in a real-time IoT network connection. Besides, when using ML-based methods, their hyper-parameters, in most cases, require optimization for a better result. The optimization of hyper-parameters and feature selection will generally make the ML-based techniques run more efficiently.
The necessity to minimize risk and potential threats to IIoT systems has recently attracted academic interest. Effective IDSs specifically designed for IoT applications must be created. For training and evaluating such IDSs, a current and comprehensive IIoT dataset is needed. For assessing IDS-enabled IIoT systems, however, there are insufficient benchmark IIoT datasets that can be easily accessed or obtained from the internet freely [
9,
10]. This study uses brand-new, data-driven IoT/IIoT real-world datasets to solve these issues. It contains a label feature that separates the attack and normal classes and a feature that categorizes the threat subclasses that attack IoT/IIoT network nodes for issues with several classifications [
11]. In addition, the TON_IoT dataset contains telemetry information for IoT and IIoT services [
12]. With various IIoT-based IDS datasets, this study intends to evaluate the generalizability of feature selection techniques and ensemble classifier combinations.
The following summarizes the main contributions of the study:
- ▪
To create the best cyberattack multiclass classification model in IIoT systems, a thorough approach is proposed.
- ▪
This study suggests a feature selection strategy for IDS in the IIoT, utilizing ranked features from the Chi-Square Statistical Model and analyzing the link between feature variance and detection accuracy.
- ▪
Seven (7) ToN-IoT-based Telemetry datasets were employed to evaluate how well the model performed. In addition, extensive investigations have assessed the performances of an ensemble of ML-based models using these seven datasets.
- ▪
The performance of the ensemble models was verified by comparing them with the baseline research, which used the datasets and other existing approaches that used the same datasets.
The remaining sections of this study are structured as follows:
Section 2 presents some related work in IoT/IIoT-based IDSs studies. The materials and methods used for the study are covered in
Section 3 of the study.
Section 4 outlines the outcomes of the experiment that was conducted. Finally,
Section 5 concludes the study and provides future perspectives.
2. Related Work
This section describes some state-of-the-art research on ML models and IDSs to classify attacks on IoT networks. The idea of intelligent devices, ranging from refrigerators, doors, GPS trackers, etc., is not new. This section recaps some existing works that are related to smart devices. Many researchers have used the IoT to suggest gadgets that can be remotely monitored for various activities. This IoT-based system has various attacks, such as threats at the device, network, or application layers, which can be exploited by an intruder [
11]. Various attacks can be launched against IoT-based networks, such as malware, SQL injection, scanning, DoS, malware, backdoor, ransomware, eavesdropping, and DDoS, among others, which are a few common cyberattack categories [
12]. These various attacks can be grouped according to origin and layer.
The processing and analyzing of various methods used for intrusion detection in networks and IoT-based applications play a key role in society. The evaluation of the accuracy and effectiveness of IIoT security solutions relies heavily on the related datasets used, which represent IoT-based operations in the physical realm [
12]. However, the major issue and challenge in evaluating IDSs specifically designed for IoT/IIoT purposes is the lack of real-world datasets that represent the IoT/IIoT application in the real world. The creation of IIoT-based IDSs is hampered by the lack of such datasets, considering that such strategies should perform well when empirically validated and evaluated [
13,
14]. The authors of [
15] reviewed publications based on ML-based and data mining models for IDS classification on cybersecurity. They claimed that a large gap in the literature prevents the development of effective anomaly-based intrusion detection methods since tagged datasets are not readily available. This is mostly because of privacy concerns, as most IoT statistics from big businesses are not shared with the academic community [
14].
A novel IoT traffic dataset called “Sensor480,” presented by the authors in [
16], contains 480 cases with three (3) properties of binary class normal and “Man-In-The-Middle” attacks. Based on this dataset, an IDS system was created and examined using various ML-based models. The dataset was split into 80–20% split ratios, and various performance metrics were used to appraise the proposed models, and DT outperforms other models with 100% performance accuracy. Additionally, authors in [
17] presented an IDS based on ML-based ensemble models to recognize various forms of IoT cyberattacks. Using the datasets from IoT-23 [
18], IoTDevNet [
19], DS2OS [
20], IoTID20 [
21], and IoT Botnet [
22], these models are evaluated based on a variety of performance indicators. With the highest accuracy values on the NSLKDD (99.27%), IoTDevNet (99.97%), DS2OS (99.39%), IoTID20 (99.99%), and IoT Botnet (99.991%) datasets, the outcome demonstrates that Bi-LSTM outperformed other models. However, most of the presented datasets are outdated and do not contain the recent IIoT-based intrusion attacks. The Windows 10 dataset from the ToN IoT [
12] was used by authors in [
23] to pick the best features. They used the correlation function and the ReliefF method of feature selection schemes. With accuracy scores of 94.12% for the correlation function dataset and 98.39% for the ReliefF dataset, the Medium NN model outperformed other models. The results of the proposed model by the authors show that there is a need for improvement in the areas of IDS accuracy. The model is still very slow and takes a huge part of the computer processor.
To decrease the characteristics of the Linux, Network, and Windows 7 and 10 multiclass datasets of the ToN-IoT dataset, the authors in [
24] presented the Chi2 approach and balanced the dataset for the best categorization using the synthetic minority oversampling (SMOTE) approach. They employed various ML-based models, with XGBoost outperforming all others on all datasets according to the numerous performance criteria they used to assess the suggested models. In [
25], the authors applied supervised and unsupervised ML over the NF-ToN-IoT-v2 dataset to provide a thorough model of a network IDS (NIDS). It was demonstrated that the technique XGBoost Classifier, which obtained a F-Score of 98.8%, produced the best results when supervised learning was used, as implemented by Azure automated ML (AML). The random forest classifier, with a F-Score of 98.6%, produced the greatest results when a specially designed automated ML (AE2EML) was used. The suggested ML-based NIDS obtained a Silhouette score of 0.553, a Calinski-Harabasz index of 1533106, and a Davies-Bouldin index of 0.631 using clustering with PCA (Principal Component Analysis), performed by PyCaret-automated ML. The proposed model by the study performed excellently, but it used old datasets that did not contain recent IIoT-based network attacks.
By examining the applicability of ML-based algorithms in the detection of abnormalities within the data of such networks, the authors of [
26] concentrated on the security element of IoT networks. It investigates ML algorithms that have been effectively applied in circumstances that are comparable to one another and contrasts them using a variety of factors and techniques. The RF algorithm produced the best results, with a 99.5% accuracy rate. The authors of [
27] presented an IDS with an ensemble classifier enabled by a feature selection classifier. The study utilized the Correlation Coefficient (CC) method for feature selection before classifying the dataset for the detection of various attacks using various classifiers, such as NB, DT, and ANN. On the UNSW-NB 15 datasets, the system detected DoS assaults with an accuracy of 98.54% with a classifier ensemble that uses a subset of the features. The dataset used to test the model is not an IIoT-based network nodes attacks dataset and does not employ feature selection methods to remove the irrelevant features from the dataset used, and the issue of imbalance data is not considered, thus reducing the performance of the model.
The authors in [
28] used the top 13 IG characteristics with the C5 classifier to obtain improved accuracy of 89.76% and a better FAR of 1.68. The study recommended that IG be used for choosing features for IDS. The top ten ranked IG attributes were used in the system to create a greater accuracy of 93.23% with 6.77% FAR. The authors obtained six reduced features in [
29] using the multi-objective feature selection method on the CICIDS 2017 dataset. The system delivered an accuracy of 99.90% using an ELM classifier. To detect cyberattacks, the study authors in [
30] suggested using LSTM networks enabled with parameter optimization, called Stochastic Gradient Descent (SGD), for the creation of IDS. The study obtained an accuracy of 99.91% for ISCX and 98.22% for AWID datasets, respectively.
The top 10 attributes of the GR technique were used in work by authors in [
31], and their layer design was validated on a generated dataset. In contrast to previous rules and tree-based learners, the design performed better with the J48 classifier for recognizing DoS assaults. A decision tree-based multi-layer framework to identify DDoS attacks was provided in the study of authors in [
32]. The system recognized ICMP, TCP, and UDP flood attacks on a created dataset, with an accuracy of 99.98%, using eight features that were explicitly picked. The authors in [
33] utilized nature-inspired techniques for feature selection with forecasting and chaos methods. The performance of the model was evaluated using the NS-3 created model. For the identification of DoS assaults at the transport and application layers, the approach obtained a detection rate (DR) of 94.3%. The authors employed the wrapper feature selection approach in [
34] for feature selection in IDS. The study performance was tested using the honeypot Cowrie dataset, with various cyberattacks, with an accuracy of 97.4% using the SVM classifier.
The effectiveness of the PCA and the results obtained without it were compared by the authors in [
35]. Prior to being used in various ML-based techniques, the dataset was first submitted to Principal Component Analysis (PCA) for feature selection. This experimental investigation demonstrates that utilizing PCA reduces algorithm execution time greatly, with a smaller number of features, while producing the same results as not using PCA. In addition, when compared to SVM, the DT and RF algorithms accurately classified DDoS packets. Matplotlib was used to create a graph to display the results. The IoT-23 dataset was used for our experimental analysis. The authors in [
36] developed an IDS model based on a hybrid AI model for the classification of attacks for an IoT-based system. The CIC-IDS2017 and UNSW-NB15 datasets were used to evaluate the performance of the suggested model. The model fared better, with a detection rate of 99.75% and an accuracy of 99.45%.
The authors of [
6] presented a hybrid rule-based feature selection DL-based IDS paradigm for IIoT to train and validate data extracted from TCP/IP packets. A hybrid rule-based feature selection and deep feedforward neural network model were used to implement the training procedure. NSL-KDD and UNSW-NB15, two well-known network datasets, were used to test the suggested approach. According to the findings of the performance comparison, the suggested strategy outperforms other pertinent methods in terms of accuracy, detection rate, and FPR by 99.0%, 99.0%, and 1.0%, respectively, for the NSL-KDD dataset, and by 98.9%, 99.9%, and 1.1%, for the UNSW-NB15 dataset. The recommended method is suitable for IIOT intrusion network attack classification, according to simulated trials utilizing a variety of assessment metrics.
The authors of [
37] proposed the RDTIDS intrusion detection system (IDS) for IoT networks. The RDTIDS integrates multiple classifier methodologies, such as REP Tree, JRip algorithm, and Forest PA, which are based on decision tree and rules-based principles. The first and second methods specifically classify the network traffic as attack/benign by using features from the data set as inputs. The outputs of the first and second classifiers are used as inputs for the third classifier, together with characteristics from the initial data set. The extensive experiments demonstrate the proposed IDS’ effectiveness over existing state-of-the-art schemes in terms of accuracy, detection rate, false alarm rate, and time overhead. These findings were made using the CICIDS2017 dataset and the BoT-IoT dataset.
Authors in [
38] suggested a novel ensemble of Hybrid IDSs for IoT device security by fusing a C5 classifier and a One-Class Support Vector Machine classifier. The benefits of Signature IDS and Anomaly-based IDS are combined in HIDS. With high detection accuracy and low false-alarm rates, this system seeks to identify both known intrusions and zero-day threats. The Bot-IoT dataset, which includes legal IoT network traffic and various assaults, is used to assess the proposed HIDS. Studies reveal that, compared to SIDS and AIDS approaches, the proposed hybrid IDS offers a higher detection rate and a reduced percentage of false positives.
To identify out-of-norm actions for cyber threat hunting in the IIoT, the authors of [
39] presented an ensemble DL-based model that combines LSTM with the Auto-Encoder (AE) architecture. Additionally, most of the prior literature did not consider the uneven nature of IIoT datasets, which led to low accuracy and performance. The suggested approach takes fresh, balanced data from the unbalanced datasets and feeds these new balanced data into the deep LSTM AE anomaly detection model to resolve this issue. In addition, the advanced related models Stacked Auto-Encoders (SAE), Naive Bayes (NB), Projective Adaptive Resonance Theory (PART), Convolutional Auto-Encoder (C-AE), and Package Signatures (PS) based LSTM (PS-LSTM), are compared to the proposed ensemble model.
In the reviewed literature, it was observed that almost all the studies used ISCX, CICIDS, UNSW-NB15, and KDD Cup 199, which are non-IoT/IIoT-based datasets. They are datasets for network intrusions that contain HTTP DoS assaults. The IEEE 802.11-related Madiun Access Control (MAC) Layer attacks are part of the AWID dataset. This study acquired datasets containing network traffic, operating system traces, and IoT telemetry data from diverse IoT/IIoT source materials. Additionally, the suggested dataset includes various valid and malicious IoT-related events, incorporating the reality of attacks and legal occurrences.
This study proposes a feature selection-based IDS enabled with various ensemble classifiers for detecting several attacks in an IIoT-based network. Very little research using the TON-IoT dataset is shown in this review. When the ML-based ensemble model was compared with the baseline findings, it was discovered that the frequently misclassified assaults are not discussed. The proposed ensemble classifiers enabled with feature selection will be applied to the IoT telemetry datasets, and the results of the proposed models will be compared with the baseline analysis.
3. Materials and Methods
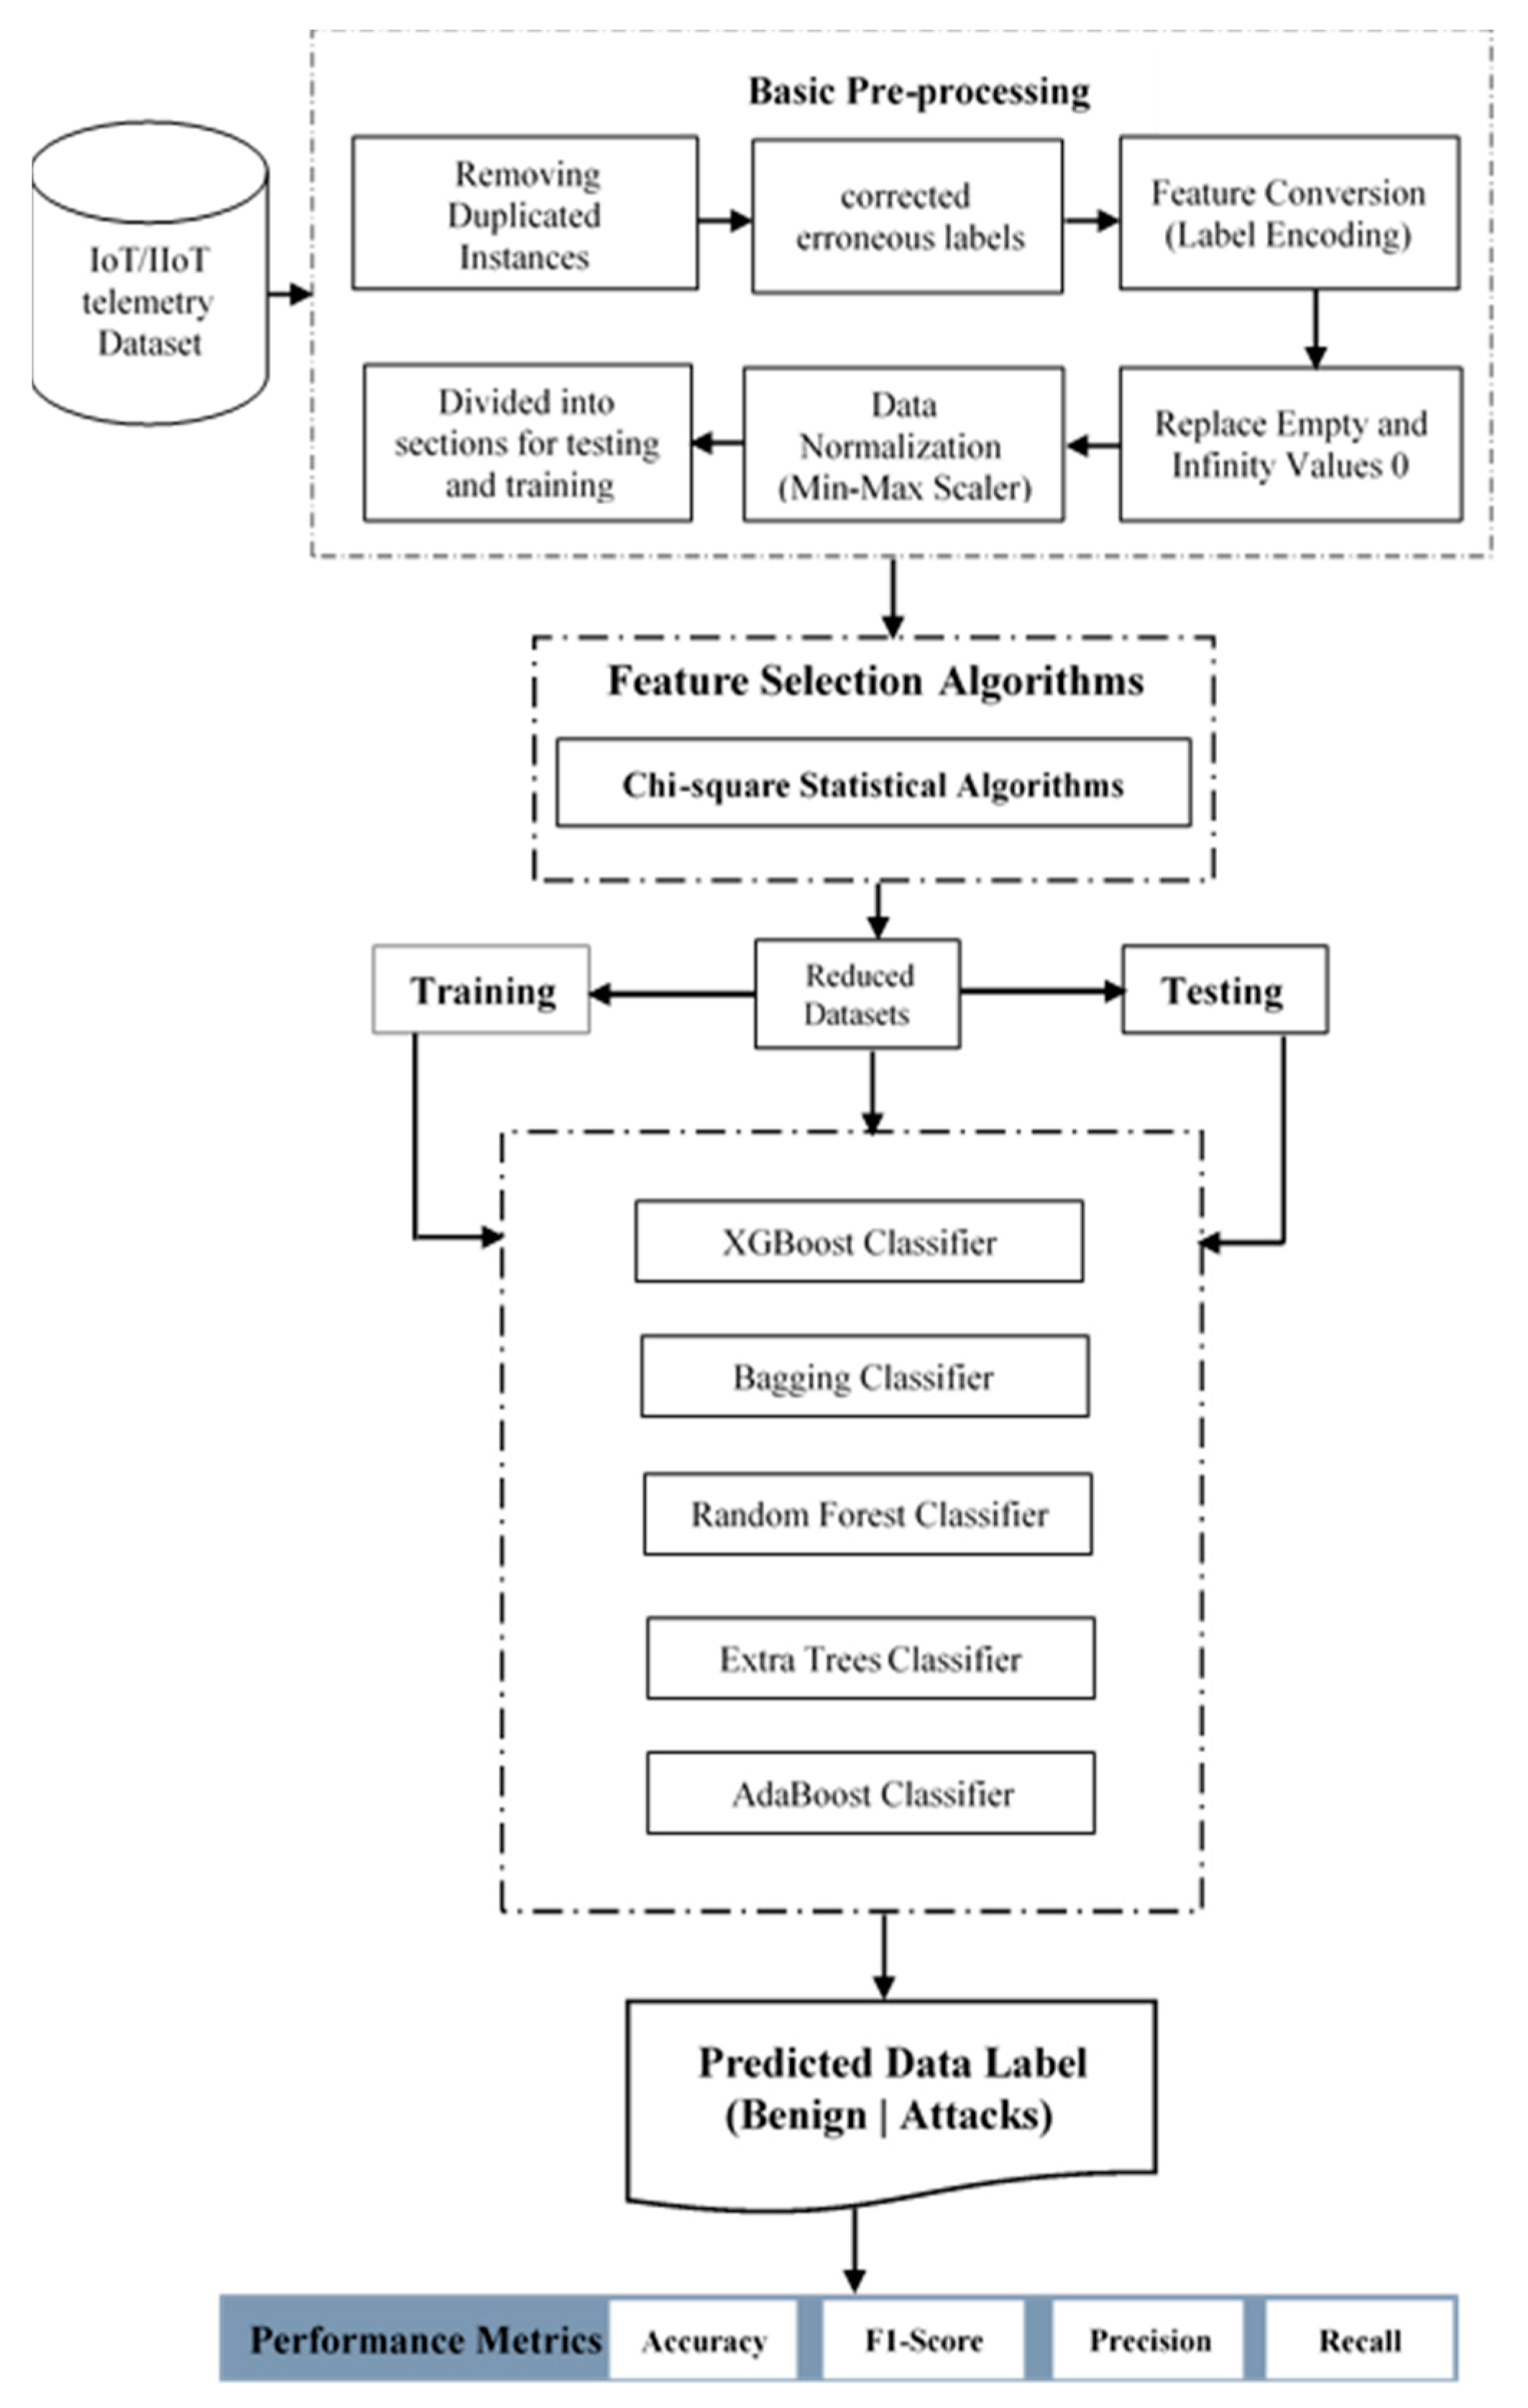
This section describes a robust framework to detect and classify cyberattacks on IoT network trails. The ensemble classifier process in various successive steps is displayed in
Figure 1, and preprocessing is the first step. At this stage, the dataset is explored for the number of instances, the number of features, the relationship between the features, the correlation between the features, etc. The details of the dataset used for the performance evaluation were discussed, followed by the details of the performance metrics used for evaluation purposes. Finally, a training and testing dataset was created from the cleaned dataset. The ensemble models use the training set to learn, while the test set is used to assess the performance of the model.
3.1. Data Preprocessing
Data preprocessing is a serious first step in streamlining the training of ML models. For the purpose of research, all datasets are openly accessible for download. To minimize storage space requirements and to prevent redundancy, duplicate samples (flows) are eliminated. The flow identifiers, IP addresses, ports, and timestamps are eliminated to eliminate forecast bias against the attackers within end network nodes. Then, using a categorical encoding approach, numerical values are assigned to the strings and non-numeric characteristics. The features in these datasets include protocols and services, which have been compiled as their native string values, as well as ensemble classifiers. However, these are built to function effectively with numerical data.
Hot encoding and label encoding are the two primary methods for encoding the features. The former adds X features to a feature to convert it into X categories, utilizing 0 to indicate that a category is not present and 1 to indicate it is. Nevertheless, this enhances the dataset’s dimensionality, which could impact the ML models’ effectiveness and performance. Hence, each category is converted to an integer using the label encoding technique.
Categorical features were converted to numerical values for straightforward ML technique application. For instance, the categorical values “open” and “closed” for the door state feature from the GarageDoor dataset were converted into “0” and “1”. Furthermore, duplicate, incompatible, and missing values were effectively handled. Additionally, this process permits the equal weighting of all features because network traffic properties are complex, and there are higher numbers than others. This could cause the ensemble model to weigh them more heavily, so it will pay attention to them. The min-max scaler uses Equation (1) to calculate all values for each feature, where
is a new feature value between 0 and 1, and X represents the unique feature value, where the feature maximum and minimum values are
, respectively. Segments for training and testing are separated from the dataset, and these components are categorized according to the label features, which are crucial given the class imbalances of the datasets.
3.2. The Chi-Square Statistical Feature Selection Model
This method was used in this study to select the most relevant features. The two most prominent variables are usually involved in using this model for feature selection. Typically, they relate to the likelihood of occurrence of category C based on the likelihood of occurrence of feature t. In IDS classification, it is considered whether attributes t and C are independent in the proposed approach. Unless features t and C contradict, characteristic t cannot be used to determine if a label falls under category C. It might be difficult to determine the degree of t and C in training, especially if they are not linked. Therefore, their relevance can be evaluated using the Chi-square test. Using a statistical method called Chi-square, it is possible to quantify the connection between feature t and category C. A bidirectional queue was used to express a label feature called t and a category called C.
Assuming feature t and type C, then the first-order degree of freedom chi-square distribution matches. The higher the category C chi-square score, the more category labels the feature holds. Therefore,
have a lot in common. The feature t category C chi-square score is then defined as follows:
The solution to Equation (2) demonstrated the relationship between feature t and category
. The more autonomous members of the class category,
, will be the feature t that matters. When
, then the label class,
, and feature, t, are independent. You can calculate the value for one class, symbolized by
, using Equation (3). However, by combining all of the classes of the value in feature label t in
, then, for each characteristic of instance t across all classes, we first determine the
. The number of m classes is then determined by testing feature t for each unique
score:
Equation (3) is used to calculate the mean
, the score for the feature label t across all classes.
For all classes, the maximum 2 of a feature, the label, is determined using Equation (4). The threshold value is used to determine the appropriate number of feature labels after the feature label has been sorted by the scores.
3.3. Machine Learning Model
This sub-section discusses the ensemble ML-based models used for detecting attacks in IIoT-based networks.
- (1)
Extreme Gradient Boosting (XGBoost)
XGBoost is a modified gradient tree-boosting algorithm that is efficient and scalable. The optimization problem in ensemble algorithms can be solved using the boosting classifiers, where one weaker learner is added in succession to create a new model to lower the classifier loss function and to progressively reduce the mistakes of earlier models [
40]. The exemplary features of the algorithm proposed by the authors in [
41] are the regularized model, split-seeking algorithm, column block structure, and cache-aware prefetching algorithm. Some current applications of XGBoost include genre classification of Nigerian songs [
42], predicting stock price [
43], and forecast gene expression value [
44].
- (2)
Bagging Classifier
A group meta-learner is the Bagging classification algorithm. The approach creates a large number of learners by training each unique base learner on a random subset of the actual dataset. The classifier then estimates the final prediction by averaging the results of all the models [
45]. This algorithm averages the probability values of base learners for regression tasks and applies the majority voting scheme to classify labels for the classification tasks. This algorithm starts by resampling the training data with replacements. This means that some instances may be selected again and again, while others may not. The strength of this meta-estimator is the reduction in the variance of the base learner by introducing randomness into the ensemble construction and generation method. Concurrent training is conducted on the randomly selected subset of the training set with the base learners using substitution using the initial dataset. Each base classifier’s training dataset is distinct from the datasets of the others.
- (3)
Random Forest (RF)
RF is a group of weak base learners that functions by building various collections of decision trees to enhance the DTs’ effectiveness and resilience [
46]. This technique combines the bagging approach of instance sampling with the random selection method for features in creating a collection of DTs with a controlled variation. To complete the classification task of an unlabeled instance, each DT in a set acts as a base learner. The algorithm uses majority voting for the classification task and probability averaging of instance values from the regression task. The RF algorithm is immune to noise and over-fitting and has been applied to several domains, including heart disease classification [
47] and label ranking [
48].
- (4)
Extremely Randomized Trees (Extra Trees)
Extra Tree is a collection of ML-based models that combine the classifications from several unpruned DTs on different sub-samples of the target to enhance generalization accuracy, being computationally efficient and preventing over-fitting [
49]. The entire training instance is used to grow trees, and the nodes at each tree are split by selecting the cut points fully at random. These predictions are made by using a majority voting scheme for classification tasks or averaging prediction values for regression tasks.
- (5)
Adaptive Boosting (AdaBoost)
AdaBoost is an ensemble of ML models adopting the boosting method by joining many weak learners to create a new model using the weighted linear combination method iteratively. To reweight examples of the real train data, it progressively uses a learning algorithm [
50]. Firstly, all instances are assigned the same weight. Weights are increased for cases that were incorrectly classified, while they are raised for instances that were correctly classified. This procedure is iterated continually by new weights of the training data on the base model. Finally, a linear combination of all the models generated through the various iterations is used to create the final classification model [
51]. This algorithm’s weakness is that it is sensitive to anomalies and noisy data.
3.4. Dataset
The study datasets include seven (7) ToN-IoT (
https://cloudstor.aarnet.edu.au/plus/s/ds5zW91vdgjEj9i?path=%2FProcessed_datasets%2FProcessed_Network_dataset (accessed on 5 June 2022)) datasets obtained from Telemetry. The IoT/IIoT-based network testbed was used to generate various operating systems and Network data. These 7 datasets were generated from various IIoT-based devices, such as GPS_Tracker, Weather, Garage_Door, Modbus, Fridge, Thermostat, and Motion_Light.
Table 1 presents all features of the seven (7) datasets, such as the smart fridge device, which measures the temperature and its adjustments below the on-demand. Based on a probabilistic input, the features of a remotely activated garage door when opened or closed. The components and features are based on the Global Positioning System (GPS) device, which tracks the geographical coordinates of a remote object. The features obtained are from the smart sense motion device. This uses a pseudo-randomly generated signal to either “on” or “off” the light. The features generated from the register in the Modbus service device are majorly used for industrial applications. These devices communicate via a master–slave arrangement. The characteristics of a smart thermostat regulate a system’s temperature by controlling the heating/cooling system, such as the air conditioner. The dataset of a weather monitoring system creates features, such as temperature, air pressure, and humidity in the data.
These ToN-IoT datasets were commonly labeled into binary categories of ‘normal’ or under ‘attack’. The ‘attack’ class is also further divided into seven (7) subclasses—Scanning, password, DDoS, injection, ransomware, Cross-site Scripting (XSS), and backdoor. The scanning class occurs at the initial stage, where the information about the target system is obtained by the attackers [
8,
52] using a scanning tool, such as Nmap [
53] or Nessus [
54]. The DoS attack [
8,
52] adopts the flooding strategy, where the attacker blasts off successive malicious attacks against a genuine user to disrupt their right to access service, while DDoS blasts off enormous successive connections to deplete the resources of the device memory, CPU, etc. These two similar attacks are usually blasted off by a vast network of hacked computers known as bots or botnets [
8,
55]. The Ransomware attack [
56] is a classical kind of malware that holds the access right of an authentic user to a system or service to ransom by encrypting their access and attempting to transfer the decryption key to restore the original user’s access to the service or system.
The Backdoor attack [
57] is a passive attack that uses backdoor software to give an opponent unauthorized remote access. The competitor utilizes this backdoor to manage the infected IIoT devices and to incorporate them into botnets to launch a DDoS attack [
57]. The Injection attack [
57,
58] often attempts to execute vindictive codes or implant vindictive data into the IIoT network to disrupt normal operation. Cross-Site Scripting (XSS) [
58] often tries to run vindictive commands on a seb server in the IIoT applications. The XSS lets the attacker insert random web scripts remotely into the IIoT system. The information and the authentication procedure between IIoT devices and the remote web server may be compromised by this attack. A typical Password Cracking Attack [
59] occurs when a rival applies password-cracking techniques to figure out an IIoT device’s passcode. The attacker will bypass the authentication system and compromise the IIoT devices [
57]. A common network attack that might disrupt the communication link between two devices is the MiTM attack [
13], which could alter their data. Examples of MiTM attacks include ICMP redirect, ARP Cache poisoning, and port theft [
12]. The datasets and their detailed descriptions are presented in
Table 1,
Table 2,
Table 3,
Table 4,
Table 5,
Table 6 and
Table 7. The seven (7) datasets have login dates for the IoT Telemetry data, login times for the IoT Telemetry data, and the record of the binary label of normal and attacks, where ‘0′ represents normal and ‘1′ represents attacks.
Table 2 gives details of each attack and the normal of the multi-class label of the entire dataset. The datasets are referred to as “ToN IoT”, since they comprise a variety of data sources, including Windows 7 and 10 operating system datasets, Ubuntu 14 and 18 TLS, and network traffic datasets, as well as telemetry datasets of IoT and IIoT sensors. The datasets were gathered from a large-scale, realistic network created at the UNSW Canberra @ Australian Defence Force Academy (ADFA) of Cyber Range and IoT Labs, School of Engineering and Information Technology (SEIT). The industrial 4.0 network, which consists of the IoT and IIoT networks, has a new testbed network. To manage the connection between the three levels of IoT, Cloud, and Edge/Fog systems, the testbed was deployed, utilizing several virtual machines and hosts of Windows, Linux, and Kali operating systems. On the IoT/IIoT network, several hacking methods, including DoS, DDoS, and ransomware, are used against web apps, IoT gateways, and computer systems. Network traffic, Windows audit traces, Linux audit traces, and telemetry data from IoT services were among the datasets collected in parallel processing to capture various regular and cyberattack events.
3.5. Performance Indicators
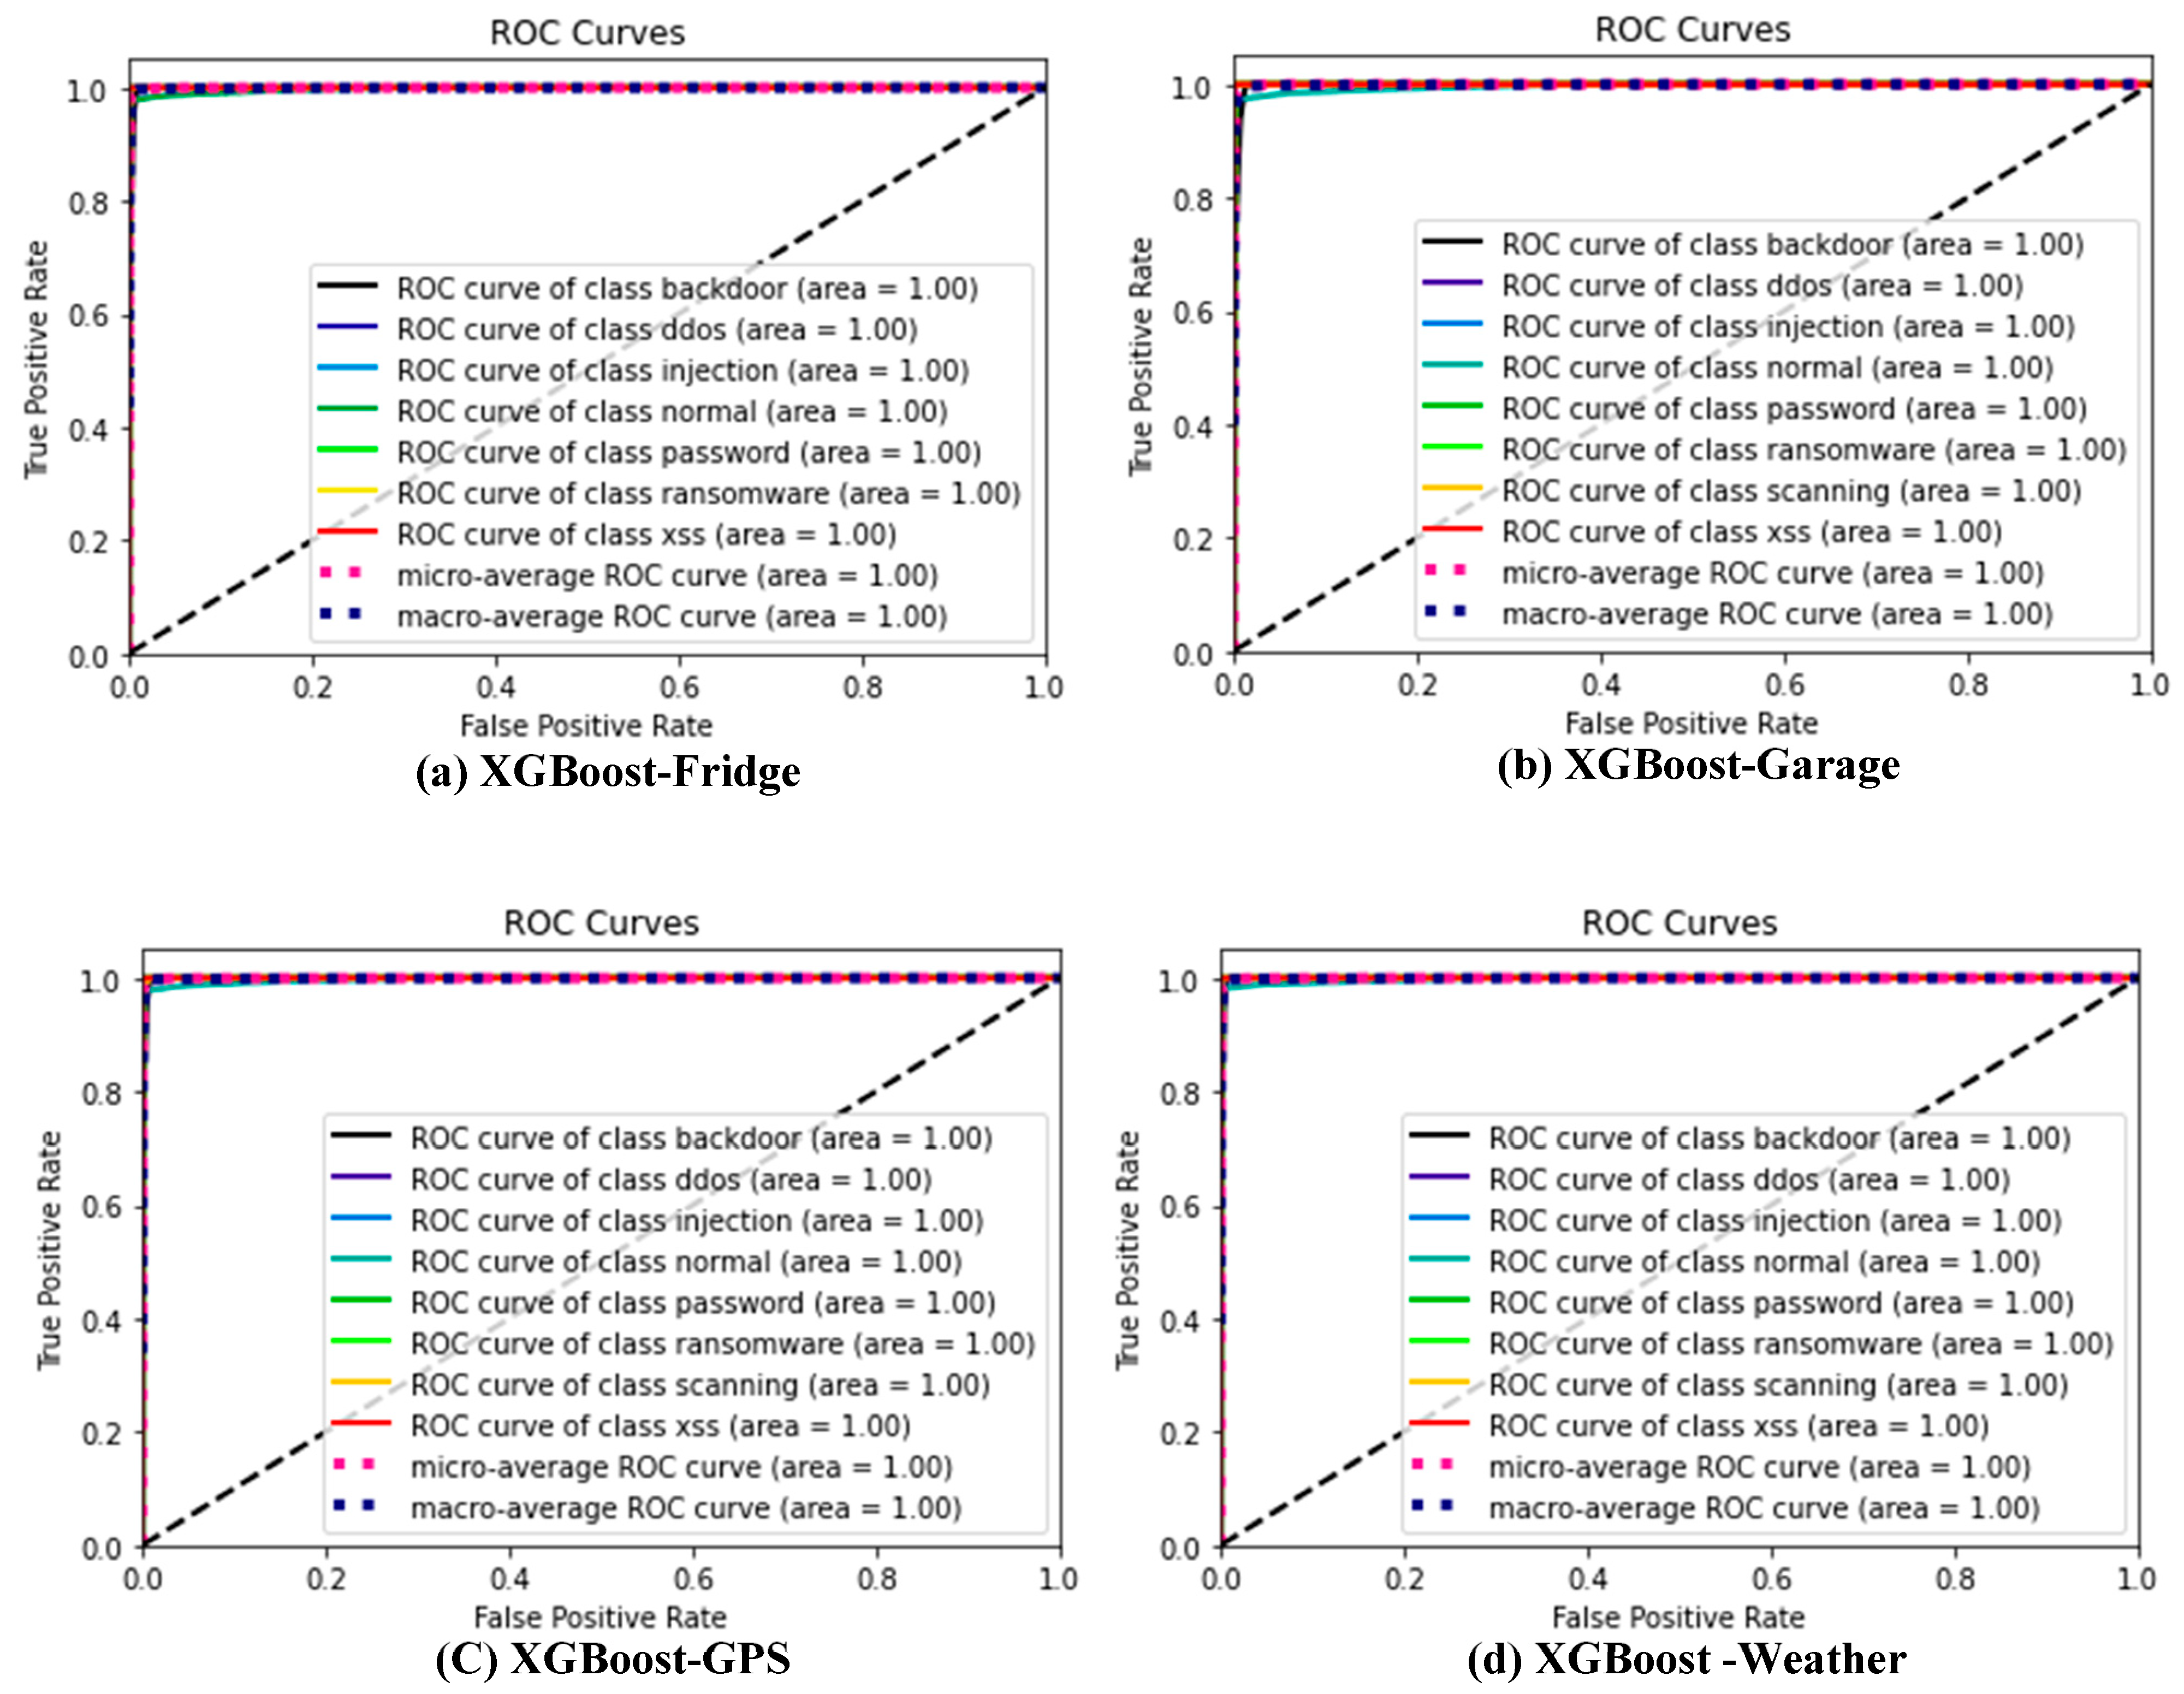
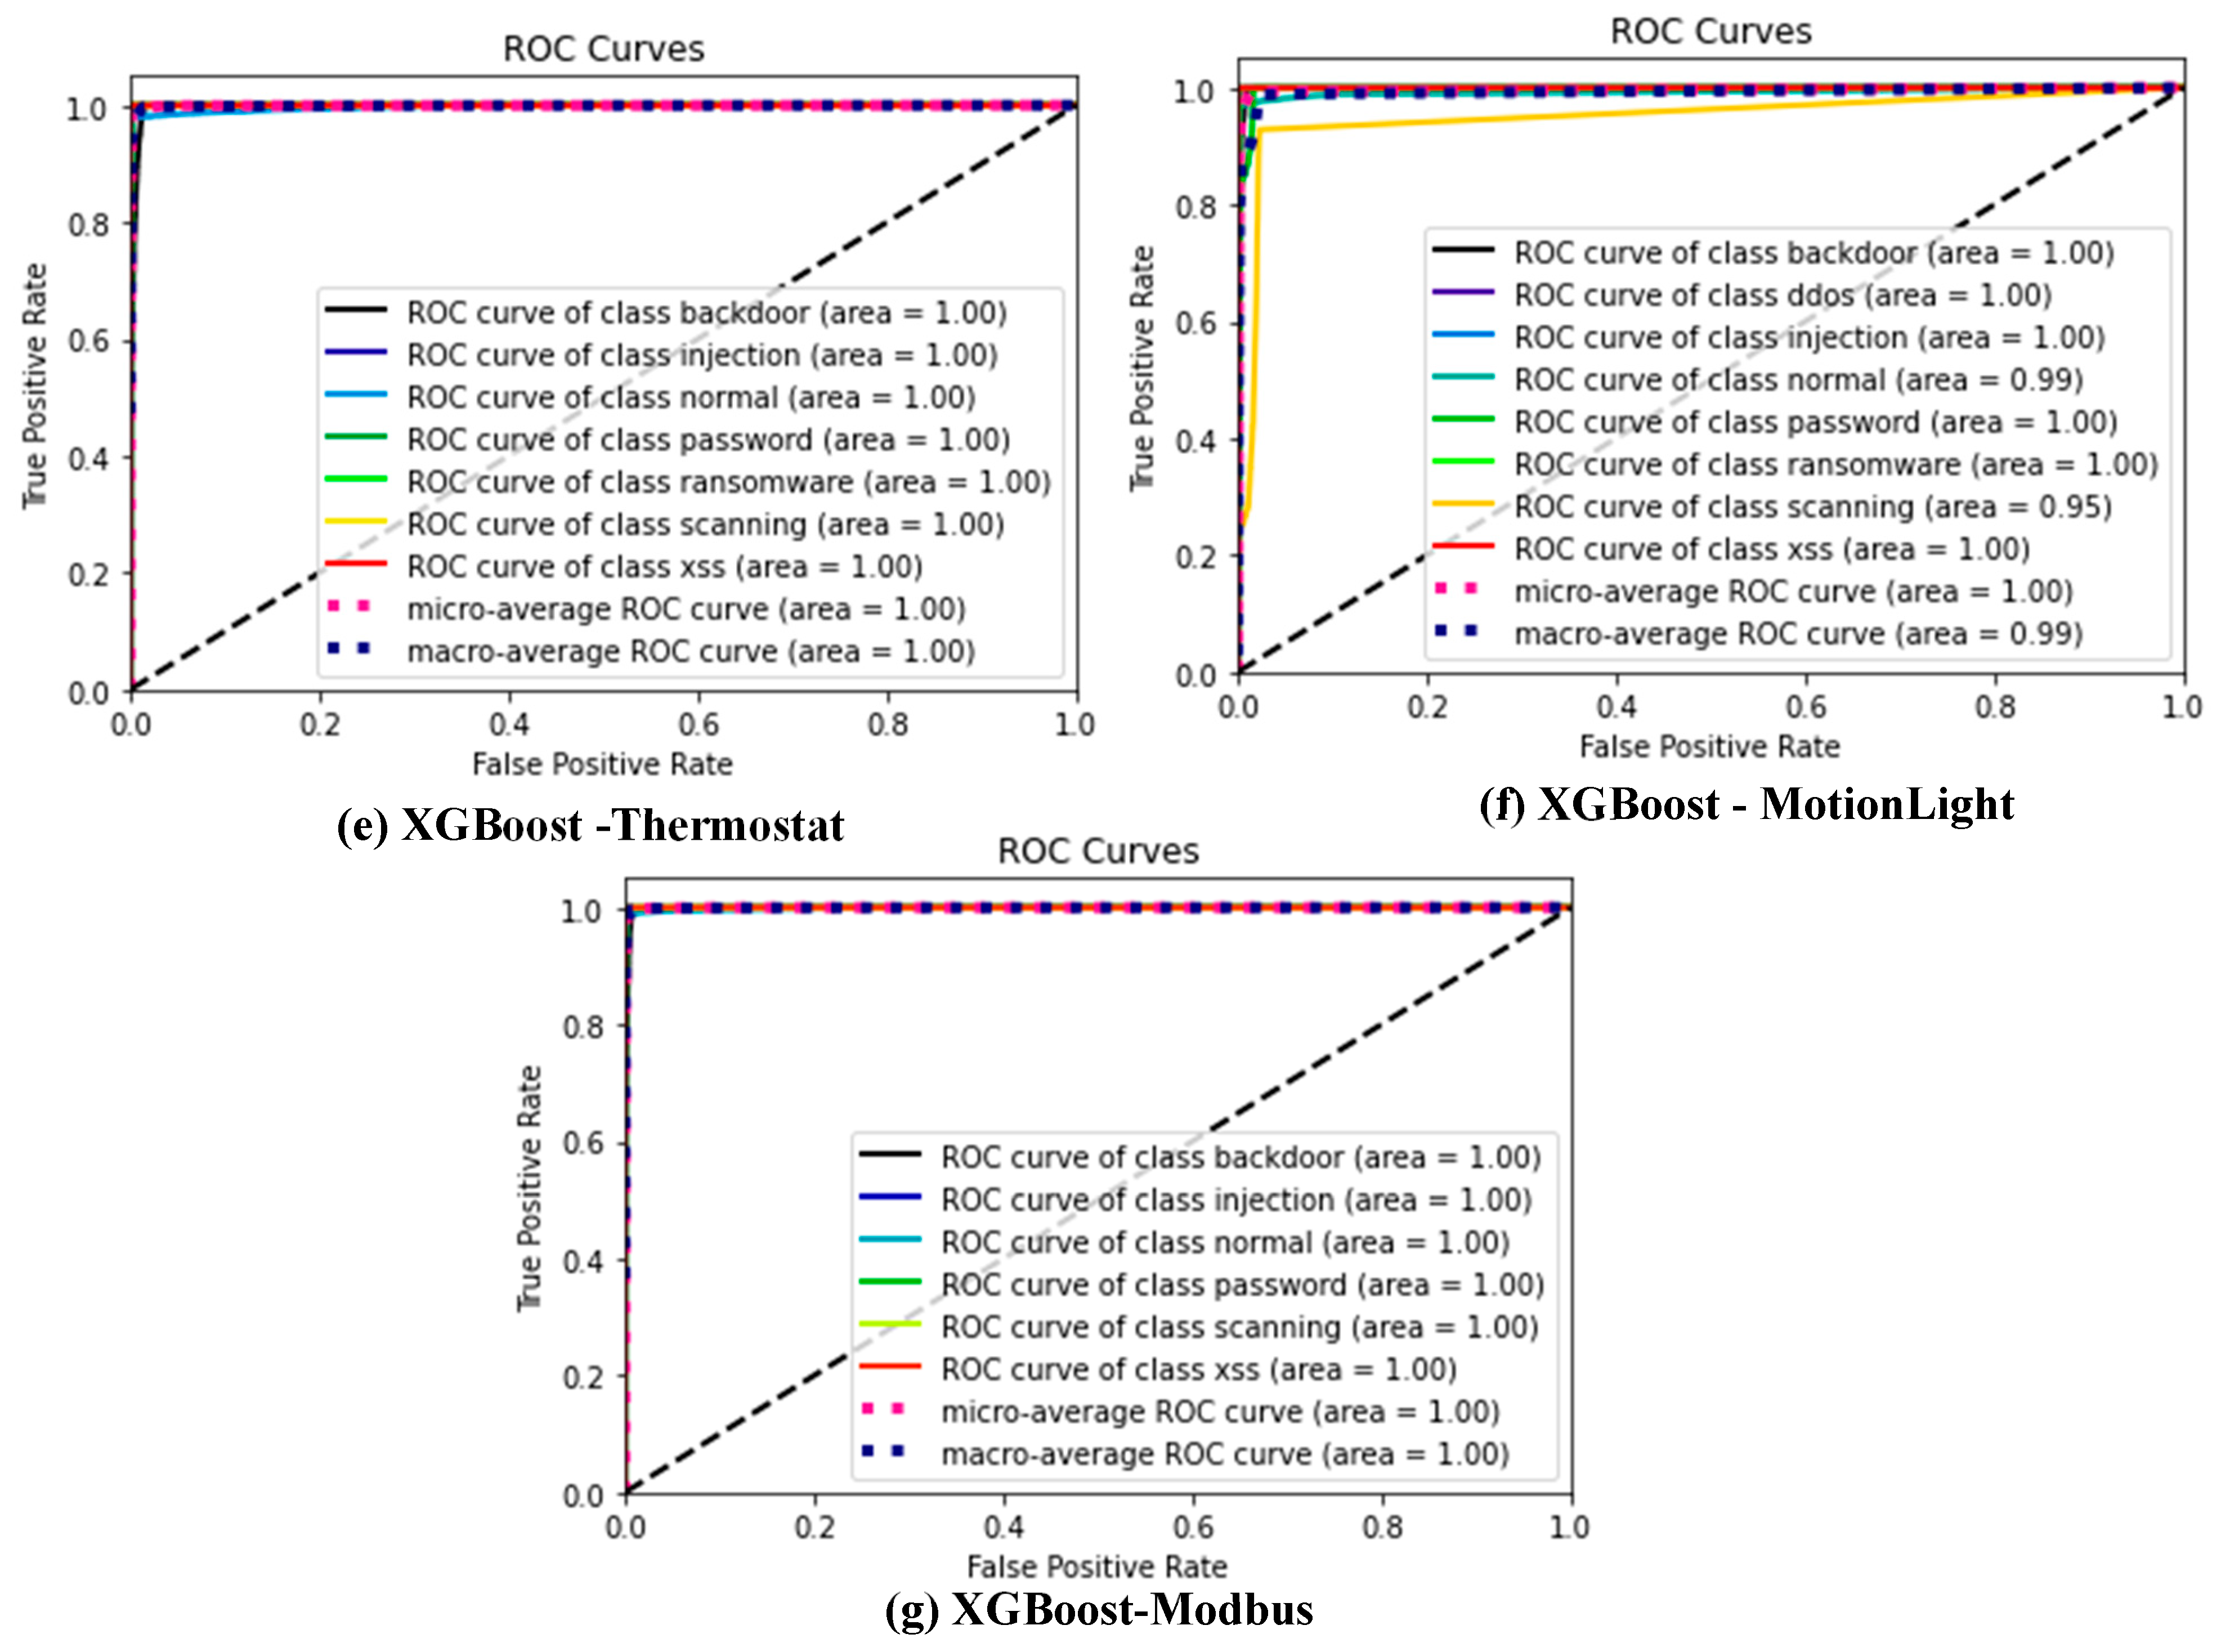
Many different performance indicators were used to assess the performance and effectiveness of ML models on the different datasets. Some commonly used indicators, which will also be adopted for this study, are confusion matrix, ROC_AUC, F1_score, recall, precision, and accuracy [
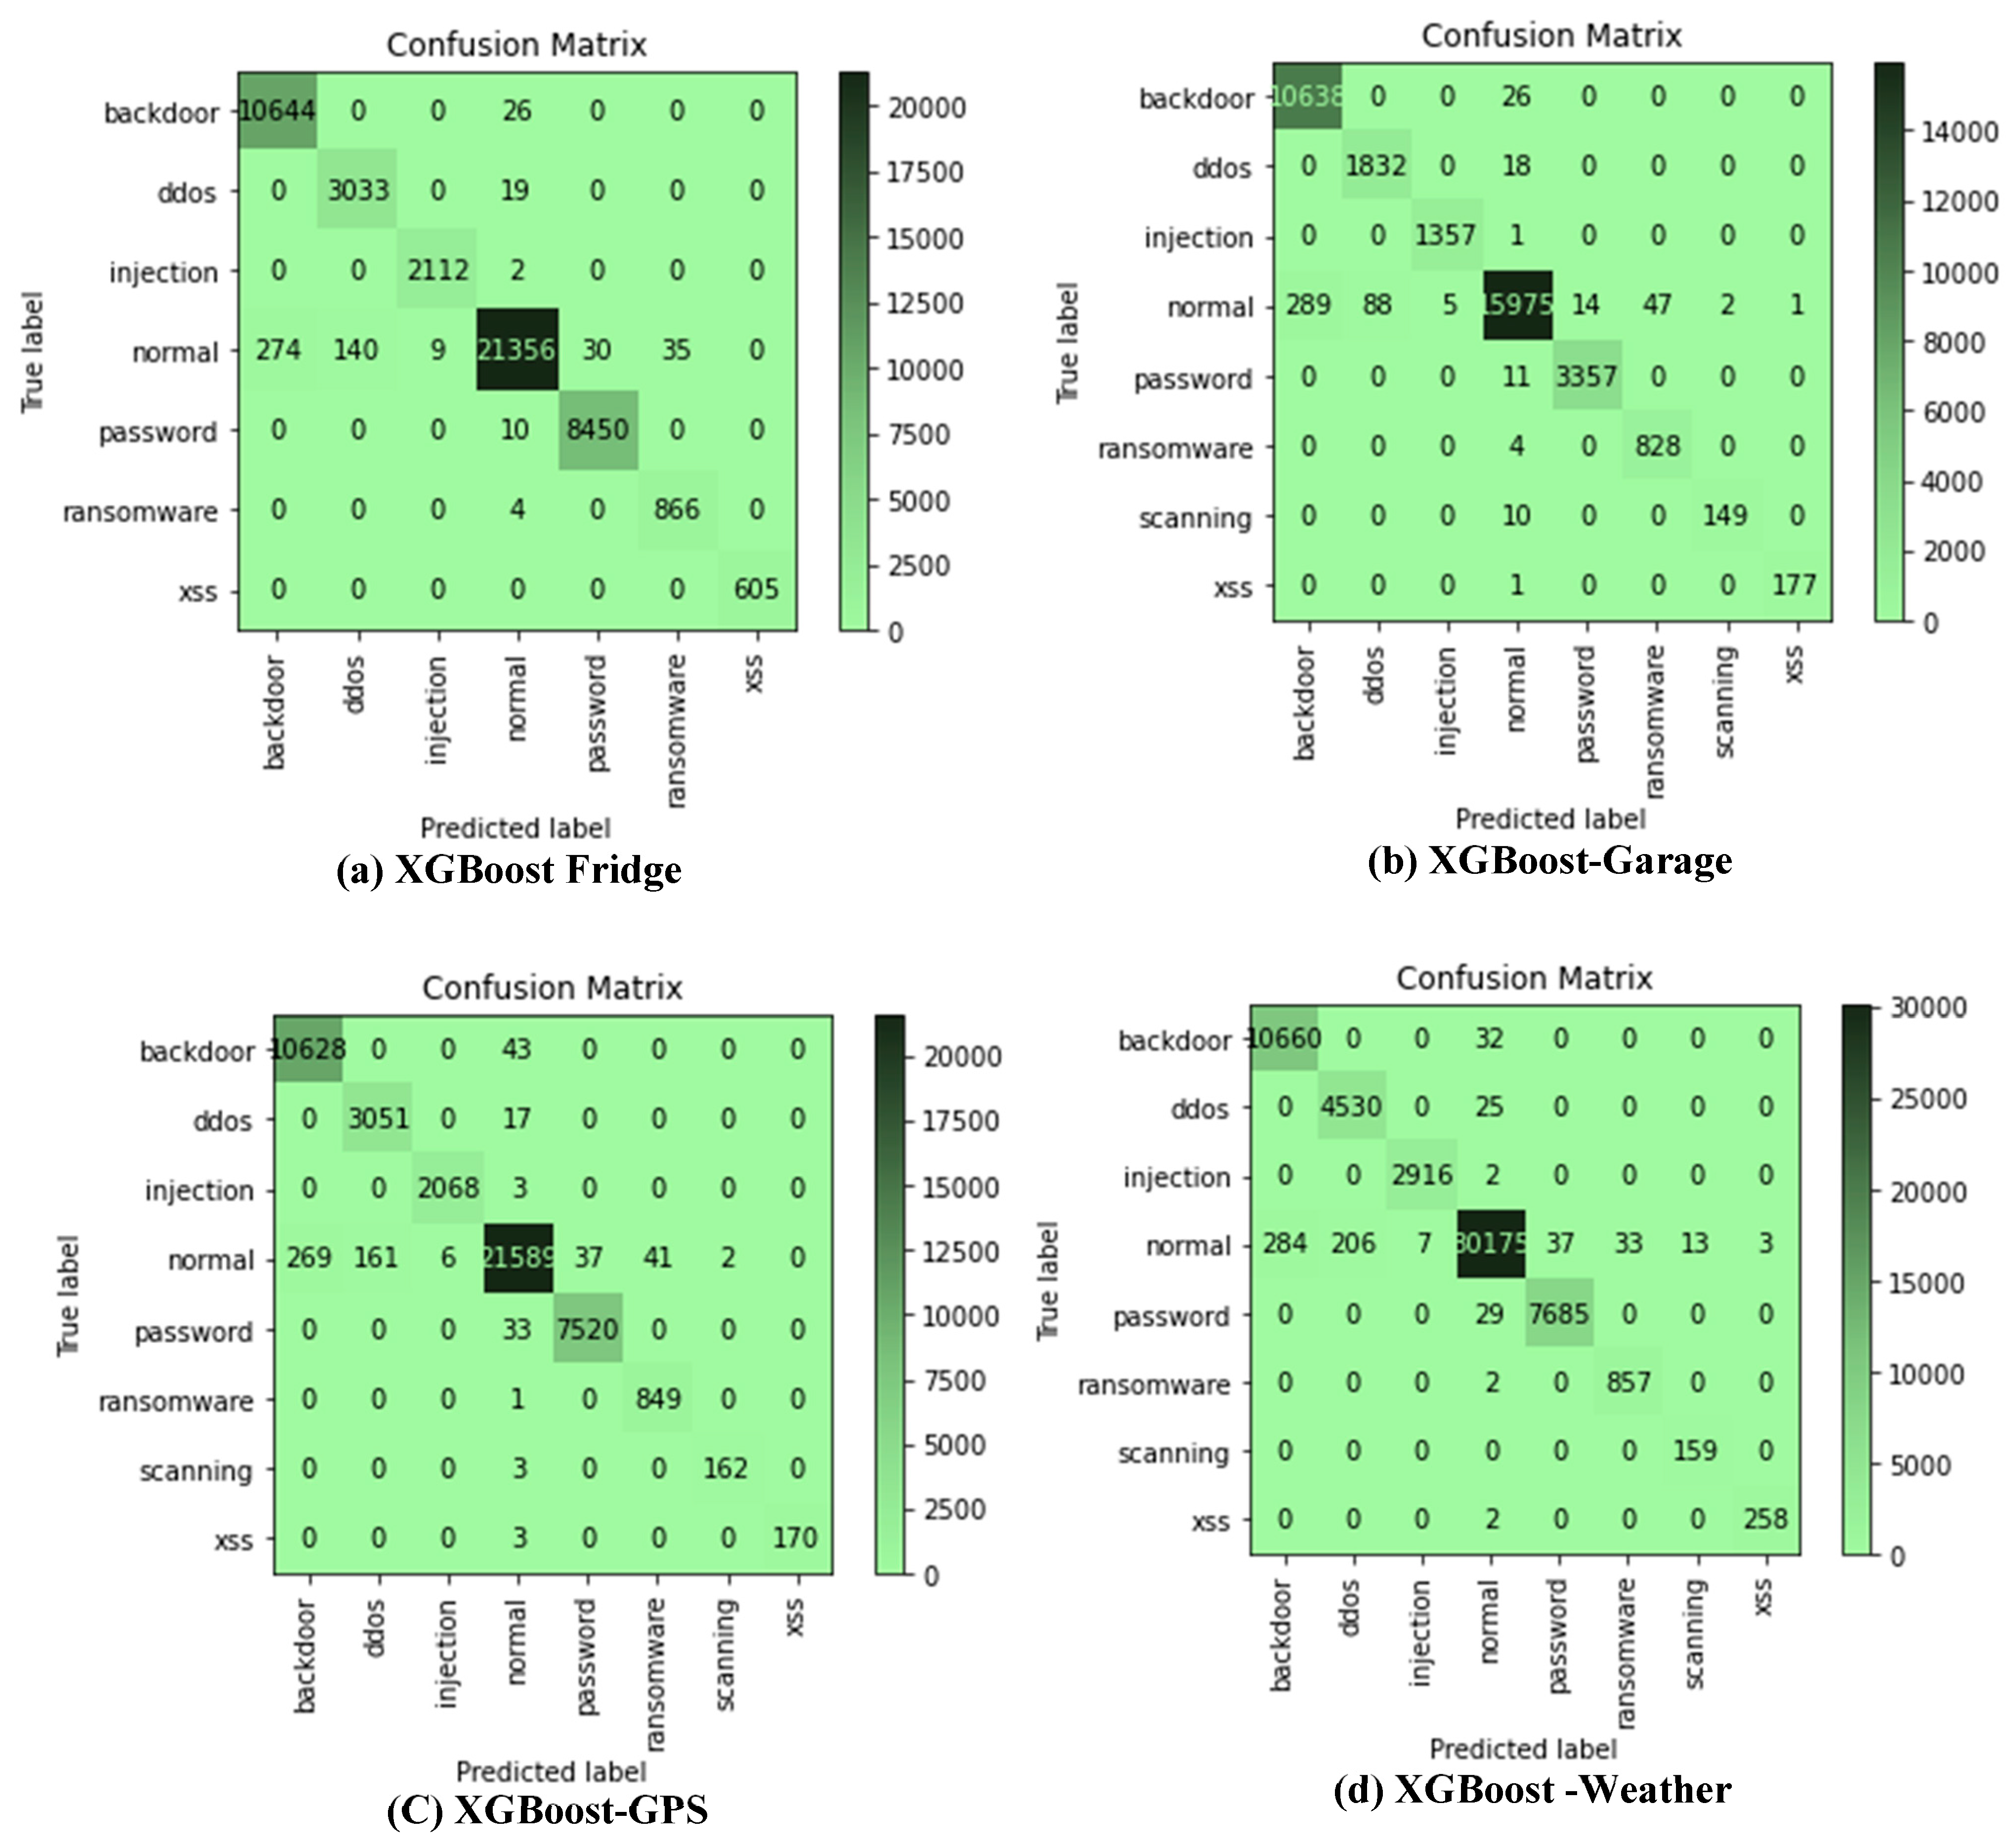
60]. The confusion matrix is a table shown in
Table 3, representing the detection rate of classes of dataset, thereby measuring the performance of an ML model on the test data.
The ROC_AUC indicates the tradeoff between True Positive Rate (TPR), or recall, and FPR, as shown by Equation (5). False Positive Rate is the percentage of ‘normal’ class instances wrongly classified as an ‘attack’ class, as shown by Equation (6). The accuracy assessment calculates a model’s overall effectiveness as a percentage of all “normal” data and the various “attack” incidents that were correctly classified, as shown by Equation (7). The recall assessor indicates the percentage of ‘attacks’ instances that were properly detected in the test dataset, as indicated by Equation (8). In contrast, the precision assessor indicates the percentage of properly detected ‘attack’ instances of all the detected ‘attacks’, as indicated by Equation (9). Finally, the f1_score estimates the harmonic mean of precision and recall, as indicated by Equation (10).


 ,
, 


