Article

Revival Mechanism and Prevention Measures of Composite Landslides: A Case Study of the Wenma Expressway Composite Landslide

Faculty of Engineering, China University of Geosciences, Wuhan 430074, China
*
Author to whom correspondence should be addressed.
Appl. Sci. 2023, 13(4), 2449; https://doi.org/10.3390/app13042449
Submission received: 5 December 2022 / Revised: 11 February 2023 / Accepted: 12 February 2023 / Published: 14 February 2023

Abstract

:
The resurrection of landslides often occurs in complex strata, where there are often multiple water-resisting zones and weak interlayers. The groundwater level has a significant influence on landslide stability and can lead to the formation of composite landslides and increase the probability of landslide resurrection. In a field investigation of the K39 +400 composite landslide of Wenma Expressway, the deformation characteristics of the landslide surface were obtained by analyzing 34 cracks on the landslide surface. The deep deformation characteristics of the landslide were analyzed by studying the deformation data obtained from deep borehole monitoring. The deformation zone characteristics of landslides were assessed by integrating surface and deep deformation data in the landslide area. The resurrections of shallow landslides in Area I and deep landslides in Area III were due mainly to the long-term high underground water level in the landslide. The stability of the landslide was calculated under various depths of drainage tunnel, and the results showed that the slope was in critical condition when the depth of the drainage tunnel was 15 m; the slope was basically stable when the depth of the drainage tunnel was 20 m and 25 m. When the depth of the drainage tunnel reached more than 30 m, the slope was in a stable state. Groundwater level was found to be the main factor affecting landslide deformation. This case study shows the importance of zoning the deformation characteristics of composite landslides, and the important influence of the groundwater level on landslide resurrection.

1. Introduction

The Wenma Expressway K39 +400 composite landslide (hereafter referred to as the K39 landslide) is located in the Guizhou Plateau, which is a key area for geological disaster prevention and control [1,2]. The support work for the K39 landslide was completed after the completion of the Wenma Expressway. In December 2018, surface cracking appeared on the K39 landslide, and the landslide support work was performed again. Manual inspection found that cracks had appeared in the drainage ditch at the back edge of the slope in June 2021, the soil mass of the retaining wall at the front edge was deformed, and different sliding characteristics were found in different areas of the landslide [3]. The slope cutting during the construction of Wenma Expressway is the direct cause of the landslide, and the landslide did not stop because of improper support in the later stage.
Many researchers have undertaken detailed studies on the sliding causes of single landslides [4,5], including analysis of the deformation mode and stability [6] of the landslide from in situ monitoring data [7,8], physical model tests [9,10], and numerical calculations [11]. There are few specific case studies on the deformation laws of composite landslides. It is important to correctly investigate stratum information and analyze on-site monitoring data when studying landslides with complex geological conditions [12]. Tang, H.M. et al. [13] proposed a new framework for landslide deformation: rigid deformation, within-mass deformation, and residual deformation, through the study of landslide deformation monitoring data. Landslides can be studied even when deformation zoning characteristics of the landslide composition structure are complex and the deformations are diverse [14]. Landslide deformation can be divided into three stages: the initial deformation stage, accelerated deformation stage, and stabilization stage, through comprehensive analysis of monitoring data of the surface and depth of the landslide. In the study of composite landslides [15], the rainfall infiltration model of double-layer slopes can be analyzed by numerical calculation and test results verification [16]. The design method of anti-sliding support for composite landslides is different than that for a single landslide. The soil arching effect of landslides with different depths and the interaction between deep and shallow landslides need to be considered.
Numerous studies have been carried out on the influence of the groundwater level on deep mountain landslides [17,18,19]. Recovery of deep landslides often includes imperfect drainage measures and an excessively high groundwater level, so it is very important to accurately grasp the variation laws of the groundwater level. Wei, Z.L. et al. [20] constructed a physical seepage model to predict the influence of the groundwater level on deep landslides. There is a close relationship between the occurrence of landslides and water. The movement of groundwater caused by seasonal changes is one of the main natural factors influencing the stability of landslides [21]. The seismic acceleration that triggers the landslide decreases when excessive rainfall saturates the slide [22]. Therefore, we must pay attention to the influence of the rise and fall of groundwater on landslides in landslide prediction, monitoring, and treatment. Monitoring data have shown that the rapid rise of the underground water level will lead to an increase of anti-slide pile displacement, and the anti-slide pile will remain stable when the underground water level drops [23]. Zheng, J. et al. [24] proposed a new siphon drainage system with variable diameters for landslides that improves the efficiency of landslide management by lowering groundwater levels. Wang, Z.L. et al. [25] put forward a method to calculate the position and depth of the drainage tunnel accurately in landslide prevention and control to solve the current drainage tunnel design problem. Miao, F.S. [26] revealed the failure mode and deformation mechanism under the coupling actions of water level fluctuation and rainfall. Yang, Z.Q. [27] investigated the deformation patterns and failure mechanisms of this type of slope, induced by step-by-step excavations.
However, researchers have seldom studied the differential influence of groundwater on composite landslides, although the stability of different depth sliding zones will change with the change of groundwater height. This paper considered the K39 landslide as an example. First, the landslide was divided according to the surface deformation, then the deformation characteristics and sliding depth of the deep stratum of the landslide were analyzed according to the monitoring data of the deep deformation of the landslide. Finally, the stability of the deep landslide was calculated by setting drainage tunnels of different depths. The accurate analysis of landslide deformation mechanisms is not only of significance to the evaluation and prevention of landslides but also of importance to the implementation of further engineering measures.

2. Engineering Geological Conditions of the Landslide

2.1. Topographic Features

The K39 composite landslide is located in Wenshan Prefecture, Yunnan Province. The landform of the landslide area belongs to the middle mountain tectonic erosion landform. The terrain rises from the middle to the west and is low in the southeast. The type of landslide is deep rock soil mixed traction, which is in the shape of a circular chair on the plane, and gullies have developed in the middle (Figure 1). The slope has been excavated into a fourth-grade slope with a broken-line slope. The front edge elevation of landslide is 1240 m, the rear edge elevation is 1320 m, and the relative height difference is approximately 80 m. The plane is 200 m in length and 160 m in width.

2.2. Lithology

The geological conditions of landslide areas are complicated. Sections of Zones I and II were drawn according to borehole maps, as shown in Figure 2. The inclinometer used in this paper was a mobile inclinometer. The monitoring displacement direction of the mobile inclinometer was consistent with the direction of the profile, enabling it to truly reflect the main sliding direction of the landslide. The main strata in the area were as follows:
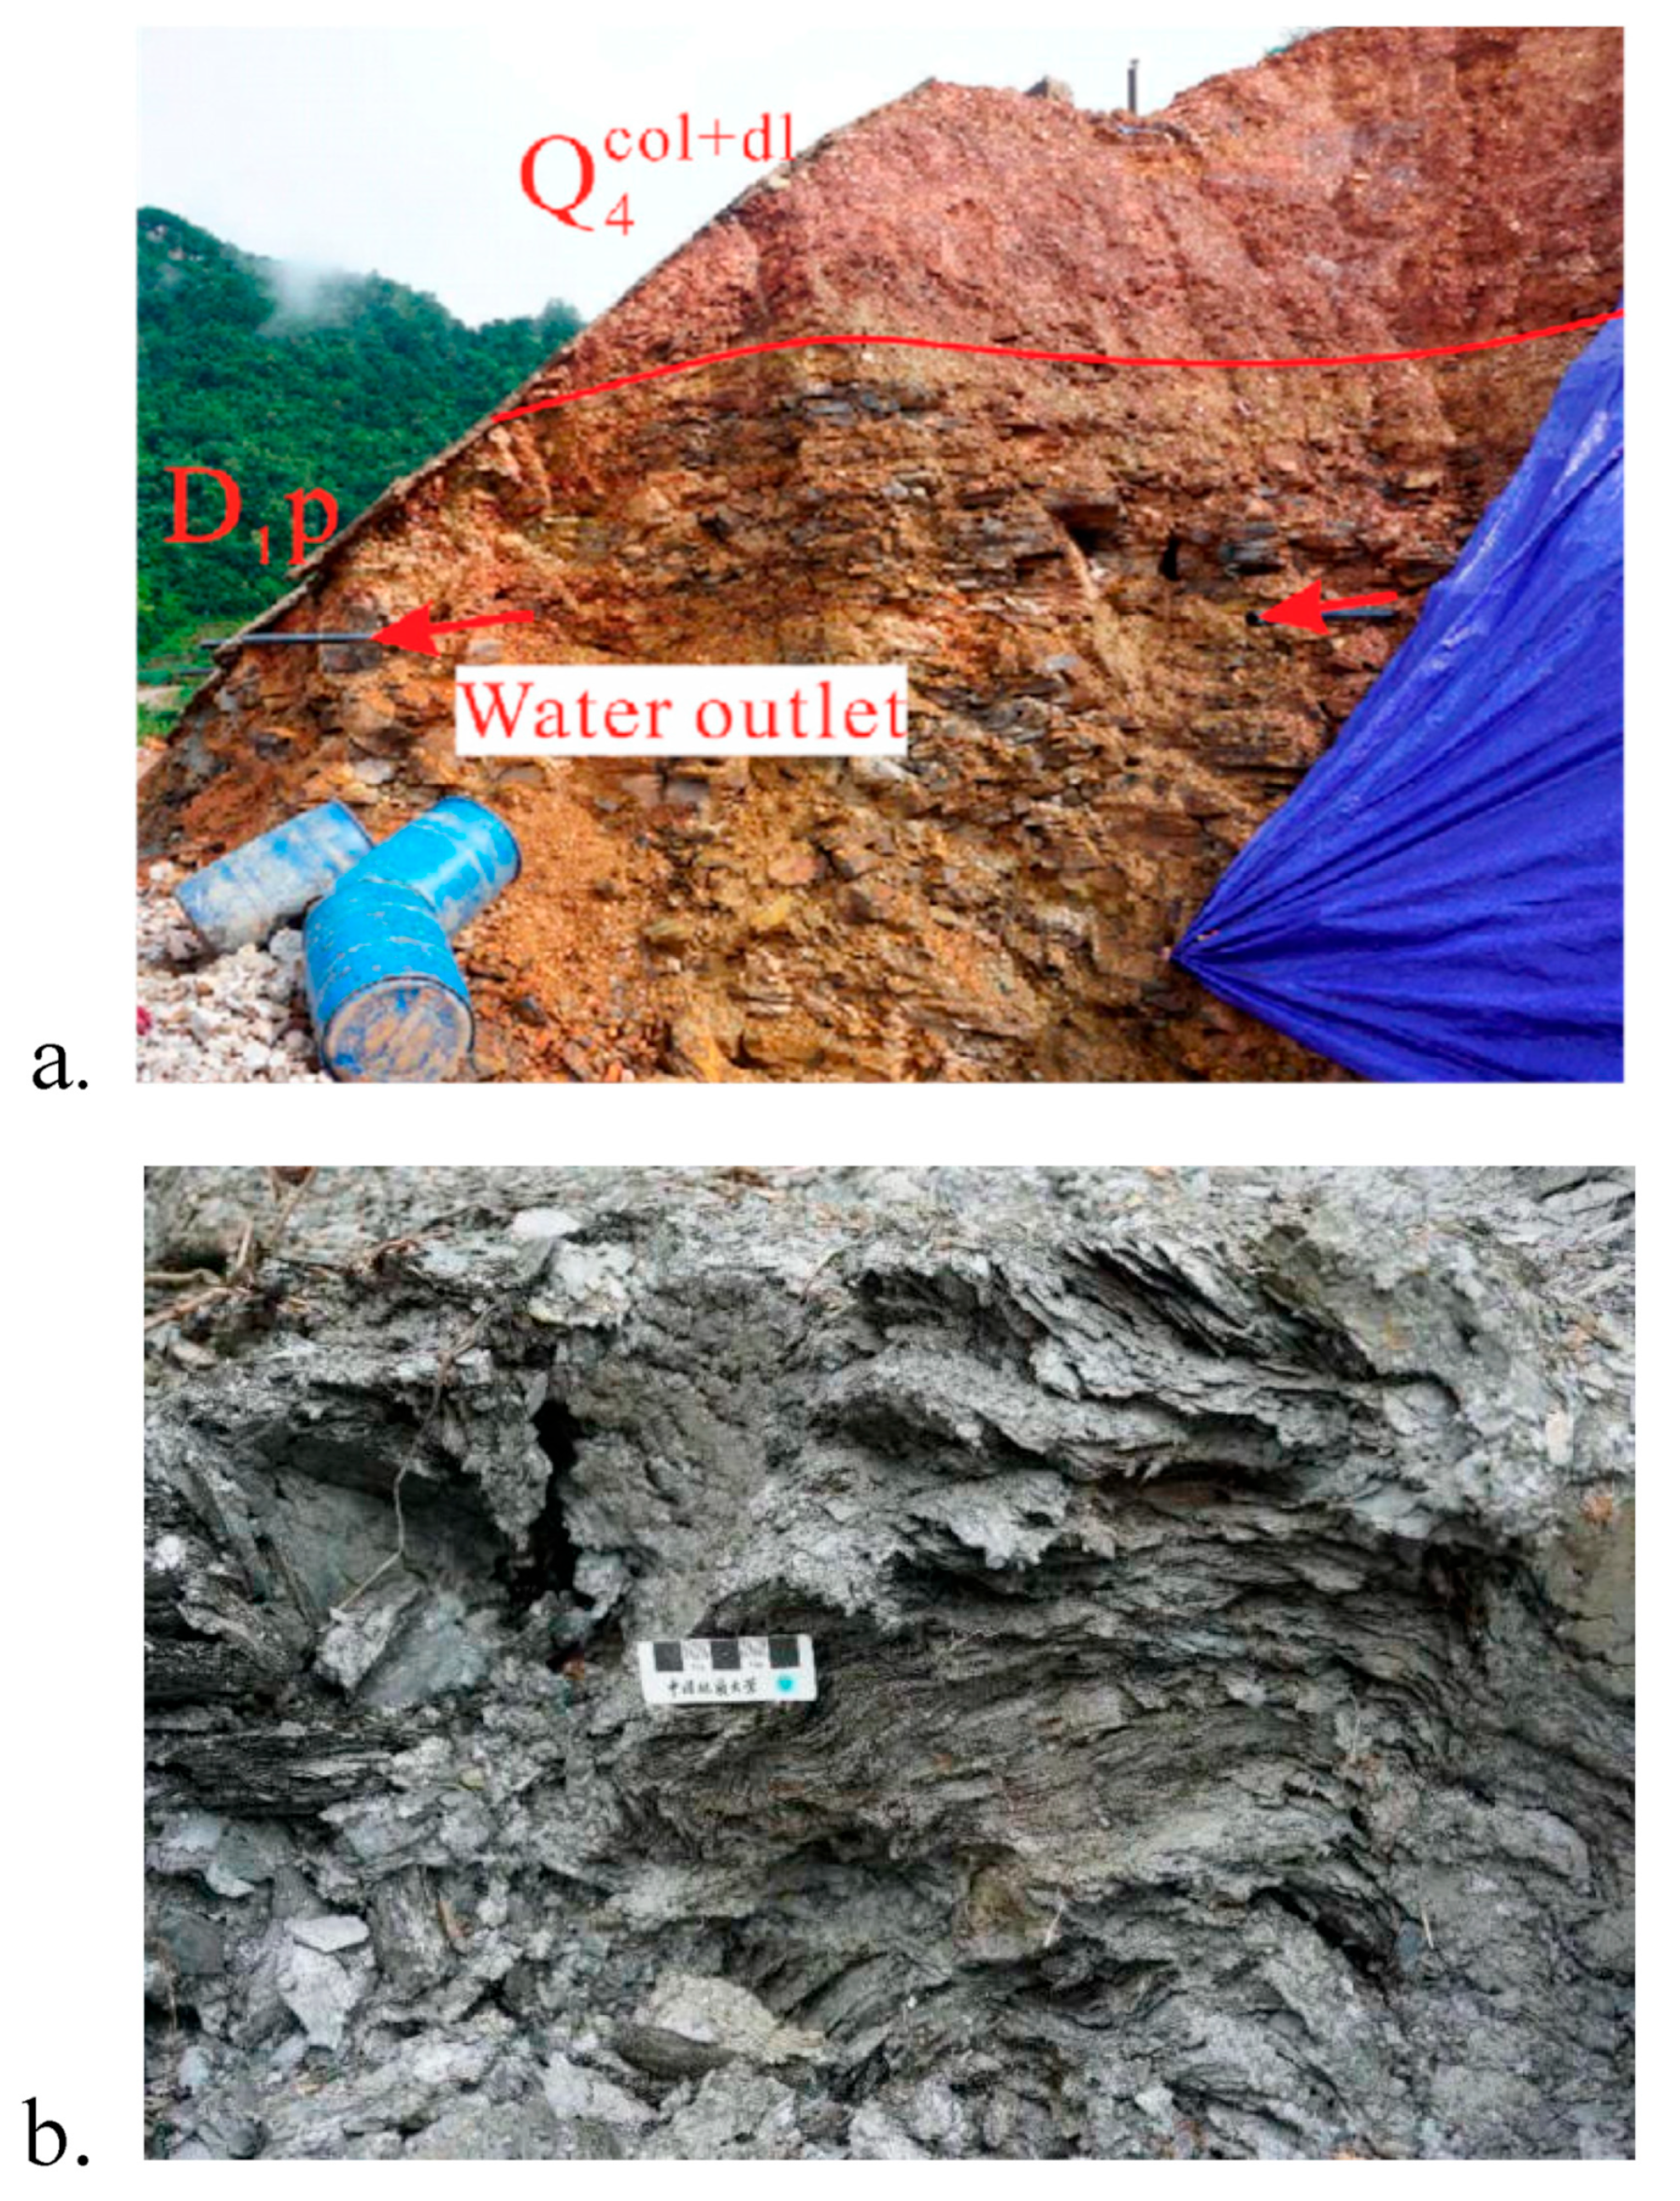
  • Quaternary colluvial deposit (Q4col+dl): mainly gravelly clay with a particle size of 2~13 cm and poor roundness. Soil is red-brown and brown-yellow, with no shaking reaction and high dry strength. The thickness is approximately 5~12 m, distributed mainly on the surface of the mountain (Figure 3a).
  • Devonian system Pojiao group sandy mudstone (D1p): Gray-black thin-layered mudstone with partial gray, brown-yellow thin-layered silty mudstone (Figure 3a).
  • Devonian system Cuifengshan group argillaceous shale (D1c): The gray-black medium-thick argillaceous shale is approximately 10~20 m thick, with a strong weathering layer. The lower inclination angle is nearly vertical and the upper part is inverted, with an occurrence of 243°∠18° (Figure 3b). The drill core showed that the bottom layer of D1b rock stratum is inverted, and the surface is characterized by bedding landslide. The dip angle in the sliding zone area is nearly vertical.
  • The structure along the way in this area is extremely complex, and it is extremely important to understand the rock stratum information of complex landslide masses. Marinos, V. [28] proposed a method for classification of rocks in complex areas. Cotecchia, F. [29] studied the impact of different permeability soils on landslide deformation. Ruggeri, P. [30] pointed out that specific measures should be taken in the engineering design for special soils, and Bromhead, E.N. [31] indicated that landslide sliding often has multiple sliding surfaces. The K39 landslide has large differences in permeability of the rock and soil masses, and has a double-layer sliding surface, so the landslide can be categorized as complex rock masses.

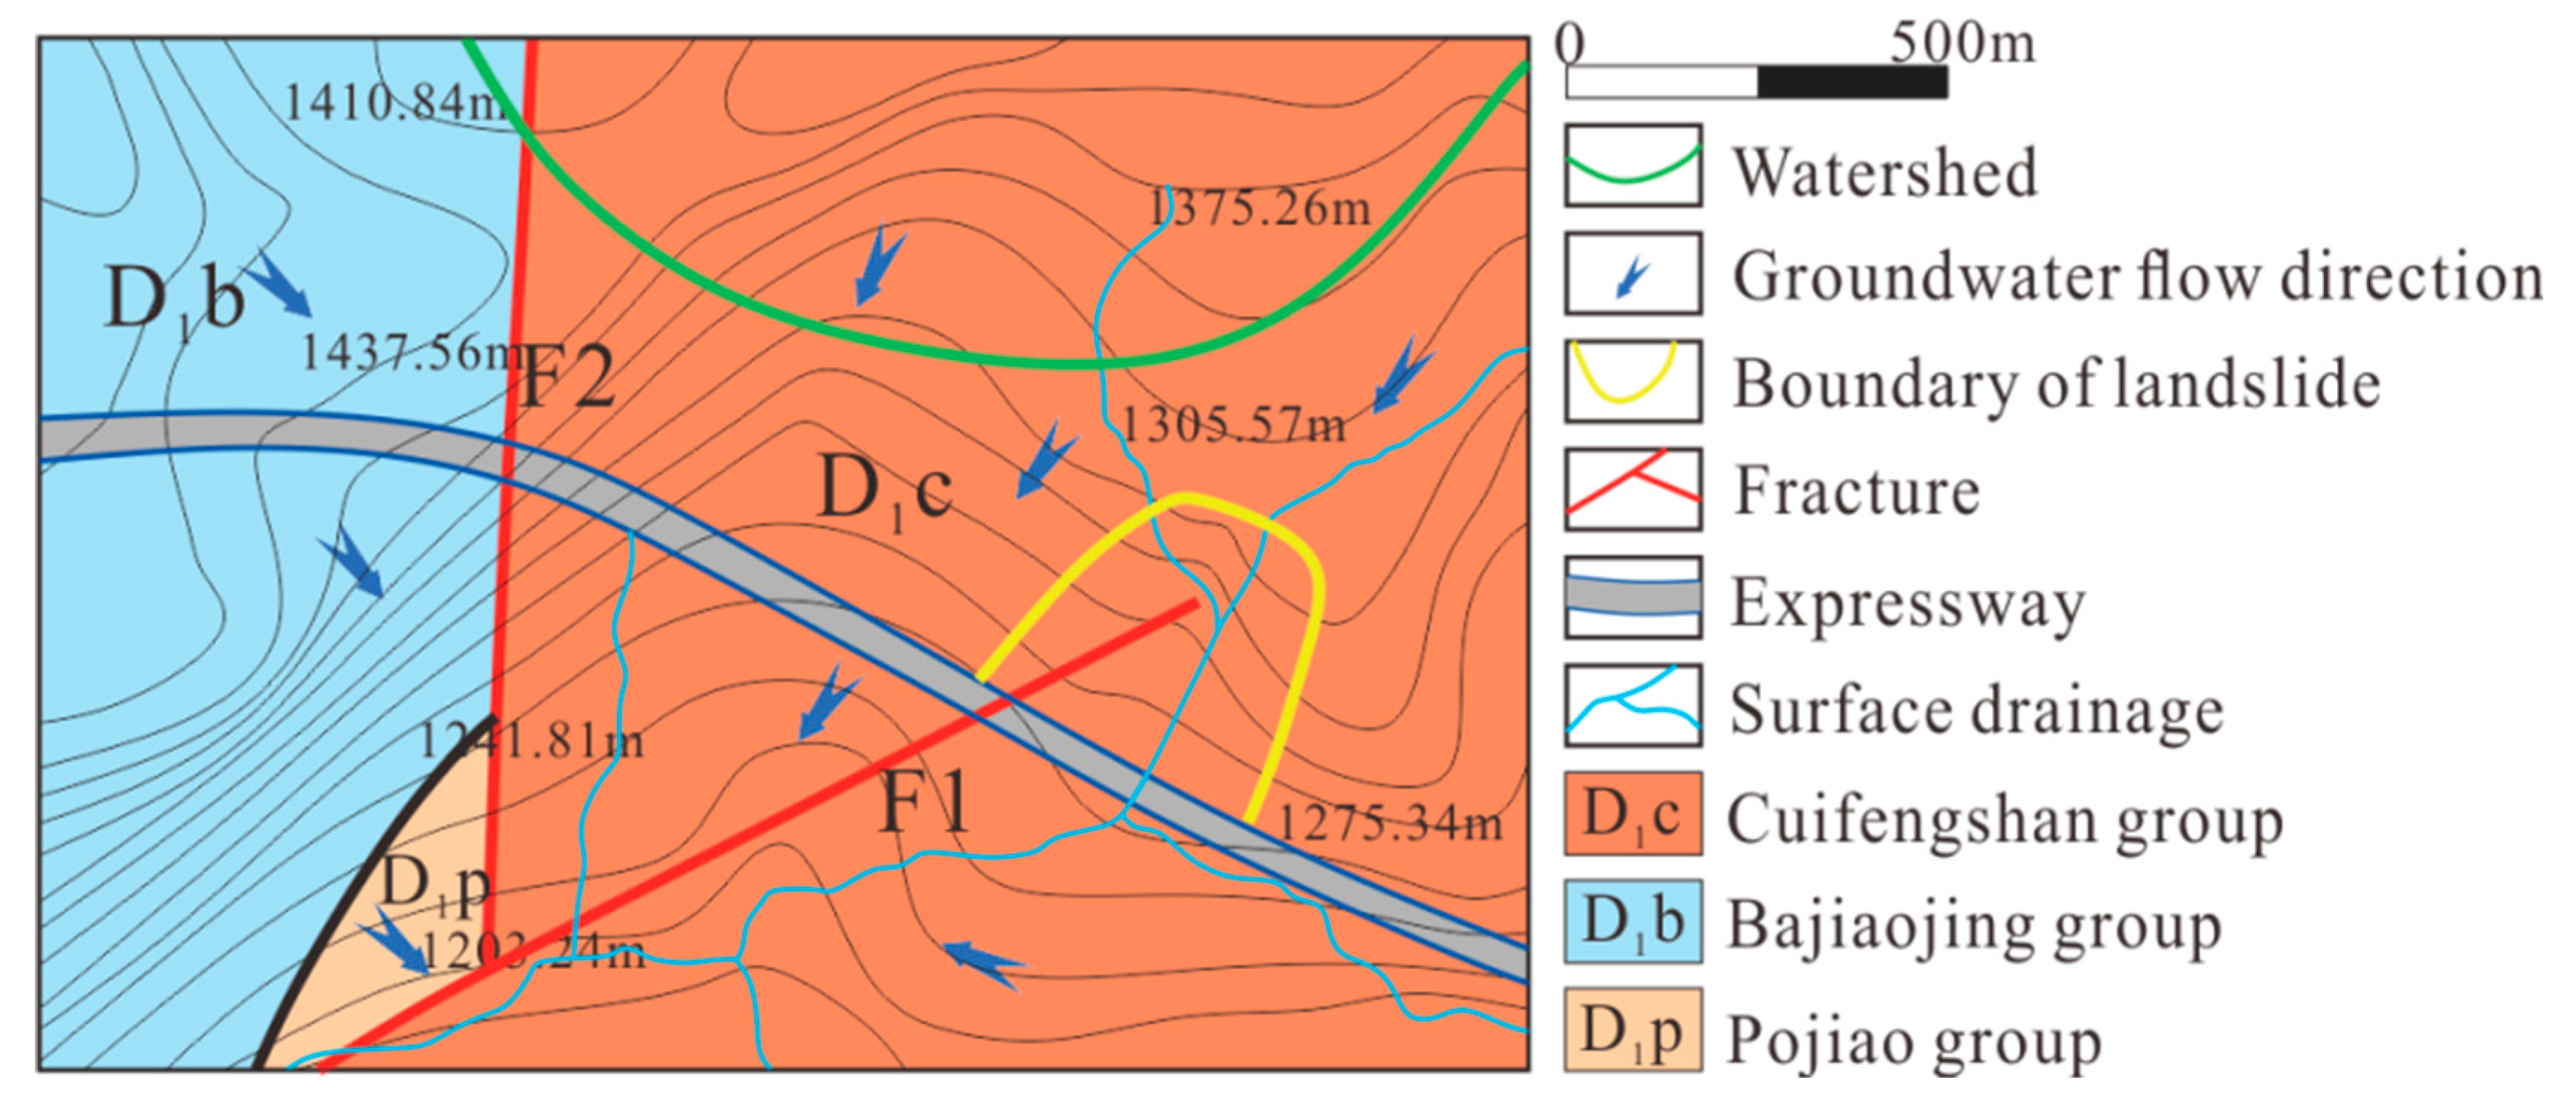
2.3. Geological Structure

The geological structure phenomena in the landslide area are extremely complex and two faults have developed near the landslide. Fault F1 intersects the route at 65° and strikes 73°; Fault F2 intersects the line at nearly 90°, with a strike of 24° and a length of approximately 3.2 km (Figure 4). The landslide is located between two faults. It is locally crumpled due to the influence of fault compression. The integrity of the rock mass is poor, joint fissures are developed, and the strongly weathered bedrock is broken.

2.4. Hydrogeological Conditions

Surface water in landslide area is recharged mainly by atmospheric precipitation and is distributed in drainage ditches to drain to the southwest (Figure 4). Rain water seeps down to shale surface through avalanche deposits (Q4col+dl) and slope angle groups (D1p). Shale permeability of Cuifengshan Formation (D1c) is extremely poor, thus forming a runoff path between the slope angle group and Cuifengshan Formation. At this time, anti-downslide force of the slope body decreases, which further aggravates the sliding of shallow landslide in Area I.
When the rainfall is greater than the seepage rate of rainwater, runoff will occur on the surface of the slope body and the slope body will be saturated. At this time, the sliding force of the whole slope body rises, resulting in displacement of the deep sliding zone in Zone III.

3. Landslide Deformation Zoning Characteristics

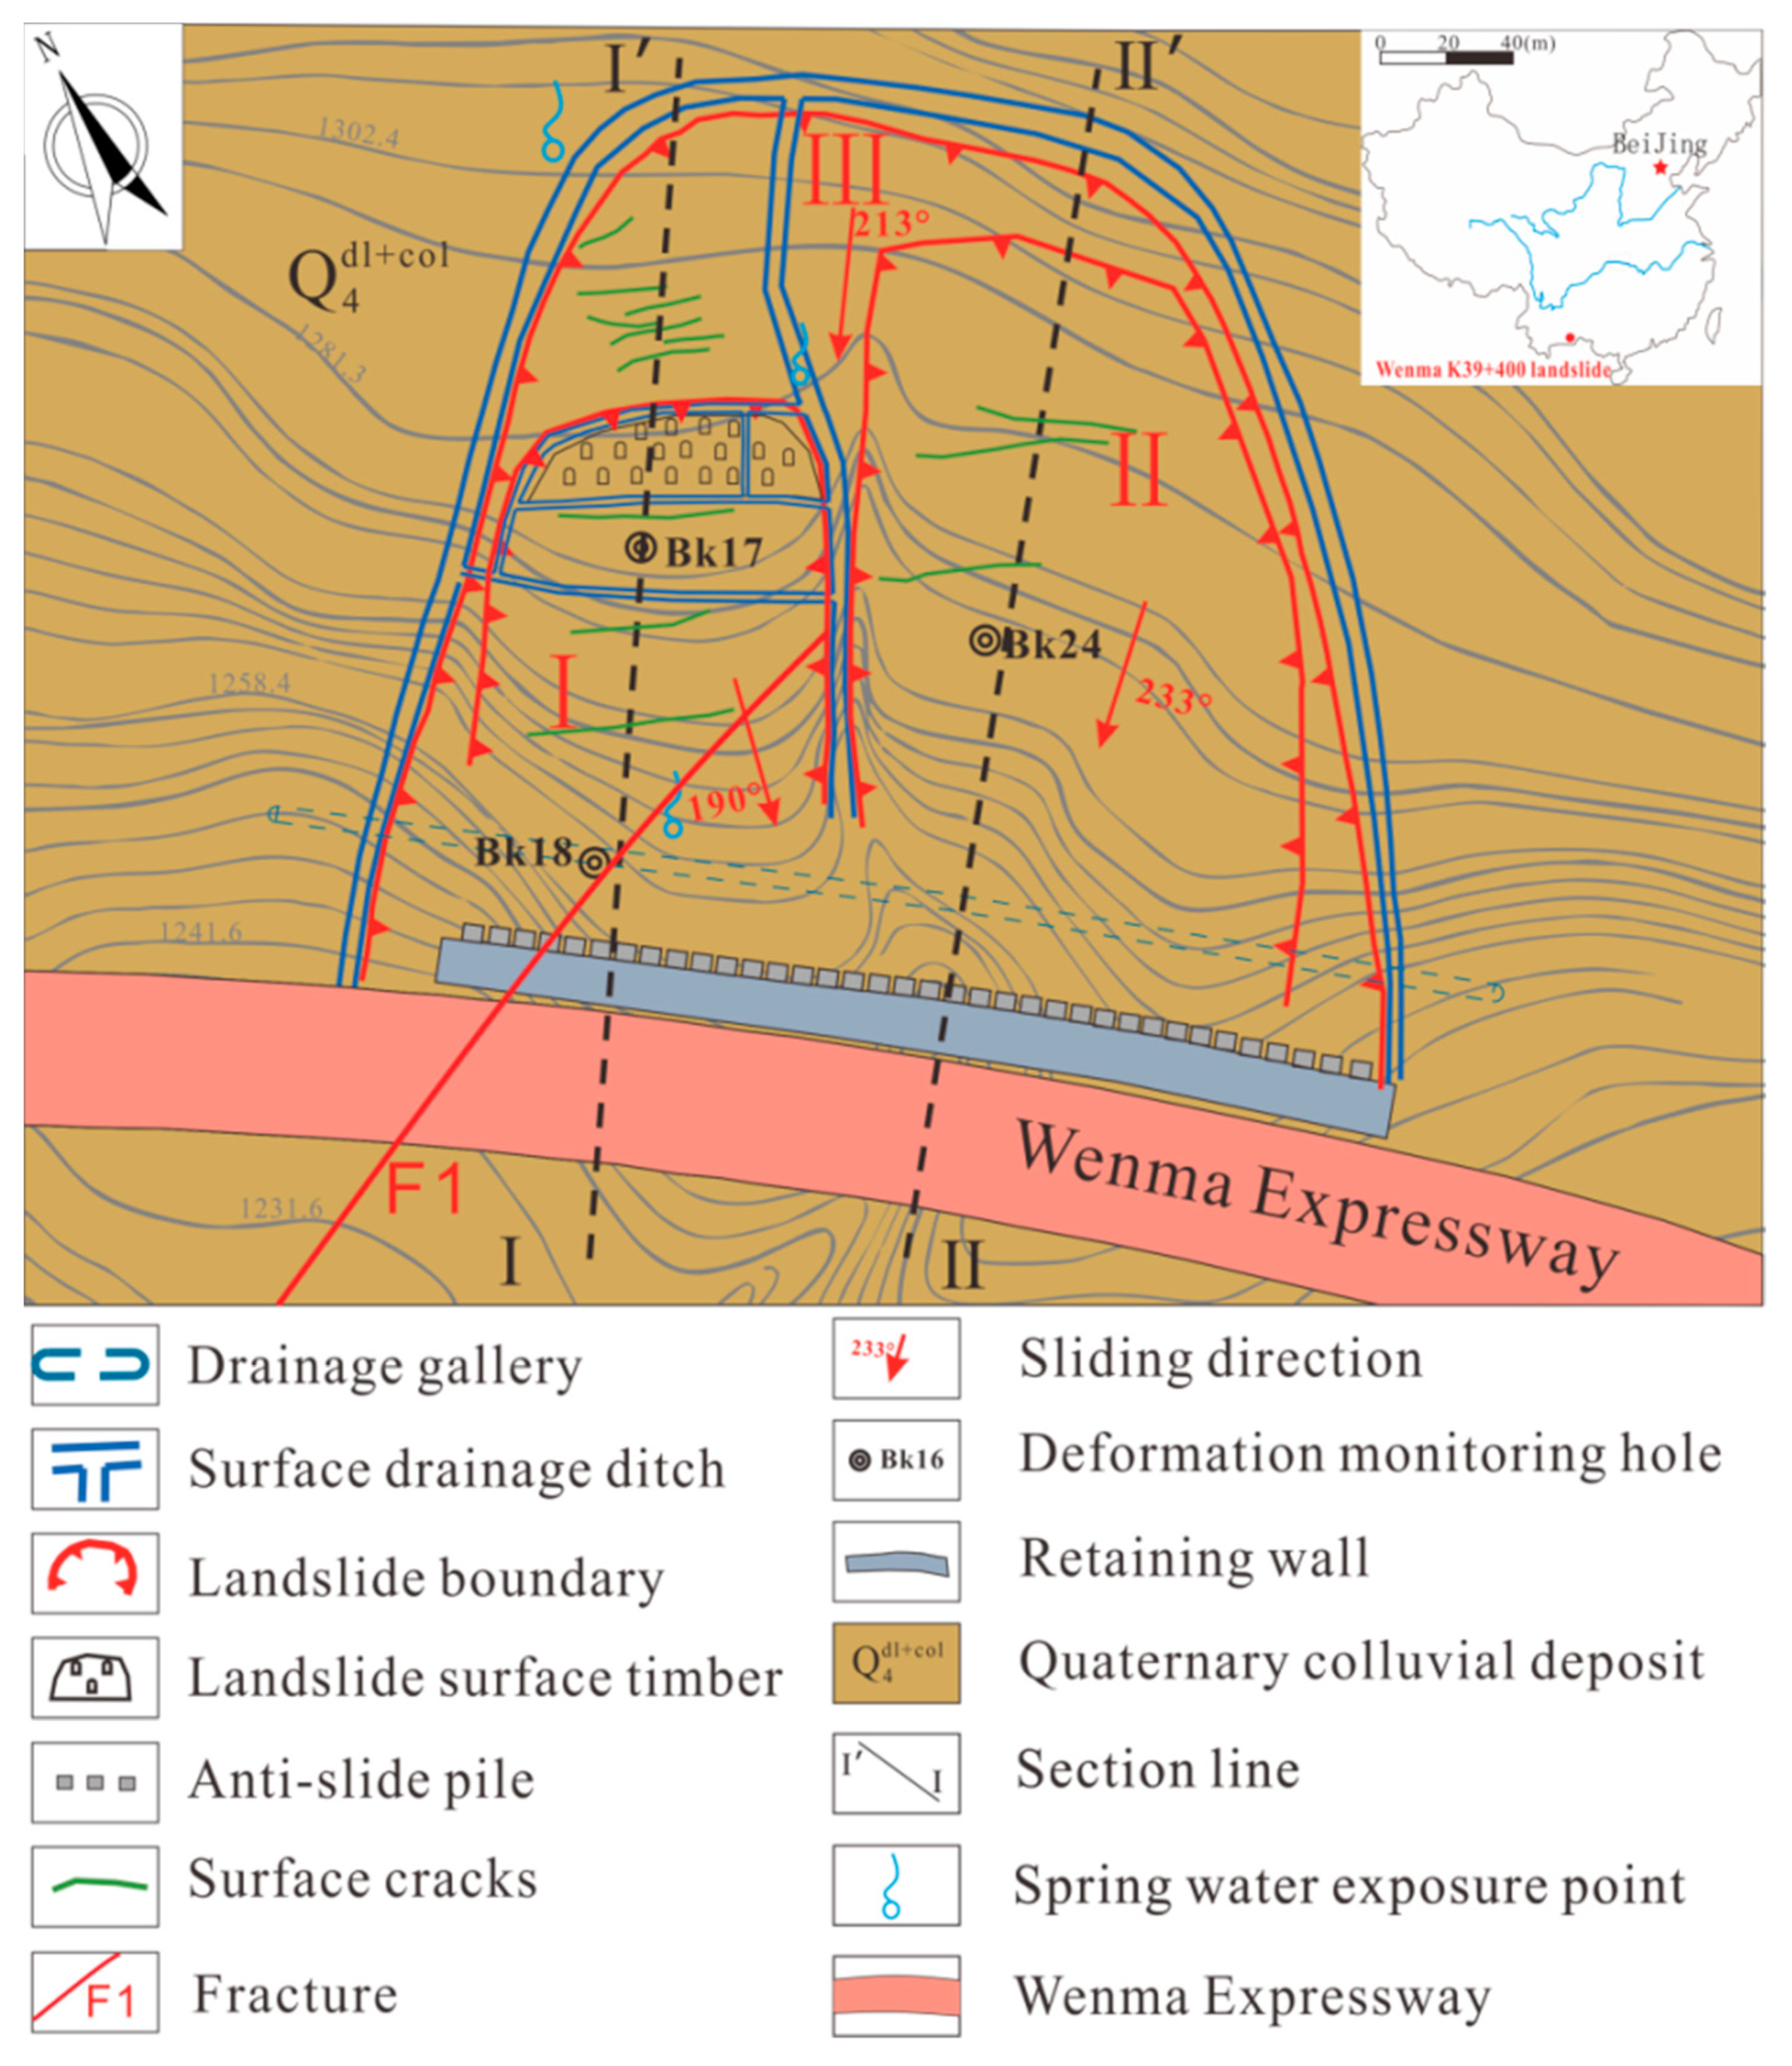
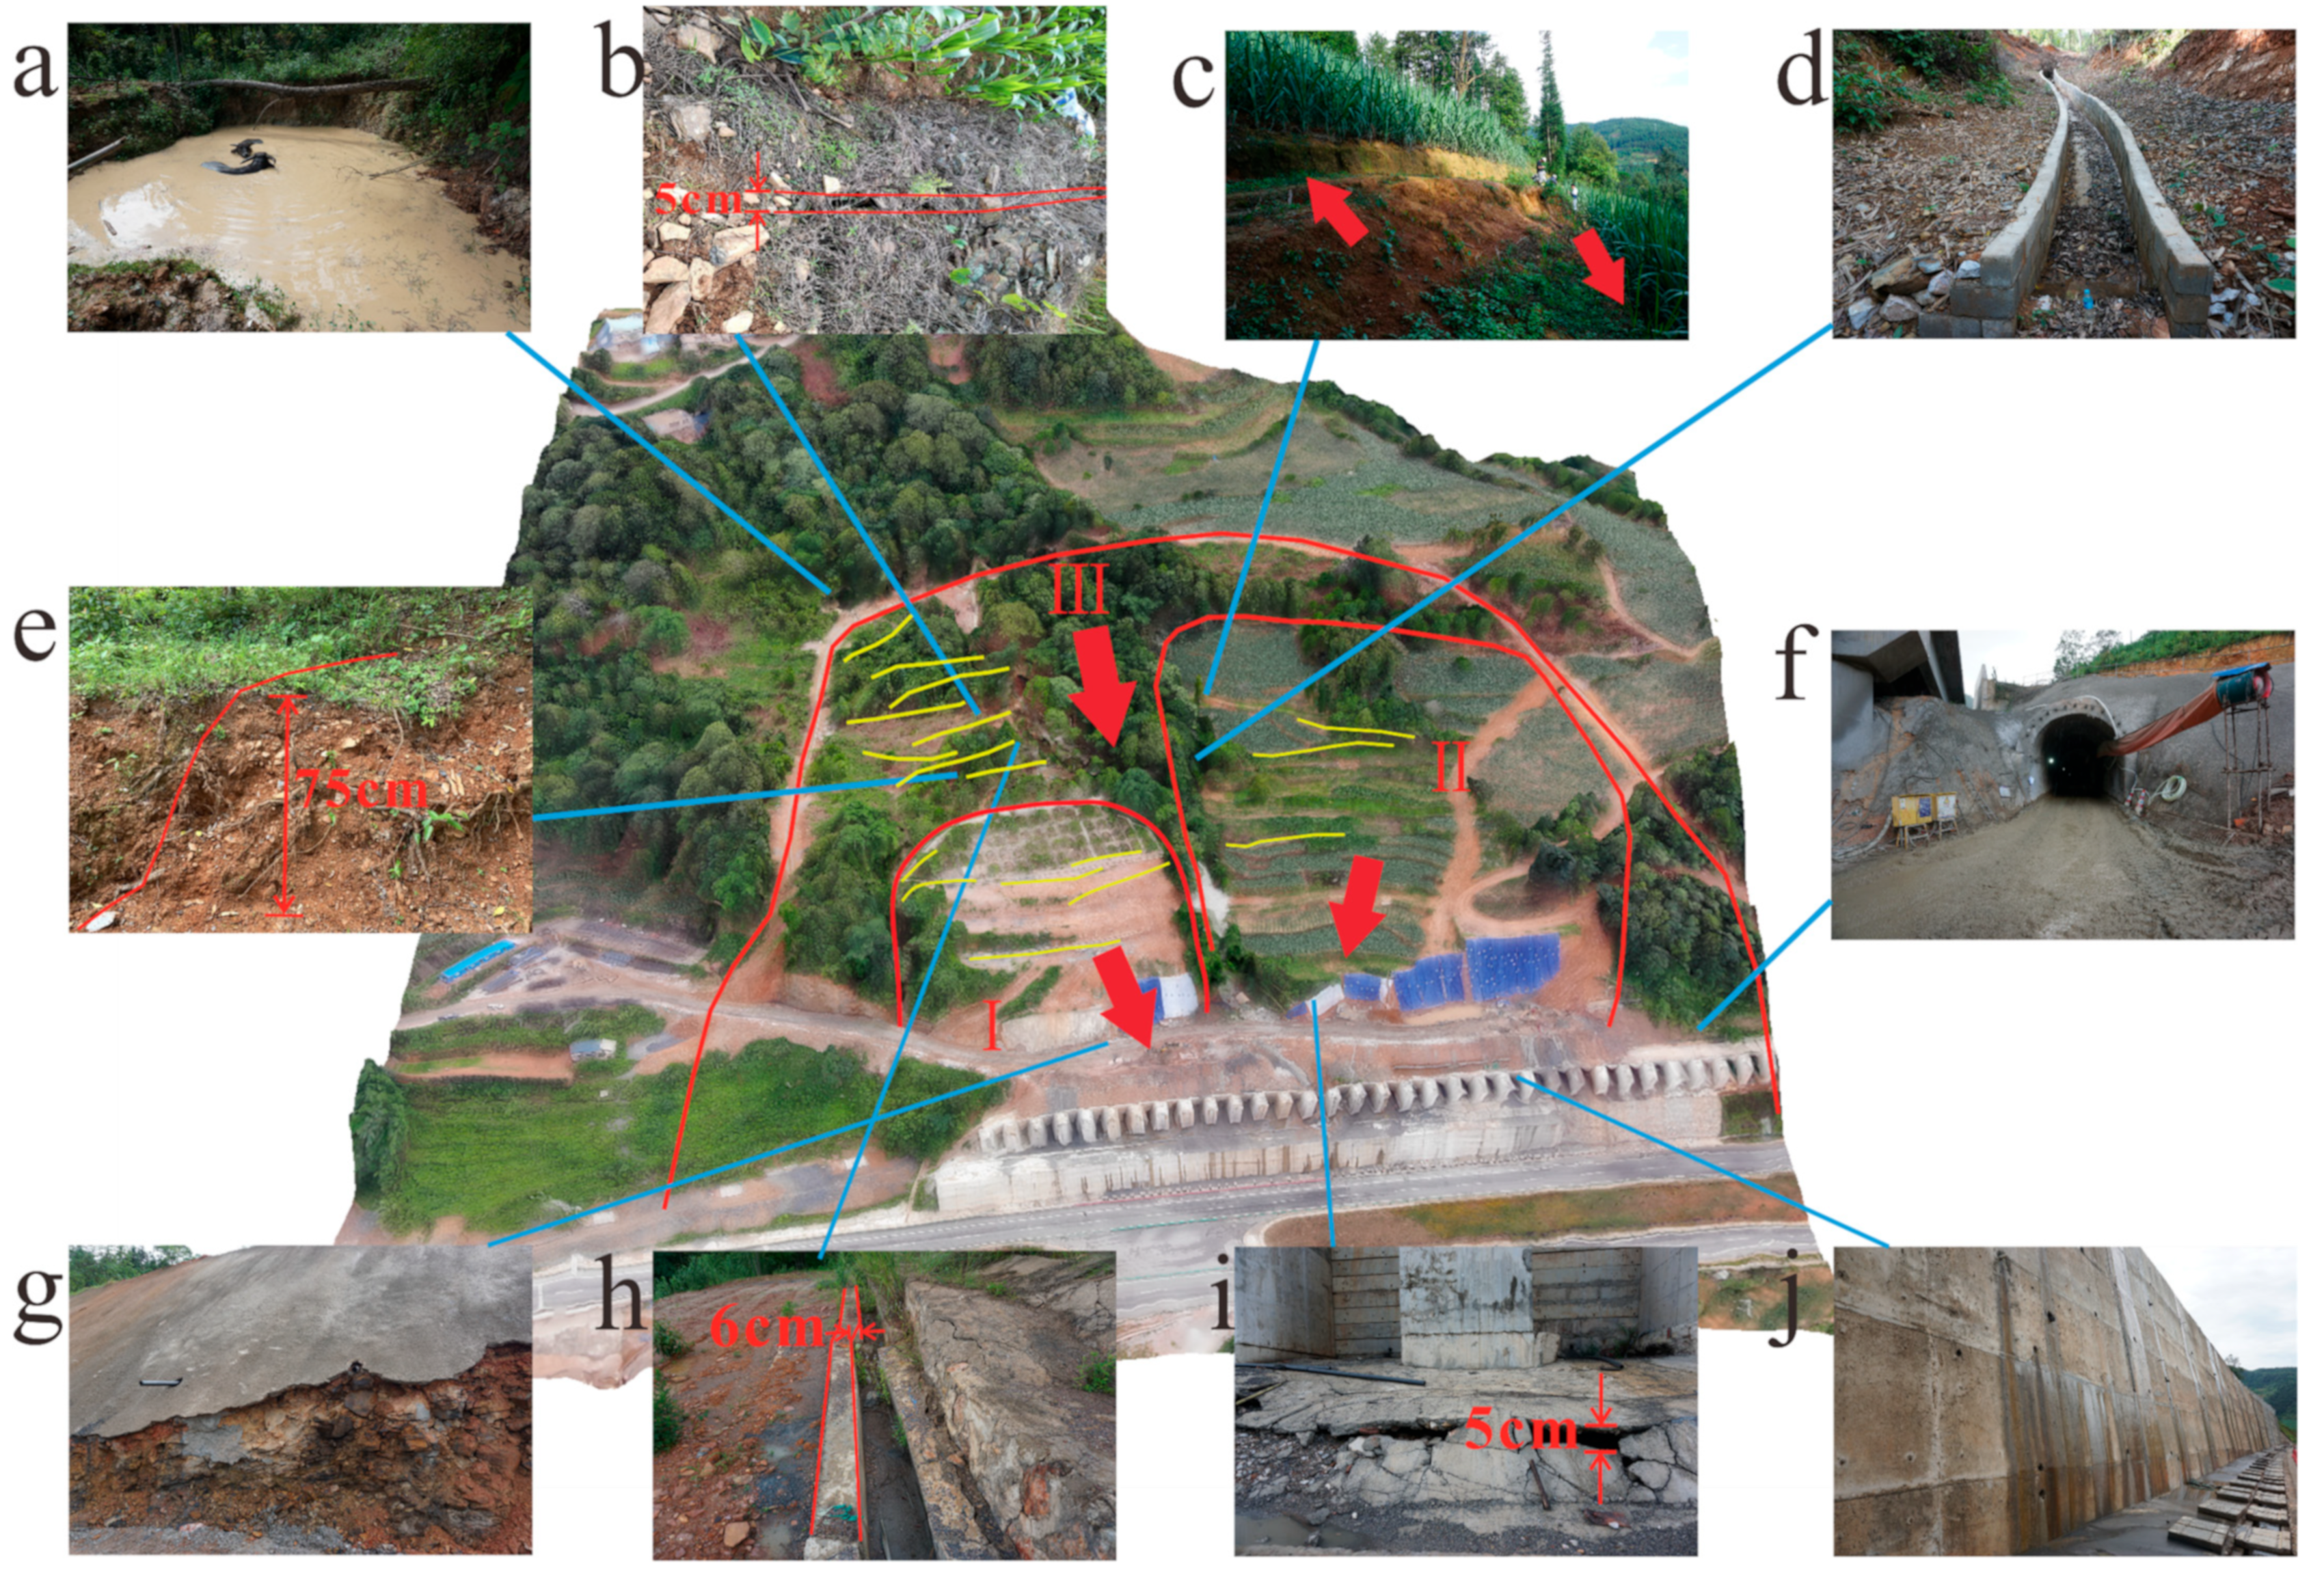
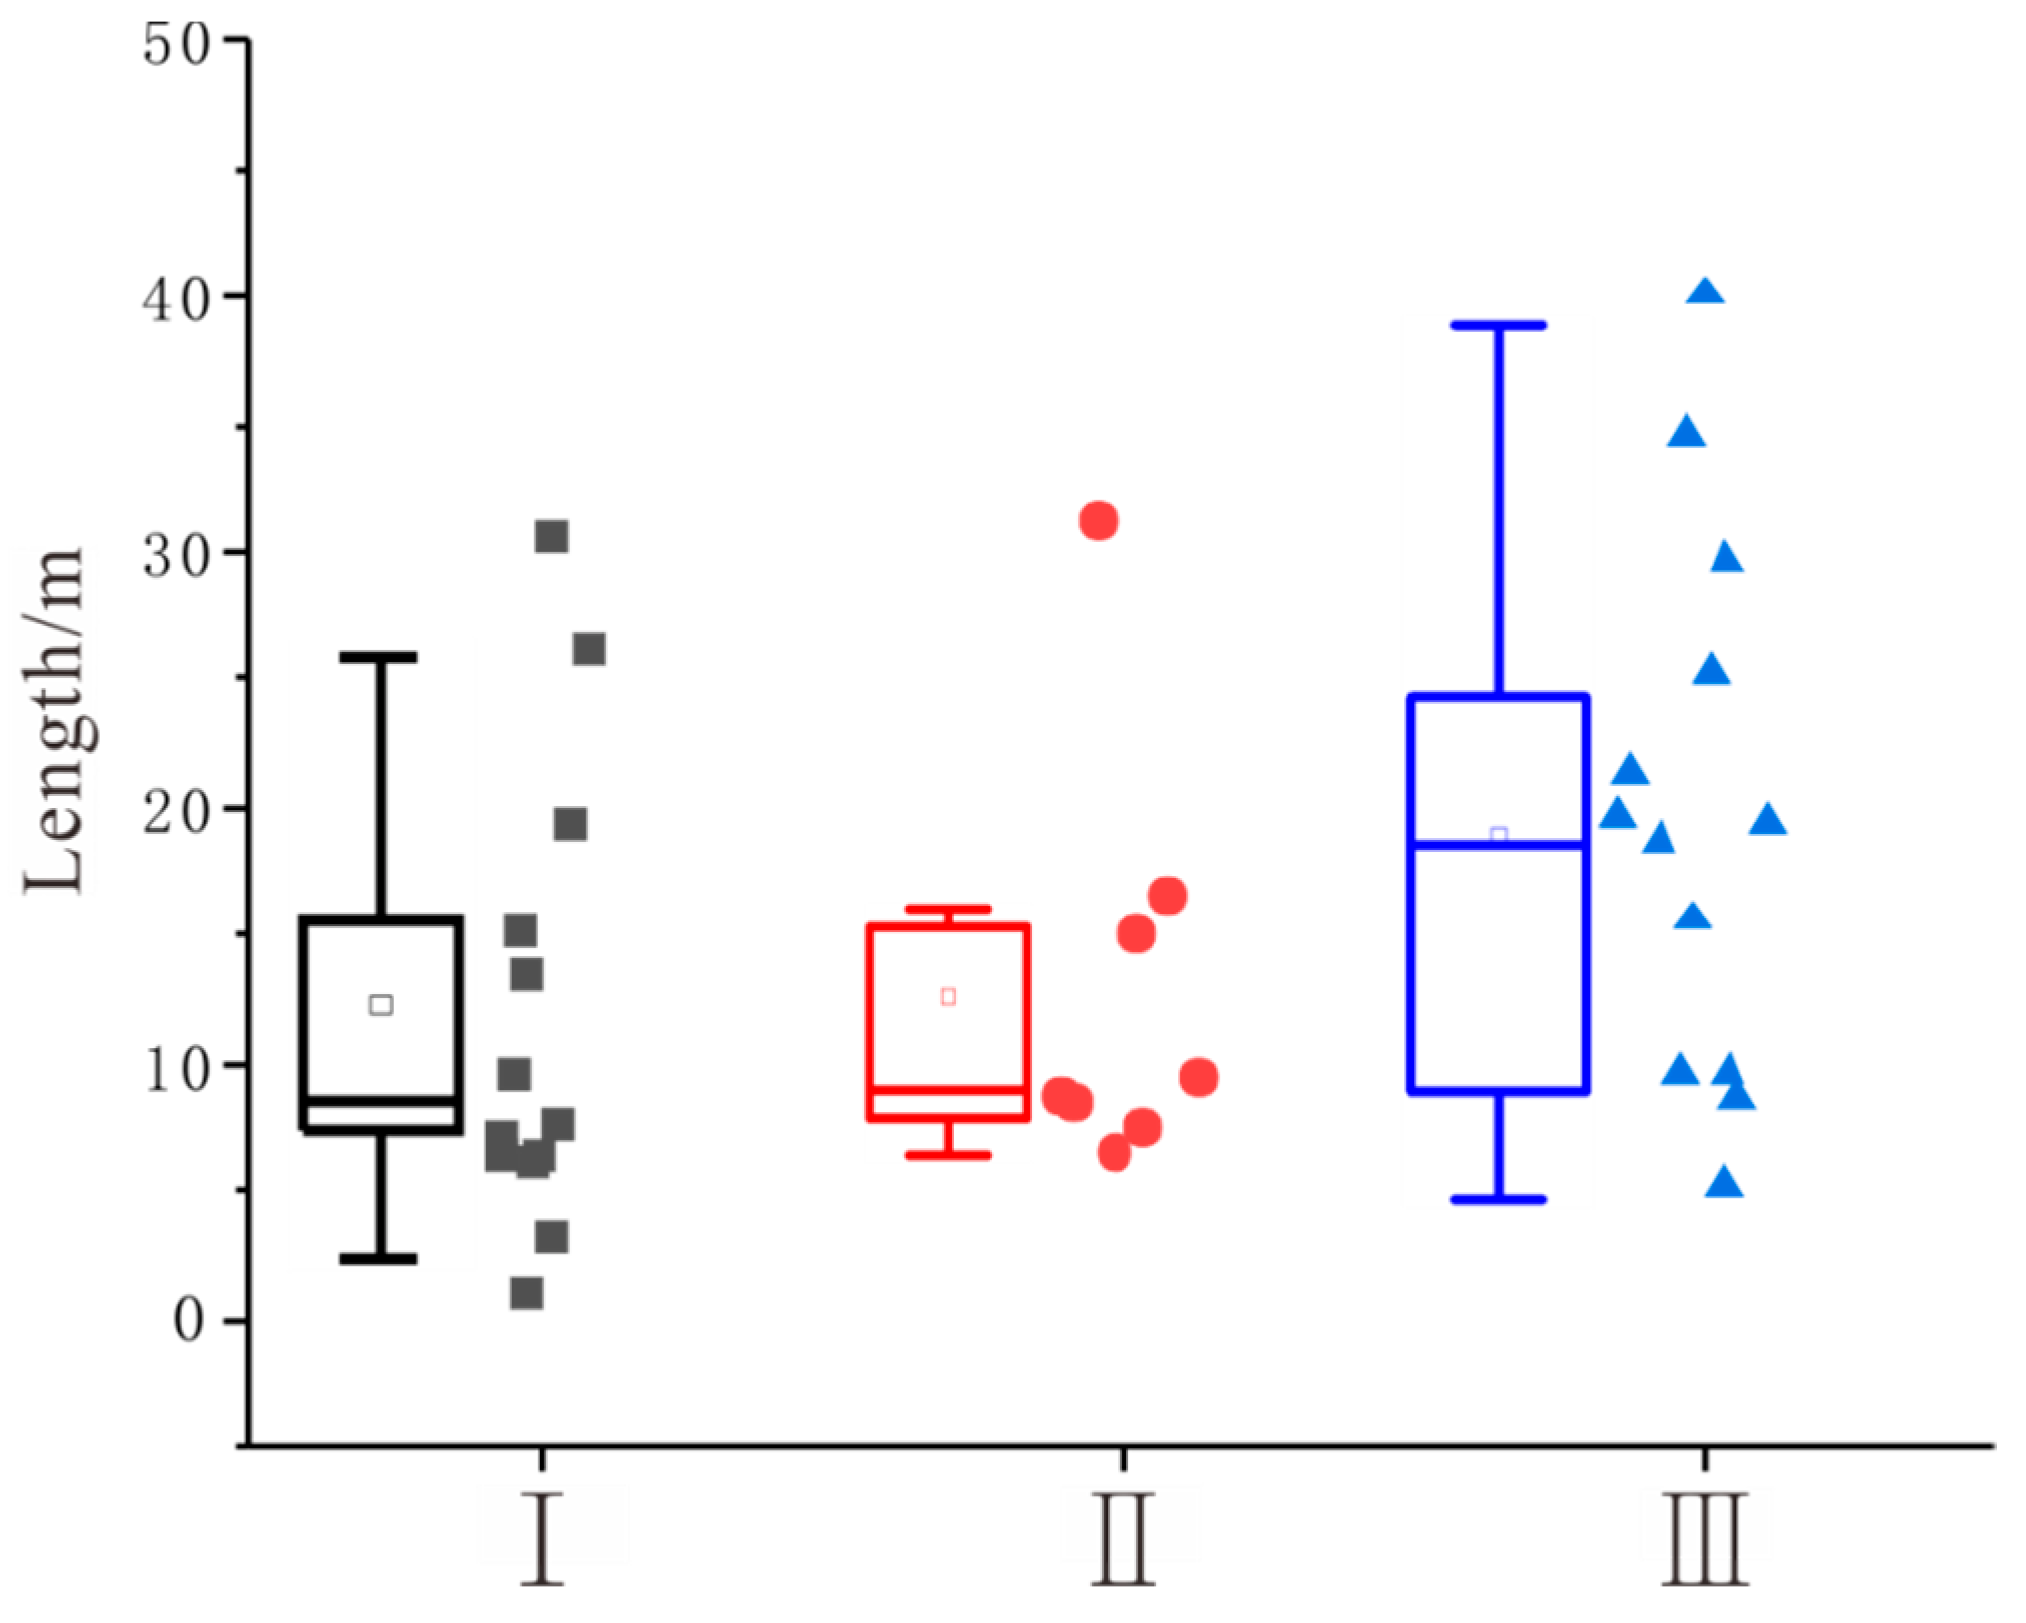
3.1. Surface Deformation Characteristics of the Landslide

Ground fissures have appeared in the landslide since December 2018 and developed continuously since then. A total of 34 existing ground fissures and backfilled fissures have been investigated on site (Figure 5). Surface cracks on the landslide mass were found to be concentrated through density analysis of 34 cracks found in a ground investigation. Drainage ditches have been built according to terrain and runoff conditions to reduce the concentrated seepage of rainwater through cracks and to bury cracks. According to the deformation characteristics, sliding depth, main sliding direction, morphological characteristics, crack development characteristics, and stratigraphic characteristics of different parts of the landslide area, the landslide area can be divided into three main areas.
Zone I is a shallow landslide with severe deformation. The sliding depth of the landslide is 10 m and the direction of sliding is 190°. The leading edge shear outlet is located on the excavation surface of the upper road of the anti-slide pile. The shape is terraced. The existing lattice support at the rear edge of the landslide and drainage ditches were built around the support, which has greatly reduced the concentrated infiltration of rainwater at the rear edge. The main cracks in this area are arc tension cracks. The crack lengths are mainly 6~19 m; the longest is 30.4 m, and the average length is 12.1 m (Figure 6). It can be seen from Figure 5 that the cracks in Zone I are concentrated at the rear edge support, and their strike is perpendicular to the sliding direction.
Zone II is in a stable state. It is a shallow landslide with a sliding direction of 233°. The topographical gradient is generally flat and has been planted as farmland. There is no fresh deformation in this area, and a terrace exists at the rear edge, which is a sliding trace of the historical landslide. The west gully is the boundary of the landslide, and the leading edge shear exit is located on the top road of the anti-slide pile, which is not obvious now. The short surface cracks in this area are concentrated mainly in terraces at the rear edge, with an average length of 5~13 m (Figure 6). Crack strike is mainly perpendicular to the main slide direction.
Zone III is the main sliding area, with a sliding depth of approximately 25~50 m. The terrain gradient is steeper at the rear edge and gentle in the middle, with a main sliding direction of 213°. The leading edge shear outlet of the landslide is located in the middle of the anti-slide pile and at the bottom of the roadside retaining wall. Slurry is discharged from the retaining wall drain and the sliding zone is strongly weathered argillaceous shale. The boundary between the rear edge and both sides is a drainage ditch. The cracks are concentrated on the west side of the rear edge, with an average length of 18.6 m and a maximum length of 40.8 m (Figure 6). The crack length shows a normal distribution. Crack strike is approximately vertical to the slip direction. The purpose of investigating the surface crack information was to partition the deformation characteristics of the landslide so as to analyze the deformation mechanism of the landslide more accurately. The crack status has been repaired.

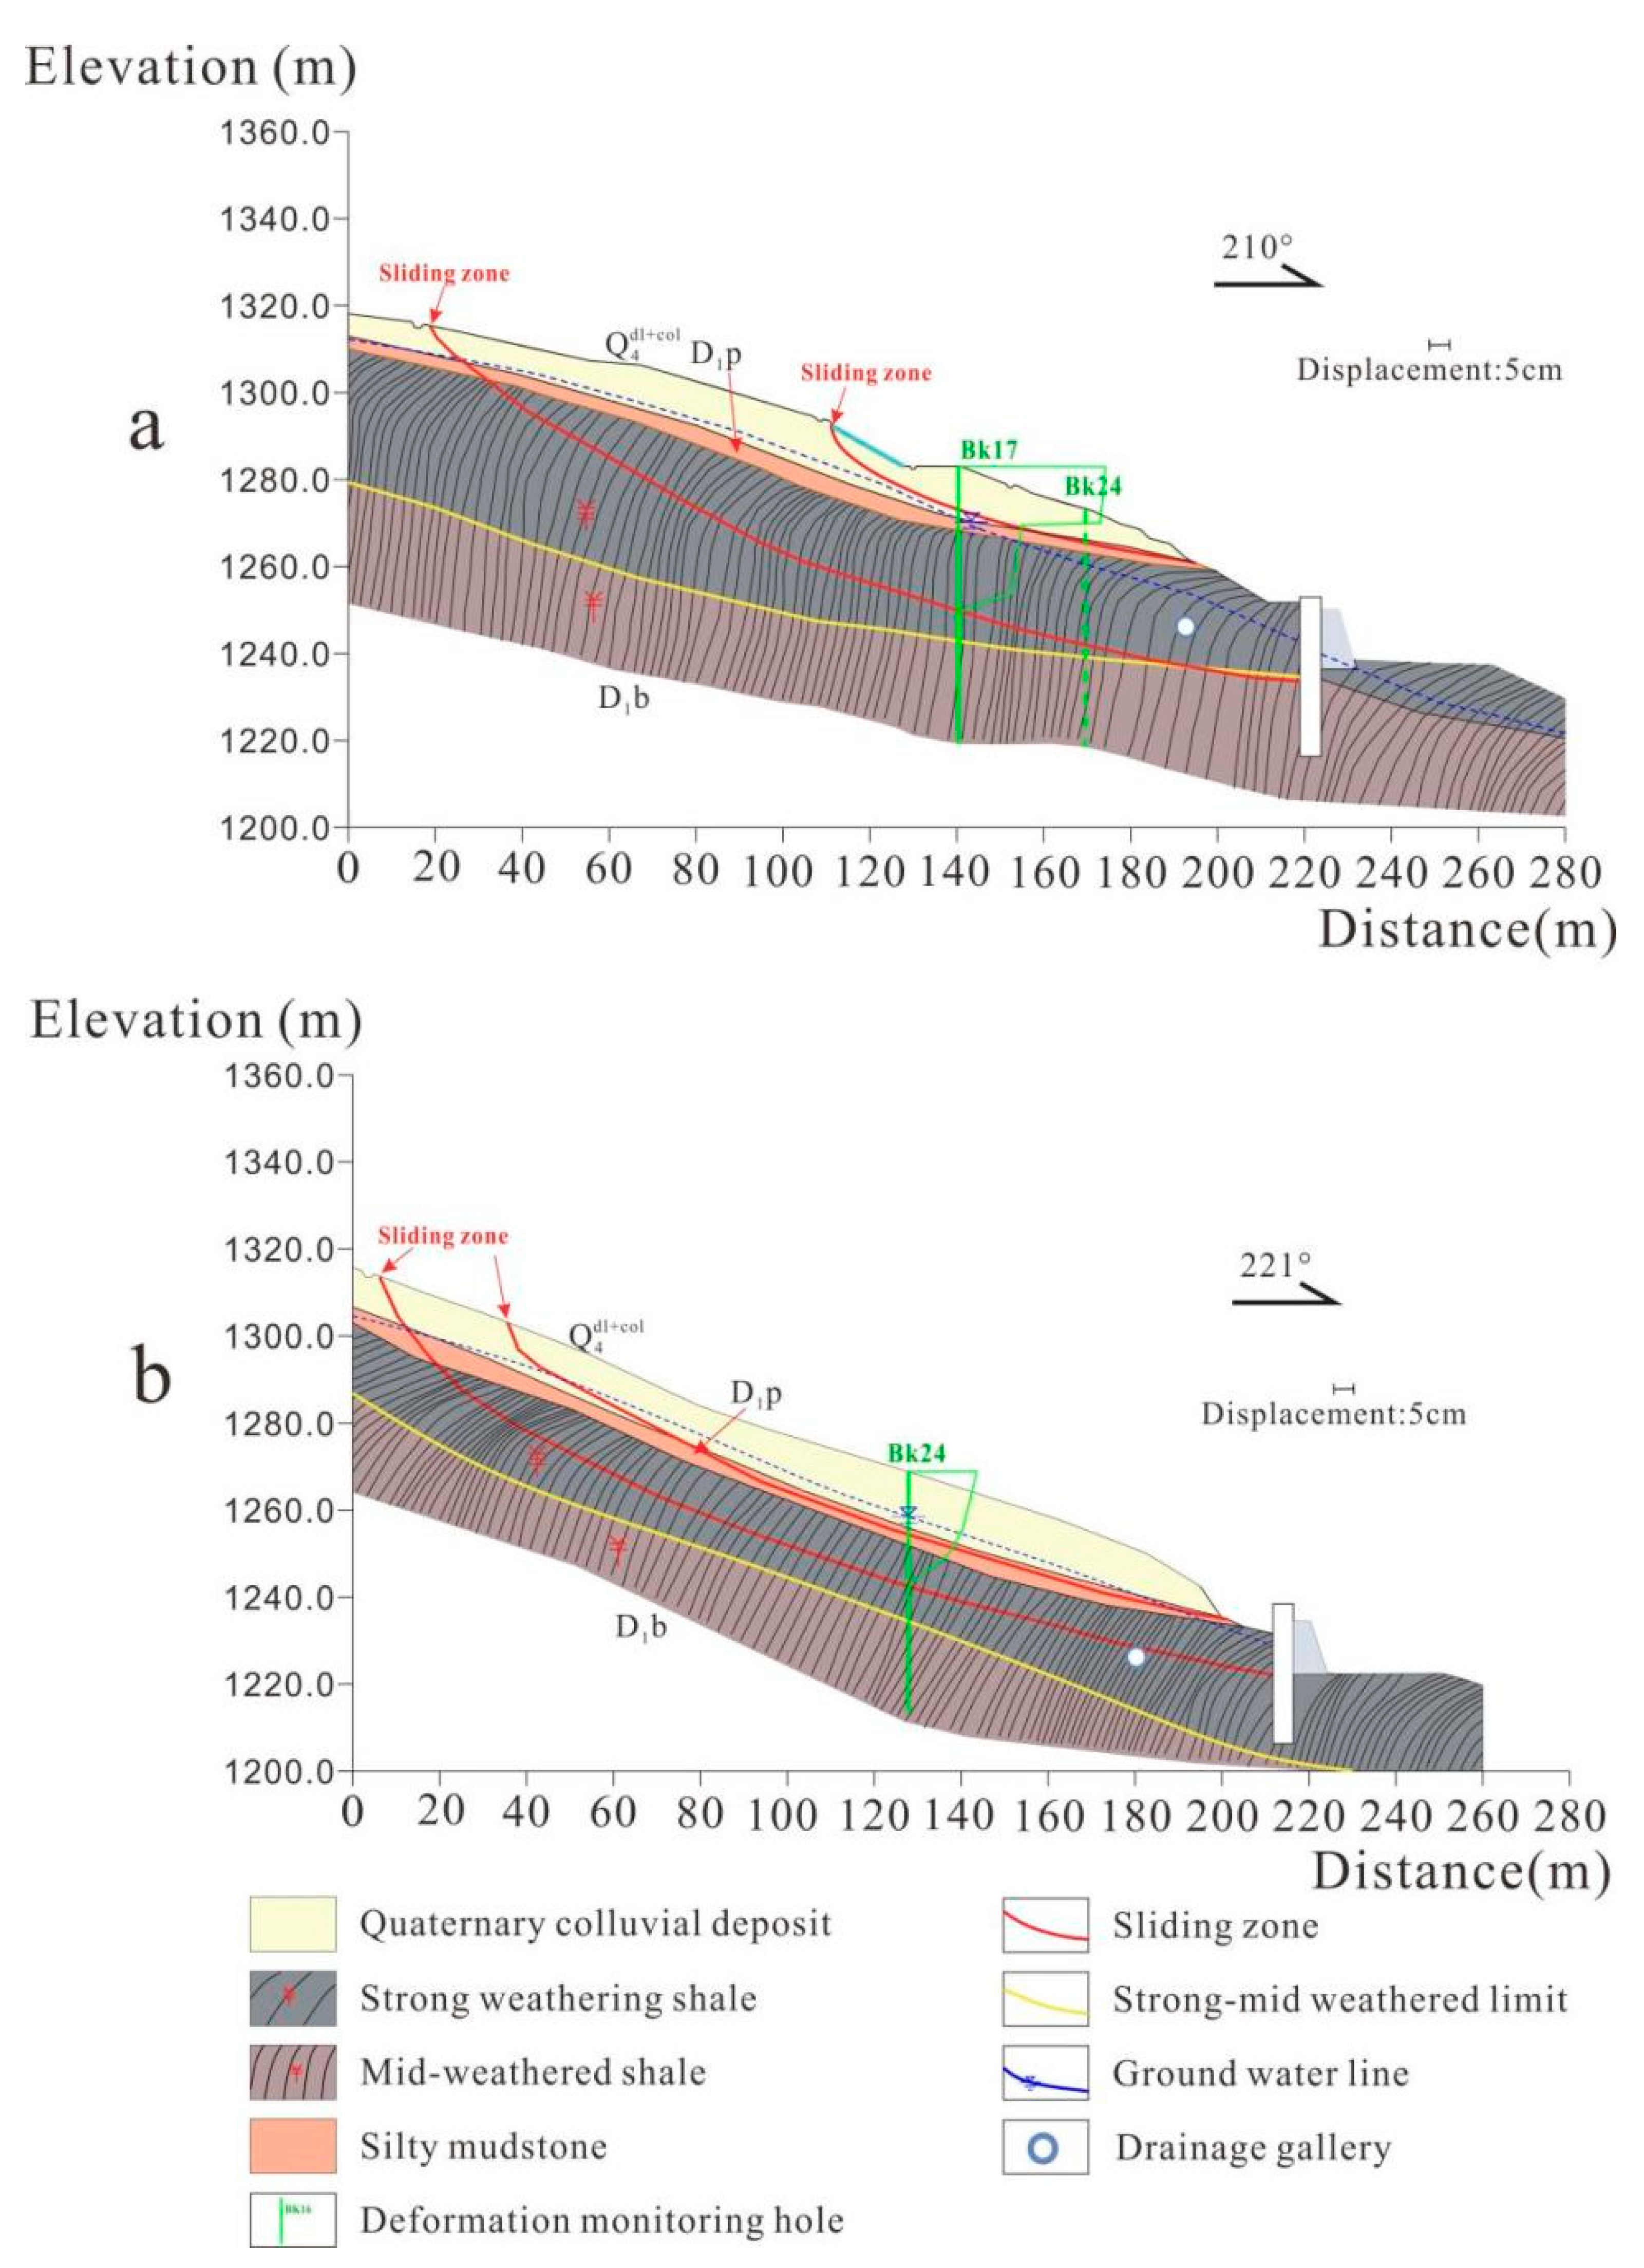
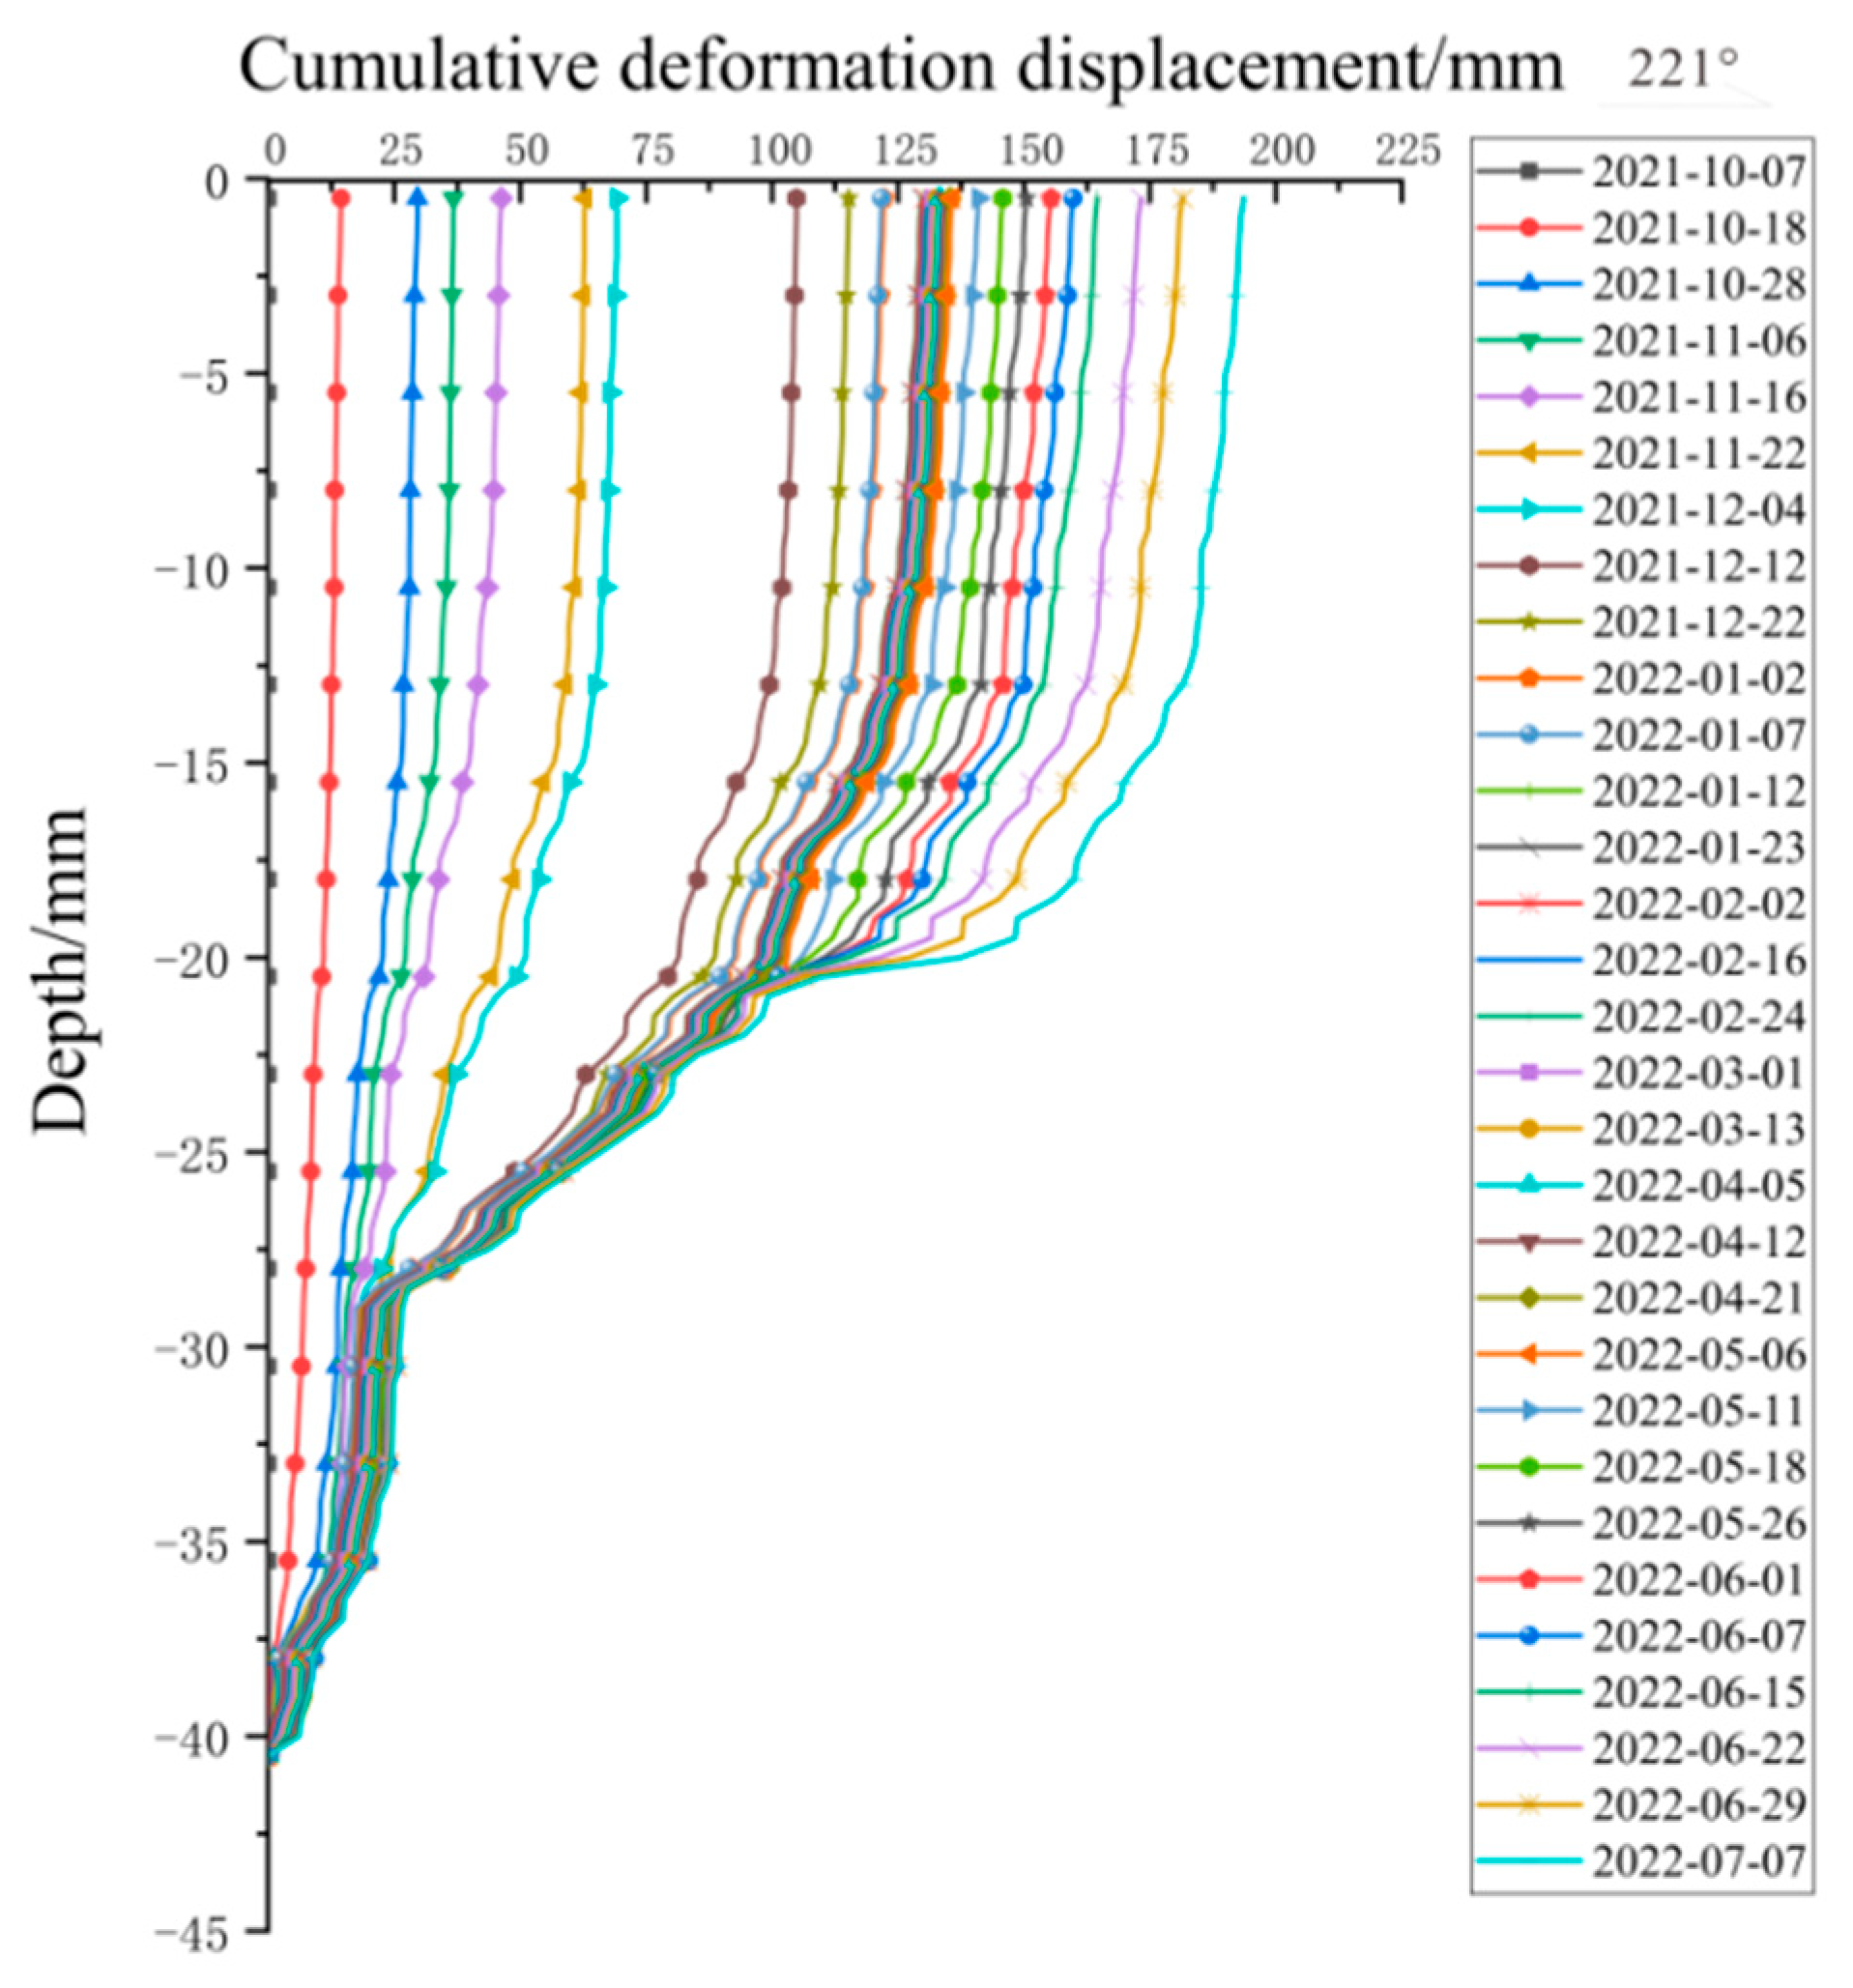
3.2. Deep Deformation Characteristics of the Landslide

Inclinometer readings were carried out in the three landslide areas, divided according to surface crack characteristics and sliding depth. Deep deformation trends and zoning accuracy of the landslide areas were investigated while verifying the depth of the landslide zone. The data obtained from deep displacement monitoring were the cumulative horizontal displacement along the main slide direction of the borehole; 0 displacement was taken as the initial monitoring time and weathered shale was taken as the non-sliding surface at the bottom of the borehole.
Deep deformation monitoring data of the BK17 borehole in Zone I are shown in Figure 7. Sliding phenomenon exists at depths of 7~11 m and 27~31 m. The shallow sliding zone is 7 m deep, which is the broken sandy mudstone of the slope toe group. The cumulative horizontal displacement reached 350 mm on 19 April 2022, when the relative displacement with the sliding bed was 200 m. It can be seen from the on-site working records that the drainage treatment of the landslide in Zone I was completed in April 2022, and the landslide in Area I stopped deforming after May 2022. Therefore, groundwater is the main factor influencing the deformation of the landslide. With the distribution of surface cracks and field investigation, it can be seen that there are tension cracks on the rear side of the BK17 borehole. The front edge has good air-conditioning due to construction and water guide pipes provided in the water barrier, so shallow sliding has formed in this area.
The deep sliding zone at 27 m depth is strongly weathered black shale with low strength and susceptibility to creep sliding, combined with drilling core data. The sliding belt is a deep sliding belt in Zone III, with a cumulative displacement of 70 mm from 22 September 2021, to 19 April 2022, and a relatively slow deformation rate compared with Zone I. After drainage treatment in Area I was completed, the accumulated displacement of the landslide was 50 mm from 3 May 2022, to 7 July 2022, and the deformation rate decreased. The landslide in Zone II has remained stable, and the inclinometer readings were aimed mainly at the landslide in Zone I and Zone III.
Deep deformation monitoring data of the BK24 borehole in Zone II are shown in Figure 8. The shallow sliding zone in this area is relatively stable. Only historical landslide marks exist at the rear edge, and the leading edge shear outlet is not exposed. Thus, the landslide does not form a good airtight condition. Deep sliding begins at a depth of 30 m, where the bottom is of strongly weathered shale, and the upper part of the sliding zone is 16 m deep, which is the bottom of the sandy mudstone of the Pojiao group and the top of the strongly weathered shale. There are no fresh cracks and slip marks near the site borehole. Monitoring data show that the maximum cumulative displacement of the landslide is 130 mm, and the overall landslide deformation shows a non-linear trend. Before 12 December 2021, the cumulative displacement rate was 1.077 mm/day. After that, the deformation rate was 0.231 mm/day, which indicates that the deformation state of the landslide is a non-linear deceleration deformation.

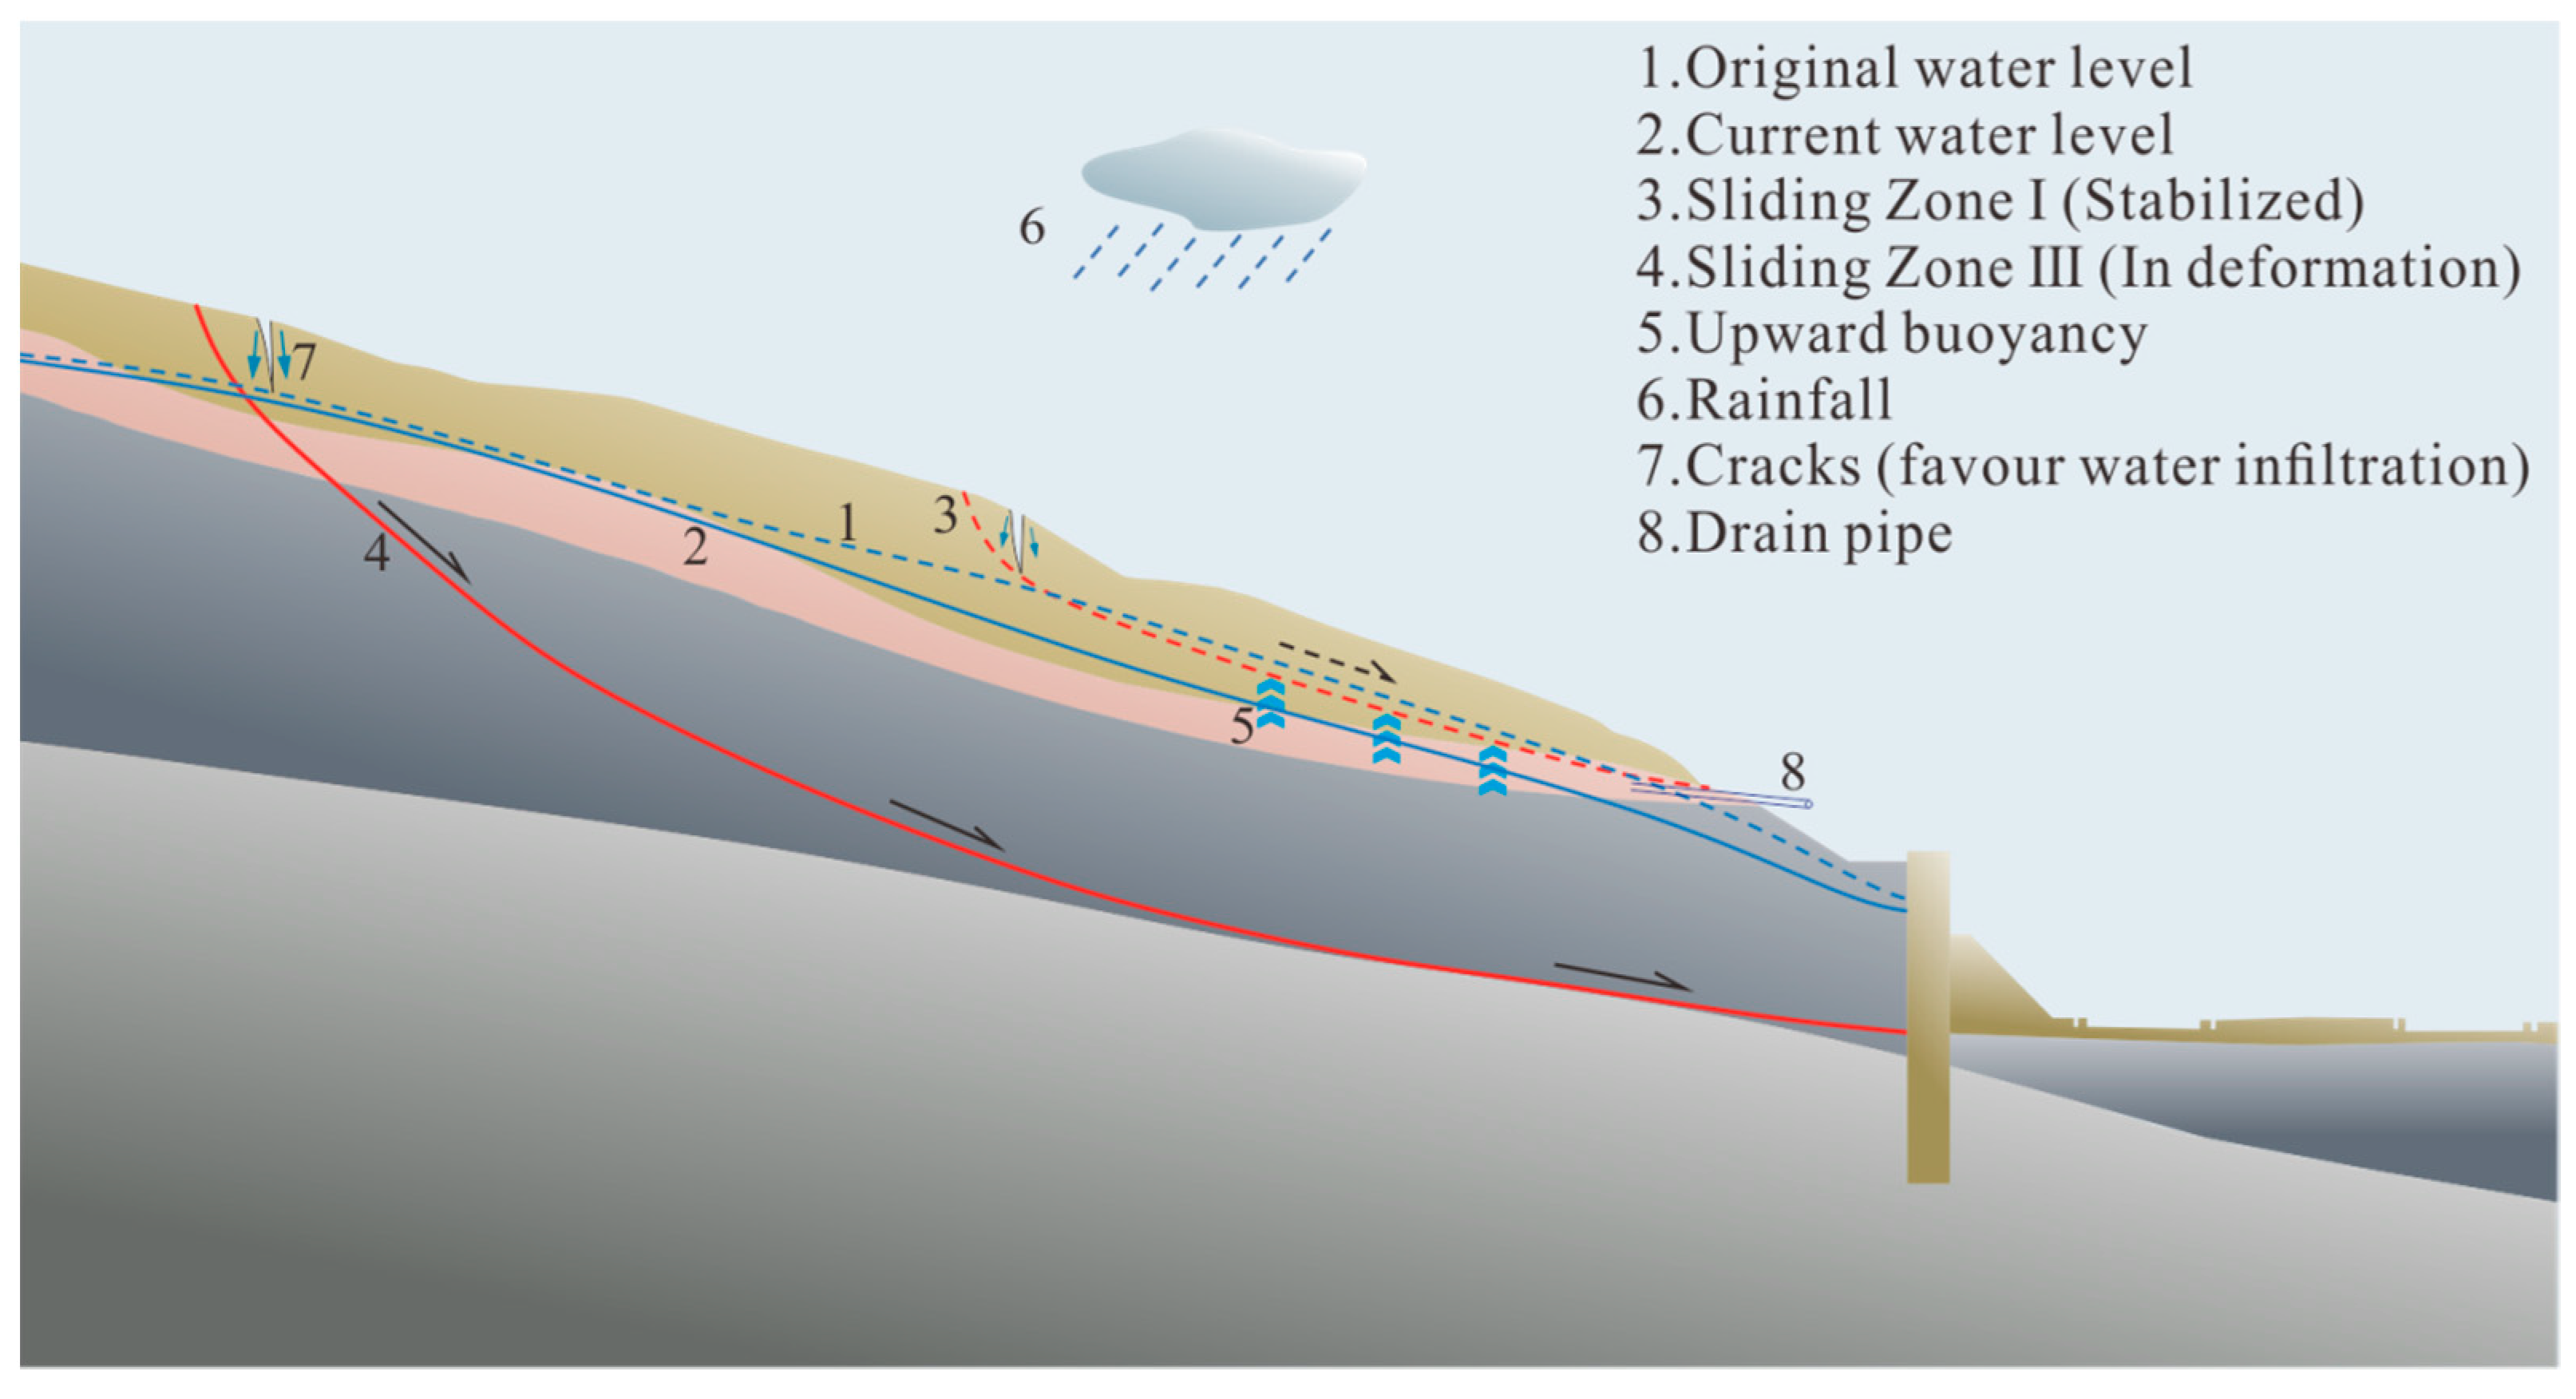
4. Mechanism of Landslide Reactivation

According to borehole data and formation information analysis, there are several aquifers in the landslide area [32], including the upper overburden and the middle strongly weathered shale. Groundwater in the slope is distributed in the form of phreatic water [33] and bedrock fissure water. A field pumping test shows that the water level drops rapidly after pumping and groundwater in the borehole is exhausted. It takes approximately 24 h for the groundwater level to recover, indicating that the permeability of the landslide is poor. The water body infiltrates into the sandy mudstone of the slope foot formation due to external factors, such as rainfall, and groundwater enrichment occurs in the fractured mudstone zone due to poor permeability of the upper overburden layer and lower strongly weathered shale of mudstone [34]. Hydrostatic pressure will be formed on the clay layer at the bottom of the avalanche deposit and strong weathered shale, which will cause the phenomenon of “boating” in the upper overburden layer and result in the occurrence of a landslide in Zone I. Groundwater flows slowly in the slope body and the existing retaining wall drainage tunnel is seriously blocked. The impermeability of moderately differentiated shale leads to long-term saturation of strongly weathered shale, which increases the self-weight of the slope body and reduces the sliding resistance at the same time. Therefore, an excessive groundwater level is the main cause of landslide deformation in Zone III.
According to the field investigation and displacement monitoring data, the status quo of Zone II is stable, without any slip marks. Excavation and support work have been carried out for the accumulation of the rear edge of the landslide, which has reduced the sliding force of the shallow landslide. Landfilling and construction of drainage ditches for cracks at the rear edge reduced the increase of the groundwater table caused by rainfall infiltration. Construction of a water guide pipe at the front edge shear outlet accelerated the diversion of groundwater and reduced the groundwater level (Figure 9). The displacement rate of deformation before treatment in Area I reached 1.301 mm/day. After the water level was reduced, the displacement rate in Area I was 0.091 mm/day, and the displacement rate of the landslide in Area III decreased from 0.674 mm/day to 0.341 mm/day. This shows that the deformation of landslides can be effectively reduced by lowering the groundwater level [35], and the landslide in Zone III should be treated by setting drainage facilities to a lower water level.

5. Preliminary Stability Analysis of the Landslide

The reason for the deformation of Zones I and III is that the groundwater level of the slope body is too high. The high groundwater level increases the weight of the landslide, and the front slope surface becomes the route of surface water discharge. The groundwater is immersed in the soil for a long time, softening it and changing the mechanical properties and strength of the surrounding soil. It generates buoyancy on the overlying rock and soil layer and reduces the effective positive stress and friction resistance, thus increasing slope instability. In this paper, the Seep/W module in Geo-Studio was used to reduce the groundwater level in Area III by setting the drainage tunnel, and it was used to analyze the stability of the landslide under different groundwater level conditions. The main purpose of our data simulation was not to assess the seepage laws of groundwater but to show that excavation of an underground drainage gallery can effectively reduce the groundwater level and, thus, increase the stability coefficient of the landslide.

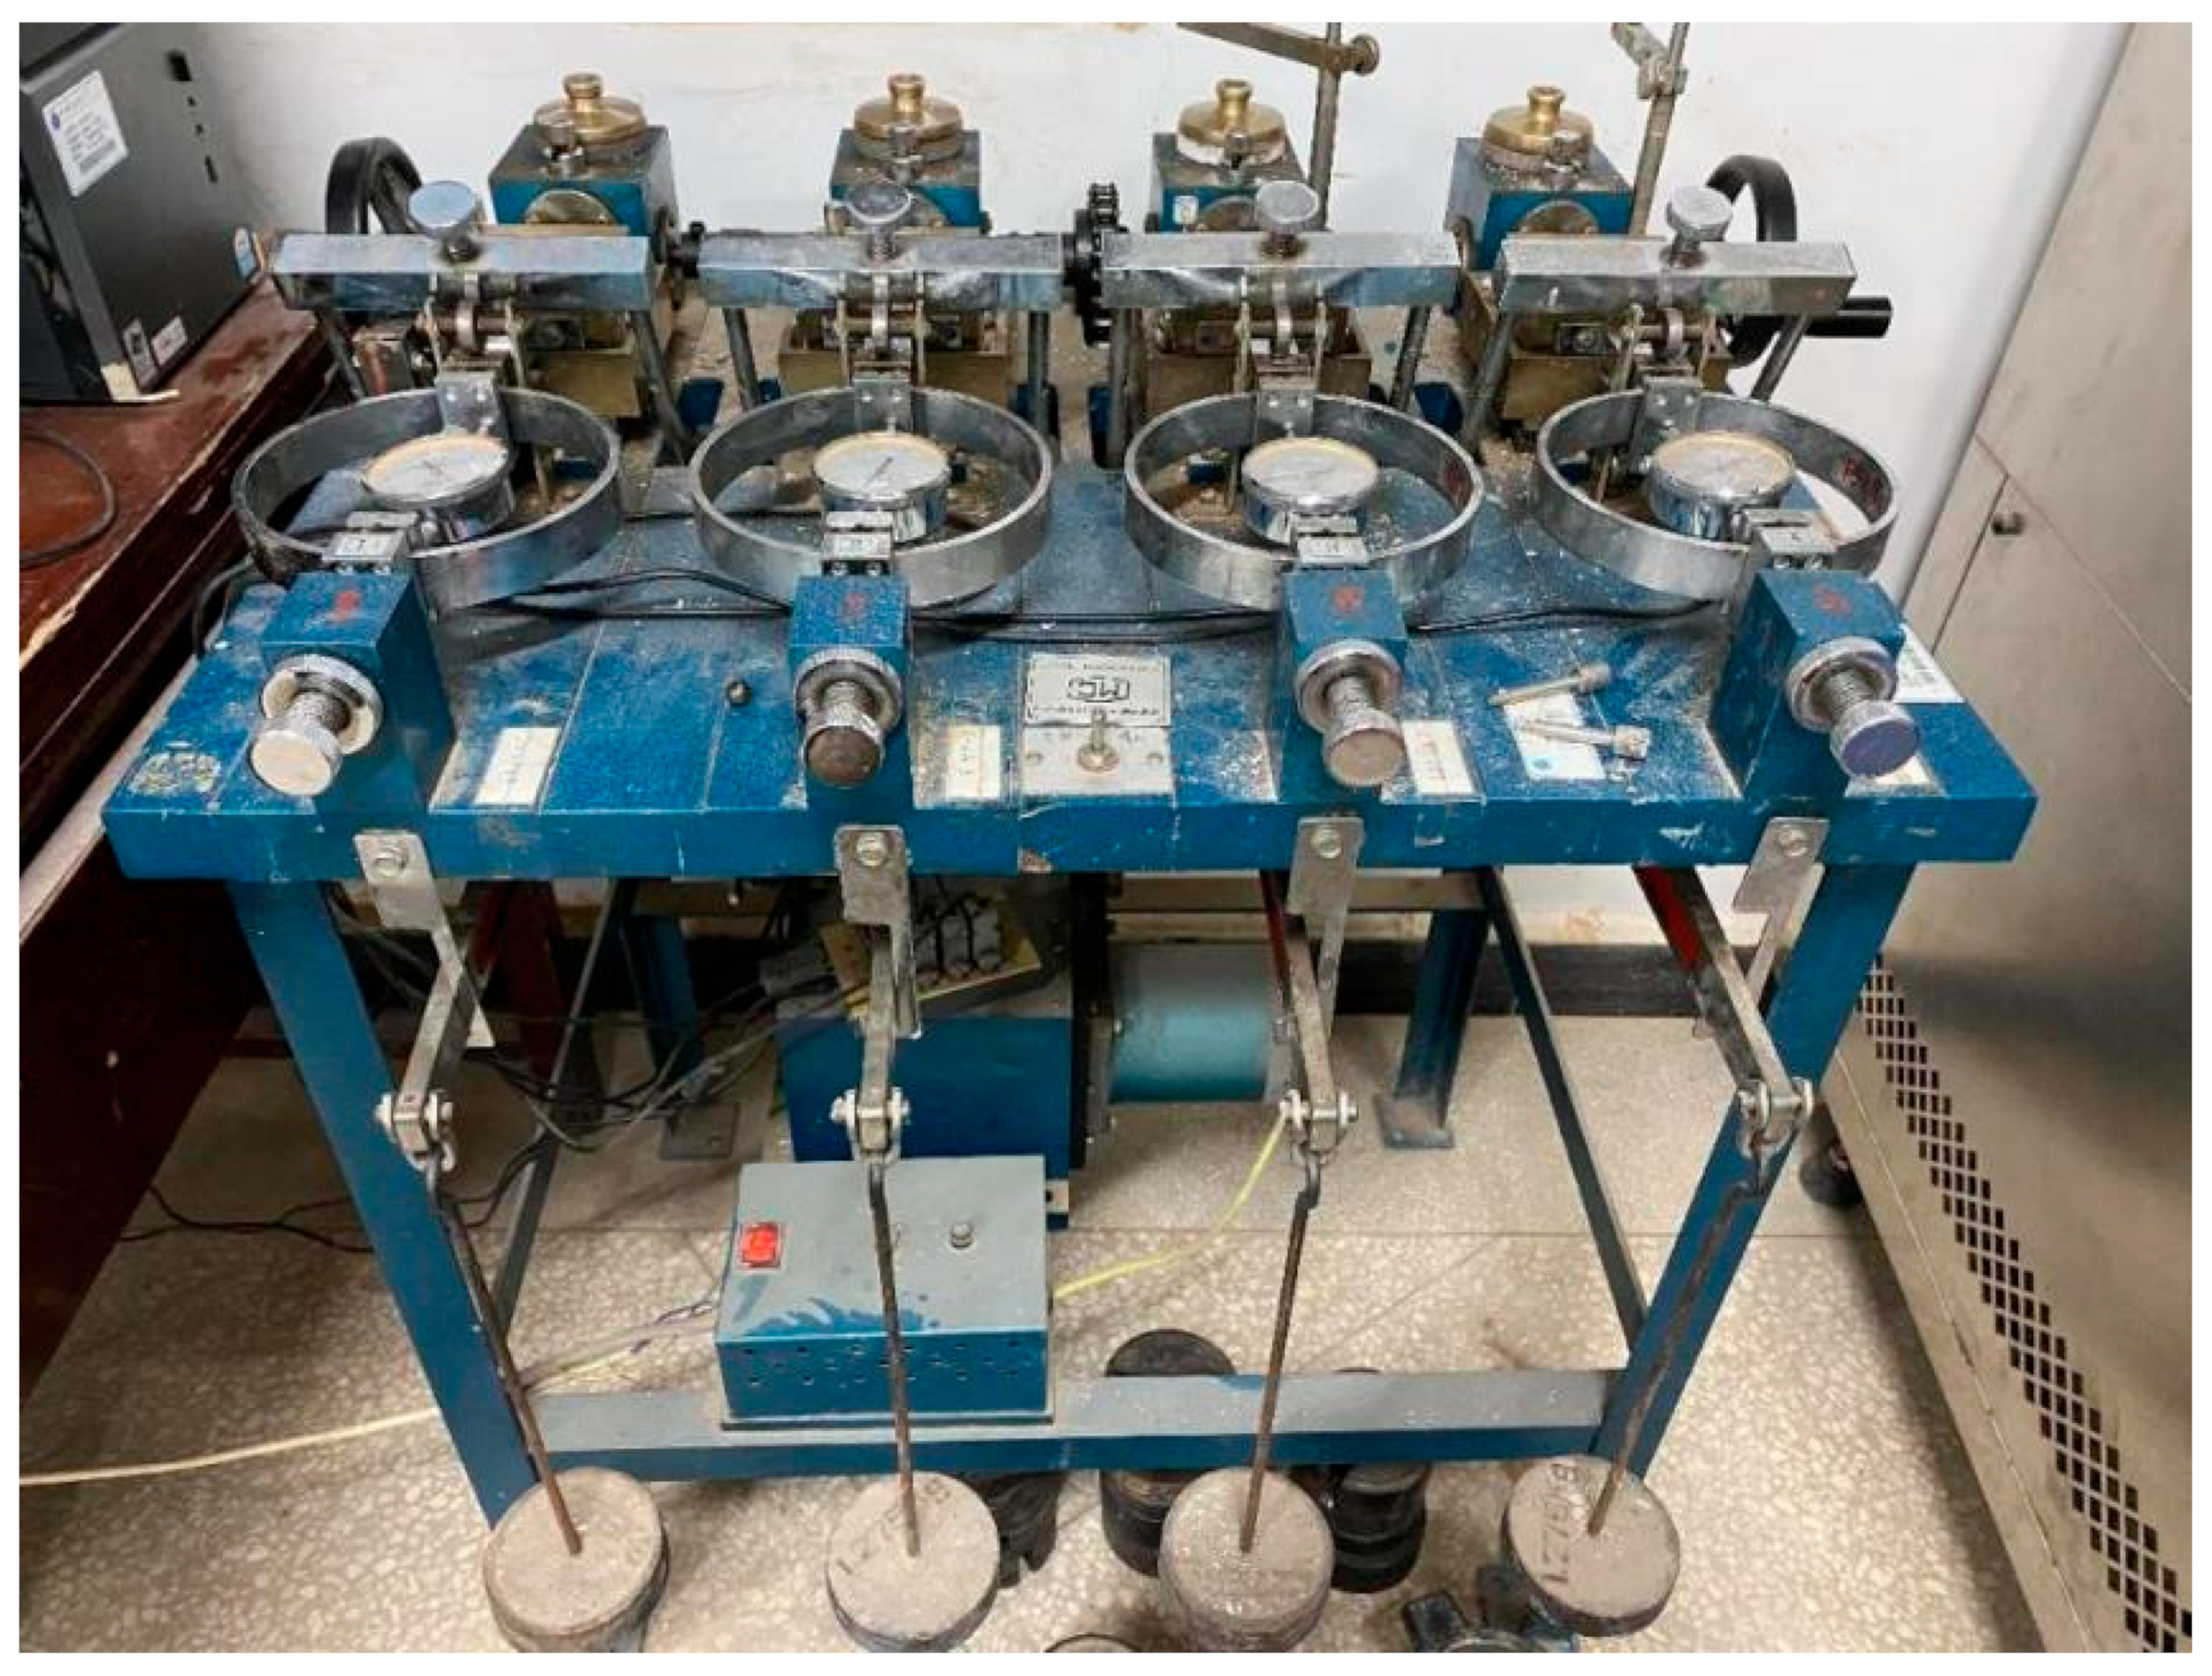
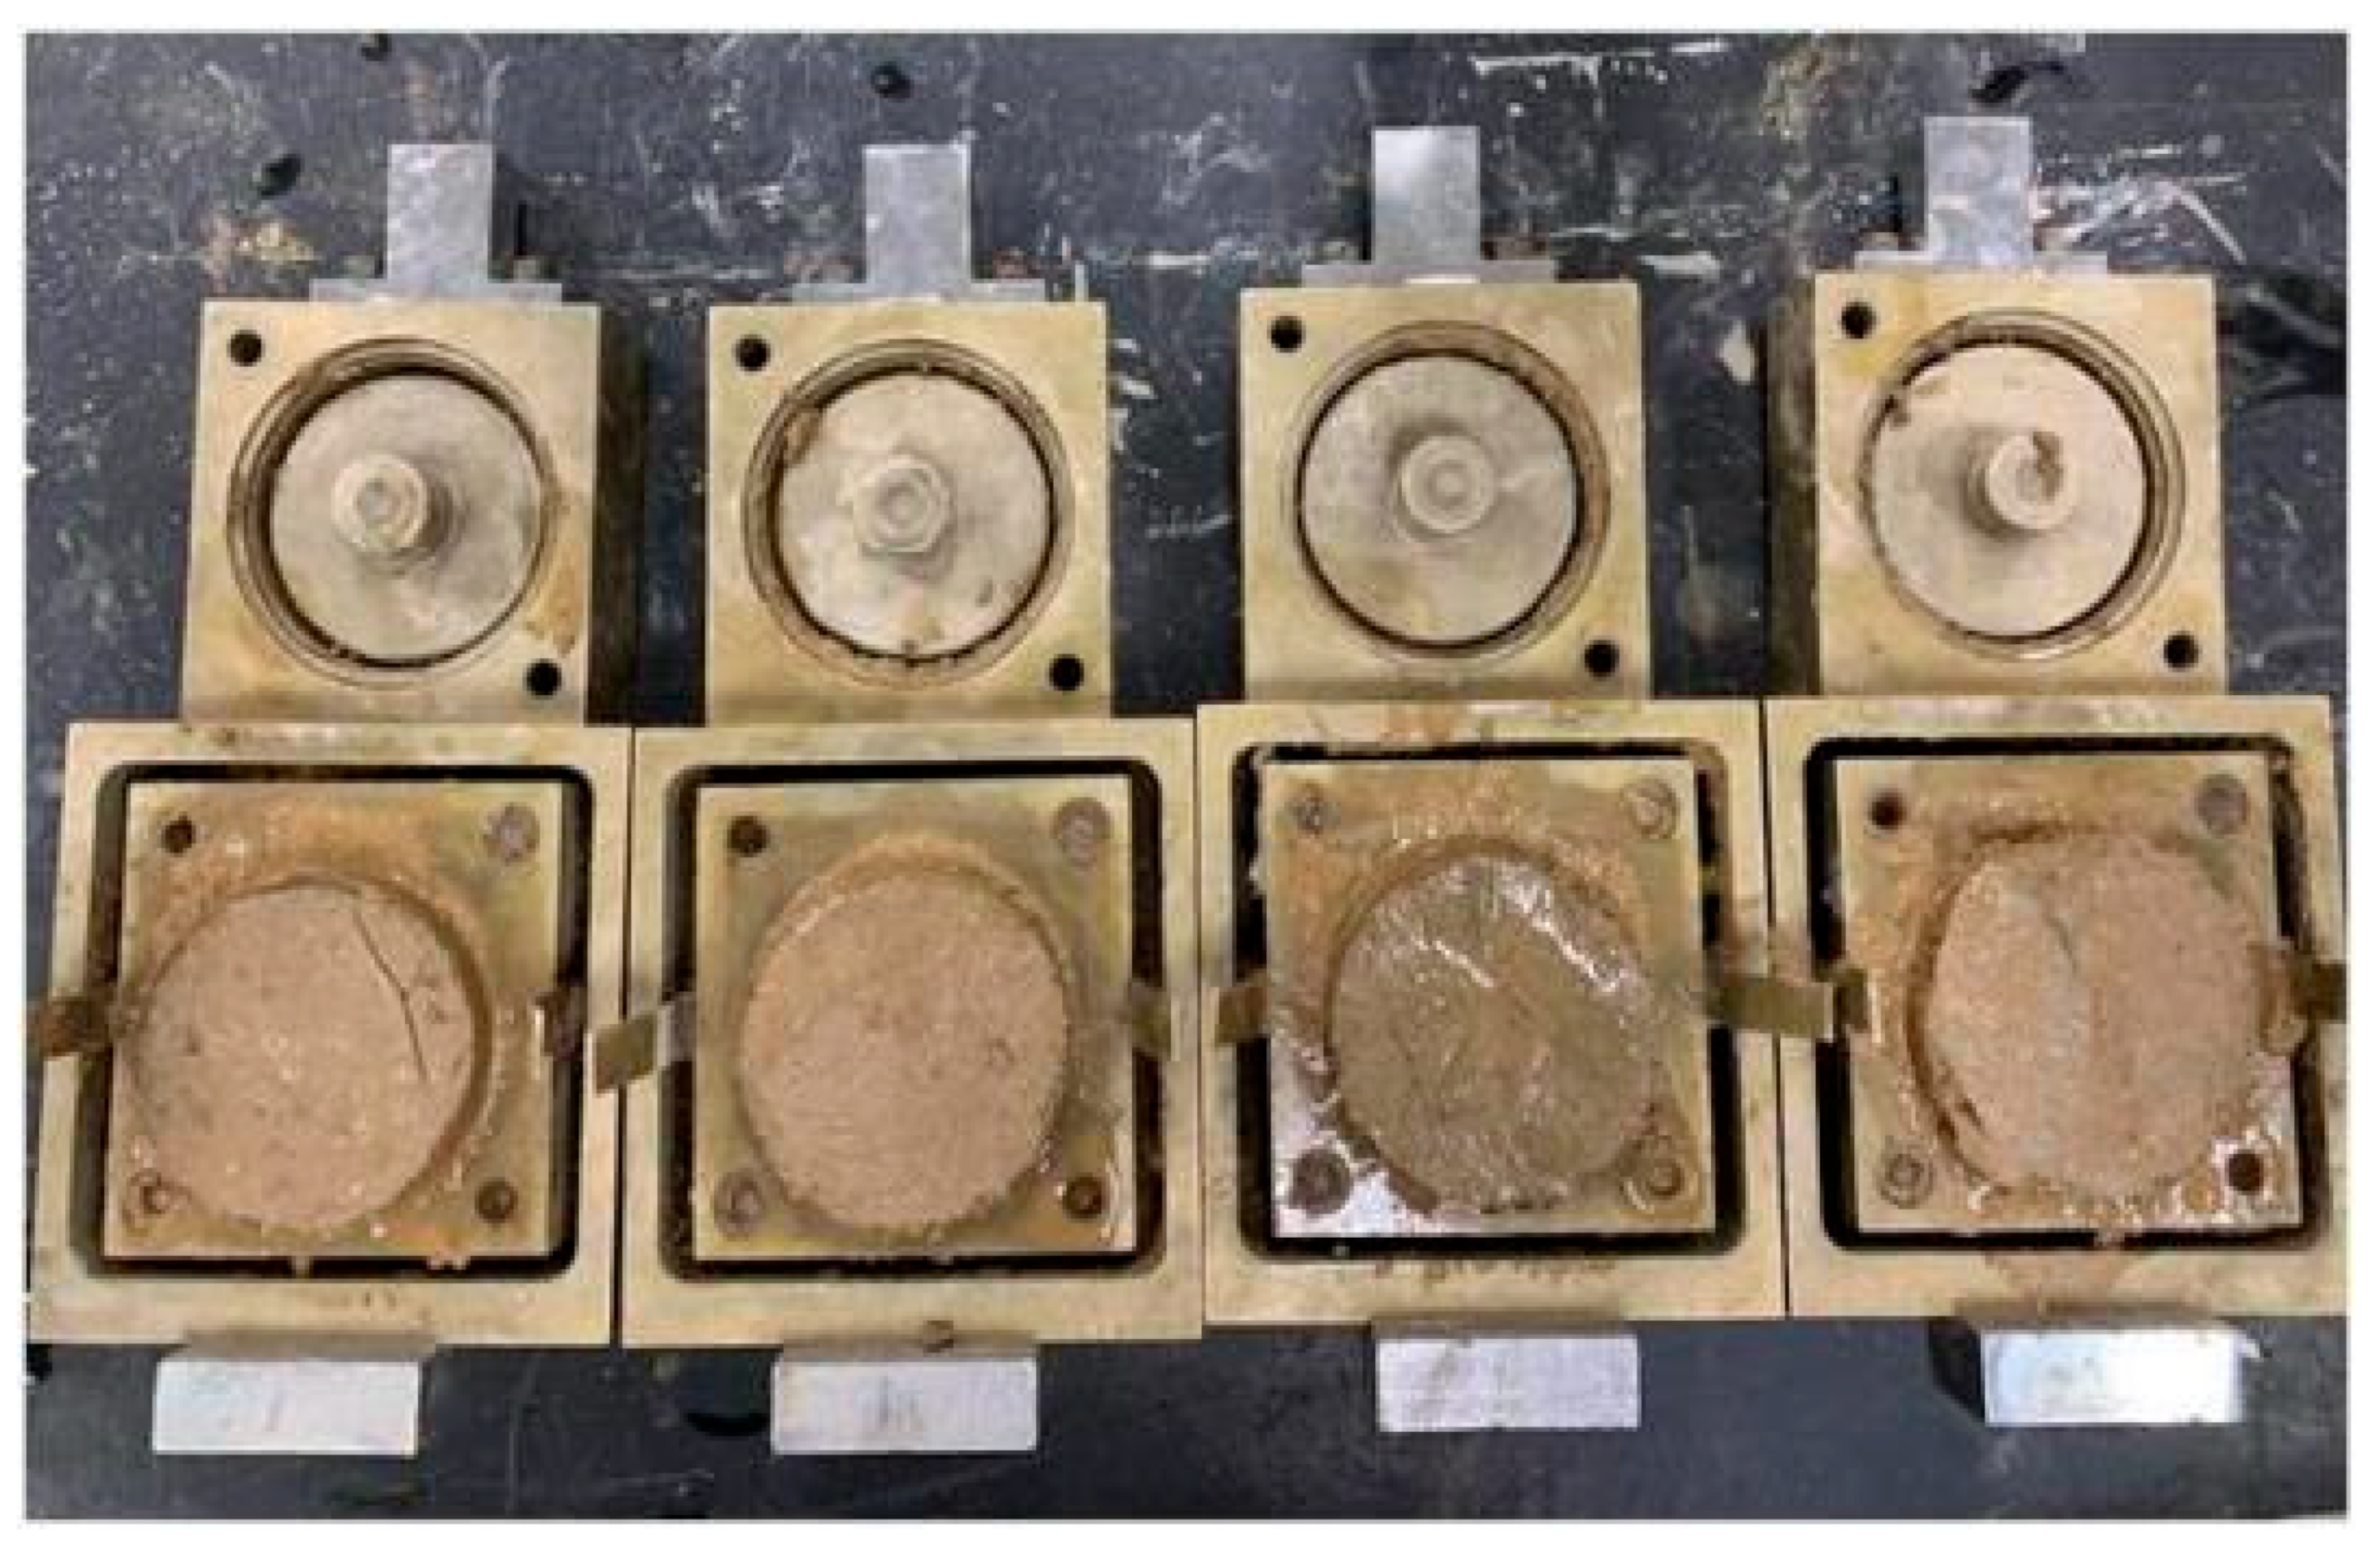
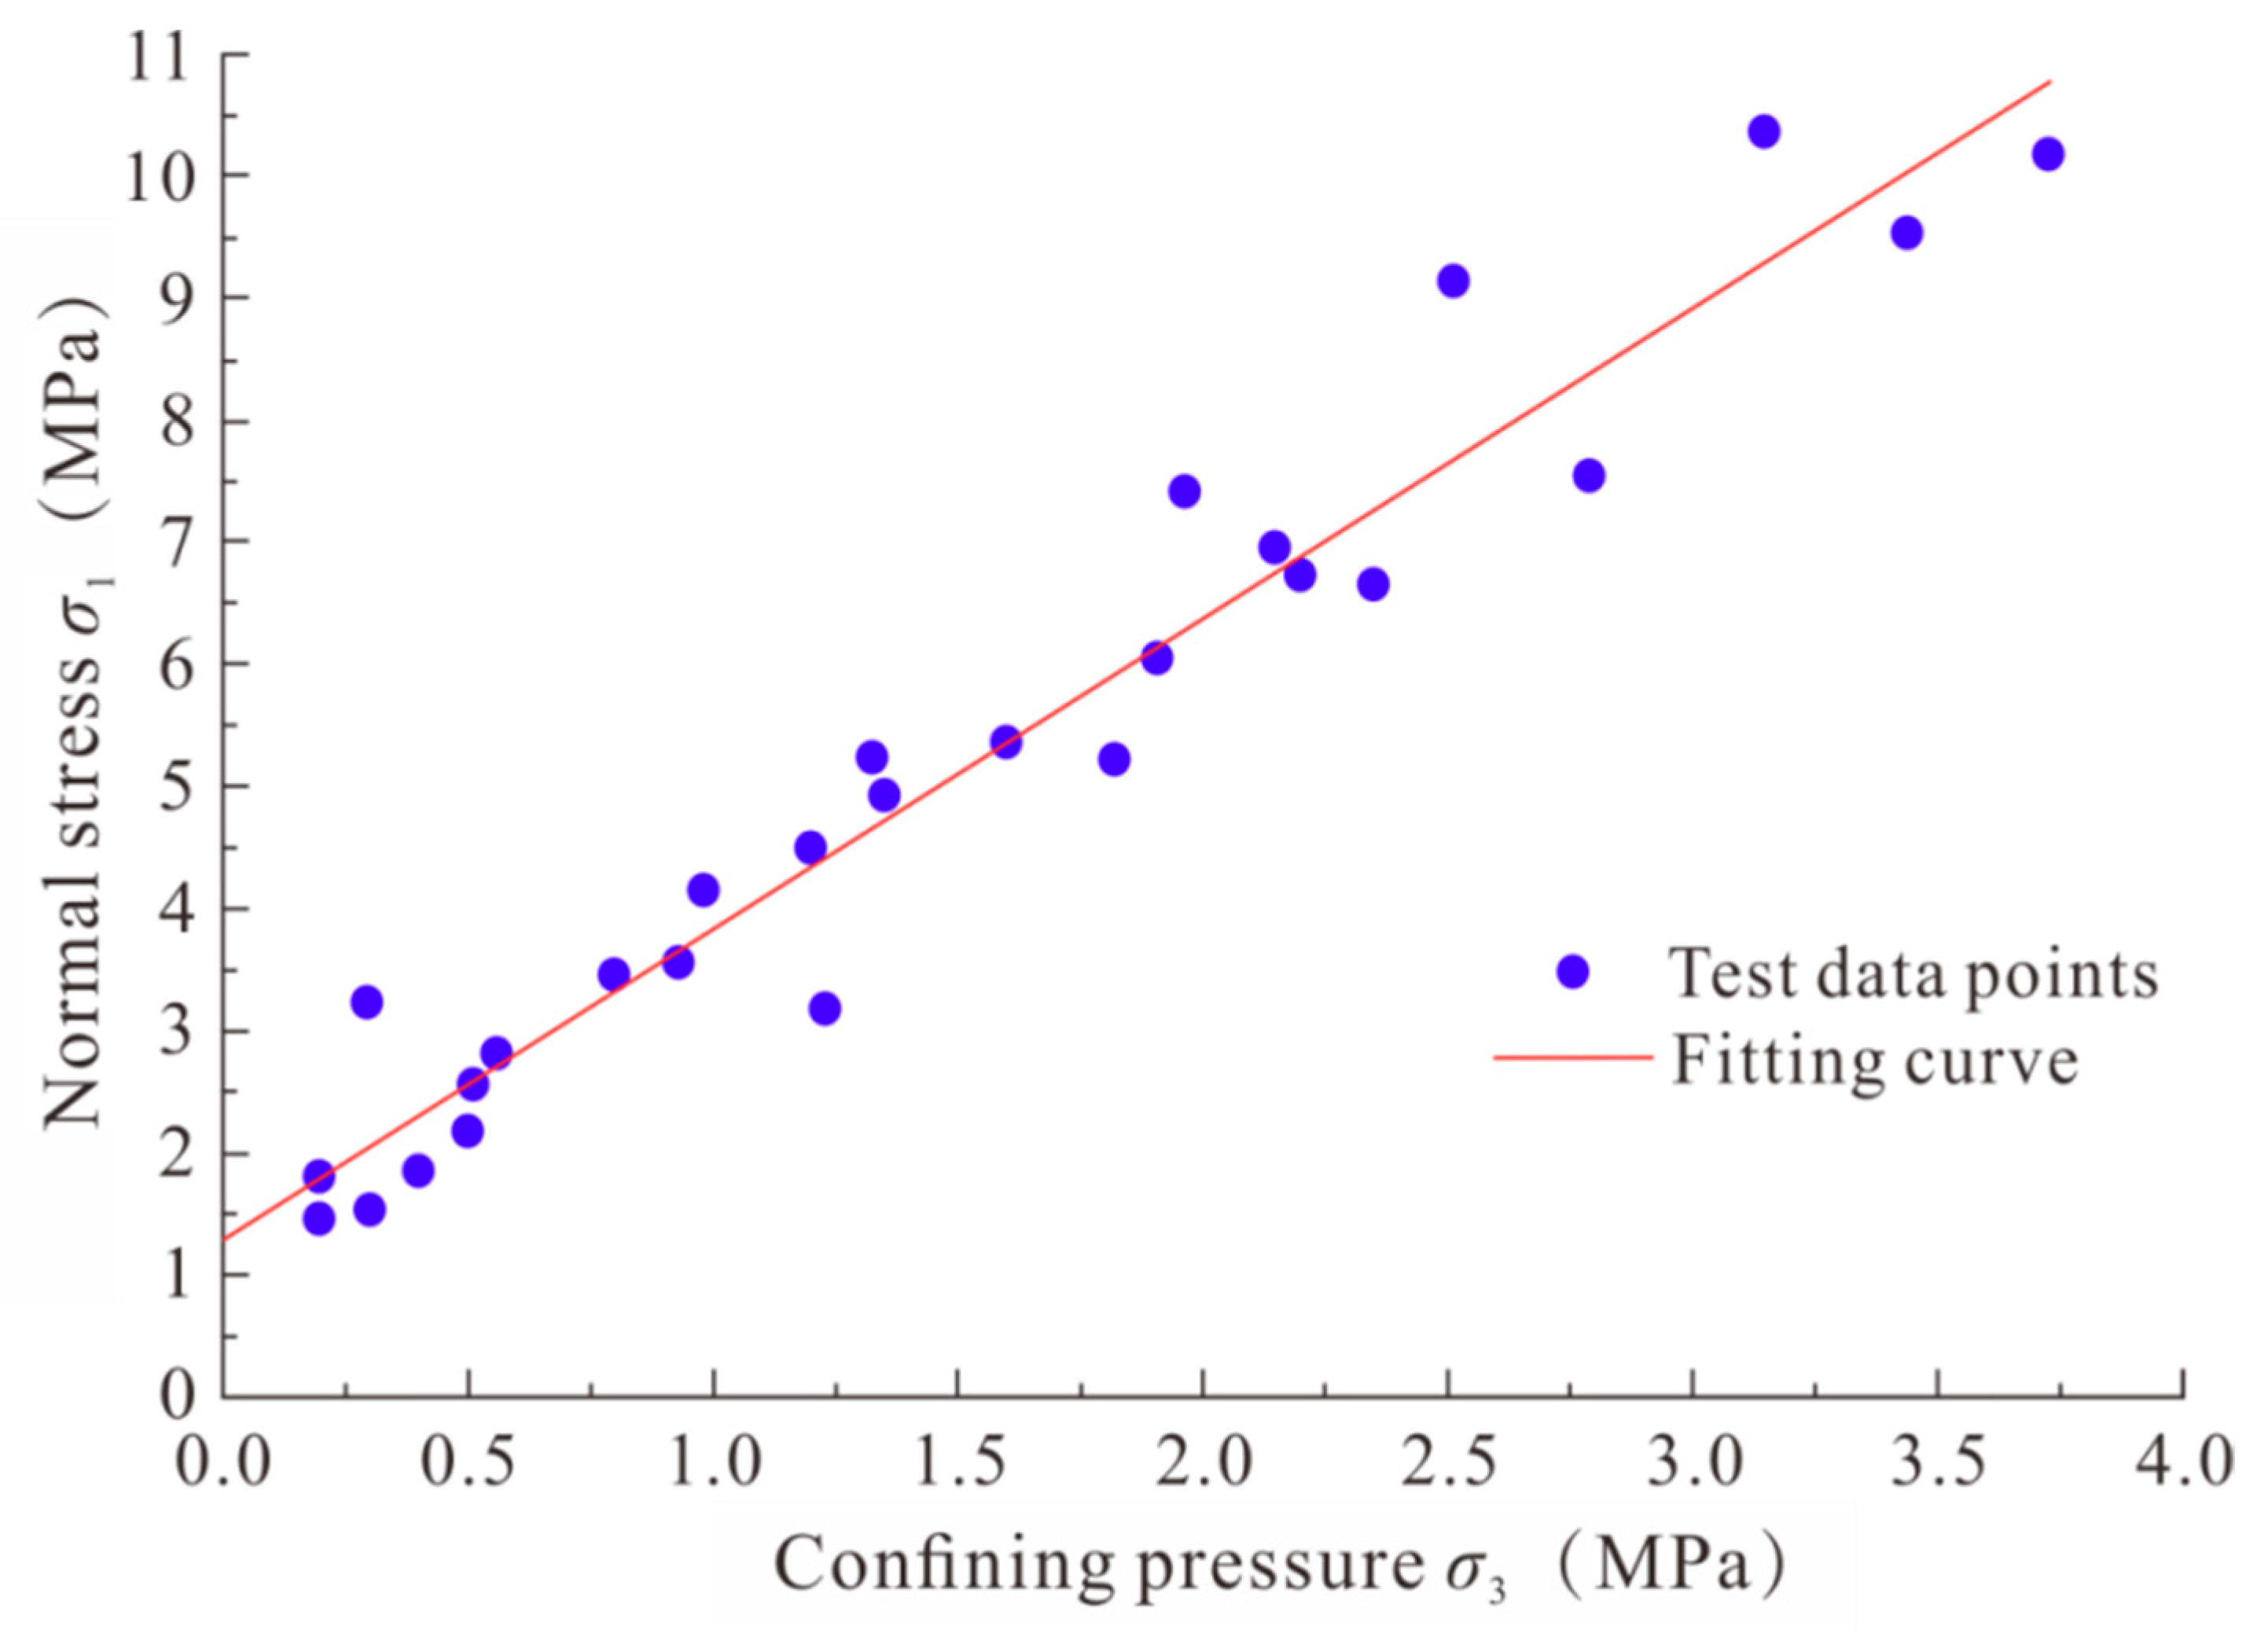
5.1. Calculation Parameters

In this paper, the Fredlund permeability coefficient function estimation method provided by Seep/W is used to predict the water content of unsaturated permeability coefficient through the volume water content function and saturated permeability coefficient. The Fredlund method is composed of obtaining unsaturated permeability coefficient by integrating along the whole volume water content function. Its control equation is as follows:
k w = k s i = j N θ e y θ Ψ e y i θ e y i i = j N θ e y θ s e y i θ e y i
where kw is the permeability coefficient (m/s) calculated from the formulated water content or negative pore water pressure; ks is the saturated permeability coefficient (m/s); θs is the saturated volume water content; y is the dummy variable representing the negative pore water pressure algorithm; the numerical spacing is between i-j and N; j is the minimum negative void water pressure described by the final function; N is the maximum negative void water pressure described by the final function; and Ψ is the negative void water pressure corresponding to step j.
The soil in the sliding zone of borehole BK17 was sampled on site, and the shear strength parameters of the soil in the sliding zone were determined by direct shear test. The test equipment for the shear strength of the soil in the sliding zone was a quad electric direct shearing instrument (Figure 10). The four normal stresses in the direct shear test were 50 kPa, 100 kPa, 150 kPa, and 200 kPa, respectively. The shear strength of soil mass often varies greatly under saturated and unsaturated conditions [35,36,37]. Five groups of direct shear tests were carried out in the natural state and saturated state, respectively, and the shear strength parameters of the sliding zone soil were characterized by the test results. The sheared specimens are shown in Figure 11, and the test results are shown in Table 1.
In Seep/W-based seepage analysis, the basic boundary conditions include two types, namely discharge type boundary conditions (Type Q) and constant head boundary conditions (Type H). The seepage field in the study area has only stable groundwater recharge, and there is no such situation as the rise and fall of river water level, so only the constant head boundary is used in the model. The model is 270 m long, 115 m high, with an elevation range of 1200~1315 m and head heights of 1285 m on the left and 1235 m on the right. Saturated permeability coefficient of each soil layer of landslide measured by test (Table 2).
Complete shale samples from the BK17 borehole were taken on site, and laboratory tests were carried out. The maximum axial pressures of the specimens under various confining pressures were obtained by applying multi-stage confining pressure to the triaxial test, and the test results are shown in Figure 12. In this paper, a calculation model was established by referring to the test result parameters (Table 2) and taking I-I’ as the calculation section. According to the difference of material composition of actual strata, the model was divided into five layers: weathered bedrock, strongly weathered bedrock, support structure, overburden, and subgrade. The two-dimensional model of the groundwater flow field of the four-stage excavated slope after meshing is shown in Figure 13.
According to Terzaghi’s effective stress principle, the total stress is borne by the effective stress and pore water pressure. When the groundwater level in the landslide rises, the pore water pressure in the slip zone increases, resulting in the reduction of the effective stress in the slip zone, thus reducing its shear strength. On the other hand, the unsaturated soil between the original groundwater level and the existing groundwater level of the sliding mass becomes saturated soil, which leads to the increase of the unit weight of the sliding mass and the increase of the sliding force. Under these two actions, the stability coefficient of the landslide decreases and the deformation intensifies.
Although we did not have a suction measuring device, according to the suction axis translation principle and the unsaturated soil theory, we tested the shear strength of the natural and saturated sliding zone, respectively, which is equivalent to testing the shear strength of the natural suction sliding zone and the shear strength of the 0 suction sliding zone. In Geostudio software, the corresponding soil–water characteristic curve can be selected as long as the parameters such as soil type and density are known. Therefore, we tested the natural density, natural moisture content, specific gravity, particle grading, shear strength, etc., of the slip zone, determined the engineering classification of the slip zone soil according to the test results, and then selected the appropriate soil–water relationship according to the database provided by the software. Therefore, it is of significance to carry out shear strength tests of different saturation slip zones.

5.2. Calculation Results

Morgenstern Price was used to analyze the regional slice differential, which assumes that there is a pair of horizontal coordinate functional relations between the normal and tangential inter-slice forces of two adjacent rock slices, and iteratively solve the problem according to the boundary conditions of the entire sliding rock mass. The mechanical equilibrium equation can be established according to the force on the strip and the position of the force. There is a functional relationship between E and Y about x,
Y = λ f x E
where x is the horizontal distance (m); dx is the rock strip width (m); E and E + dE are the normal inter-slice forces (N) on the interface of adjacent strips; Y and Y + dY are the tangential inter-slice forces (N) on the interface of adjacent strips; and λ is any constant.
Take the moment balance equation for the midpoint at the bottom of the strip and simplify it:
Y = E d h d x + h y d E d x
where y(x) is the sliding surface line of any shape (m); and h(x) is the thrust line (m).
The potential slip mass differential block is actually divided into a finite number, and its width Δx is small but not infinitesimal. Within the width Δx, all functions h(x), y(x), f(x), etc., can be assumed as linear functions, making it easy to find Ei in Δx from Ei + 1. According to the Mohr–Coulomb criterion and the definition of safety factor Fs, the constant and geotechnical parameters are introduced to establish the differential equation of force balance in the bottom direction and the bottom normal direction of the soil strip, and then the normal inter-slice force Ei can be obtained. From Equation (3), the moment Mi equation at the side of the strip can also be written as follows:
M i = E i + 1 h y i + 1 = x i x i + 1 ( Y E d E d x ) d x
According to Formula (4), Ei and Mi are solved one by one, and En = 0 and Mn = 0 must be met. If they are not met, the iteration process is to gradually correct Fs and λ.
The high groundwater in the study area and the soaking softening effect of water on the rock and soil mass seriously threatens the stability of the slope. To ensure long-term safety and stability of the slope, it is proposed to adopt a 2 m × 2 m rectangular drainage tunnel that discharges the groundwater and reduces the elevation of the groundwater phreatic line and to analyze the impact of different burial depths of the drainage tunnel on the groundwater level and the slope stability. The drainage tunnel was located directly below the third level platform in the middle of the slope, and its burial plan was 15 m away from the slope surface: 20 m, 25 m, and 30 m.
The Seep/W module in the Geo-Studio finite element numerical analysis software was used to simulate the groundwater level under different burial depths of the drainage tunnel. The simulation results are shown in Figure 14, Figure 15, Figure 16 and Figure 17.
The numerical simulation results for the groundwater were imported into the Slope/W module to calculate the slope stability at different precipitation depths. The calculation results are shown in Table 3.
In the calculation model, we added the treatment of boundary conditions, such as the fixed head boundary for the groundwater level and the impermeable boundary for the sliding bed, so as to ensure the repeatability of the calculations. Due to the complexity of groundwater and landslides, we used a two-dimensional profile to explain that the stability coefficient of the landslide increased by 26% when drainage measures were taken, when the construction of the underground drainage tunnel was completed, and when the groundwater level dropped, indicating that the underground drainage measures were effective.
According to the main sliding surface of the landslide, we established a two-dimensional landslide model. The stability coefficient of the model was 1.065 in the natural state before drainage. After using the underground drainage corridor, the stability coefficient of the landslide increased to 1.347, and the stability coefficient increased by 26%. There were three reasons for this: first, the gravity of the sliding mass and the sliding force were reduced due to the decrease of the groundwater level. Second, the shear strength was improved due to the deformation of some slip zones from the saturated state to unsaturated state. Third, the underground drainage gallery was set into the bedrock, and the drainage pipe extended from the sliding bed through the sliding zone into the sliding mass, which was equivalent to adding anchor bolts to the landslide. Perhaps the stability coefficient of landslide would not have increased much simply considering the water level drop, but under the joint action of these three aspects, the stability coefficient of the landslide increased from 1.065 to 1.347.
It can be seen from Figure 18 that the whole sliding mass was under the groundwater, except for some overburdens when no drainage tunnel was set for dewatering, and the seepage of water and the softening effect of water on the rock and soil mass greatly reduced the slope stability. When a drainage tunnel was set below the groundwater level, the phreatic line changed from a smooth curve to a broken line with the drainage tunnel as the break point. The deeper the drainage tunnel was buried, the greater the elevation of the break point of the phreatic line; the groundwater level will also decrease, and the sliding mass below the water level will also be smaller, so the stability coefficient of the slope will continue to rise. When the buried depth of the drainage tunnel exceeded 15 m, the slope changed from the critical state to the basically stable state. When the buried depth of the drainage tunnel reached 30 m, the deformation bodies, including the slip zone, were basically above the groundwater level, and the slope was basically stable.

6. Conclusions

The K39 landslide is large in scale, wide in influence range, and complex in geological structure. Deformation characteristics of landslides can be zoned in plans with the data from field fracture surveys, and the analysis of the monitoring data allows for the stratification of landslides according to different slide depths. Subsequent landslide management work can be carried out more effectively with an accurate understanding of the deformation mechanisms and deformation characteristics of landslides.
  • The geological conditions and regional structure of the landslide area are extremely complex. The interface between the Quaternary colluvial deposits and the sandy mudstones of the toe group is the shallow landslide slide zone in Zone I and Zone II, and the deep landslide slide belt in Zone III is between the deep strongly weathered shale and the moderately weathered shale.
  • The landslide can be divided into three areas according to the statistics of the surface crack deformation: Zone I, Zone II, and Zone III. We determined that Zone I and Zone II are shallow landslides and Zone III is a deep landslide, according to the monitoring of the deep deformation of the landslide. The surface cracks in Zone I are concentrated near the rear edge retaining structure, and the strike of the cracks is mainly vertical to the sliding direction. The deformation was obviously controlled after drainage treatment. There are historical sliding tension fractures and traction structures in Zone II, and the current deformation is stable without deformation. Zone III is the main sliding area with the longest average fracture length and the deepest sliding depth, and there sliding deformation is always occurring.
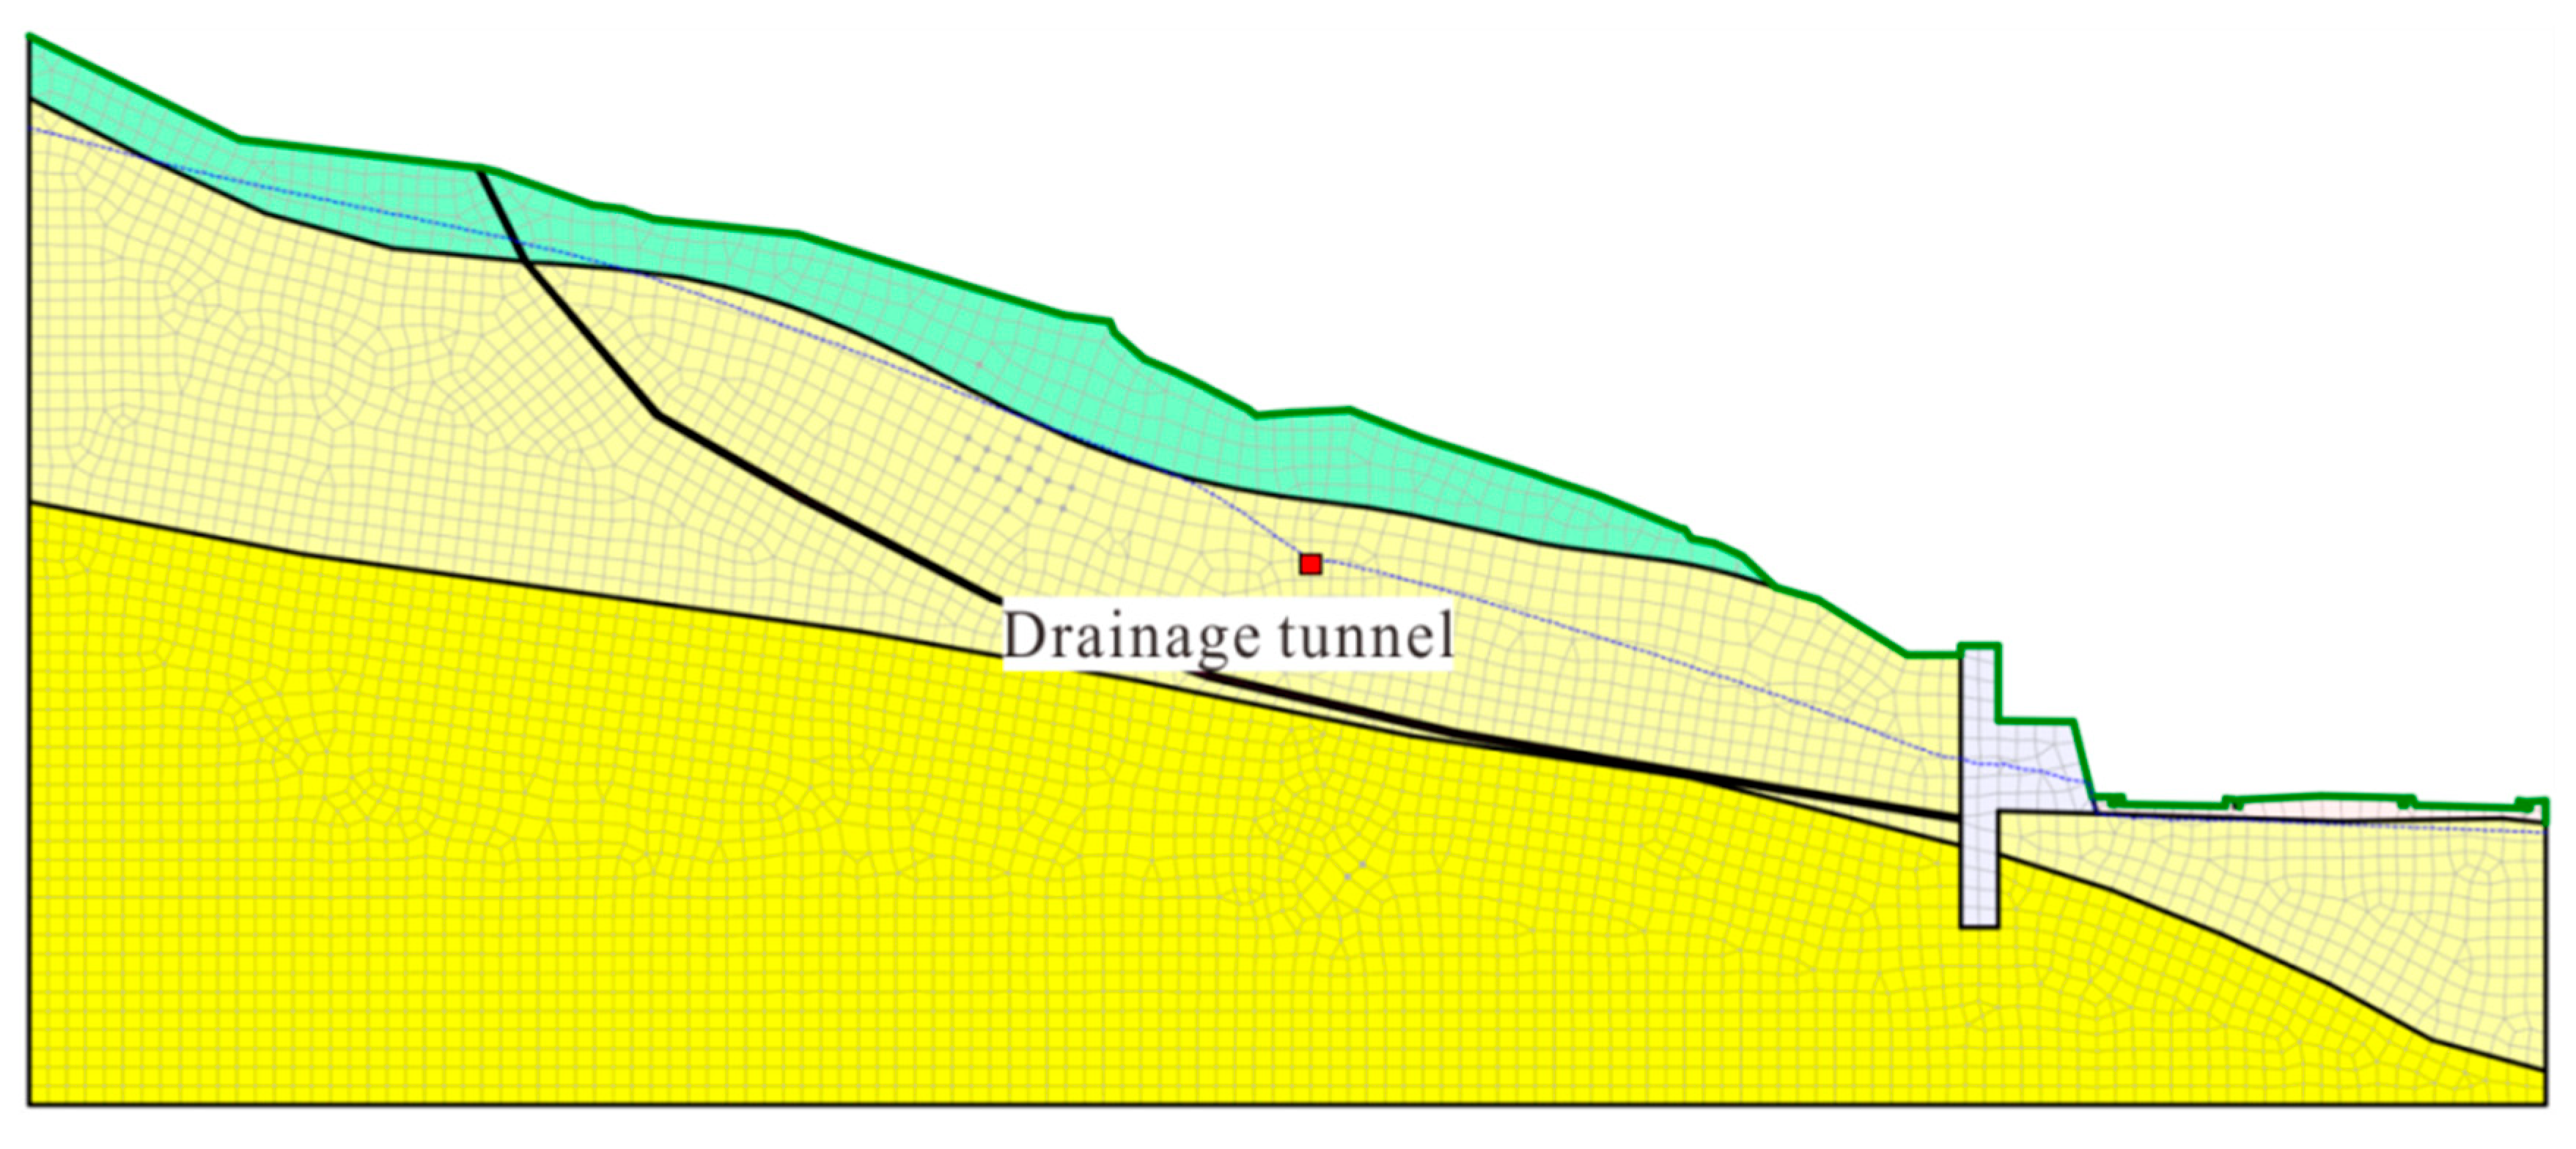
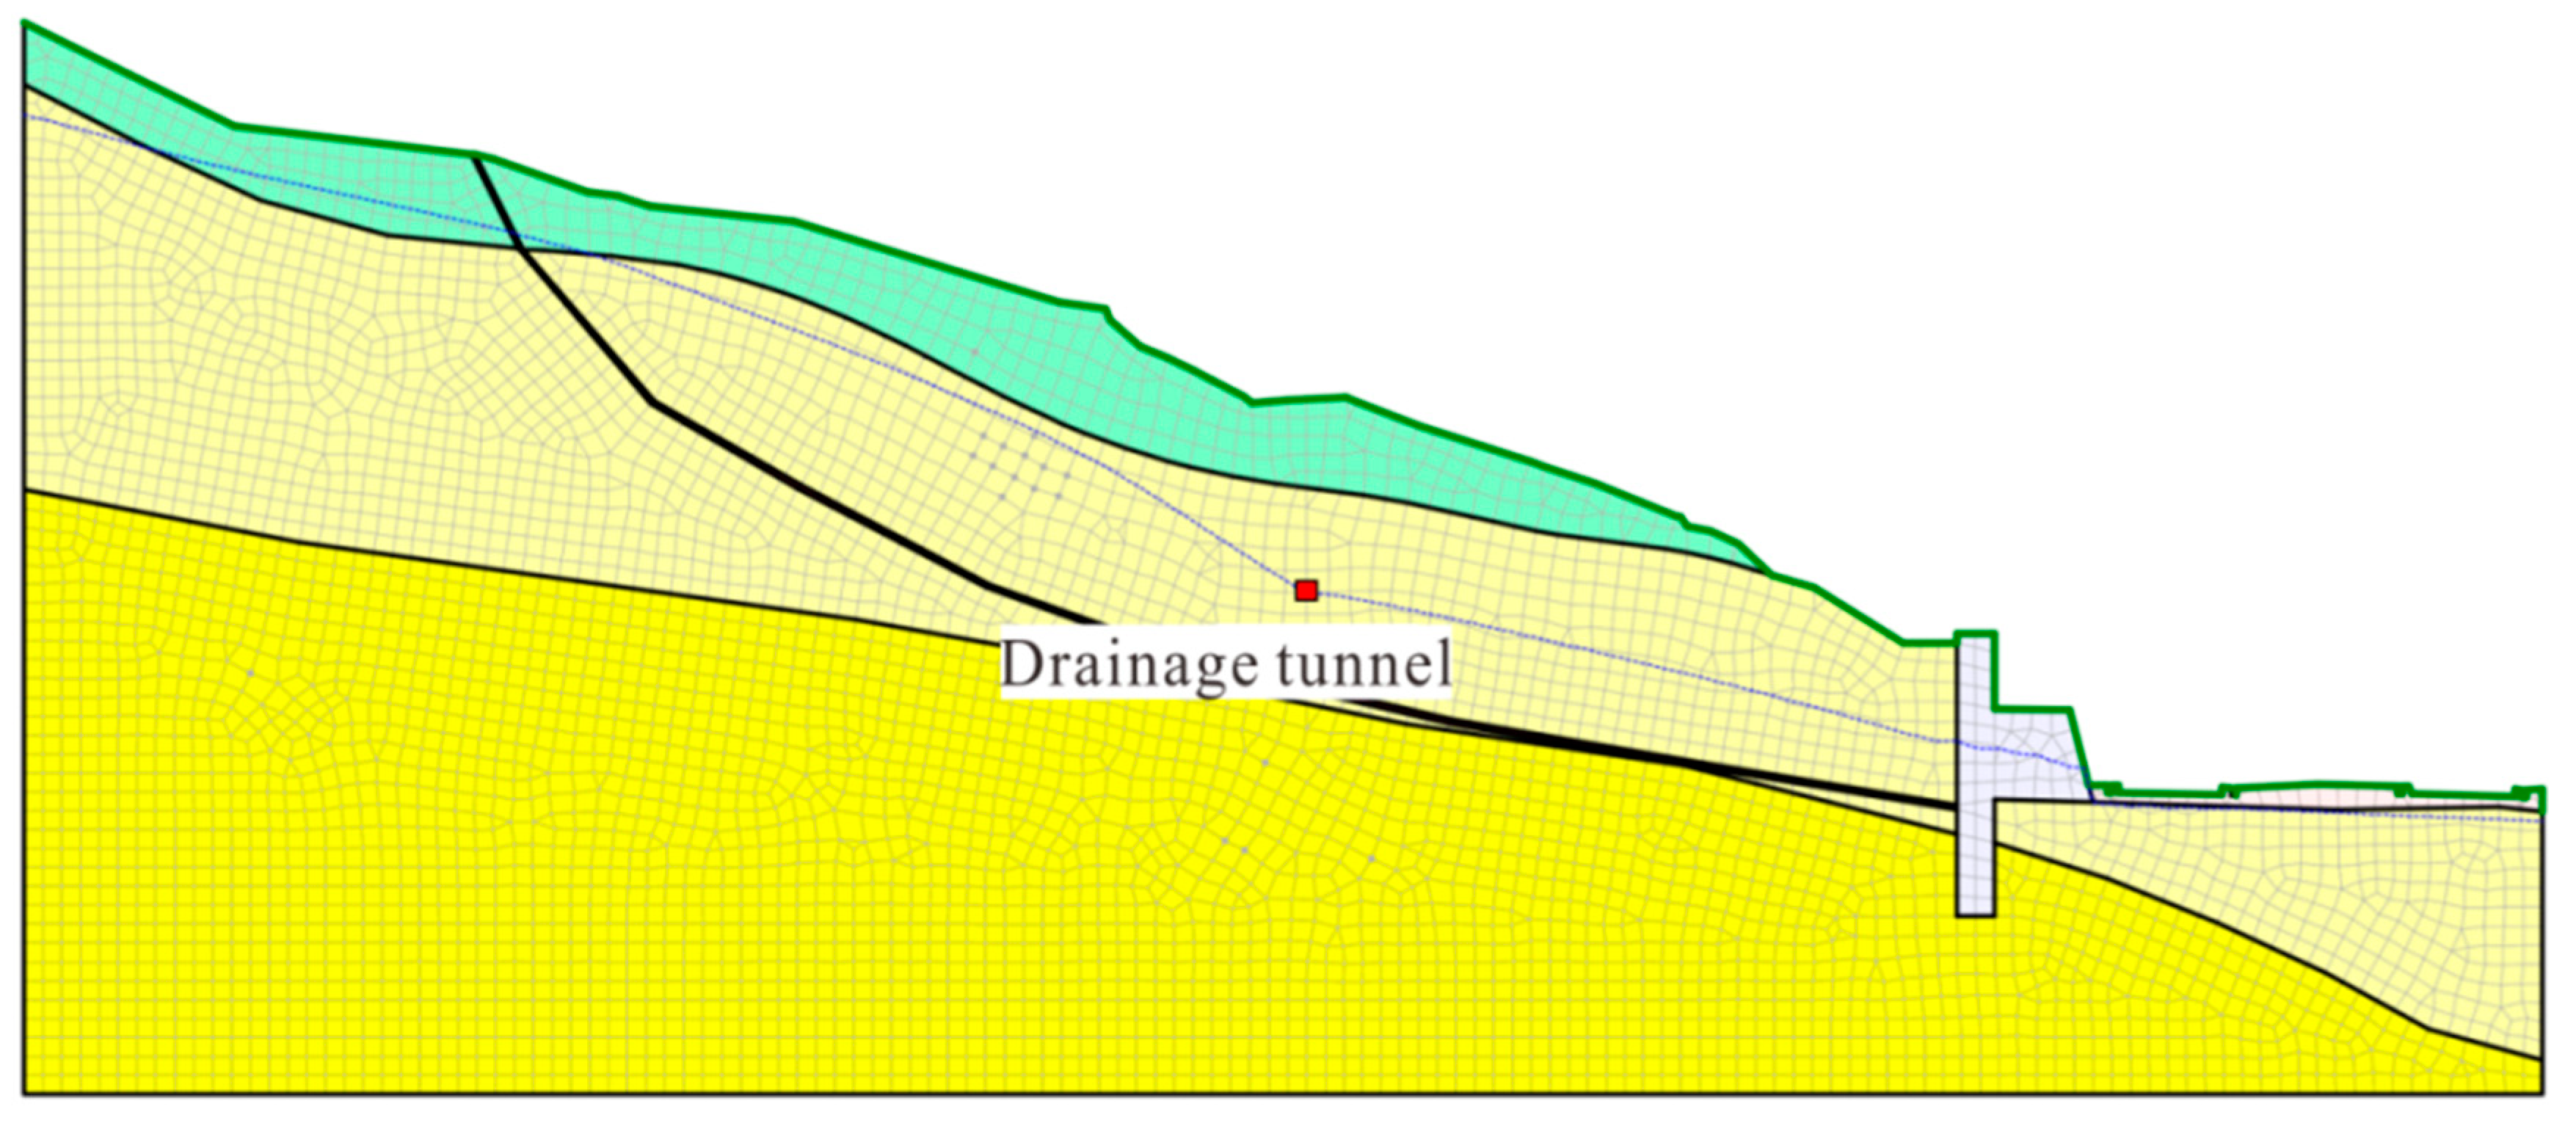
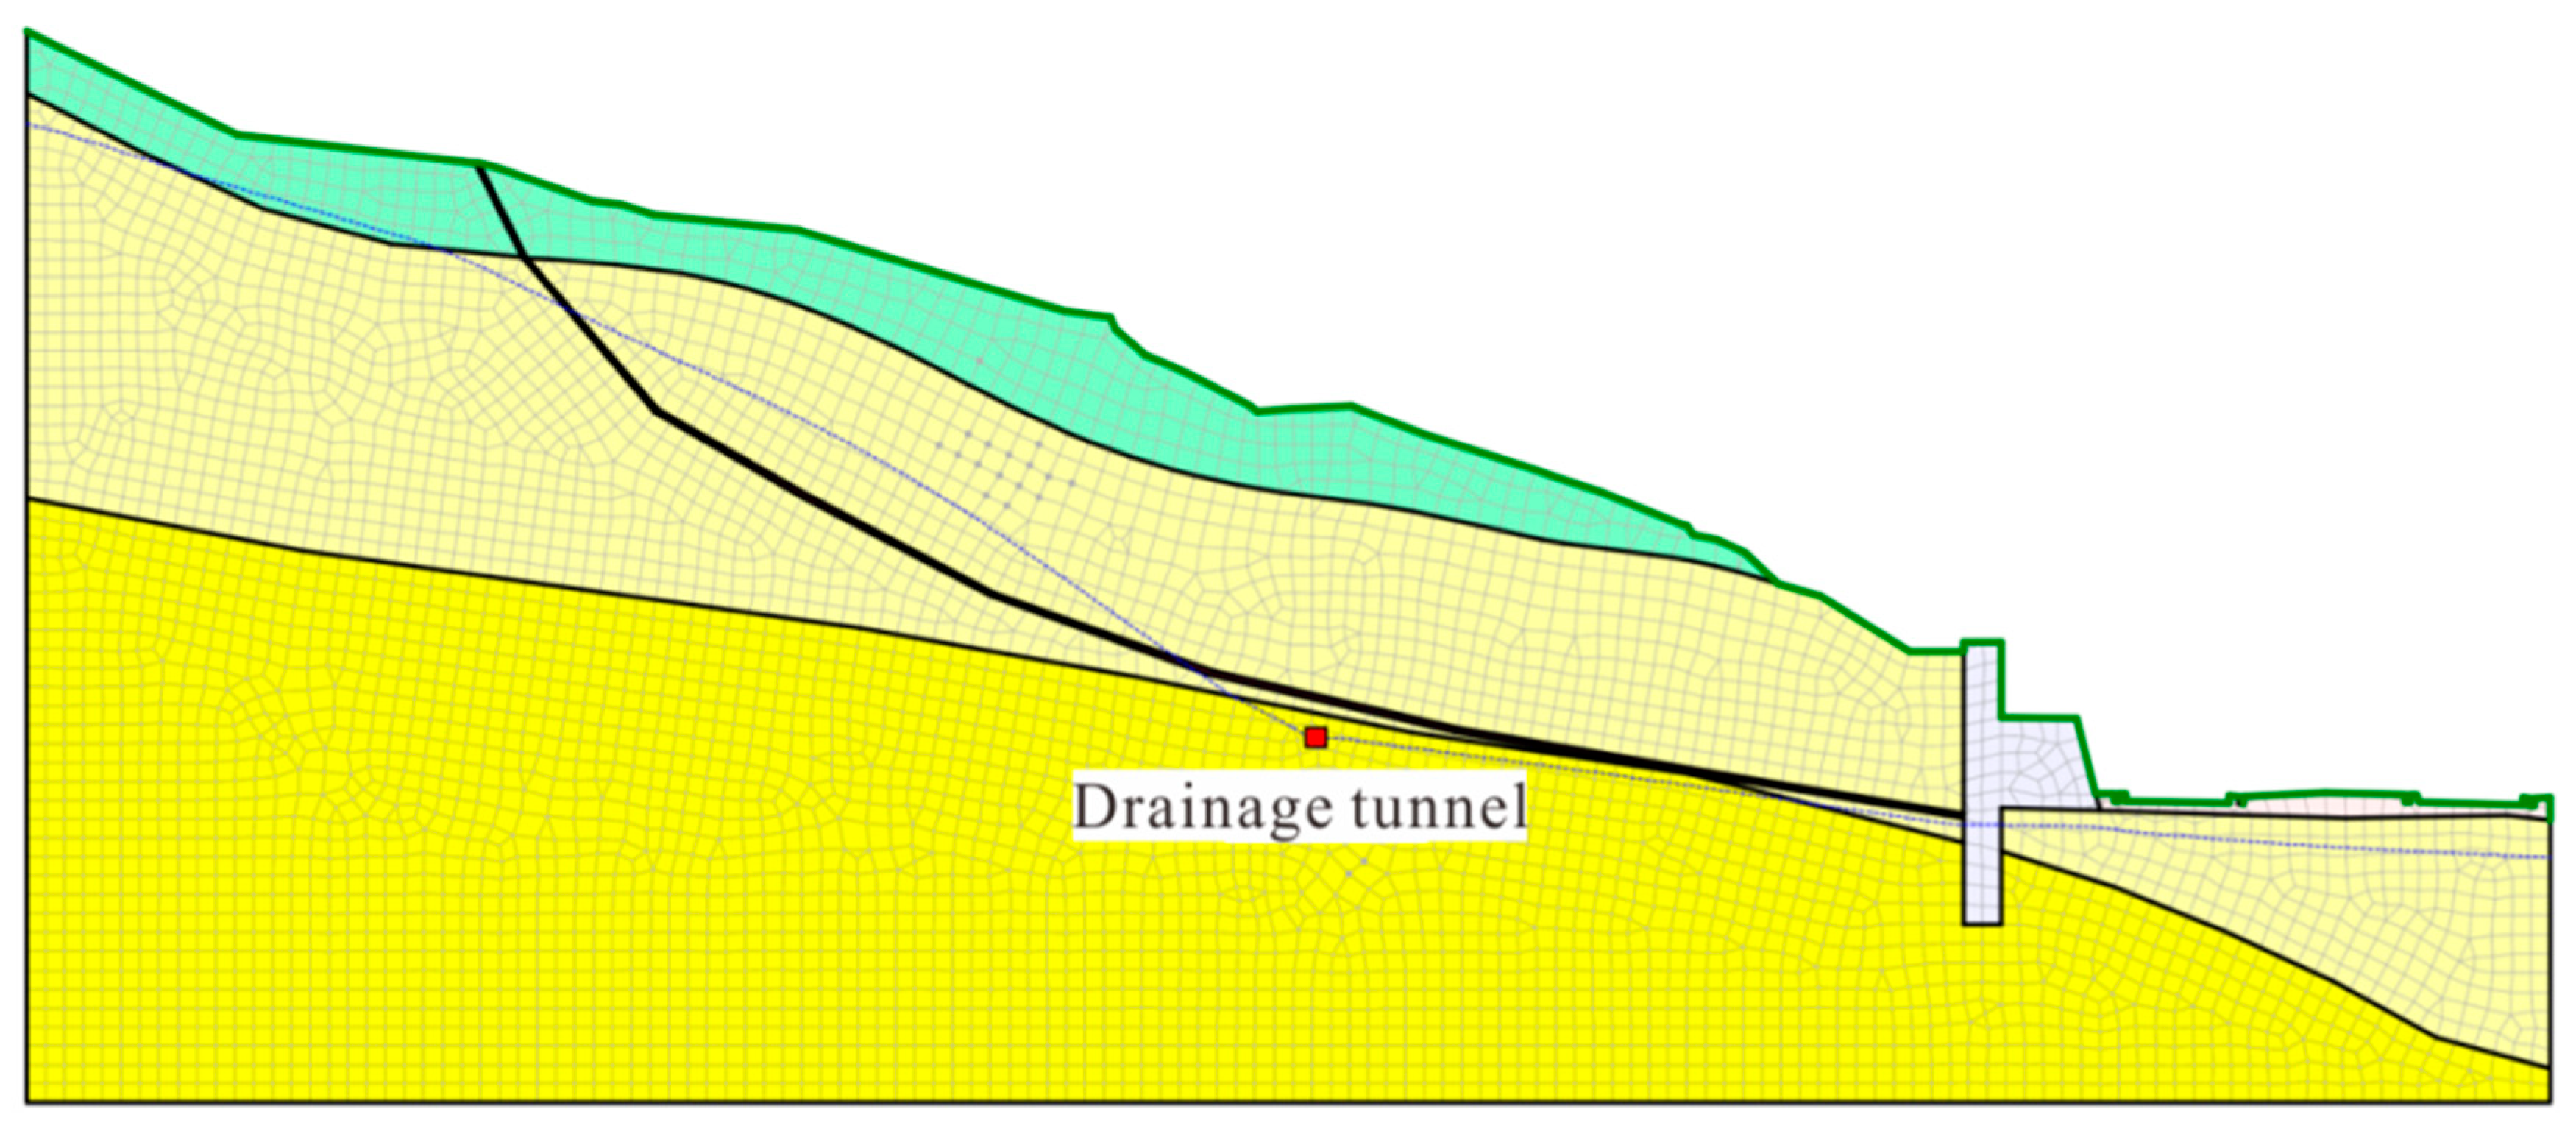
  • The physical parameters of the sliding body, sliding belt, and sliding bed in Zone III were measured through on-site sampling and indoor tests. The groundwater level in the landslide area was lowered by setting a drainage tunnel, and the results showed that the slope was in critical condition when there was no drainage tunnel or the drainage tunnel depth was 15 m. The slope was basically stable when the drainage tunnel depth was 20 m or 25 m. The slope was stable when the depth of the drainage tunnel reached more than 30 m. The groundwater level is the main factor affecting the landslide deformation. According to the design of on-site support facilities, attention should be paid to the control of the slope groundwater level in the prevention and control of slopes with the same characteristics as the K39 landslide, to prevent the revival of the landslide.

Author Contributions

Conceptualization, X.B. and D.C.; methodology, D.C.; software, X.B.; validation, X.B., G.Z. and J.P.; formal analysis, M.L.; investigation, X.B.; resources, D.C.; data curation, X.B.; writing—original draft preparation, X.B.; writing—review and editing, D.C.; supervision, X.B.; funding acquisition, M.L. All authors have read and agreed to the published version of the manuscript.

Funding

This work was supported by the National Natural Science Foundation of China (No. 41772304 and No. 42277171).

Institutional Review Board Statement

Not applicable.

Informed Consent Statement

Not applicable.

Data Availability Statement

The data presented in this study are available on request from the author.

Conflicts of Interest

The authors declare no conflict of interest.

References

  1. He, Y.P.; Xie, H.; Cui, P.; Wei, F.Q.; Zhong, D.L.; Gardner, J.S. GIS-based hazard mapping and zonation of debris flows in Xiaojiang Basin, southwestern China. Environ. Geol. 2003, 45, 286–293. [Google Scholar] [CrossRef]
  2. Zhang, F.Y.; Peng, J.B.; Huang, X.W.; Lan, H.X. Hazard assessment and mitigation of non-seismically fatal landslides in China. Nat. Hazards 2021, 106, 785–804. [Google Scholar] [CrossRef]
  3. Shang, Y.J.; Park, H.D.; Yang, Z.F.; Yang, J. Distribution of landslides adjacent to the northern side of the Yarlu Tsangpo Grand Canyon in Tibet, China. Environ. Geol. 2005, 48, 721–741. [Google Scholar] [CrossRef]
  4. Iqbal, J.; Dai, F.; Hong, M.; Tu, X.; Xie, Q. Failure Mechanism and Stability Analysis of an Active Landslide in the Xiangjiaba Reservoir Area, Southwest China. J. Earth Sci. 2018, 29, 646–661. [Google Scholar] [CrossRef]
  5. Niu, H.; Li, Q.; Zhang, L.; Li, X.; Wang, J. Experimental Study on Failure Mechanism and Mode of Fly-Ash Dam Slope Triggered by Rainfall Infiltration. Appl. Sci. 2022, 12, 9404. [Google Scholar] [CrossRef]
  6. Wang, L.Q.; Lu, S.; Li, C.D. Study on Formation Mechanism of Yangjiashan Landslide in Enshi City, China. Res. J. Chem. Environ. 2012, 16, 102–107. [Google Scholar]
  7. Tan, Q.W.; Tang, H.M.; Fan, L.; Xiong, C.R.; Fan, Z.Q.; Zhao, M.; Li, C.; Wang, D.J.; Zou, Z.X. In situ triaxial creep test for investigating deformational properties of gravelly sliding zone soil: Example of the Huangtupo 1# landslide, China. Landslides 2018, 15, 2499–2508. [Google Scholar]
  8. Han, H.M.; Shi, B.; Zhang, L. Prediction of landslide sharp increase displacement by SVM with considering hysteresis of groundwater change. Eng. Geol. 2021, 280, 105876. [Google Scholar] [CrossRef]
  9. Luo, X.Q.; Sun, H.; Tham, L.G.; Junaideen, S.M. Landslide Model Test System and Its Application on the Study of Shiliushubao Landslide in Three Gorges Reservoir Area. Soils Found. 2010, 50, 309–317. [Google Scholar] [CrossRef]
  10. Wang, H.L.; Jiang, Z.H.; Xu, W.Y.; Wang, R.B.; Xie, W.C. Physical model test on deformation and failure mechanism of deposit landslide under gradient rainfall. Bull. Eng. Geol. Environ. 2022, 81, 66. [Google Scholar] [CrossRef]
  11. Tomic, K.B.; Susic, N.; Uljarevic, M. The Systematization of Analytical and Numerical Methods of Landslide Stability Calculation. Gradevnski Mater. I Konstr.-Build. Mater. Struct. 2018, 61, 129–160. [Google Scholar]
  12. Sun, H.Y.; Wu, X.; Wang, D.F.; Xu, H.D.; Liang, X.; Shang, Y.Q. Analysis of deformation mechanism of landslide in complex geological conditions. Bull. Eng. Geol. Environ. 2019, 78, 4311–4323. [Google Scholar] [CrossRef]
  13. Tang, H.M.; Gong, W.P.; Li, C.D.; Wang, L.Q.; Juang, C.H. A new framework for characterizing landslide deformation: A case study of the Yu-Kai highway landslide in Guizhou, China. Bull. Eng. Geol. Environ. 2019, 78, 4291–4309. [Google Scholar] [CrossRef]
  14. Wang, J.J.; Xiao, L.L.; Zhang, J.; Zhu, Y.B. Deformation characteristics and failure mechanisms of a rainfall-induced complex landslide in Wanzhou County, Three Gorges Reservoir, China. Landslides 2020, 17, 419–431. [Google Scholar] [CrossRef]
  15. Li, C.D.; Long, J.J.; Liu, Y.; Li, Q.; Liu, W.Q.; Feng, P.F.; Li, B.C.; Xian, J.Y. Mechanism analysis and partition characteristics of a recent highway landslide in Southwest China based on a 3D multi-point deformation monitoring system. Landslides 2021, 18, 2895–2906. [Google Scholar] [CrossRef]
  16. Sharma, R.H.; Nakagawa, H. Numerical model and flume experiments of single- and two-layered hillslope flow related to slope failure. Landslides 2010, 7, 425–432. [Google Scholar] [CrossRef]
  17. Zhu, D.P.; He, L. Study on the Influence of Groundwater on Landslide Stability in the Three Gorges Reservoir. Arab. J. Sci. Eng. 2022, 47, 4211–4223. [Google Scholar]
  18. Duan, G.H.; Chen, D.; Niu, R.Q. Forecasting Groundwater Level for Soil Landslide Based on a Dynamic Model and Landslide Evolution Pattern. Water 2019, 11, 2163. [Google Scholar] [CrossRef]
  19. Zhu, D.P.; Yan, E.C.; Huang, L.; He, Q.D. Action Mode of Groundwater on Landslide Mass and Standard Variation Curve of Landslide Stability with rise of Reservoir Water. Disaster Adv. 2012, 5, 721–725. [Google Scholar]
  20. Wei, Z.L.; Wang, D.F.; Sun, H.Y.; Yan, X. Comparison of a physical model and phenomenological model to forecast groundwater levels in a rainfall-induced deep-seated landslide. J. Hydrol. 2020, 586, 124894. [Google Scholar] [CrossRef]
  21. Akpan, A.E.; Ekwok, S.E.; Ebong, E.D. Seasonal reversals in groundwater flow direction and its role in the recurrent Agwagune landslide problem: A geophysical and geological appraisal. Environ. Earth Sci. 2016, 75, 429. [Google Scholar] [CrossRef]
  22. Beyabanaki, S.; Bagtzoglou, A.C.; Anagnostou, E.N. Effects of groundwater table position, soil strength properties and rainfall on instability of earthquake-triggered landslides. Environ. Earth Sci. 2016, 75, 358. [Google Scholar] [CrossRef]
  23. Sun, H.Y.; Wong, L.; Shang, Y.Q.; Shen, Y.J.; Lu, Q. Evaluation of drainage tunnel effectiveness in landslide control. Landslides 2010, 7, 445–454. [Google Scholar] [CrossRef]
  24. Zheng, J.; Wang, J.C.; Guo, J.C.; Zhang, Y.Q.; Lu, Q.; Sun, H.Y. A siphon drainage system with variable diameters for landslides: Concept, calculation, and validation. J. Hydrol. 2021, 597, 126305. [Google Scholar] [CrossRef]
  25. Wang, Z.L.; Shang, Y.Q.; Sun, H.Y. Optimal location and effect judgment on drainage tunnels for landslide prevention. J. Cent. South Univ. 2013, 20, 2041–2053. [Google Scholar] [CrossRef]
  26. Miao, F.S.; Wu, Y.P.; Torok, A.; Li, L.W.; Xue, Y. Centrifugal model test on a riverine landslide in the Three Gorges Reservoir induced by rainfall and water level fluctuation. Geosci. Front. 2022, 13, 101378. [Google Scholar] [CrossRef]
  27. Yang, Z.Q.; Fan, X.L.; Yang, Y.; Hou, K.P.; Du, J.; Chen, X.G.; Mi, Y.P.; Jiang, C.P.; Zhang, J.; Guo, Y.F. Deformation patterns and failure mechanism of high and steep stratified rock slopes with upper steep and lower gentle style induced by step-by-step excavations. Environ. Earth Sci. 2022, 81, 229. [Google Scholar] [CrossRef]
  28. Marinos, V. A revised, geotechnical classification GSI system for tectonically disturbed heterogeneous rock masses, such as flysch. Bull. Eng. Geol. Environ. 2019, 78, 899–912. [Google Scholar] [CrossRef]
  29. Cotecchia, F.; Vitone, C.; Santaloia, F.; Pedone, G.; Bottiglieri, O. Slope instability processes in intensely fissured clays: Case histories in the Southern Apennines. Landslides 2015, 12, 877–893. [Google Scholar] [CrossRef]
  30. Ruggeri, P.; Fruzzetti, V.; Scarpelli, G. Design Strategies to Mitigate Slope Instabilities in Structurally Complex Formations. Geosciences 2020, 10, 82. [Google Scholar] [CrossRef]
  31. Bromhead, E.N. Reflections on the residual strength of clay soils, with special reference to bedding-controlled landslides. Q. J. Eng. Geol. Hydrogeol. 2013, 46, 132–154. [Google Scholar] [CrossRef]
  32. Zheng, Y.; Chen, C.X.; Liu, T.T.; Xia, K.Z.; Sun, C.Y.; Chen, L.L. Analysis of a retrogressive landslide with double sliding surfaces: A case study. Environ. Earth Sci. 2020, 79, 21. [Google Scholar] [CrossRef]
  33. Yan, Z.L.; Wang, J.J.; Chai, H.J. Influence of water level fluctuation on phreatic line in silty soil model slope. Eng. Geol. 2010, 113, 90–98. [Google Scholar] [CrossRef]
  34. Bronnimann, C.; Stahli, M.; Schneider, P.; Seward, L.; Springman, S.M. Bedrock exfiltration as a triggering mechanism for shallow landslides. Water Resour. Res. 2013, 49, 5155–5167. [Google Scholar] [CrossRef]
  35. Ramkrishnan, R.; Sharma, A.; Viswanathan, K.; Ravichandran, D. Determination of critical phreatic level for landslide assessment using a scaled down laboratory model. Int. J. Geotech. Eng. 2022, 16, 239–255. [Google Scholar] [CrossRef]
  36. Yin, J.; Miao, Y.H. Undrained Shear Strength Characteristics of Natural Silty Clay. In PROGRESS IN INDUSTRIAL AND CIVIL ENGINEERING II, PTS 1-4; 2nd International Conference on Civil, Architectural and Hydraulic Engineering (ICCAHE 2013); Yang, W., Liang, J., Eds.; Trans Tech Publications Ltd.: Stafa-Zurich, Switzerland, 2013; Volume 405–408, pp. 285–289. [Google Scholar]
  37. Shi, X.S.; Herle, I.; Yin, J.H. Laboratory Study of the Shear Strength and State Boundary Surface of a Natural Lumpy Soil. J. Geotech. Geoenviron. 2018, 144, 04018093. [Google Scholar] [CrossRef]
Figure 1. Geological map of the K39 landslide.
Applsci 13 02449 g001
Figure 2. Cross-sectional views: (a) Cross-section (I-I’); (b) Cross-section (II-II’).
Applsci 13 02449 g002
Figure 3. Exposed rock strata in the landslide area: (a) Colluvial–deluvial and sandy mudstone; (b) Black shale.
Applsci 13 02449 g003
Figure 4. Hydrogeological map of the landslide.
Applsci 13 02449 g004
Figure 5. Landslide deformation zoning: (a) Pond at the rear edge of the landslide; (b) Trailing edge crack; (c) Dislocation of the landslide trailing edge; (d) Effluent from the drainage ditch; (e) Slip marks; (f) Drainage tunnel in construction; (g) Front edge drain; (h) Drainage ditch deformation; (i) Front edge uplift; and (j) Retaining wall water guide.
Applsci 13 02449 g005
Figure 6. Box diagram of crack length.
Applsci 13 02449 g006
Figure 7. Monitoring data of borehole BK17.
Applsci 13 02449 g007
Figure 8. Monitoring data of borehole BK24.
Applsci 13 02449 g008
Figure 9. Landslide reactivation process.
Applsci 13 02449 g009
Figure 10. Quad electric direct shearing instrument.
Applsci 13 02449 g010
Figure 11. Soil samples after shear failure.
Applsci 13 02449 g011
Figure 12. Triaxial test results of shale.
Applsci 13 02449 g012
Figure 13. Slope calculation model.
Applsci 13 02449 g013
Figure 14. Drainage tunnel depth 15 m.
Applsci 13 02449 g014
Figure 15. Drainage tunnel depth 20 m.
Applsci 13 02449 g015
Figure 16. Drainage tunnel depth 25 m.
Applsci 13 02449 g016
Figure 17. Drainage tunnel depth 30 m.
Applsci 13 02449 g017
Figure 18. Underground water level map of the landslide at different depths for the drainage tunnel.
Applsci 13 02449 g018
Table 1. Test results of shear strength of the sliding zone soil.
SpecimenShear Strength ParametersSample State
Cohesion (kPa)Angle of Internal Friction (°)
BK17-13216Natural
BK17-23416Natural
BK17-33416Natural
BK17-43316Natural
BK17-53717Natural
BK17-61611Saturation
BK17-71611Saturation
BK17-81811Saturation
BK17-91711Saturation
BK17-102011Saturation
Table 2. Model calculation parameters.
Rock Soil Mass TypesUnit Weight (kN/m3)Angle of Internal Friction (°)Cohesion (kPa)Saturated Permeability Coefficient (cm/s)
NaturalRainfallNaturalRainfallNaturalRainfallVerticalHorizontal
Sliding zone soil1820191620137.1 × 10−45.2 × 10⁻⁴
Strong-weathered shale1921211722169.4 × 10−48.8 × 10⁻⁴
Mid-weathered shale/244523.4 × 10−63.1 × 10⁻⁶
Table 3. Slope stability of the drainage tunnel at different depths.
Depth of Drainage TunnelNo Drainage Tunnel15 m20 m25 m30 m
Stability1.0651.1931.2121.3011.347
Disclaimer/Publisher’s Note: The statements, opinions and data contained in all publications are solely those of the individual author(s) and contributor(s) and not of MDPI and/or the editor(s). MDPI and/or the editor(s) disclaim responsibility for any injury to people or property resulting from any ideas, methods, instructions or products referred to in the content.

