Article

Data Mining and Augmented Reality: An Application to the Fashion Industry

by
Virginia Fani
1,
Sara Antomarioni
2,
Romeo Bandinelli
1,* and
Filippo Emanuele Ciarapica
2
1
Department of Industrial Engineering, University of Florence, 50134 Florence, Italy
2
Department of Industrial Engineering and Mathematical Science, Università Politecnica delle Marche, 60131 Ancona, Italy
*
Author to whom correspondence should be addressed.
Appl. Sci. 2023, 13(4), 2317; https://doi.org/10.3390/app13042317
Submission received: 9 January 2023 / Revised: 8 February 2023 / Accepted: 9 February 2023 / Published: 10 February 2023
(This article belongs to the Special Issue Advances in Smart Production & Logistics)

Abstract

:

Featured Application

The current paper proposes an approach to improve data analysis and visualization through Association Rule Mining and Augmented Reality. The applicability of the approach has been verified through a case study, providing Augmented Reality devices to expert and non-expert (or trainees) operators and letting them experience the adoption of the proposed technology in their daily quality management activities.

Abstract

The wider implementation of Industry 4.0 technologies in several sectors is increasing the amount of data regularly collected by companies. Those unstructured data need to be quickly elaborated to make on-time decisions, and the information extracted needs to be clearly visualized to speed up operations. This is strongly perceived in the quality field, where effective management of the trade-off between increasing quality controls to intercept product defects and decreasing them to reduce the delivery time represents a competitive challenge. A framework to improve data analysis and visualization in quality management is proposed, and its applicability is demonstrated with a case study in the fashion industry. A questionnaire assesses its on-field usability. The main findings refer to overcoming the lack in the literature of a decision support framework based on the joint application of association rules mining and augmented reality. The successful implementation in a real scenario has a twofold aim: on the one hand, sample sizes are strategically revised according to the supplier performance per product category and material; on the other hand, the daily quality controls are speeded up through accurate suggestions about the most occurrent defect and location per product characteristics, integrated with extra tips only for trainees.

1. Introduction

Nowadays, a wider implementation of Industry 4.0 (I4.0) tools by several companies are increasing the collection of huge amounts of data by companies in different fields, such as production and quality management. To face the challenge of reducing lead time to meet the market, companies are even more involved in managing the trade-off between guaranteeing the outstanding quality level final consumers require and speeding up the fault detection time. In this scenario, the identification of the most appropriate dimension of the control lot impacts, on the one hand, on the interception of product defects, as the more items are checked, the more reliable the control outcome. On the other hand, the fewer items are controlled, the shorter the time for the quality process. To decrease the time to detect product non-compliances, controllers need to be supported in checking the first the most occurrent defects. This way, the sooner they are intercepted, the sooner the product outcome is defined as non-compliant, with no need to proceed with further time-consuming controls. Considering trainees instead of experts, controls are also slowed down by the time needed to clearly understand the defects to be checked. The trade-off between increasing quality controls to intercept product defects and decreasing the time for checking represents, therefore, a critical challenge, especially for dynamic contexts where the most occurrent defects change rapidly over time and consumers require outstanding quality, like the fashion industry.
The huge amount of data collected even by low-tech companies through I4.0 solutions to trace quality control outcomes remains quite often non-used, leading to the “rich data but poor information” issue [1]. The elaboration of data regularly extracted over time requires automation, especially in dynamic and low-tech contexts, discouraging the use of statistics made only by skilled resources. Easy-to-update datasets are needed to extrapolate knowledge and support controllers in making decisions based on up-to-date information.
Data mining techniques are often used in the field of knowledge acquisition from unstructured data, especially when hidden relationships need to be discovered to support decision-makers [2]. For instance, to shorten the duration of the quality control process, historical data analysis allows us to improve inspection policies. Currently, the definition of quality controls is mainly led by international standards, such as the UNI ISO 2859-1:2007, for the identification of the acceptable quality level (AQL) for lots received from suppliers to be controlled [3]. This approach leads to the use of static parameters, which are not well-suitable for fast-changing scenarios. In order to achieve the required AQL, researchers suggest that quality management should also be evaluated relating to economic aspects, production management and maintenance management, basing the sample size on a dynamic definition [4]. Hajej et al. [5] considered the latter aspect taking into account failure rates, production efficiency and machinery remaining useful life, while Samohyl [6] introduced hypothesis testing to identify the best sampling strategy considering the perspective of consumers and producers.
Low-tech and dynamic sectors, which are characterized by manual processes and operations, are less likely to implement previously mentioned techniques [7], even though automated and data-driven analysis through data mining approaches could result in benefits, as testified by existing contributions [8]. In Ur-Rahman and Harding [9], for example, the identification of attributes majorly influencing product quality in the low-tech environment but characterized by a large amount of data is explored. These considerations bring us to consider data mining as a possible facilitator in predicting product or process quality when the final objective is obtaining useful knowledge from data [10]. In this context, Association Rule Mining (ARM) can prove valid support in defining hidden relationships in conditions occurring together [11]; several applications can be found in the literature in highly automated production processes (e.g., refining processes [12], automotive, aeronautics and pharmaceutics [13]), while limited contributions can be found in low-tech sectors, like the fashion industry. For example, Yildirim et al. [14] used ARM to define common fabric parameters leading to defective or high-quality outputs. Similarly, Lee et al. [15] related production process parameters to garments and then based an improvement plan for production quality on association rules’ results [16].
Besides the increasing need for analyzing huge amounts of unstructured data, companies are demanding to clearly visualize the resulting information [17]. The need to present data is increasing, especially in manufacturing environments, due to the large application of Industry 4.0 technologies that allow us to regularly acquire raw data [18]. Data interpretation and visualization, indeed, are becoming a challenge for decision-making because only a clear understanding may result in making informed decisions [17]. Augmented Reality (AR) allows us to intuitively explore data overlaying digital content in a real environment [19], with virtual things that coexist with real ones in the same space [20]. As AR is becoming more affordable and mature, it can be used as a tool to visualize data in context to support making more informed decisions [21]. This technology is implemented on wearable devices or even smartphones and tablets, with several applications as decision support systems that can be found in the literature. Govender et al. use augmented and mixed reality to visualize complex data related to resource plans [17]. In the work of Karlsson, simulation results and analytics are displayed through AR to increase the understanding of complex models [22]. A decision support framework based on semantic AR has been developed by Zheng et al. to reduce information overloading and be effective in IoT data interpretation [23]. Egbert et al. propose a mobile assistance system based on AR for order picking [24]. In the field of quality management, Mirshokrai et al. developed an application that integrates Building Information Modeling (BIM) and AR to acquire inspection data and show processed results [25]. Erket et al. developed a mobile application based on AR and Finite Element Method (FEM) to prevent unexpected failure conditions [26]. Cachada et al. provided a predictive maintenance system that includes Industry 4.0 technologies and principles for the earlier detection of machine failures and to support technicians during interventions [20]. The relevance of AR in shortening training time in a variety of fields is also demonstrated by the review by Chiang et al. [27]. They even highlight the main benefits that could be gained through this technology, including improved spatial cognition, assembly skills and reduction of operational errors. The advantages of supporting decision systems with AR are also explored by Martins et al., who identified the ability to captivate decision makers’ awareness and facilitate flaw detection as well as high work productivity [21].
To sum up, even if data mining and AR have been widely used to support decision-makers, there is a lack of joint contributions in the quality field. Moreover, a few solutions based on those technologies are being explored within the fashion industry.
A data-driven approach based on data mining and AR has therefore been proposed to support companies in data interpretation and visualization within the quality management field. More in detail, the framework allows users to make informed decisions in setting sampling rules based on suppliers’ quality performance per product. It will avoid the quite common definition of general sample sizes that could require extra time for controlling items historically characterized by high levels of compliance. A case study in the fashion industry will therefore demonstrate the framework’s applicability in low-tech dynamic industries. The innovation introduced by the present study is not in the two techniques but rather in their joint application to a specific sector like the fashion industry.
The article has been structured as follows: Section 2 presents the proposed jointed framework, while Section 3 describes the case study; Section 4 details the step-by-step application of the framework and its validation within the fashion company. Results are discussed in Section 5, and conclusions are drawn in Section 6.

2. Materials and Methods

2.1. Research Approach

This paper proposes an approach aiming at improving the quality control process in a 2-fold manner: from a strategic point of view, by adapting the sample size on the bases of suppliers’ performance, aiming to encourage virtuous behaviors from them in order to be able to reduce sample sizes and gain competitive advantage; from an operational point of view, by guiding the quality control inspection towards the more likely occurrences depending on the specific product, capitalizing on the visualization of helpful inputs through AR devices, in order to hasten the inspection process.
Production and quality data represent the basis of the proposed approach and have to be frequently updated in order to obtain up-to-date analysis and information. Information on previous control outcomes, sample size, and policies in case of non-compliance is needed for all the suppliers and for all the products and has to be collected or retrieved by existing information systems.
Once a solid and reliable dataset is available, the analytics can be performed by mining the association rules.
The focus of the proposed approach (i.e., Figure 1) is centered on identifying the compliance rate of a supplier considering the associated sample size and, possibly, detailing this value per article material and product category. The association rules will be used to re-arrange the quality control process, e.g., the sample size, on the basis of suppliers’ performance and periodically verify whether such a size is still suitable.
The proposed procedure is carried out incrementally, including different attributes in the analysis, as follows:
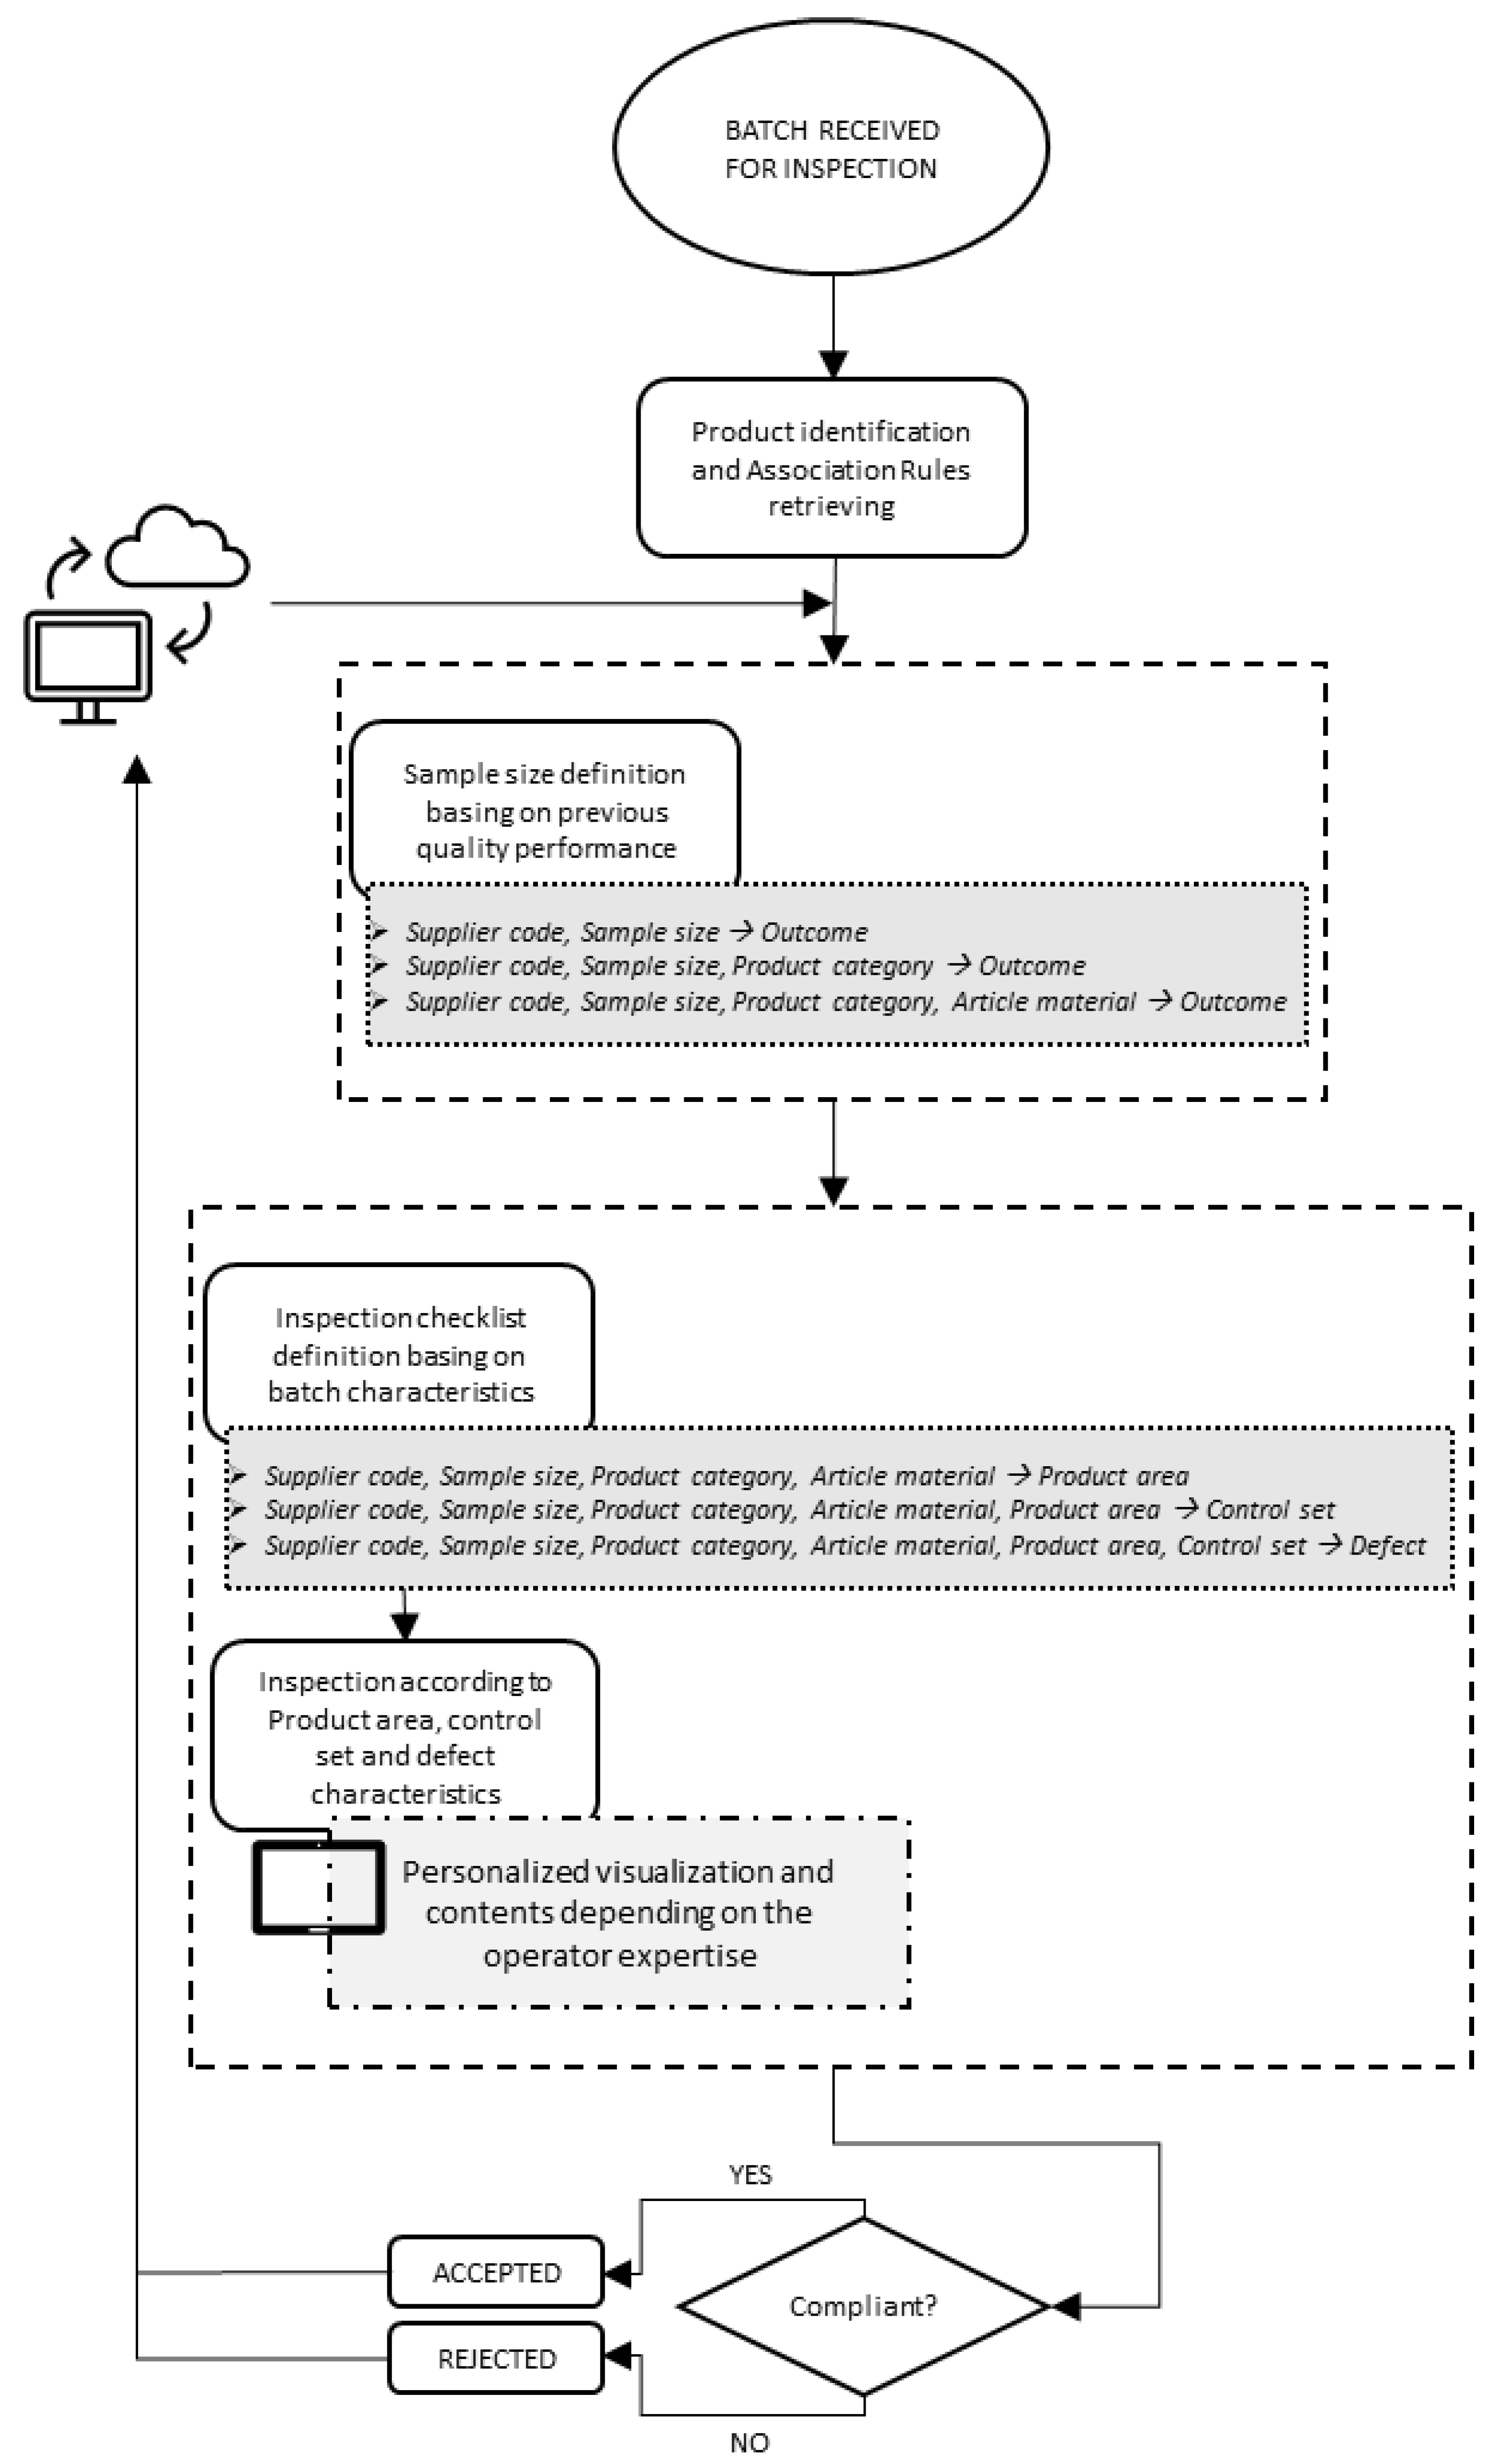
  • Relating a supplier and the associated sample size to the outcome of the quality inspections: in this way, the ability to provide compliant lots is verified at a general level. In particular, if the supplier is able to provide an acceptance rate of 100% in all cases, then there is no need to analyze furtherly the performance in order to identify virtuous and vicious products. On the other end, it should be discussed whether a lower sample size could be selected to hasten the quality control phase;
  • Relating a supplier, the associated sample size per product category to the outcome of the quality inspections: this group of rules is focused on identifying the impact of the product category on the performance of the supplier: this should be the case for suppliers producing a variety of product categories, but having specific expertise only on manufacturing a selection of them. If the supplier provides an acceptance rate of 100% for a specific product category, then the same remarks made at point 1 can be repeated, i.e., the sample size can be reduced, and the analysis should not be reiterated;
  • Relating a supplier, the associated sample size per product category and article material to the outcome of the quality inspections: indeed, recurrent non-compliance can regard the characteristics of the main material composing the article. Being able to quantify such impact represents a valuable input.
As a second objective, rules can be mined to determine, depending on specific characteristics, which are the most likely locations where defects could be detected, so that the operator is directly guided towards them, receiving relevant information like the control set that should be carried out or the aspect of the defect, and the quality control process can be expedited.
The roadmap for mining the association rules can be structured as follows:
  • Firstly, the most common areas of the product in which defects are frequently localized should be identified so that the operator focuses on the most critical at first. That said, the occurrences are ranked by confidence, showing at the top of the list the most common ones (i.e., the ones having the highest probability);
  • For each of the previous association rules, the list of the controls that should be performed has to be presented so that the operator has a clear idea of all the processes to be carried out before assigning a final outcome to the product. Rules are ranked by confidence, meaning that the controls that are more likely to detect a defect are performed first;
  • Once the control set of actions has been selected, the defect that could be identified is selected. In this way, the operators can have a more precise idea of the defect to expect and, hence, can recognize it more easily.
The results of the analytics phase performed at this stage by the production management department will be used during the quality control phase directly on the field: indeed, as soon as a batch of products arrives for quality control, they are identified, and the related association rules are retrieved from the information systems and visualized on the AR device in order to support the quality control process. Specific attributes can be defined by the company as well as which information should be displayed mandatorily and which contents can be selected only in case of need (e.g., additional descriptions on the procedure to perform a control or how to identify a defect).
Once the control is completed, whether the batch is compliant or not, the outcome is recorded in order to integrate the dataset for ARM.

2.2. Association Rule Mining

The application of data mining techniques can provide valid support for the decision-making regarding quality control policies since they enable us to simultaneously take into consideration several attributes in the dataset. To this end, using ARM can support relating attributes in order to discover unknown patterns leading to useful knowledge.
ARM involves the identification of pairs of conditions that co-occur frequently. Specific goals can be set for the analysis and the association rules, depending on the attributes in the dataset and on the available information provided [28], starting from a set of Boolean data named items A = {a1, a2, …, an} and a transaction set V = {v1, v2, …, vm} composed of an itemset (i.e., a set of items) belonging to A, the implication between two itemsets can be defined as an association rule: I → J. Specifically, the following assumptions have to be verified:
  • I, J ⊆ A;
  • I ∩ J = ∅.
The quality and relevance of an association rule are measured through different metrics; the support (Supp) and confidence (Conf) are used in the current application: the former is determined as the joint probability of finding both the itemsets characterizing the rule in the same transaction, i.e., the number of transactions both containing the itemsets I and J over the cardinality of the transaction set.
S u p p   I J = # I , J m
The latter, instead, is the conditional probability between the itemsets composing the rule (P(J | I)).
C o n f   I J = S u p p I J S u p p I
Different algorithms can be used to mine the association rules: in the current application, the FP-Growth algorithm [29] is used to identify all the frequent itemsets included in the database, having support higher than a user-defined threshold. Then, item sets are combined to obtain the rules, excluding the ones beyond the minimum confidence threshold.

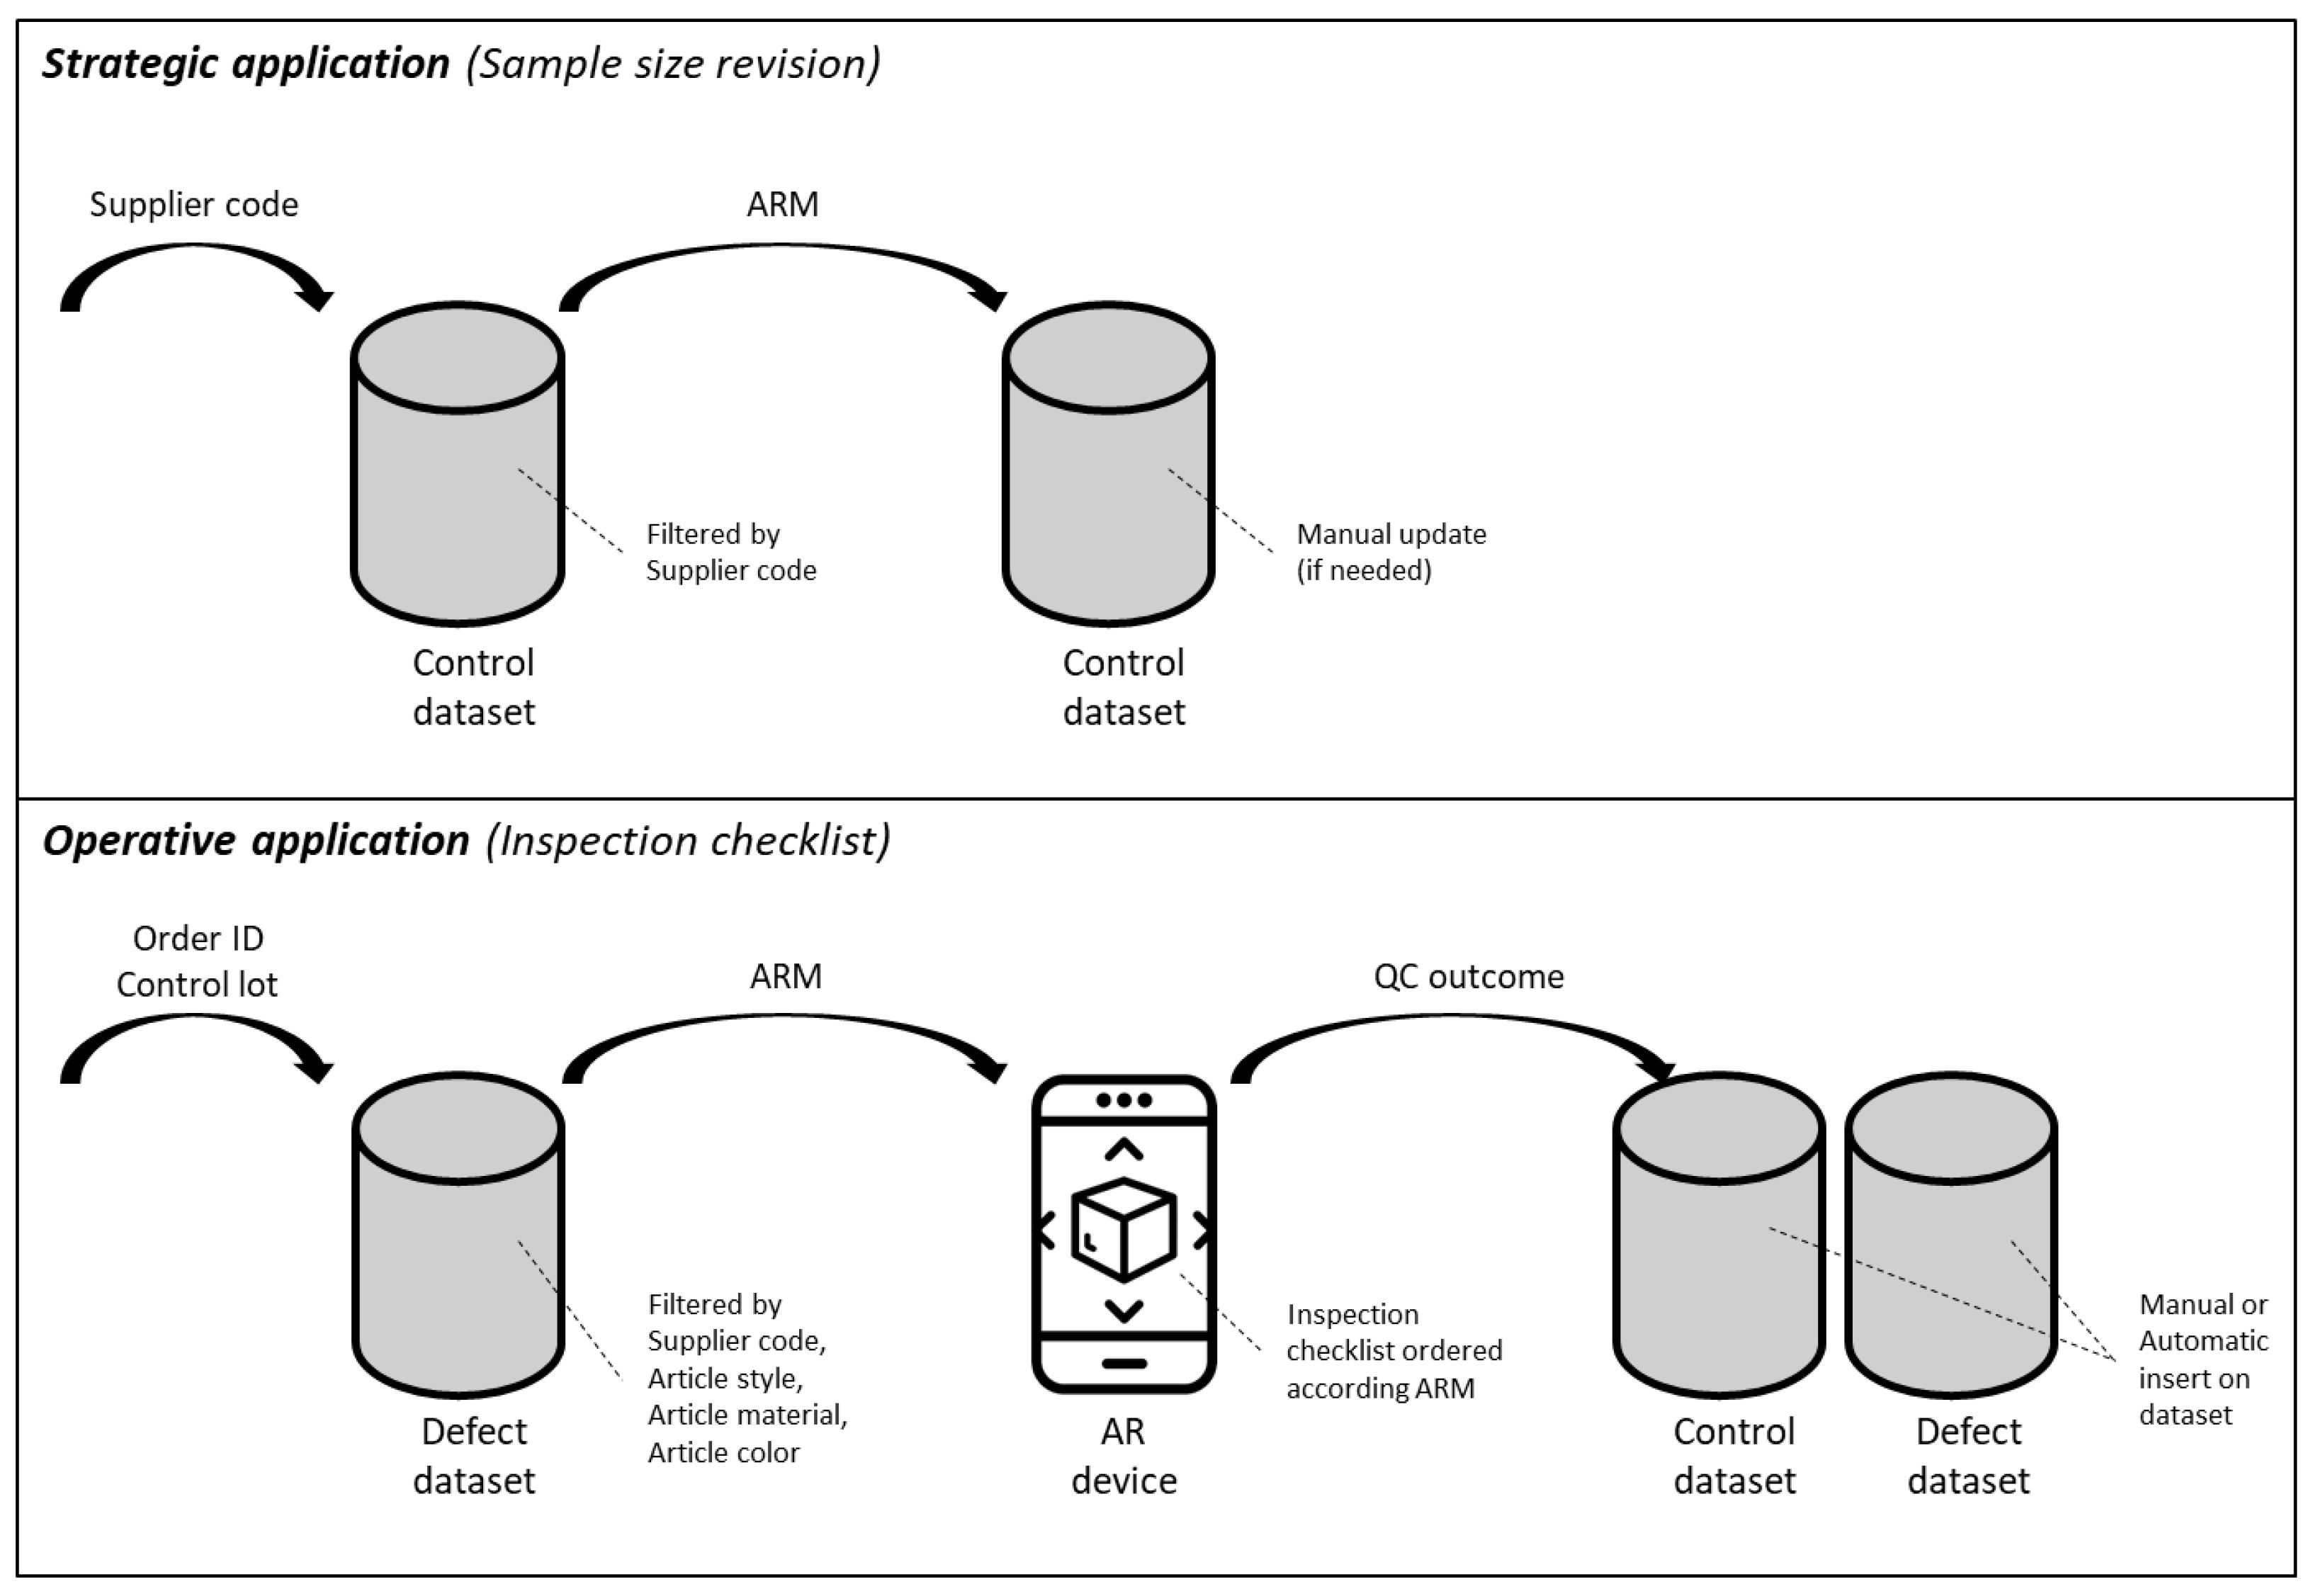
2.3. Dataset Structure and Management

To implement the proposed framework, two datasets need to be managed: one related to the controls to be performed and the other to the collected defect (i.e., Table 1 and Table 2, respectively).
The control dataset lists the outcomes of performed controls (i.e., “Outcome” in Table 1), detailing the main characteristics of the control lot that are its identification string (i.e., “Control lot” in Table 1), the order row to which it belongs (i.e., “Order ID” in Table 1), the article to be checked (i.e., “Article style”, “Article material”, “Article color”, “Article size” in Table 1) and its product category (i.e., “Product category” in Table 1), as well as the supplier who made it (i.e., “Supplier code” in Table 1) and the related sampling rules, defined as a fixed percentage (i.e., “Sample size” in Table 1) of ordered quantity (i.e., “Quantity ordered” in Table 1) resulting in the quantity to be controlled (i.e., “Quantity controlled” in Table 1).
For non-compliant outcomes, the defect dataset is filled with the defects declared by the operator in order to detail the area where it has been identified, the set of controls needed and the type of defect (i.e., “Control area”, “Control set” and “Defect” in Table 2).
The control dataset lists the outcomes of performed controls, detailing the main characteristics of the control lot, which include its identification string, the order row to which it belongs, the article to be checked and its product category, as well as the supplier who made it and the related sampling rules, defined as a fixed percentage of ordered quantity resulting in the quantity to be controlled.
For non-compliant outcomes, the defect dataset is filled with the defects declared by the operator in order to detail the area where it has been identified, the set of controls needed and the type of defect.
According to the proposed framework, Figure 2 resumes the information flow and the dataset involvement during its strategic and operative application.
The acquisition of information as input can be differently performed, according to the real case. For instance, data can be manually inserted or automatically acquired by barcode scanning or image recognition through AR. Similarly, the output can be manually or automatically inserted into the dataset according to the company’s requirements.
In the strategical application of the framework, the supplier code is the information needed to perform the ARM in order to eventually revise the current sample size as output. On the other hand, during the daily inspections, the order reference and the control lot need to be acquired, with the related information about the supplier and the article to be controlled. Once each quality check is performed, its outcome is registered on the dataset.
To clearly visualize the results mined through the association rules and speed up the quality control process, an AR application is foreseen. In addition, it will support the trainees overlaying real products with images of non-compliances to detect. To achieve these results, the application includes a different workflow according to the logged user (i.e., expert or trainee) in order to include additional information only for the ones who really need them. The areas to be controlled are shown on the screen one by one and ordered according to the defect occurrence within, leading the controller to firstly check the most critical parts of the product. This approach is expected to speed up the quality control process because the sooner the controller finds a case of non-compliance, the shorter the overall defect detection time. As the experts are aware of the non-compliance to be checked, only trainees are enabled to scroll the defects per product area, listed from the most to the least occurrent. Both the ordering criteria reflect the association rules mined to make more accurate and faster the defect prediction. In scrolling defects, the most occurrent (i.e., the ones with Conf exceeding the threshold value defined by the company) are highlighted to keep the user’s attention on them, reducing the time needed for their detection.

3. Case Study

3.1. Company Profile

The proposed framework has been applied in the leather goods branch of a fashion company. One of the main challenges for the company is to improve the quality process starting from the huge amount of data collected as an outcome of controls on items made by suppliers. On the one hand, the company believes that the fixed sample size per supplier defined once could not be suitable for all the items made, as product features could positively or negatively influence the control outcomes. For instance, the company’s supervisors state that some materials are easier to process and defects rarely occur, while others show critical issues in the production process that could generate non-compliance. On the other hand, the company believes that speeding up the identification of non-compliance represents an effective way to drastically reduce the time to perform controls, as the sooner a defect is detected, the sooner the control lot is named as “non-compliant”, and the next lot can be checked. To face these challenges, the company agrees that data-driven analysis and clear visualization of up-to-date results represent an effective way to improve the quality process.
The proposed framework has been applied to start from the company’s 1-year outcomes of quality controls, summed up in two datasets structured as previously described: one related to the controls to be performed and the other to the collected defect. In the case study, input data are acquired through barcode scanning, while outputs are automatically inserted through the AR device, as requested by the company itself.

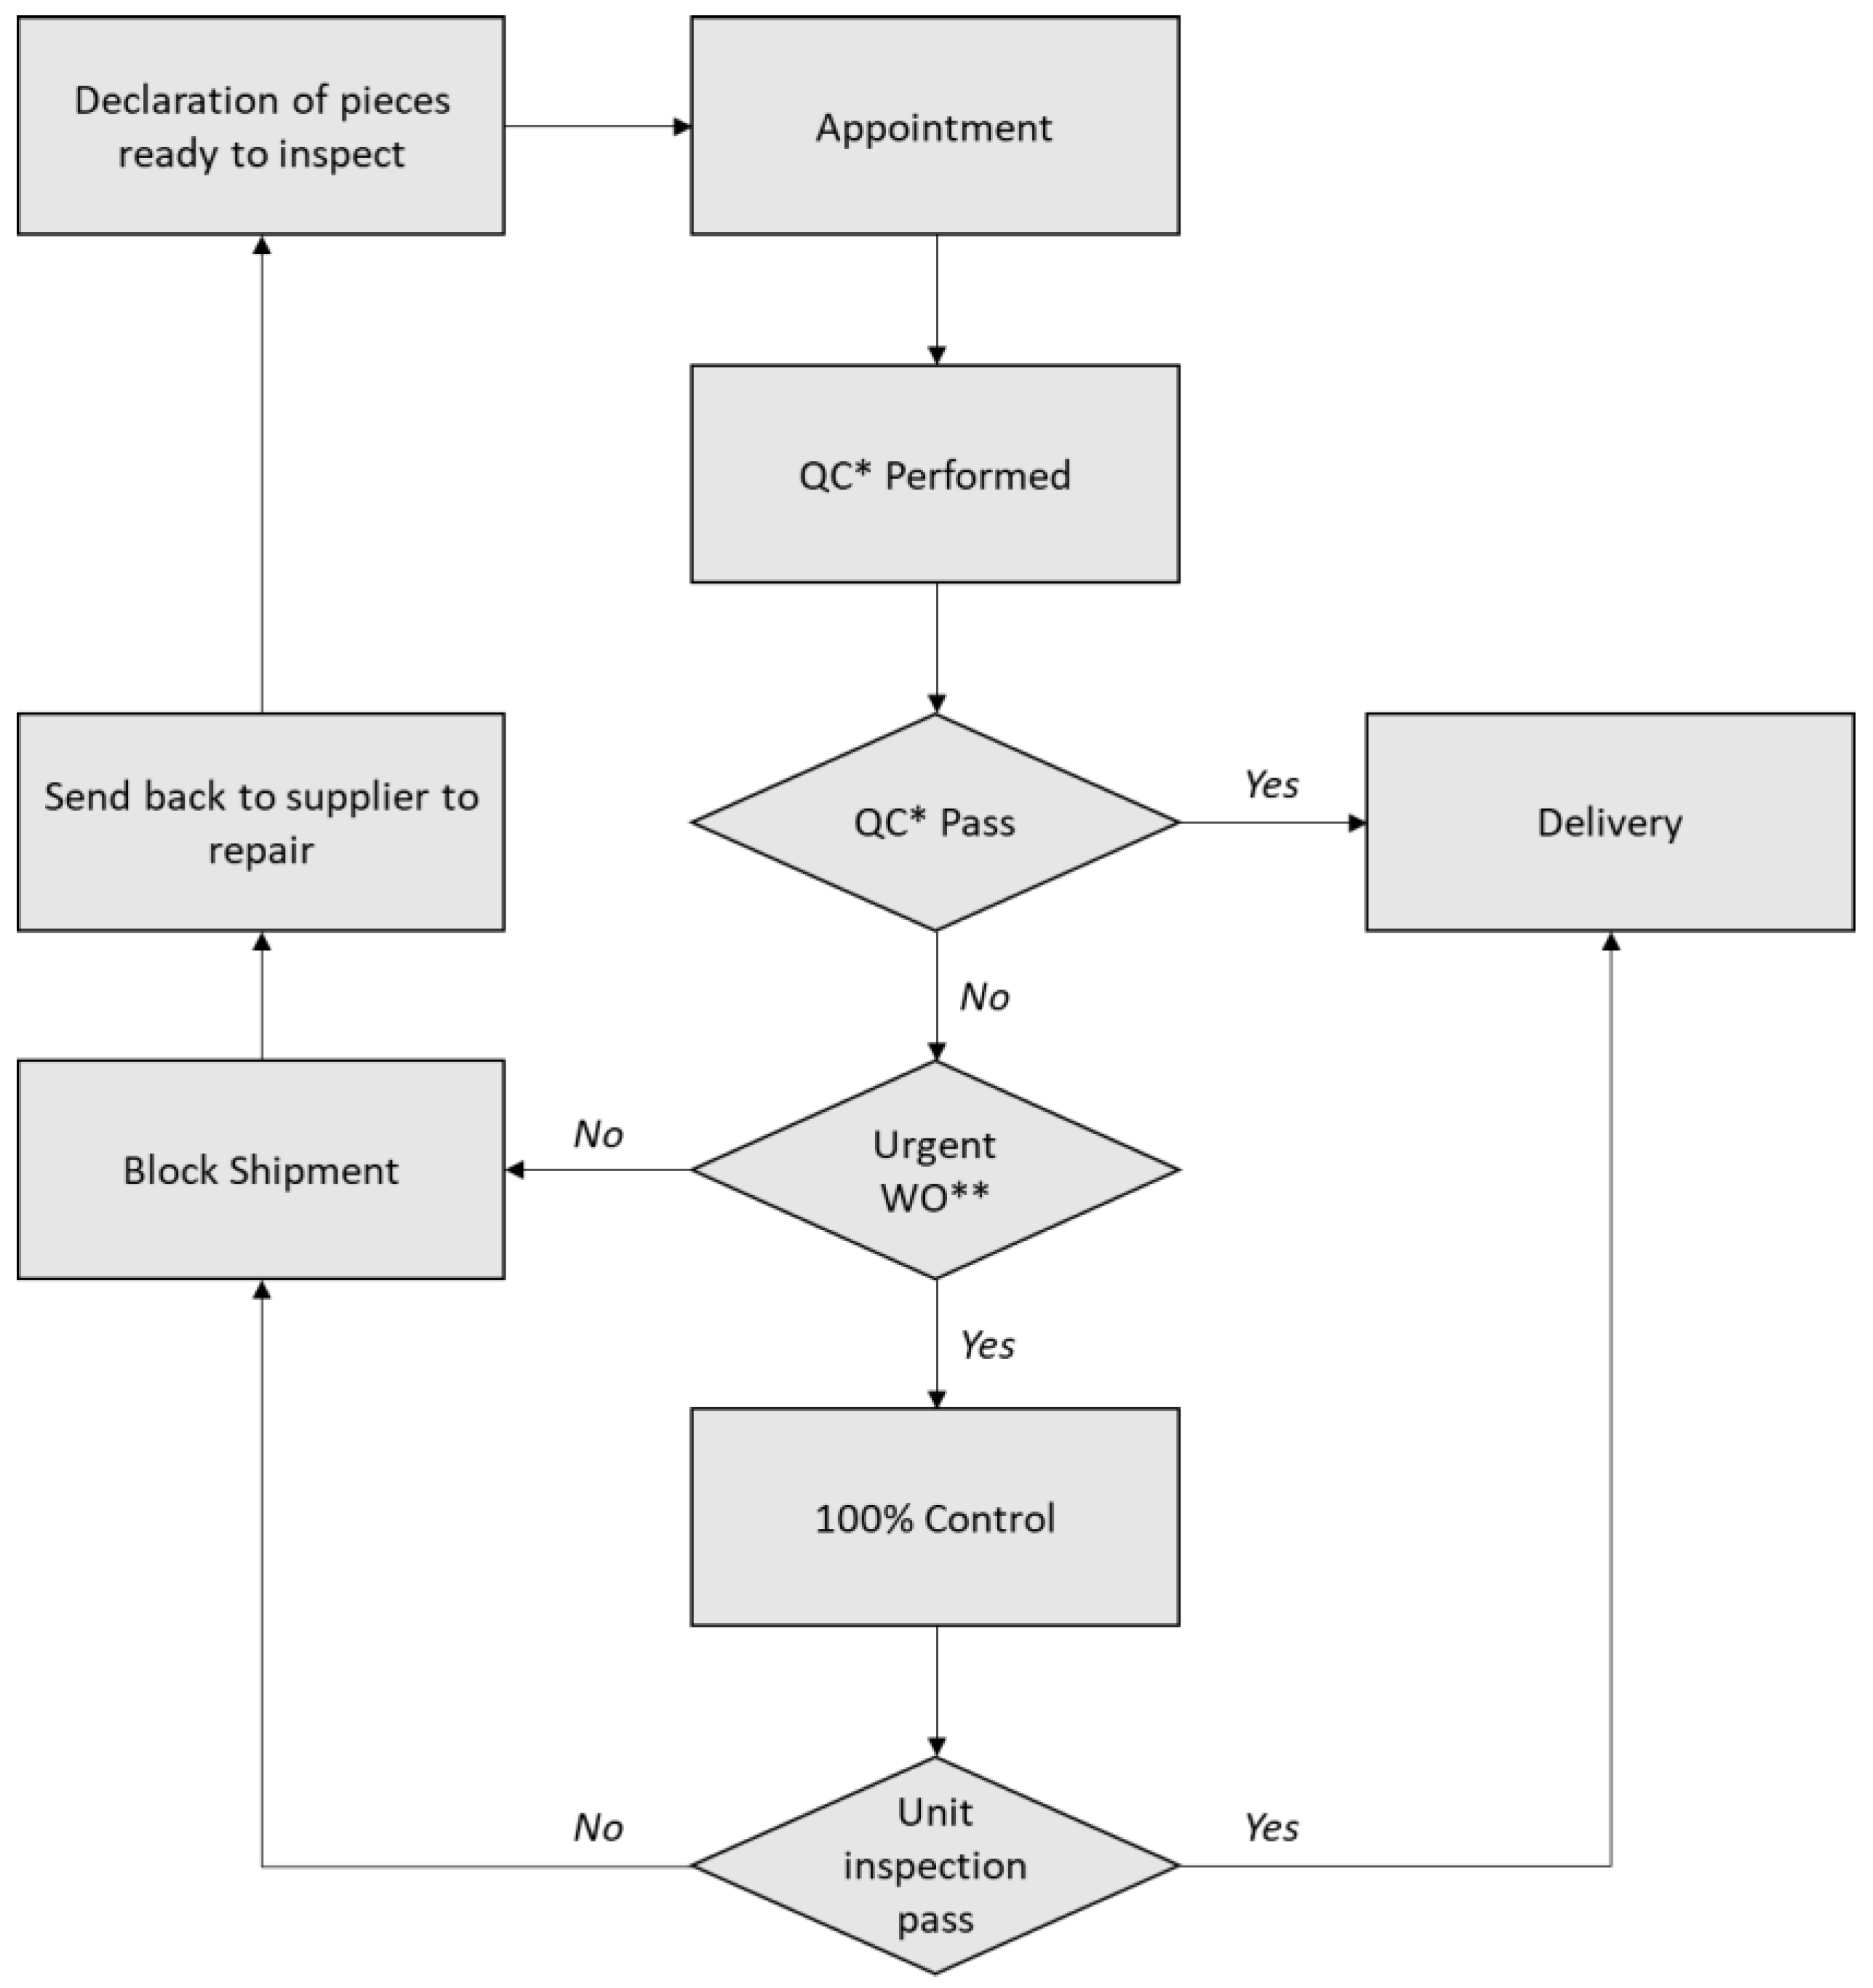
3.2. Quality Control Process

The quality control process managed by the company is summed up in Figure 3. Once suppliers confirm to be ready for the inspection, they arrange an appointment with the company to perform the quality control. The first round of checks results in compliant and non-compliant lots identified according to the sampling rules defined per supplier. Compliant items are delivered to the company site, while the others are sent back to the supplier to be repaired just if they are non-urgent. Rush orders are instead 100% controlled, with a second round of controls that could result in a positive or negative outcome.

4. Results

4.1. Association Rule Mining

4.1.1. Sampling Rules

The first objective pursued through the ARM is the redefinition of the sampling rules, following a data-driven approach. As defined according to the company’s requirement, the ARM for sampling rules is carried out every season, that is, in the fashion industry, the most relevant time partition during the year. However, due to the short amount of time needed to carry out the process, the time window can be shortened in specific cases, e.g., change in supplier production processes or sensible deterioration of performance.
An example of this analysis is proposed with reference to supplier 7: specifically, different sample sizes are applied to evaluate their product: the sample size of 100%, according to the confidence (Conf = 1.000), the supplier always presents reliable outcomes (i.e., the referred association rule is Supplier code = 7, Sample size = 100% -> Outcome = Compliant). According to the statement made at point 1), the ARM is not further detailed due to the excellent performance, and the reduction of the sample size could be taken into consideration. When products are evaluated through a sample size of 15%, the final outcome is “Compliant” in 94.1% of cases (Conf = 0.941)—i.e., the association rule can be expressed as Supplier code = 7, Sample size = 15% -> Outcome = Compliant. Hence, the analysis can be detailed by product category so that specific criticalities related to some product categories can be assessed. Small leather goods and bags product categories are controlled with a sample size of 15% and are compliant in 96.0% and 93.2% of cases, respectively (i.e., the association rules can be reported as Supplier code = 7, Sample size = 15%, Product category = Bags -> Outcome = Compliantconf = 0.932; Supplier code = 7, Sample size = 15%, Product category = Small Leather Goods -> Outcome = Compliantconf = 0.960). There is no substantial imbalance to suggest focusing on one category over another: both rank with good acceptance rates, but neither of them ranks perfectly. Hence, in both cases, more details could be provided.
As an example, the results obtained by adding the material for the bags are provided (Table 3). In the rule in which material 661 appears, the Conf = 0.454 indicates that the lots will have to be rechecked in 45.4% of cases, meaning that the selected sample does not achieve the required quality threshold; also, the batch is urgent. Hence, it needs to be rechecked immediately in order to be delivered at least partially (i.e., only compliant products will be sent to the customer). Products made of materials 118 and 475, instead, present non-compliancy in 14.3% and 25.0% of the samples. They are not urgent; thus, the whole lot can be sent back to the supplier for complete reconditioning. In any case, understanding the root causes of products’ non-compliance can support the adoption of corrective actions aimed at avoiding batches’ rejection. Due to the different distribution of compliant and non-compliant outcomes per article material, different stages of quality controls could be adopted: indeed, when the 15% sample does not achieve the adequate quality level, company policy requires an inspection of the whole lot. If the supplier has historically achieved satisfying performances in the second stage, the 100% percentage could be reduced to 50% or 30% in order to be able not to maintain an adequate control level and a fair duration of the control process.

4.1.2. Defect Identification

As described before, ARM can be used to determine the most likely locations for defects during the quality control phase in order to guide the operator through the inspection. In this case, the dataset used for ARM refers only to defective articles. For example, in the proposed application, rules relating to product category, sample size, article material, supplier code, control area to perform the control set and the defect description have been taken into account. The idea beneath this assumption is to rank the possible locations where a defect could be located based on the historical performance of the supplier on the specific product. The association rules are mined every two weeks using the data updated to find new relationships, allowing a relevant number of new outcomes to be obtained and, thus, producing potentially new relationships.
As an example, let us consider the case of supplier 7, which is controlled with a sample size equal to 15% when article material 118 is delivered (Table 4). The quality controller, according to the rules, will be informed that the first control area to check will be the body, followed by the handles. Indeed, the former has a probability of hosting a defect equal to 60% (conf = 0.600), while the latter of 40% (conf = 0.400).
The following step requires deepening the analysis indicating the control set of activities that should be completed:
Table 5 shows that both cases indicate a single action to take to respond to the identified defect, i.e., Control set = Internal (conf = 100%) and Control set = External (conf = 100%). Usually, the defect is detected by inspecting the internal part of the product and its lining for the body while limiting it to the external part for the handle. More in detail, Table 6 shows the precise type of defects that one should expect during the inspection of the external part of the bag so that the operator has all the information available to support their decision.
As soon as the sample has been completely evaluated, the operator will be allowed to define the outcome, and the dataset will be automatically updated.
In this way, the inspection is sped up in cases of the product’s non-compliance since it is sent back to the producer. In addition, this represents valid support for non-expert operators which are guided through the process.

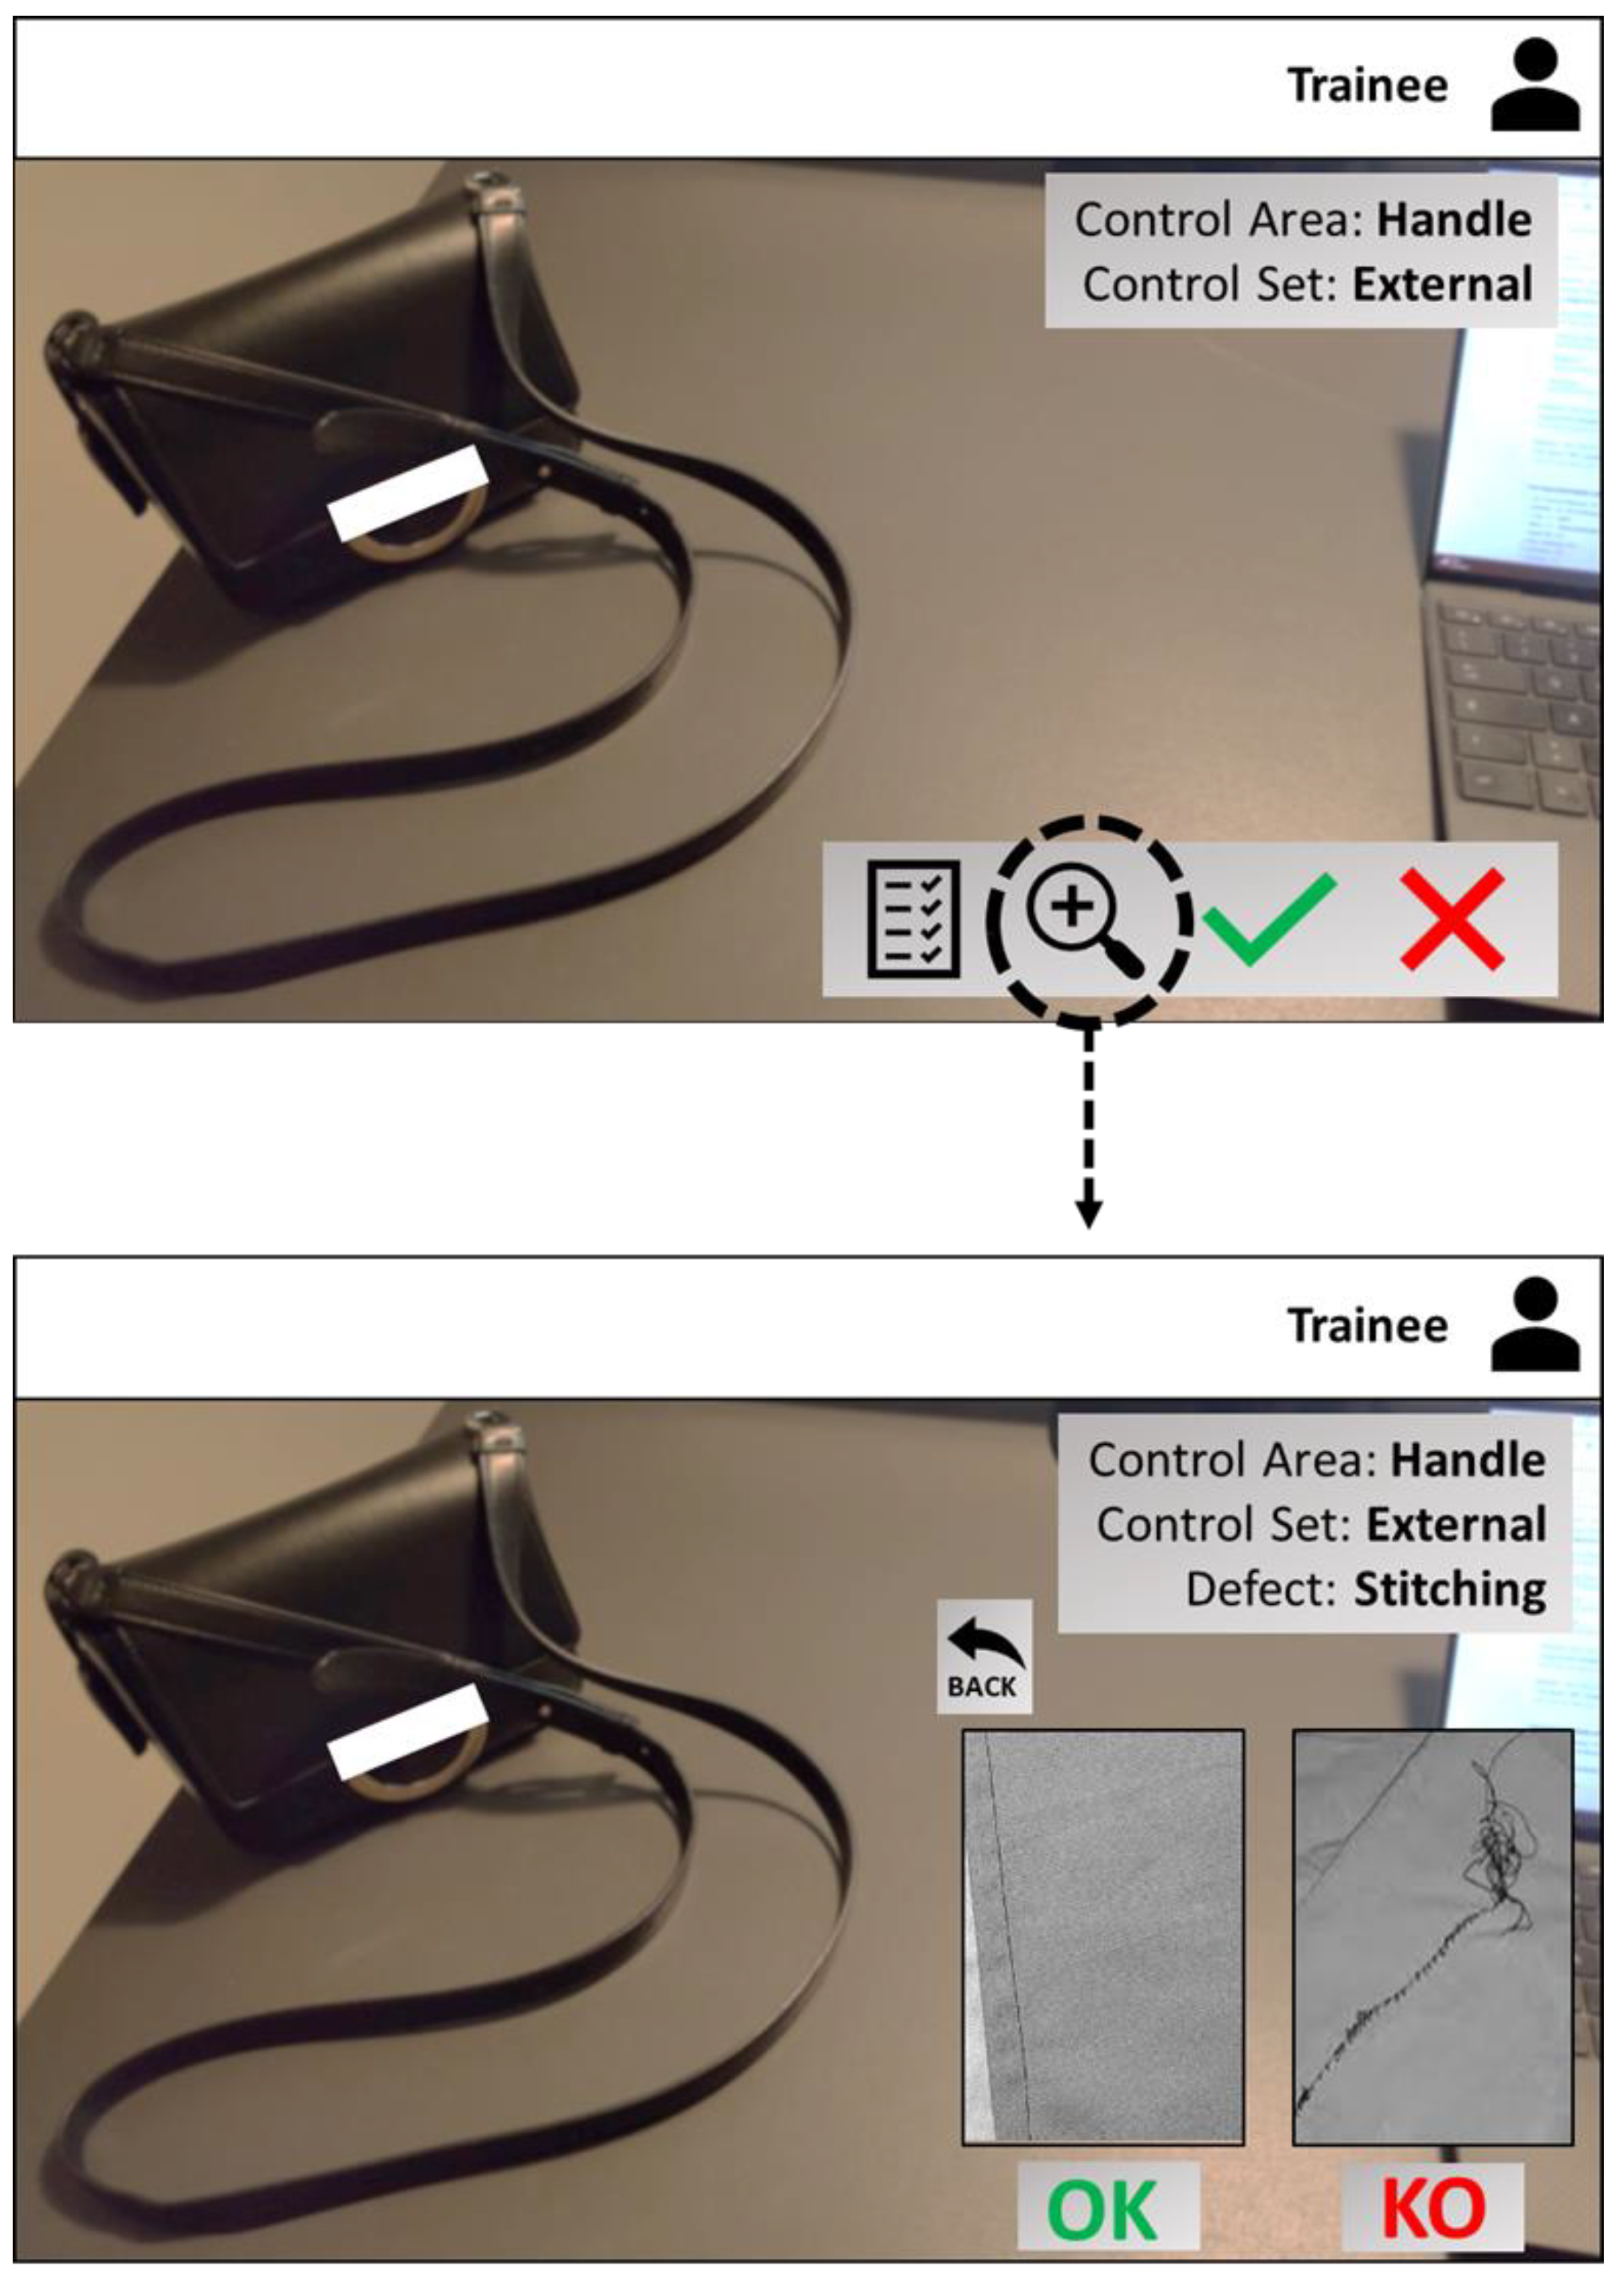
4.2. Augmented Reality Support

As anticipated in the proposed framework, to speed up the quality control process and differently support experts and trainees, AR has been used.
More in detail, both the user types will see, first, the updated sample size for the control order selected. The number of articles from the order requiring quality control, indeed, is defined according to the strategical redefinition of the sampling rules through the ARM. Secondly, the areas to be controlled are shown on the screen one by one and ordered according to the defect occurrence. All controllers can also access the control set description by clicking on the related icon on the screen (i.e., the list icon in Figure 4 and Figure 5).
As shown in Figure 5, each defect is followed by two images as examples of compliance and non-compliance, respectively, in order to get the real product to be checked visually closer to the required quality standard through AR.
According to the company’s requirement, the device used is a commercial tablet with dual cameras, and the data acquisition is made by scanning the barcode with the control lot reference. As it refers to a specific article processed by a supplier, all the information needed to mine the association rules is retrieved from the database, such as the product category and main material. The AR application is based on a web app developed with Xamarin and linked to a LAMP (Linux, Apache, MySQL and PHP) server. Data are acquired from and exported to tables structured as Table 1 and Table 2 and stored in a MySQL database. The device has been installed on a holder, and a marker-based approach has been followed to virtually pin the augmented textual information on the right side, leaving the left side free for the object visualization, as shown in Figure 4 and Figure 5.
The proposed approach has been carried out following a qualitative and a quantitative approach. From a quantitative perspective, the inspection process has been observed, and its duration has been measured. Specifically, the time employed by expert operators has been measured both by carrying out the traditional process and using the AR device in order to observe whether different mean values could be observed. More in detail, the time required to inspect compliant products is collected separately from the duration to inspect non-compliant products. The same comparison is also carried out for non-expert operators. The observations are compared through a t-test at a 95% confidence level in order to assess the differences in the groups’ means. The normalized durations of the quality control procedures carried out without the support of the device are reported in Table 7, while Table 8 details the ones obtained using the AR device.
The comparison between the performances of expert operators did not present a statistically significant difference in the groups’ means: that is, expert operators almost employ the same time in inspecting compliant products both using the device or not (p = 0.740); the same result is obtained in the observation of non-compliant products (p = 0.084). In both cases, the null hypothesis cannot be rejected. Hence, the mean values of the groups compared are almost the same. This aspect is related to the fact that experienced practitioners already have, consciously or unconsciously, an idea of recurring defects and related positions. But, in the case of the introduction of new products, they may be assimilated with inexperienced operators.
Carrying out the same analysis on the measurements taken from non-expert operators, statistically significant differences can be observed both in cases of compliant and non-compliant products. In the former case, the p-value is 0.027, while in the latter, the p-value is 0.046; hence the null hypothesis of mean equality can be rejected. This aspect reflects a consistent reduction in time when the inspection is carried out by non-expert operators: the device ensures valuable support not only in terms of defect understanding, i.e., through the example images, but also in terms of identification rapidity.
The second validation test regards the usability of the proposed device and visual interfaces. Five users have been required to respond anonymously to a questionnaire in order to assess the ease of use of the device, the clearness of the interface and the perception obtained after the use of the device. A filter test has been used to classify the expertise level of the respondent.
The sentences that the respondent have been asked to rate on a five-point Likert scale are reported. Three of them recognized themselves as experts since they declared to have more than a year of experience in the quality control field, while two reported a lesser experience level. Sensible differences can be appreciated from the obtained responses: specifically, the operators having less experience demonstrated a higher appreciation of the device adoption. Expert users, instead, recognized the completeness of the information provided by the device, but they did not find it as a facilitator of their work. The average responses to the questionnaire are summed up in Table 9. However, due to the small sample size, these results can be considered only from a qualitative perspective.

5. Discussion

Within the current industrial scenario, defining appropriate strategies for quality management covers a primary role, aiming to extract useful knowledge from data gathered and analyzed. For this reason, as presented in previous chapters, historical data are analyzed through a data-driven approach aiming at a twofold objective. On the one hand, ARM is used to discuss the appropriateness of the sampling rules currently in use in the company in order to identify whether improvement actions can be taken to modify them. For instance, sample size can be reduced for well-performing suppliers, while further actions are needed to identify the origin and locations of defects. The latter issue refers to the second application of the proposed approach. Indeed, ARM is also used to relate product features (i.e., supplier code, sample size, article material, product category) to the most likely locations for defects. Furthermore, these results are provided as input for the quality controller in order to identify the defects in a timely manner, speed up the inspections and, additionally, support less trained operators. That is, the outcomes of the association rules mined for defect identification are displayed on AR devices provided to each quality controller.
Since the identifying relationships between different attributes in a dataset should be done rapidly and intuitively, the ARM has been selected as a formalism [30].
Considering the theoretical contributions already existing in the literature, ARM application is still limited in the fashion industry; they mainly refer to defect predictions and have not already been applied to enhance the sampling process nor to guide the inspection process. The ability to modify the sampling rules can represent a competitive advantage from a managerial perspective since it provides valuable support between the need for elevated quality levels and short lead times typical of the fast-changing and dynamic industries. Systematic implementation of the proposed framework within the operating context ensures that decisions are made based on up-to-date data, encouraging suppliers to meet quality requirements with a view to reducing sampling rates.
The case study demonstrates that the implementation of ARM is successful in investigating how product parameters lead to non-compliances, as already shown in [14,15,16]. However, this information is only used in the literature to support decision-makers instead of operators during quality control. In the current application, this issue is overcome through AR, which allows clear visualization of data analysis results [17].
From a practical perspective, the quality controllers are supported in deploying their tasks considering the mental load reduction, i.e., they are guided step by step by the information provided by the AR devices, with no need to remember the procedures and to look for them in manuals. Information is received automatically, with no need to look for them, avoiding unnecessary time losses. In addition, inserting the outcome of the inspection directly on the AR device ensures that the dataset remains up-to-date, avoiding not only information losses due to the transfer of information previously noted on paper but also a lag in the data entry process.
Evidence from the case study, indeed, confirmed the effectiveness of the proposed framework in terms of shortening quality control time by providing only the necessary information displayed through AR, in particular for trainees, as stated by Zheng et al. [23] and Chiang et al. [27]. The earlier detection of quality issues is also enabled by the framework, in accordance with the results shown by Cachada et al. [20].
As presented before, suppliers have been thoroughly evaluated both at a strategic and operational level. The strategic perspective can be recognized in analyzing suppliers’ performance in terms of batch acceptance or rejection and adapting the sample size accordingly. In this perspective, the limitations brought by the sole reference to international standards are overcome by personalizing the approach on the basis of the specific companies. From an operational point of view, instead, using ARM results and visualizing them through AR devices supports the operators in their daily activities, ensuring a smoother and faster production flow. Indeed, focusing primarily on the most likely areas in which defects could lay on a statistical basis ensures that the probability of finding a defect and, thus, rejecting the product is higher, making the inspection faster. Even though this aspect is already present in expert operators’ mindset, that is not true for the non-expert ones, who need more guidance in fulfilling the necessary inspections in order not to miss any defect or spot to be controlled.
Being aware of the more common defects brings a further positive consequence: indeed, recurrent defects can be highlighted to the related supplier, suggesting the introduction of improvement actions in their production process in order to reduce their occurrence.

6. Conclusions

The implementation of Industry 4.0 tools enables the collection of huge amounts of data that can be capitalized in areas like quality management. However, the need to balance short lead times and elevate quality levels requires the adoption of appropriate approaches that should be integrated into companies’ best practices, focusing on data analysis and visualization. On the one hand, ARM allows us to easily manipulate the huge amounts of unstructured data regularly collected on-field. On the other hand, AR provides intuitive ways of presenting data to operators, supporting them in making informed decisions in a timely manner. Even if these techniques have been widely used to support decision-makers, there is a lack of joint contributions in the quality field. Moreover, few solutions based on those technologies are being explored within low-tech dynamic sectors.
To this end, in this paper, an approach to improve data analysis and visualization through the use of ARM and AR has been proposed. The innovation introduced by the present study is, therefore, not in the two techniques but rather in their joint application to a specific sector like the fashion industry.
The introduction of the proposed approach is beneficial for what concerns strategic and operational aspects. The former aspect is taken into account through systematic monitoring of suppliers’ performance, which leads to a redefinition of the sample sizes on the basis of the specific outcomes achieved, paving the way to the introduction of incentives for high-performer suppliers. The latter, instead, is achieved by providing direct support to the operators during their activities and their training. The proposed approach ensures a clearer view of the whole quality management process and allows more precise time and resource management.
The applicability of the proposed approach has been verified through a case study, providing AR devices to expert and non-expert (or trainees) operators and letting them experience the adoption of the proposed technology in their daily activities. In order to formalize their perception, a qualitative and quantitative analysis has been carried out. Results show that, from a qualitative point of view, both categories consider the introduction of the framework as beneficial and helpful. From a quantitative perspective, instead, only for the non-expert operators has a statistically significant improvement in the duration of the inspection process been noticed. This aspect is related to the fact that trainees are guided in quickly identifying the location of the most likely defects and are given a structured procedure to carry out the inspection.
The main limitation of the proposed application is related to the use of a device, e.g., a smartphone or tablet, that needs to be held by the operator. Future research direction will involve the development of the AR application for smart glasses in order to further facilitate the activities that will be able to be performed completely hands-free.

Author Contributions

Conceptualization, V.F., S.A., R.B. and F.E.C.; methodology, V.F. and S.A.; software V.F. and S.A.; validation, V.F., S.A., R.B. and F.E.C.; writing—original draft preparation V.F. and S.A; writing—review and editing, V.F., S.A., R.B. and F.E.C.; visualization V.F. and S.A.; supervision R.B. and F.E.C. All authors have read and agreed to the published version of the manuscript.

Funding

This research received no external funding.

Institutional Review Board Statement

Not applicable.

Informed Consent Statement

Informed consent was obtained from all subjects involved in the study.

Data Availability Statement

Not applicable.

Conflicts of Interest

The authors declare no conflict of interest.

References

  1. Alcácer, V.; Cruz-Machado, V. Scanning the Industry 4.0: A Literature Review on Technologies for Manufacturing Systems. Eng. Sci. Technol. Int. J. 2019, 22, 899–919. [Google Scholar] [CrossRef]
  2. Naqvi, R.; Soomro, T.R.; Alzoubi, H.M.; Ghazal, T.M.; Alshurideh, M.T. The Nexus Between Big Data and Decision-Making: A Study of Big Data Techniques and Technologies. In Proceedings of the International Conference on Artificial Intelligence and Computer Vision (AICV2021); Hassanien, A.E., Haqiq, A., Tonellato, P.J., Bellatreche, L., Goundar, S., Azar, A.T., Sabir, E., Bouzidi, D., Eds.; Springer International Publishing: Cham, Switzerland, 2021; pp. 838–853. [Google Scholar]
  3. UNI ISO. Procedimenti di Campionamento Nell’ispezione per Attributi-Parte 1: Schemi di Campionamento Indicizzati Secondo il Limite di Qualità Accettabile (AQL) Nelle Ispezioni Lotto per lotto. Available online: https://store.uni.com/p/UNII285901-2007/uni-iso-2859-12007-11390/UNII285901-2007_EEN (accessed on 27 December 2022).
  4. Rivera-Gómez, H.; Gharbi, A.; Kenné, J.-P.; Montaño-Arango, O.; Corona-Armenta, J.R. Joint optimization of production and maintenance strategies considering a dynamic sampling strategy for a deteriorating system. Comput. Ind. Eng. 2020, 140, 106273. [Google Scholar] [CrossRef]
  5. Hajej, Z.; Rezg, N.; Gharbi, A. Joint production preventive maintenance and dynamic inspection for a degrading manufacturing system. Int. J. Adv. Manuf. Technol. 2021, 112, 221–239. [Google Scholar] [CrossRef]
  6. Samohyl, R.W. Acceptance sampling for attributes via hypothesis testing and the hypergeometric distribution. J. Ind. Eng. Int. 2018, 14, 395–414. [Google Scholar] [CrossRef]
  7. Bindi, B.; Bandinelli, R.; Fani, V.; Pero, M.E.P. Supply chain strategy in the luxury fashion industry: Impacts on performance indicators. Int. J. Product. Perform. Manag. 2021; ahead-of-print. [Google Scholar] [CrossRef]
  8. Antomarioni, S.; Lucantoni, L.; Ciarapica, F.E.; Bevilacqua, M. Data-driven decision support system for managing item allocation in an ASRS: A framework development and a case study. Expert Syst. Appl. 2021, 185, 115622. [Google Scholar] [CrossRef]
  9. Ur-Rahman, N.; Harding, J.A. Textual data mining for industrial knowledge management and text classification: A business oriented approach. Expert Syst. Appl. 2012, 39, 4729–4739. [Google Scholar] [CrossRef]
  10. Fani, V.; Antomarioni, S.; Bandinelli, R.; Bevilacqua, M. Data-driven decision support tool for production planning: A framework combining association rules and simulation. Comput. Ind. 2023, 144, 103800. [Google Scholar] [CrossRef]
  11. Kotu, V.; Deshpande, B. Data Science-Concepts and Practice, 2nd ed.; Morgan Kaufmann: Burlington, MA, USA, 2018; ISBN 978-0-12-814761-0. Available online: https://www.elsevier.com/books/data-science/kotu/978-0-12-814761-0 (accessed on 27 December 2022).
  12. Antomarioni, S.; Bevilacqua, M.; Potena, D.; Diamantini, C. Defining a data-driven maintenance policy: An application to an oil refinery plant. Int. J. Qual. Reliab. Manag. 2018, 36, 77–97. [Google Scholar] [CrossRef]
  13. Grabot, B. Rule mining in maintenance: Analysing large knowledge bases. Comput. Ind. Eng. 2020, 139, 105501. [Google Scholar] [CrossRef]
  14. Yildirim, P.; Birant, D.; Alpyildiz, T. Data mining and machine learning in textile industry. WIREs Data Min. Knowl. Discov. 2018, 8, e1228. [Google Scholar] [CrossRef]
  15. Lee, C.K.H.; Ho, G.T.S.; Choy, K.L.; Pang, G.K.H. A RFID-based recursive process mining system for quality assurance in the garment industry. Int. J. Prod. Res. 2014, 52, 4216–4238. [Google Scholar] [CrossRef]
  16. Lee, C.K.H.; Choy, K.L.; Ho, G.T.S.; Chin, K.S.; Law, K.M.Y.; Tse, Y.K. A hybrid OLAP-association rule mining based quality management system for extracting defect patterns in the garment industry. Expert Syst. Appl. 2013, 40, 2435–2446. [Google Scholar] [CrossRef]
  17. Govender, D.; Moodley, J.; Balmahoon, R. Augmented and Mixed Reality based Decision Support Tool for the Integrated Resource Plan. In Proceedings of the IECON 2021–47th Annual Conference of the IEEE Industrial Electronics Society, Toronto, ON, Canada, 13–16 October 2021; IEEE: Toronto, ON, Canada, 2021; pp. 1–6. [Google Scholar]
  18. Drath, R.; Horch, A. Industrie 4.0: Hit or Hype? [Industry Forum]. IEEE Ind. Electron. Mag. 2014, 8, 56–58. [Google Scholar] [CrossRef]
  19. Marques, B.; Santos, B.S.; Araujo, T.; Martins, N.C.; Alves, J.B.; Dias, P. Situated Visualization in The Decision Process Through Augmented Reality. In Proceedings of the 2019 23rd International Conference Information Visualisation (IV), Paris, France, 2–5 July 2019; IEEE: Paris, France, 2019; pp. 13–18. [Google Scholar]
  20. Cachada, A.; Barbosa, J.; Leitno, P.; Gcraldcs, C.A.S.; Deusdado, L.; Costa, J.; Teixeira, C.; Teixeira, J.; Moreira, A.H.J.; Moreira, P.M.; et al. Maintenance 4.0: Intelligent and Predictive Maintenance System Architecture; IEEE: Piscatvie, NJ, USA, 2018; Volume 1, pp. 139–146. [Google Scholar]
  21. Martins, N.C.; Marques, B.; Alves, J.; Araújo, T.; Dias, P.; Santos, B.S. Augmented reality situated visualization in decision-making. Multimed. Tools Appl. 2022, 81, 14749–14772. [Google Scholar] [CrossRef]
  22. Karlsson, I.; Bernedixen, J.; Ng, A.H.C.; Pehrsson, L. Combining Augmented Reality and Simulation-Based Optimization for Decision Support in Manufacturing; IEEE: Piscatvie, NJ, USA, 2017; Volume 1, pp. 3988–3999. [Google Scholar]
  23. Zheng, M.; Pan, X.; Bermeo, N.V.; Thomas, R.J.; Coyle, D.; O’hare, G.M.P.; Campbell, A.G. STARE: Augmented Reality Data Visualization for Explainable Decision Support in Smart Environments. IEEE Access 2022, 10, 29543–29557. [Google Scholar] [CrossRef]
  24. Egbert, L.; Quandt, M.; Thoben, K.-D.; Freitag, M. Mobile AR-Based Assistance Systems for Order Picking–Methodical Decision Support in the Early Phases of the Product Life Cycle. In Subject-Oriented Business Process Management. The Digital Workplace–Nucleus of Transformation; Freitag, M., Kinra, A., Kotzab, H., Kreowski, H.-J., Thoben, K.-D., Eds.; Communications in Computer and Information Science; Springer International Publishing: Cham, Switzerland, 2020; Volume 1278, pp. 74–87. ISBN 978-3-030-64350-8. [Google Scholar]
  25. Mirshokraei, M.; De Gaetani, C.I.; Migliaccio, F. A Web-Based BIM–AR Quality Management System for Structural Elements. Appl. Sci. 2019, 9, 3984. [Google Scholar] [CrossRef]
  26. Yavuz Erkek, M.; Erkek, S.; Jamei, E.; Seyedmahmoudian, M.; Stojcevski, A.; Horan, B. Augmented Reality Visualization of Modal Analysis Using the Finite Element Method. Appl. Sci. 2021, 11, 1310. [Google Scholar] [CrossRef]
  27. Chiang, F.-K.; Shang, X.; Qiao, L. Augmented reality in vocational training: A systematic review of research and applications. Comput. Hum. Behav. 2022, 129, 107125. [Google Scholar] [CrossRef]
  28. Buddhakulsomsiri, J.; Siradeghyan, Y.; Zakarian, A.; Li, X. Association rule-generation algorithm for mining automotive warranty data. Int. J. Prod. Res. 2006, 44, 2749–2770. [Google Scholar] [CrossRef]
  29. Han, J.; Cheng, H.; Xin, D.; Yan, X. Frequent pattern mining: Current status and future directions. Data Min. Knowl. Discov. 2007. [Google Scholar] [CrossRef]
  30. Crespo Márquez, A.; de la Fuente Carmona, A.; Antomarioni, S. A Process to Implement an Artificial Neural Network and Association Rules Techniques to Improve Asset Performance and Energy Efficiency. Energies 2019, 12, 3454. [Google Scholar] [CrossRef]
Figure 1. Framework of the proposed research approach.
Applsci 13 02317 g001
Figure 2. Information flow for the framework strategic and operative application.
Applsci 13 02317 g002
Figure 3. Quality control process for the analyzed company (* QC = Quality Control, ** WO = Work Order).
Applsci 13 02317 g003
Figure 4. Expert view per Control area, Control set (grey areas display the overlayed suggestions).
Applsci 13 02317 g004
Figure 5. Trainee view per control area, control set, and defect (grey areas display the overlayed suggestions).
Applsci 13 02317 g005
Table 1. Control dataset structure.
Dataset ColumnData TypeExample
Order IDInt20210124101
Control lotStringABCD-2021-01241-A
Supplier codeInt1
Product categoryStringBags
Article styleInt1233456
Article materialString1
Article colorNumber1000
Article sizeStringU
Quantity orderedInt24
Quantity controlledInt8
Sample sizeInt15
Control roundInt1
OutcomeStringTo be re-checked
Table 2. Defect dataset structure.
Dataset ColumnData TypeExample
Order IDInt20210124101
Control lotStringABCD-2021-01241-A
Supplier codeInt1
Product categoryStringBags
Article styleInt1233456
Article materialString1
Article colorNumber1000
Article sizeStringU
Sample sizeInt15
Control roundInt1
OutcomeStringTo be re-checked
Control areaStringBody
Control setStringInternal
DefectStringStitching
Table 3. Association rules relating to supplier code, sample size, product category, article material, and outcome.
XYSuppConf
Supplier code = 7, Sample size = 15%, Product category = Bags,
Article material = 118
Outcome =
Non-compliant
<0.0010.143
Supplier code = 7, Sample size = 15%, Product category = Bags
Article material = 118
Outcome = Compliant<0.0010.857
Supplier code = 7, Sample size = 15%, Product category = Bags
Article material = 475
Outcome =
Non-compliant
<0.0010.250
Supplier code = 7, Sample size = 15%, Product category = Bags
Article material = 475
Outcome = Compliant<0.0010.750
Supplier code = 7, Sample size = 15%, Product category = Bags
Article material = 661
Outcome =
To be rechecked
<0.0010.454
Supplier code = 7, Sample size = 15%, Product category = Bags
Article material = 661
Outcome = Compliant<0.0010.545
Table 4. Examples of the rules in the form of supplier code, sample size, product category, article material, and control area.
XYSuppConf
Product category = Bags, Sample size = 15%, Supplier code = 7, Article material = 118Control area = Body<0.0010.600
Product category = Bags, Sample size = 15%, Supplier code = 7, Article material = 118Control area = Handle<0.0010.400
Table 5. Examples of the rules in the form of supplier code, sample size, product category, article material, control area, and control set.
XYSuppConf
Product category = Bags, Sample size = 15%, Supplier code = 7, Article material = 118, Control area = BodyControl set = Internal<0.0011.000
Product category = Bags, Sample size = 15%, Supplier code = 7, Article material = 118, Control area = HandleControl set = External<0.0011.000
Table 6. Examples of the rules in the form of supplier code, sample size, product category, article material, control area, control set, and defect.
XYSuppConf
Product category = Bags, Sample size = 15%, Supplier code = 7, Article material = 118,
Control area = Handle, Control set = External
Defect = Stitching<0.0010.544
Product category = Bags, Sample size = 15%, Supplier code = 7, Article material = 118,
Control area = Handle, Control set = External
Defect = Glueing<0.0010.356
Product category = Bags, Sample size = 15%, Supplier code = 7, Article material = 118,
Control area = Handle, Control set = External
Defect = Buckle<0.0010.100
Table 7. Normalized duration of the quality control procedure made by expert and non-expert operators without AR devices, differentiating by compliant (OK) and non-compliant (KO) products.
No Device
ExpertNon-Expert
Time for OK ProductsTime for KO ProductsTime for OK ProductsTime for KO Products
0.100.501.000.64
1.000.251.000.73
0.411.000.170.82
0.720.750.330.36
0.870.750.330.64
0.920.500.000.18
0.520.001.000.73
0.860.000.170.00
0.650.750.501.00
0.310.250.170.55
0.000.250.330.36
0.220.751.000.55
0.930.250.830.73
0.730.750.170.09
0.641.001.000.45
0.040.000.500.64
0.300.500.670.91
0.890.250.500.45
0.430.400.170.36
0.650.400.000.00
Table 8. Normalized duration of the quality control procedure made by expert and non-expert operators with AR devices, differentiating by compliant (OK) and non-compliant (KO) products.
Device
ExpertNon-Expert
Time for OK ProductsTime for KO ProductsTime for OK ProductsTime for KO Products
0.281.000.000.26
0.830.000.670.11
0.241.000.170.44
0.001.000.000.00
0.910.670.330.26
0.190.330.000.00
1.000.001.000.44
0.200.330.170.78
0.090.330.000.33
0.130.330.170.00
0.331.000.000.44
0.060.000.170.38
0.550.330.830.78
0.561.000.170.00
0.340.000.330.38
0.421.000.500.26
0.820.330.330.00
0.240.670.001.00
0.480.000.170.45
0.010.000.000.11
Table 9. Average responses to the questionnaire based on a five-point Likert scale.
SentencesAvg for
Expert
Operators
Avg for
Non-Expert
Operators
The use of the device was complicated [1]/easy [5]1.334.50
The use of the device is not pleasing [1]/pleasing [5]1.675.00
I felt slower [1]/faster in performing my task using the device2.675.00
Using the device was obstructive [1]/supportive [5] of my work3.004.00
I felt demotivated [1]/motivated [5] in using the device3.005.00
The interface was confusing [1]/clear [5]3.333.50
The information displayed was not helpful [1]/helpful [5]4.674.00
Disclaimer/Publisher’s Note: The statements, opinions and data contained in all publications are solely those of the individual author(s) and contributor(s) and not of MDPI and/or the editor(s). MDPI and/or the editor(s) disclaim responsibility for any injury to people or property resulting from any ideas, methods, instructions or products referred to in the content.

